Article

Simulation and Experiment of the Smoothness Performance of an Electric Four-Wheeled Chassis in Hilly and Mountainous Areas

School of Machinery & Electronics, Sichuan Agricultural University, Ya’an 625014, China
*
Author to whom correspondence should be addressed.
Sustainability 2023, 15(24), 16868; https://doi.org/10.3390/su152416868
Submission received: 20 October 2023 / Revised: 7 December 2023 / Accepted: 7 December 2023 / Published: 15 December 2023
(This article belongs to the Special Issue Sustainable Technology in Agricultural Engineering)

Abstract

:
This paper addresses the issues caused by traditional tractors during seeding operations, such as soil compaction, decreased soil fertility, use of unclean fuel leading to environmental pollution, and the disruption of sustainable development. In response, the study designs a compact and lightweight electric four-wheel-drive chassis for a seeding robot suitable for strip planting of soybeans and corn. Using RecurDyn(V9R2) software and MATLAB/Simulink(2020a) modules, the paper conducts simulation and analysis of the straight-line driving process of the electric four-wheel-drive chassis on hilly terrain in field conditions. The simulation results demonstrate that when the suspension stiffness is 14.4 kN/m and the damping is 900 N·s/m, the chassis achieves optimal vibration reduction and straight-line driving performance. Experimental results based on the simulation findings indicate a high consistency between the simulation and actual models, confirming that optimizing the suspension damping parameters effectively improves chassis smoothness and enhances operational quality.

1. Introduction

In most hilly areas of China, traditional tractors are commonly used for planting operations. These traditional tractors, due to their substantial weight, exert tremendous pressure on the soil during fieldwork, leading to soil compaction. This compaction negatively impacts the physical and chemical properties of farmland soil and its biological ecosystem. Mechanical compaction also compromises the soil’s resistance to erosion [1], not only diminishing soil fertility but also affecting crop growth and yield. Moreover, China’s hilly regions experience high levels of rainfall, and compacted soil is prone to generating surface runoff during rainfall, reducing the soil’s water-holding capacity. Additionally, traditional tractors run on diesel fuel, with large engine displacement and emissions, contributing to air pollution. China’s hilly regions are characterized by steep slopes, small land plots, and irregular distribution [2], making them unsuitable for traditional large- and medium-sized machinery operations due to prolonged use of traditional tractors. In light of these challenges, this paper introduces the design of a planting machine chassis suitable for strip intercropping of soybeans and corn. This chassis employs electric four-wheel drive and is well-suited for efficient operations in hilly terrains, as its lightweight structure reduces soil disturbance caused by mechanical compaction during operations. The chassis uses electric power, offering a cleaner energy source that reduces carbon emissions and energy costs. This paper primarily focuses on the analysis of the smoothness performance of an electric four-wheel-drive chassis in hilly terrain and the optimization of the chassis suspension’s damping parameters. The objective is to enhance the operational quality of the chassis, contributing to the sustainable development of agriculture in hilly regions.
The parameters that primarily affect the smoothness performance of the chassis include suspension damping, stiffness, suspension shape, tire characteristics, chassis weight distribution, chassis rigidity, road conditions, and driving conditions [3,4,5]. In this study, remote control is employed under the condition of not considering the driver’s driving behavior. Chassis stiffness, weight distribution, suspension shape, and tire characteristics have been selected based on the operating environment in hilly areas. Through the optimization of suspension damping and stiffness, the smoothness of the chassis is enhanced. Excessive vibration can impact tire traction, increase the vertical bounce of the chassis, leading to a decrease in straight-line driving performance and a reduction in field operation quality. Prolonged exposure to adverse vibrations can also exacerbate component damage [6].
RecurDyn is an efficient multibody dynamics simulation software known for its fast solving speed and accurate results. It is widely used in chassis dynamics research. In this study, we employed the MATLAB/Simulink module for solving. Its key advantages lie in its intuitive solving process, straightforward modeling, and convenient result visualization [7,8]. Scholars like Tan Guoqing [9], Lü Xiaoxiao [10], and Zhang Qian [11] have used this software to conduct simulation analyses of the dynamic vibration characteristics and travel trajectories of wheeled and tracked chassis. They validated the accuracy of their models and proposed corresponding optimization solutions.
In recent years, both domestic and international research has yielded numerous achievements in the field of small-wheeled robot chassis. Examples include the intelligent agricultural robot BoniRob [12] developed by Germany’s Amazonen-Werke company, the outdoor operating wheeled robot chassis SEEKUR by the U.S.-based Mobile Robots company [13], and an agricultural wheeled robot designed by China Agricultural University [14]. The aforementioned studies have mostly focused on researching the steering performance of their chassis, rather than delving into the dynamic vibration characteristics of the chassis. Therefore, the chassis in these studies have not achieved optimal driving characteristics. Scholars such as Sun, Zhang, Rafael, and others have conducted ride comfort analyses on wheeled chassis. In their analyses, they established the kinematic model of the chassis but did not take into consideration its dynamic ride comfort. Furthermore, the simulated road surfaces were not representative of field conditions [15,16,17].
This paper focuses on the dynamic simulation of the straight-line driving process of an electric four-wheel-drive planting robot chassis that the author designed. Using RecurDyn software and MATLAB/Simulink modules, the study analyzes the chassis’ behavior under field excitation conditions in terms of different chassis suspension stiffness and damping configurations. Optimal chassis suspension dynamics parameters, resulting in improved damping effectiveness and straight-line driving performance, are selected. Experimental results based on the simulation outcomes show a high level of consistency between the simulated model and the real-world model. This demonstrates that adopting the optimized suspension damping parameters effectively enhances smoothness, improves chassis operational quality, and promotes the sustainable development of agriculture in hilly regions.

2. Materials and Methods

At present, there is little research on the smoothness of the chassis for field applications. Investigating the dynamic ride comfort of the chassis of seeding robots is of great significance for ensuring driving accuracy, extending the chassis lifespan, and improving the quality of seeding operations. In this study, a simulation of the ride comfort of the seeding robot chassis was conducted by establishing field road surface excitations. The corresponding ride comfort indicators were analyzed, confirming that the chassis design meets ride comfort standards and satisfies the requirements for seeding agronomy. Finally, an analysis of the influence of changes in chassis dynamic parameters on ride comfort was conducted, leading to the optimization of suspension parameters in this study. The overall research process is illustrated in Figure 1 below.

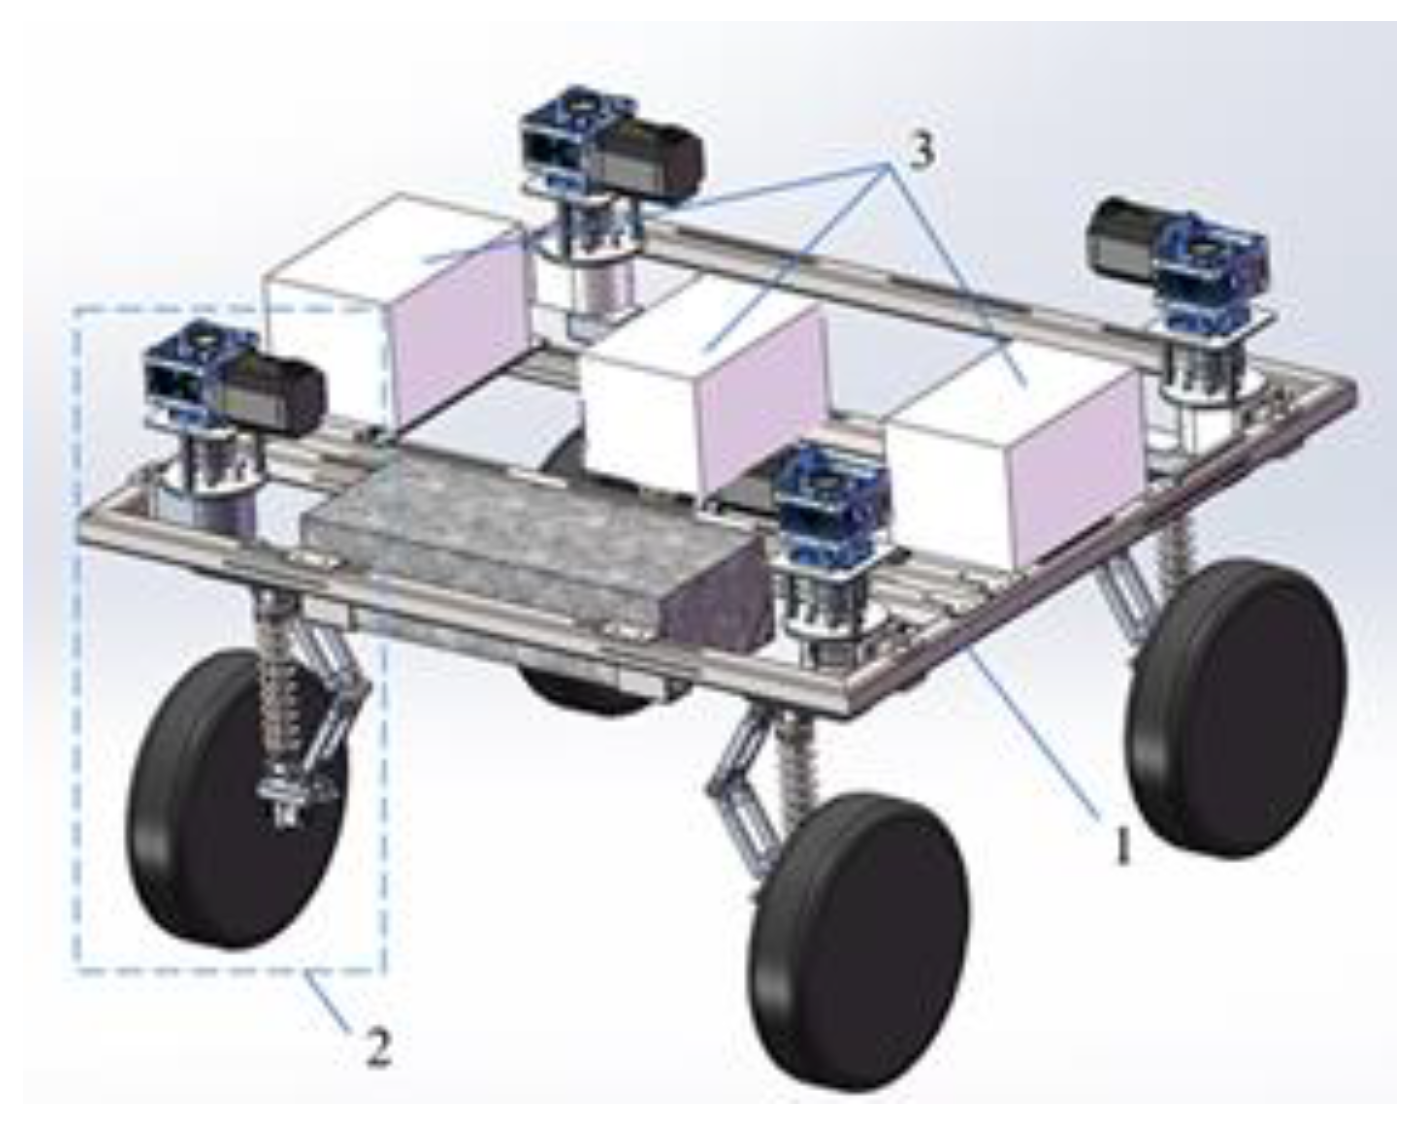
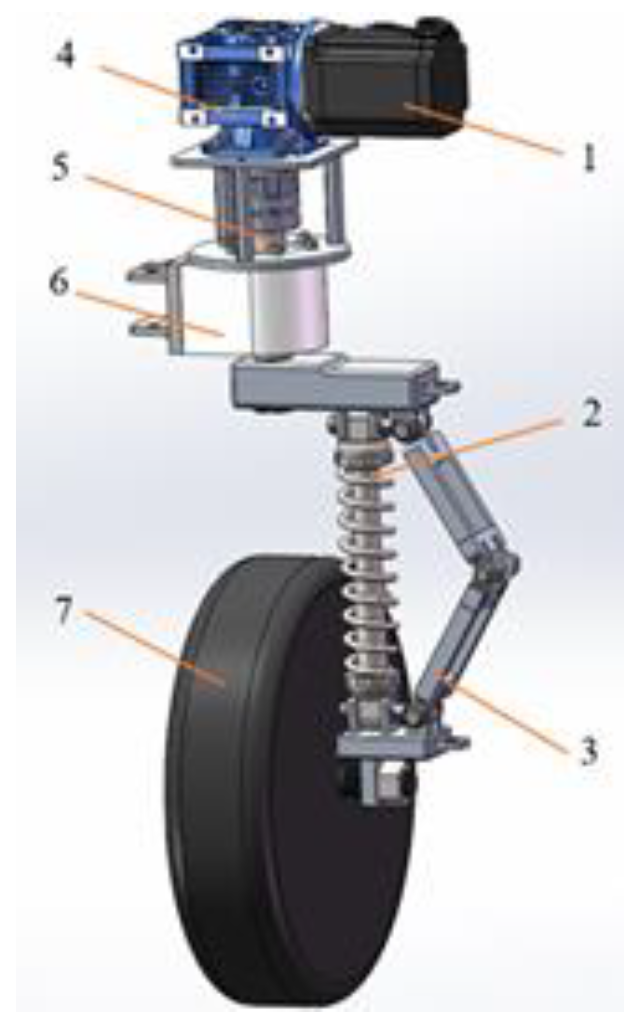
2.1. Structure and Working Principle of the Four-Wheel Robot

The chassis of the seeding robot consists of the modular wheel section, chassis frame, seeding apparatus, and other working components. Four identical sets of modular wheels are installed symmetrically on the chassis frame, with hub motors serving as the driving mechanism for the wheels. When the chassis is in motion, all four sets of modular wheels can generate driving torque. The chassis is designed for strip composite planting of soybeans and corn. Considering a row spacing of 400 mm for strip composite planting of soybeans and corn, with three rows planted simultaneously, the seeding components are installed at the center of gravity position of the chassis. Due to the complexity of the actual seeding components compared to other upper components of the chassis, and since this complexity does not affect the dynamic simulation of the chassis, the model quality of this part is represented by a simplified model. The entire chassis model was created using Solidworks(2020) software and imported into RecurDyn. After integrating the mass of chassis components, the simulation virtual model of the chassis was established. The three-dimensional model of the entire chassis is shown in Figure 2, including modular wheels that integrate driving, steering, and damping, the chassis frame, seeding apparatus, and other working components. The parameters of the chassis are listed in Table 1.
The modular wheel is an integrated assembly mechanism that combines driving, steering, braking, and damping functions. Compared to traditional chassis with centralized drive systems, it significantly reduces the internal space usage within the chassis. Additionally, the distributed drive of each wheel in the modular wheel system provides high controllability over wheel speed and torque, enabling precise control. The components and mechanisms included in the modular wheel are illustrated in Figure 3, comprising wheel-hub motors for driving, steering axles and steering motors for steering, reducers, supporting damping mechanisms, auxiliary supporting mechanisms, and other connecting components. During operation, the four wheel-hub motors and four steering motors are individually connected to a 36 V DC power supply. For straight-line motion, the microcontroller outputs PWM signals to drive the wheel-hub motors. During steering, the microcontroller outputs a quantified number of PWM pulses to drive the steering motors to rotate the corresponding angles based on the steering angle. Simultaneously, it adjusts the speeds of the four wheel-hub motors according to the same but oppositely directed steering angles of the front and rear wheels [18].

2.2. Establishing a Simulation Model

2.2.1. Creating Model Constraints

Since this study primarily focuses on simulating straight-line movement of the chassis, certain constraints have been applied to ensure the accuracy of the simulation model. The steering drive portion and the steering axis on the upper part of the modular wheels have been integrated with the chassis frame as fixed constraints. The suspension and damping components on the lower part of the modular wheels, including the side ‘V’-shaped auxiliary support components and spring-damping dampers, have been connected with hinge joints at both ends of the frame and internally. The mounting holes of the spring-damping dampers and the auxiliary support components are oriented at a 90-degree angle to allow for articulated installation, and both components undergo extension and contraction movements during damping. Consequently, rotational and translational constraints have been applied. In this study, the chassis wheels are equipped with hub motor wheels capable of propulsion, so a driving constraint has been applied. The motion constraints between the suspension and wheels in each set of modular wheels are illustrated in Figure 4.

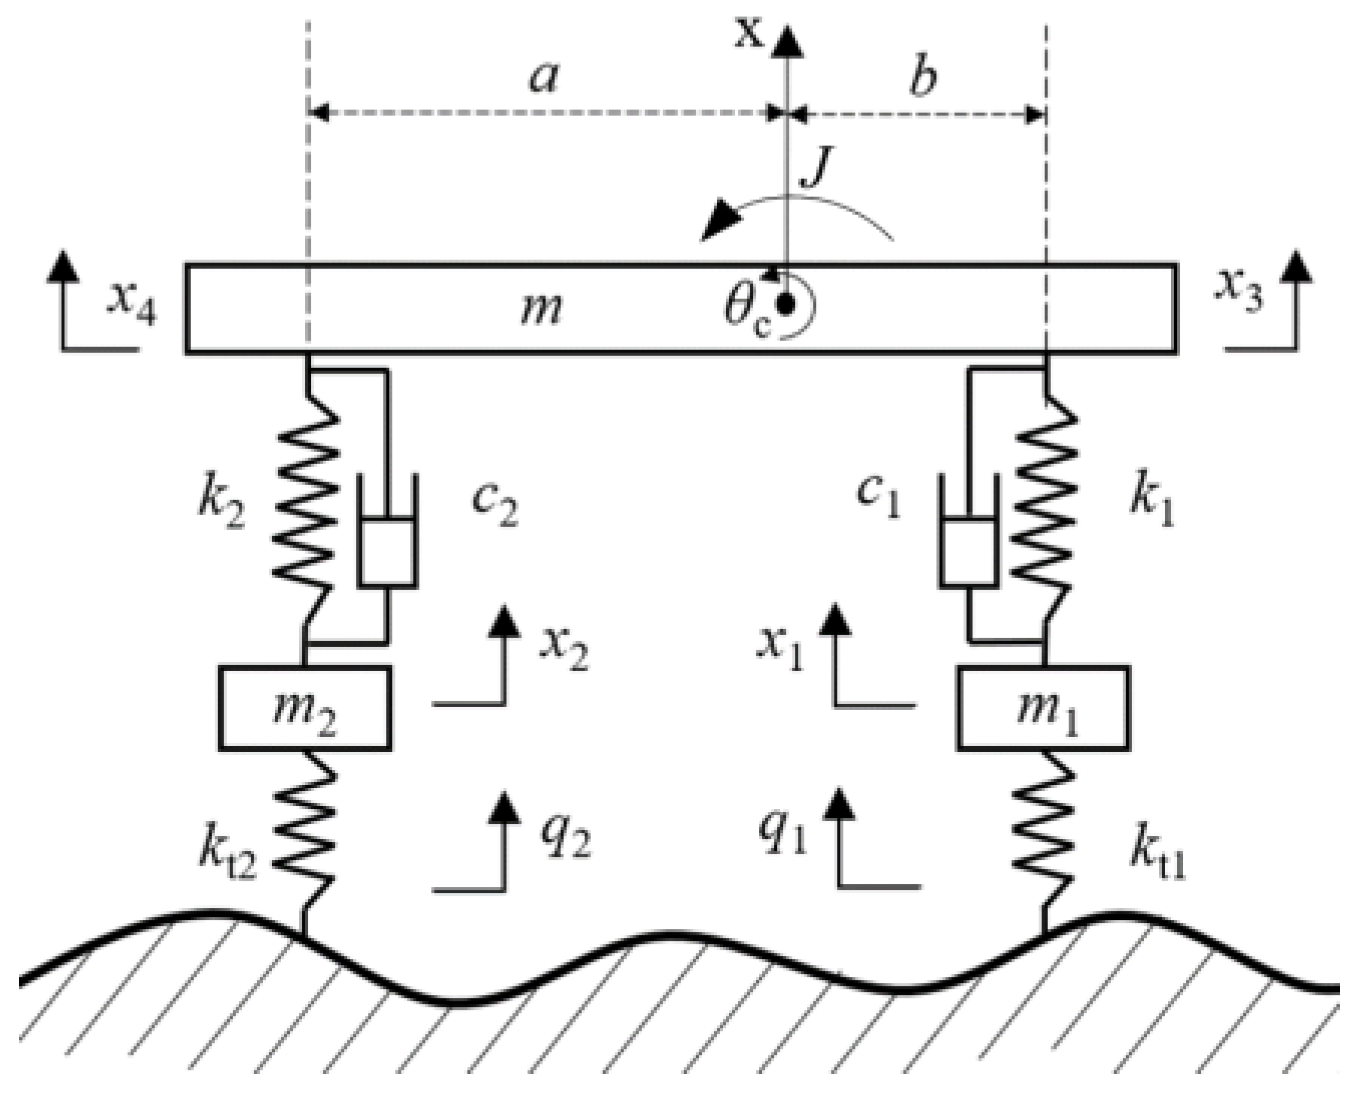
2.2.2. Establishing a Four-Degrees-of-Freedom Half-Car Vibration Model

The four-degrees-of-freedom half-car model can represent changes in the chassis’ center-of-mass acceleration, vertical displacement, pitch angular acceleration, and angular velocity around its center-of-mass axis. Therefore, its simulation results are reasonably representative [19]. To ensure the rigor and effectiveness of the model’s establishment, the following assumptions are made before developing the four-degrees-of-freedom half-car vibration model [20]:
  • The chassis is symmetrical with respect to the longitudinal vertical plane passing through its center of mass, and only vertical direction vibration and longitudinal angular vibration are considered.
  • The tire damping is small enough to be neglected.
  • The forces exerted by each elastic element are linearly related to relative displacement, and the forces of each damper are linearly related to relative velocity.
  • The excitation position of the road surface on the tires of the seeding robot chassis always remains at the contact point between the wheel center and the road surface.
  • The seeding robot chassis is moving at a constant velocity in a straight line.
  • The effect of air resistance on the seeding robot chassis can be ignored.
Based on the above assumptions, the four-degrees-of-freedom 1/2 vibration model of the seeding robot chassis is established as shown in Figure 5. Preliminary damping coefficients and spring stiffness of adjustable spring-damping dampers are selected as 900 N·s/m and 18 kN/m, respectively, based on the chassis mass and travel speed of the seeding robot, with a damping coefficient adjustable range of 600 N·s/m to 1200 N·s/m. The dynamic parameters of the seeding robot chassis vibration model are defined as shown in Table 2.
Using the Lagrange method for the vibration model shown in Figure 3, we obtain the following representation of the four-degrees-of-freedom vibration model in the form of differential equations:
k x + c x ˙ + m x ¨ = k t q
The quality matrix, displacement matrix, damping matrix, road excitation matrix, system stiffness matrix, and tire stiffness matrix in the above expressions are as follows:
m = diag m 1 m 2 m J
x = x 1 x 2 x θ T
c = c 1 0 c 1 b c 1 0 c 2 c 2 a c 2 c 1 c 2 c 1 + c 2 a c 2 b c 1 b c 1 a c 2 a c 2 b c 1 b 2 c 1 + a 2 c 2
q = q 1 q 2 T
k = k 1 + k t 1 0 k 1 b k 1 0 k t 2 + k 2 k 2 a k 2 k 1 k 2 k 1 + k 2 a k 2 b k 1 b k 1 a k 2 a k 2 b k 1 a 2 k 2 + b 2 k 1
k t = k t 1 0 0 k t 2 0 0 0 0
The input to the four-degrees-of-freedom vibration system is the road excitation shown in Equation (5). Therefore, the state-space vector Z of the system is as follows:
Z = z 1 z 2 z 3 z 4 z 5 z 6 z 7 z 8 T = [ x 1 x 2 x θ x ˙ 1 x ˙ 2 x ˙ θ ˙ c ]
Z ˙ = z ˙ 1 z ˙ 2 z ˙ 3 z ˙ 4 z ˙ 5 z ˙ 6 z ˙ 7 z ˙ 8 T = x ˙ 1 x ˙ 2 x ˙   θ ˙   x ¨ 1 x ¨ 2 x ¨   θ ¨ c
The system’s output vector Y is as follows:
Y = [ y 1 y 2 y 3 y 4 y 5 y 6 y 7 y 8 ] T = x ¨ 1 x ¨ 2 x ¨   θ ¨ c x 1 q 1 x 3 x 1 x 2 q 2 x 4 x 2 T
In Equation (10), x1q1 and x2q2 represent the total vertical displacements of the front and rear axle tires, and x3x1 and x4x2 represent the dynamic deflections of the front and rear chassis suspensions. Under the condition of a small chassis pitch angle, x3 and x4 satisfy the following relationship:
x 3 = x + b tan θ c x + b θ c x 4 = x a tan θ c x a θ c
Thus, Equation (10) can be expressed as:
Y = x ¨ 1 x ¨ 2 x ¨   θ ¨ c x 1 q 1 x + b θ c x 1 x 2 q 2 x a θ c x 2
By using the above Equations (5) and (8)–(10), the state equation and output equation system can be derived as follows:
Z ˙ = A Z + B q Y = C Z + D q
In Equation (13), A, B, C, and D are coefficient matrices, which are as follows:
A = [ 0 0 0 0 1 0 0 0 0 0 0 0 0 1 0 0 0 0 0 0 0 0 1 0 0 0 0 0 0 0 0 1 k 1 + k t 1 m 1 0 k 1 m 1 b k 1 m 1 c 1 m 1 0 c 1 m 1 b c 1 m 1 0 k 2 + k t 2 m 2 k 2 m 2 a k 2 m 2 0 c 2 m 2 c 2 m 2 a c 2 m 2 k 1 m k 2 m k 1 + k 2 m a k 2 b k 1 m c 1 m c 2 m c 1 + c 2 m a c 2 b c 1 m b k 1 J a k 2 J a k 2 b k 1 J a 2 k 2 + b 2 k 1 J b c 1 J a c 1 J a c 2 b c 1 J a 2 c 2 + b 2 c 1 J ]
B = 0 0 0 0 0 k t 2 m 2 0 0 0 0 0 0 k t 1 m 1 0 0 0 T
C = [ k t 1 + k 1 m 1 0 k 1 m 1 b k 1 m 1 c 1 m 1 0 c 1 m 1 b c 1 m 1 0 k t 2 + k 2 m 2 k 2 m 2 a k 2 m 2 0 c 2 m 2 c 2 m 2 a c 2 m 2 k 1 m k 2 m k 1 + k 2 m a k 2 b k 1 m c 1 m c 2 m c 1 + c 2 m a c 2 b c 1 m b k 1 J a k 2 J a k 2 b k 1 J a 2 k 2 + b 2 k 1 J b c 1 J a c 2 J a c 2 b c 1 J a 2 c 2 + b 2 c 1 J 1 0 0 0 0 0 0 0 1 0 1 b 0 0 0 0 0 1 0 0 0 0 0 0 0 1 1 a 0 0 0 0 ]
D = 0 k t 2 m 2 0 0 0 0 1 0 k t 1 m 1 0 0 0 1 0 0 0

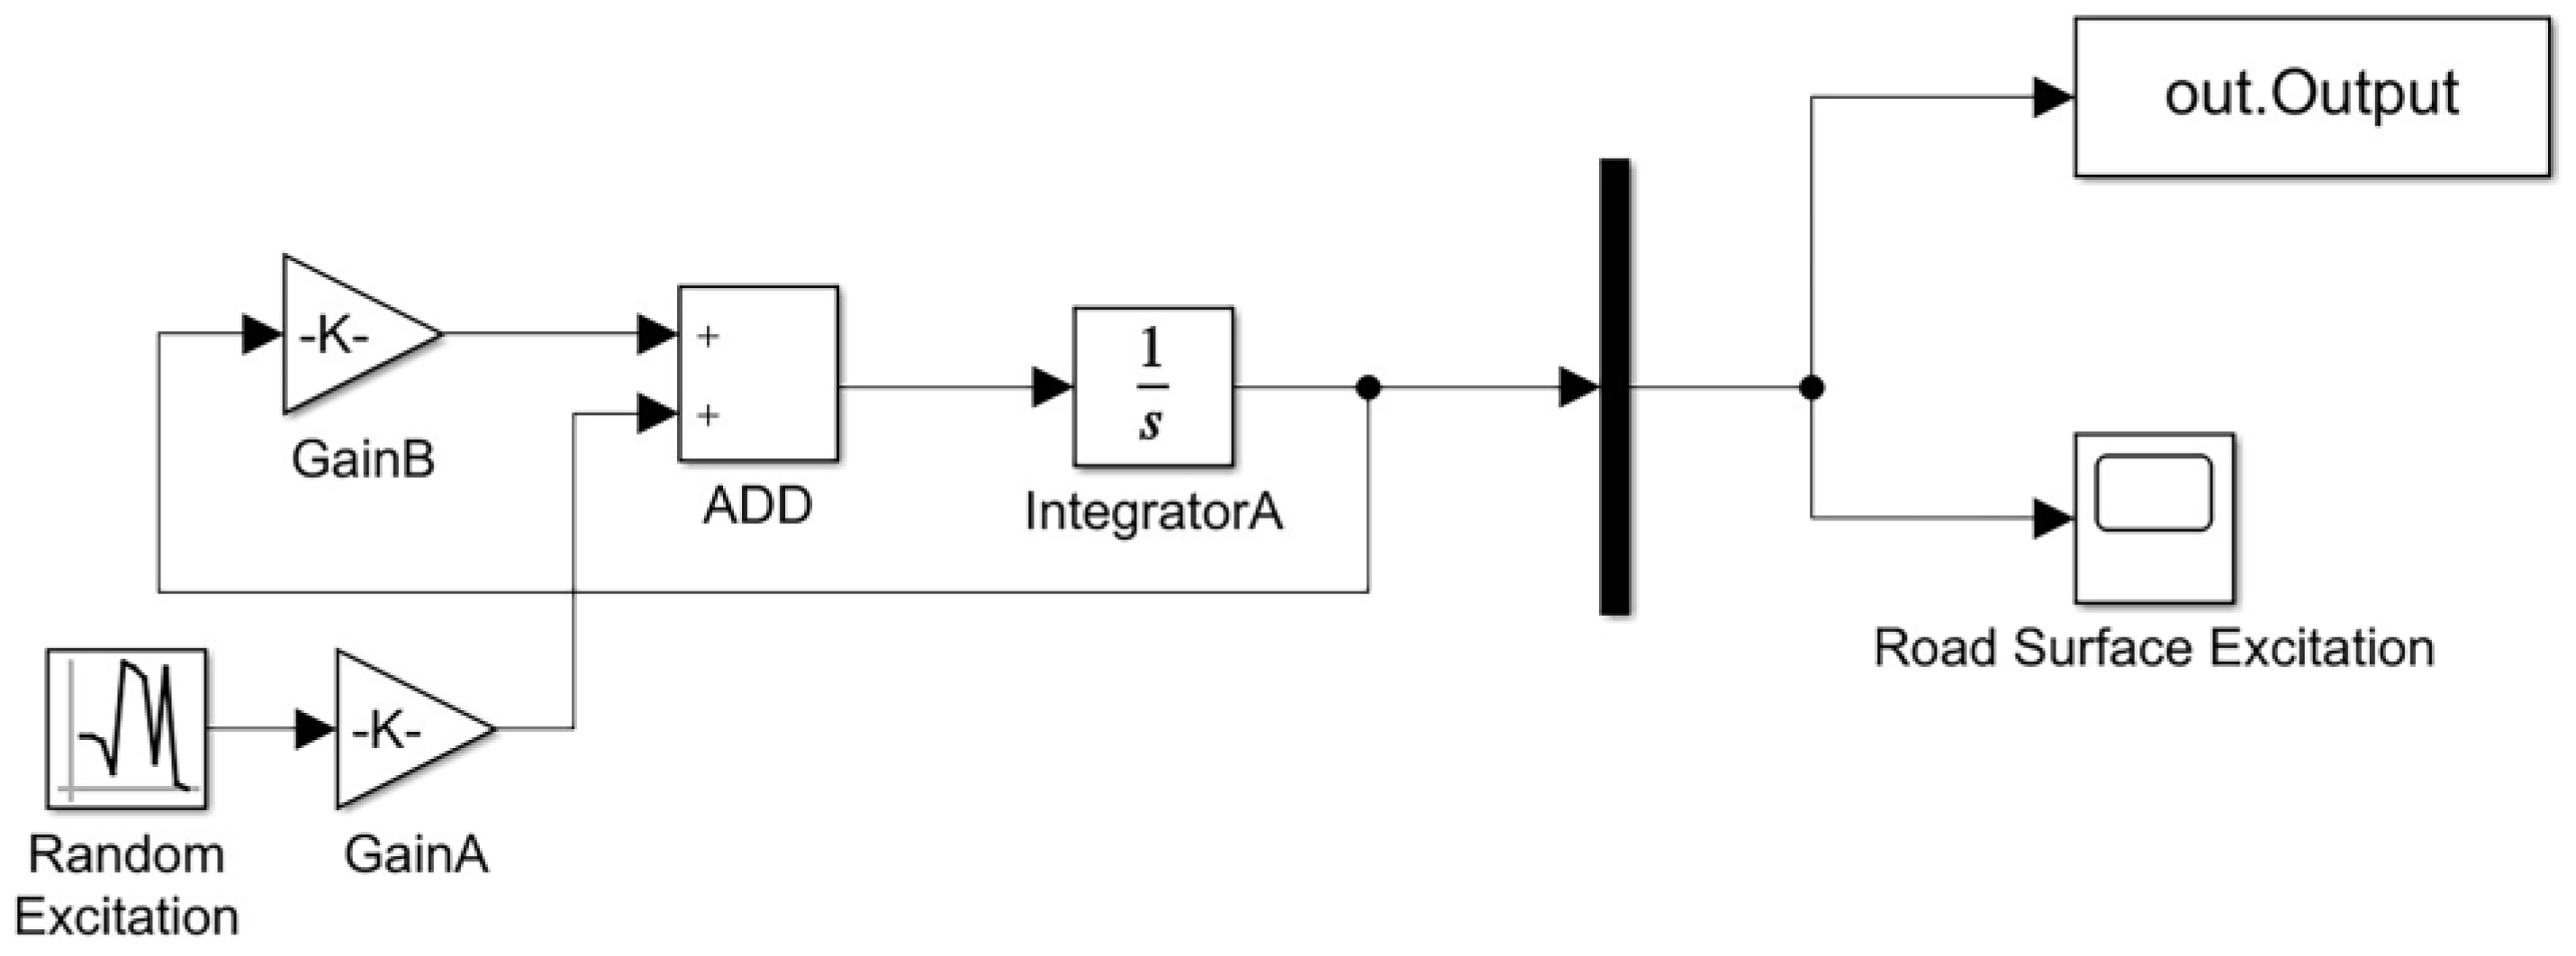
2.2.3. Establishing the Road Surface Model

Currently, both domestically and internationally, the main methods for time-domain road modeling include harmonic superposition, filtered white noise, inverse Fourier transform, and time series modeling. The filtered white noise method involves passing white noise through a first-order or high-order filter to obtain a stationary random process. This method allows the determination of road surface model parameters directly based on the numerical values of the road surface power spectrum and the chassis travel speed. Compared to other methods, the noise method offers fast simulation, convenient implementation, low computational requirements, and high simulation accuracy [21]. Therefore, the filtered white noise method is widely used for simulating road surface roughness. This paper adopts this method for simulating road surface roughness.
At the same time, this paper references the road surface power spectral density from the international standard document ISO/DIS 8608 [22] and the national standard GB 7031-2005 [23] to represent the roughness of field road surfaces in hilly and mountainous areas [24]. Combining this with the filtered white noise method, the time-domain model expression for road surface excitation is obtained as follows:
q ˙ t = 2 π n 0 G q n 0 v ω t 2 π v f q q t
where q(t) represents the road surface’s random excitation generated by first-order filtered white noise, Gq(n0) is the power spectral density of the road surface at a reference spatial frequency, essentially denoting the road roughness coefficient, v stands for the ground robot chassis velocity, ω(t) signifies Gaussian white noise with a mean of 0 and a variance of 1, and fq denotes the cutoff frequency in the time domain, and in this paper, it is set at 0.0628 Hz.
In order to more accurately reflect that the road spectrum approximates a flat shape in the low-frequency range, a lower cutoff frequency fq is introduced into the road spectrum model. According to the literature [25], the lower cutoff frequency is chosen around 0.0628 Hz to ensure that the obtained time-domain road surface displacement input corresponds to the actual field road surface in hilly areas.
In accordance with the field road surface conditions in hilly and mountainous areas, the road roughness coefficient Gq(n0) is selected as 4096 × 10−6 m3 [26]. Therefore, based on the theoretical model in the equation above, a random road surface simulation model is built in the MATLAB Simulink simulation module, as shown in Figure 6. A Gaussian white noise with a mean of 0 and variance of 1 is generated as the road surface excitation source using the Random Numerical module. The parameters for the GainB module are set as −2πfqv, and the parameters for the GainA module are set as 2 π n 0 G q n 0 v . After running the simulation model, road surface excitation output data are obtained in the MATLAB workspace. These road surface model data are then imported into RecurDyn, and virtual road surfaces required for simulation are generated using the Ground module in the software.

3. Results

3.1. Straight-Line Travel Simulation

The chassis under study in this research is equipped with four independently driven wheels. Therefore, it is necessary to add separate wheel speeds for the four individually controlled wheels. During the straight-line travel process, all four wheel speeds are uniform. The Express module is used to define the wheel speed expressions as follows: step(time,0,0,1, step(time,1,0,1.5,5)). This means that the chassis undergoes free fall to the ground and reaches equilibrium within the first 1 s of the simulation, and then accelerates from rest to the operating speed of 5 rad/s between 1 to 1.5 s, after which it travels at a constant speed until the end of the simulation. Finally, this speed expression is applied to each wheel in the Motion module under the Joint Definition option to complete the addition of the driving.
Since the dampers used in this study have both springs and hydraulic damping, the stiffness and damping coefficients of the dampers are added by configuring the Spring option in the Force module. Based on the chassis mass, preliminary values of spring stiffness for each damper are set to 18 kN/m, and damping coefficients to 900 N·s/m. To find the suspension parameters that achieve optimal damping effects, two sets of data near the initial values, ±20%, are selected for simulation analysis [27,28]. The chassis center of mass, which reflects the seeding equipment’s vibration, is chosen as a reference point. The analysis involves comparing the vertical displacement and horizontal motion trajectory during straight-line travel to assess the damping effect and stability of the chassis under different suspension parameters. The simulation step size is set to 100, and the total duration is 10 s. The initial state of the chassis is shown in Figure 7. The state at the end of the simulation is depicted in Figure 8, with the red line representing the center-of-mass trajectory.

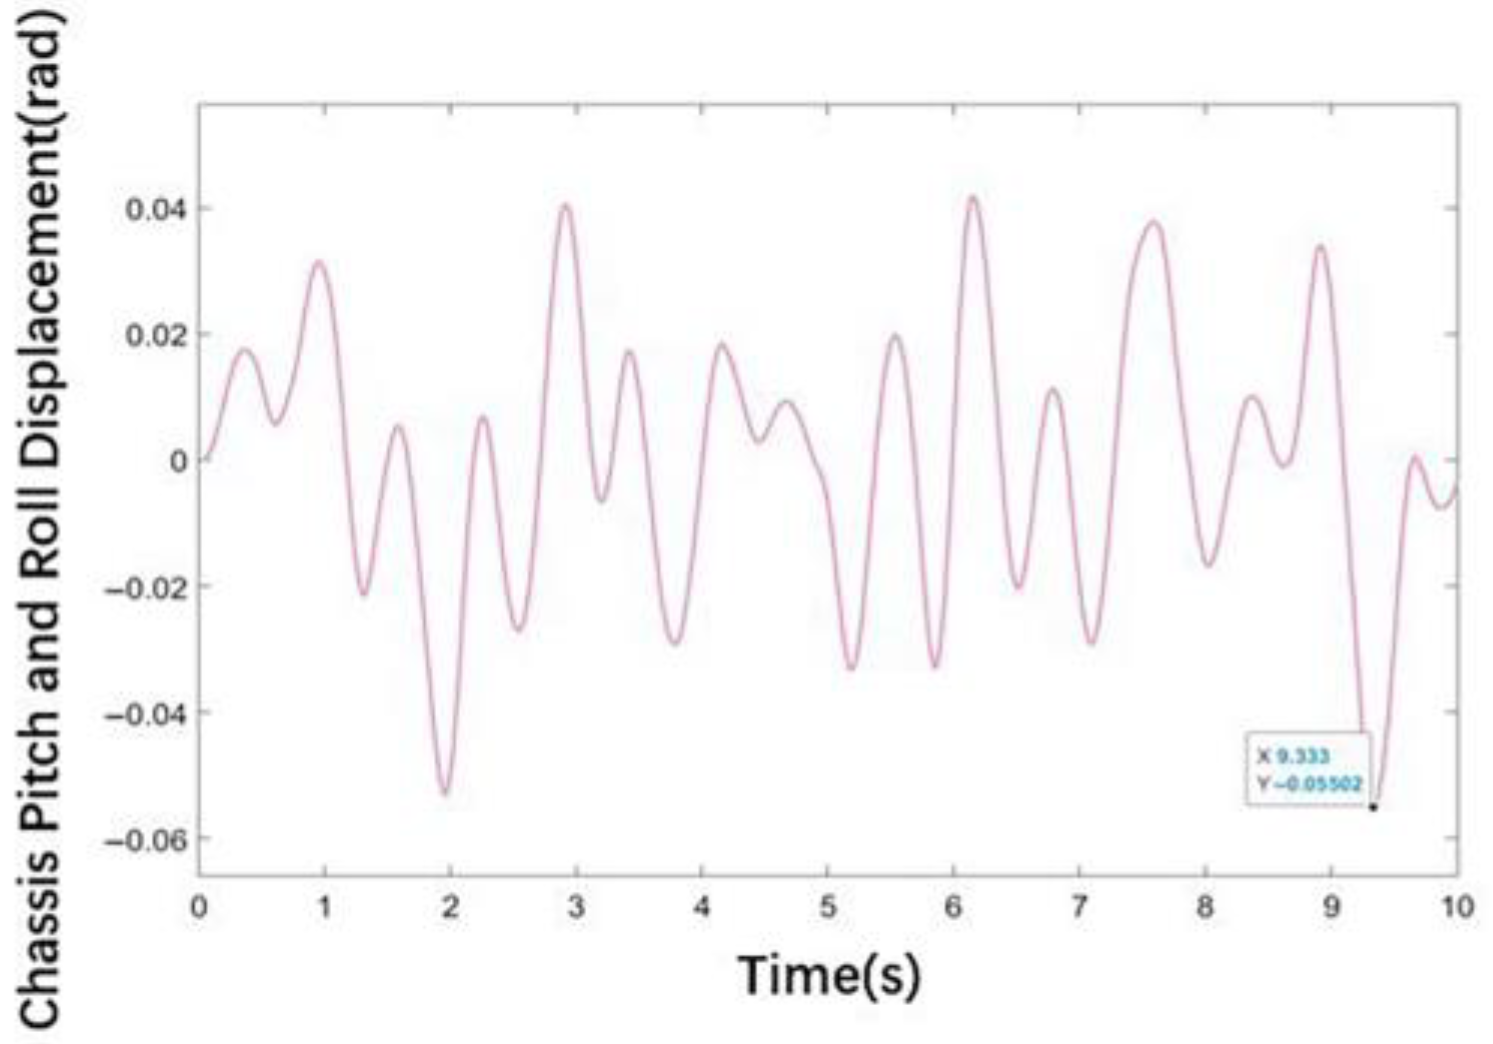
3.2. Vibration Simulation

Based on the simulation structure diagram, several output indicators were selected to reflect the smoothness of the seeding robot chassis during travel. These indicators include the chassis center-of-mass vertical acceleration, chassis pitch angle displacement, front and rear suspension deflection, and chassis center-of-mass vertical displacement. A comparison was conducted with the road surface excitation, and the results for each output and comparison are as follows (Figure 9, Figure 10, Figure 11 and Figure 12).
Figure 9 indicates that under random road surface excitation at the front and rear wheels, the chassis center-of-mass vertical acceleration fluctuates between −1.9 m/s2 and 1.7 m/s2. According to the vehicle smoothness assessment method [29]: when the vertical body acceleration is less than 2 m/s2, it is considered excellent; between 2.0 and 3.5 m/s2 is good; between 3.6 and 4.5 m/s2 is satisfactory; between 4.6 and 6.5 m/s2 is acceptable; between 6.5 and 7.0 m/s2 is not suitable for prolonged use and represents unfavorable conditions in terms of strength; and above 7.0 m/s2, long-term use is dangerous and may damage the vehicle chassis strength. In the simulation results, the peak vertical acceleration of the chassis is relatively small, indicating that the seeding robot chassis exhibits good smoothness during travel.
Figure 10 reveals that the chassis pitch angle displacement, θc, fluctuates within the range of −0.06 to 0.04 radians, with a peak angular displacement of 3.15 degrees. This represents a relatively small degree of pitch motion, which, under normal low-speed driving conditions, has a minor impact on the operation of the seeding robot chassis.
Figure 11 represents the vertical displacement of the front and rear suspensions. The rear suspension deflection fluctuates within the range of −0.01 to 0.01 m, while the front suspension deflection fluctuates within the range of −0.04 to 0.02 m. Since the front and rear suspensions have the same stiffness and damping coefficients, but the chassis center of mass is closer to the front suspension, it results in a larger deflection of the front suspension due to vibration. Considering the combined deflection changes in both suspensions, the overall chassis vibration is relatively small.
Figure 12 illustrates the comparison between road surface excitation and the chassis center-of-mass displacement. From the figure, it can be observed that when both the front and rear wheels are subjected to road surface excitation, the displacement of the chassis center of mass is significantly reduced under the action of the suspension damping system. There is only a slight overshoot in localized areas, with a fluctuation range of −0.015 m to 0.02 m. The damping efficiency at the peak reaches 50%, indicating that the damping system of the seeding robot chassis can provide effective cushioning and vibration absorption, ensuring normal travel and offering protection to the chassis system and its components. Additionally, it reduces the seeding depth error caused by road surface vibrations, meeting the seeding depth requirements during operation.

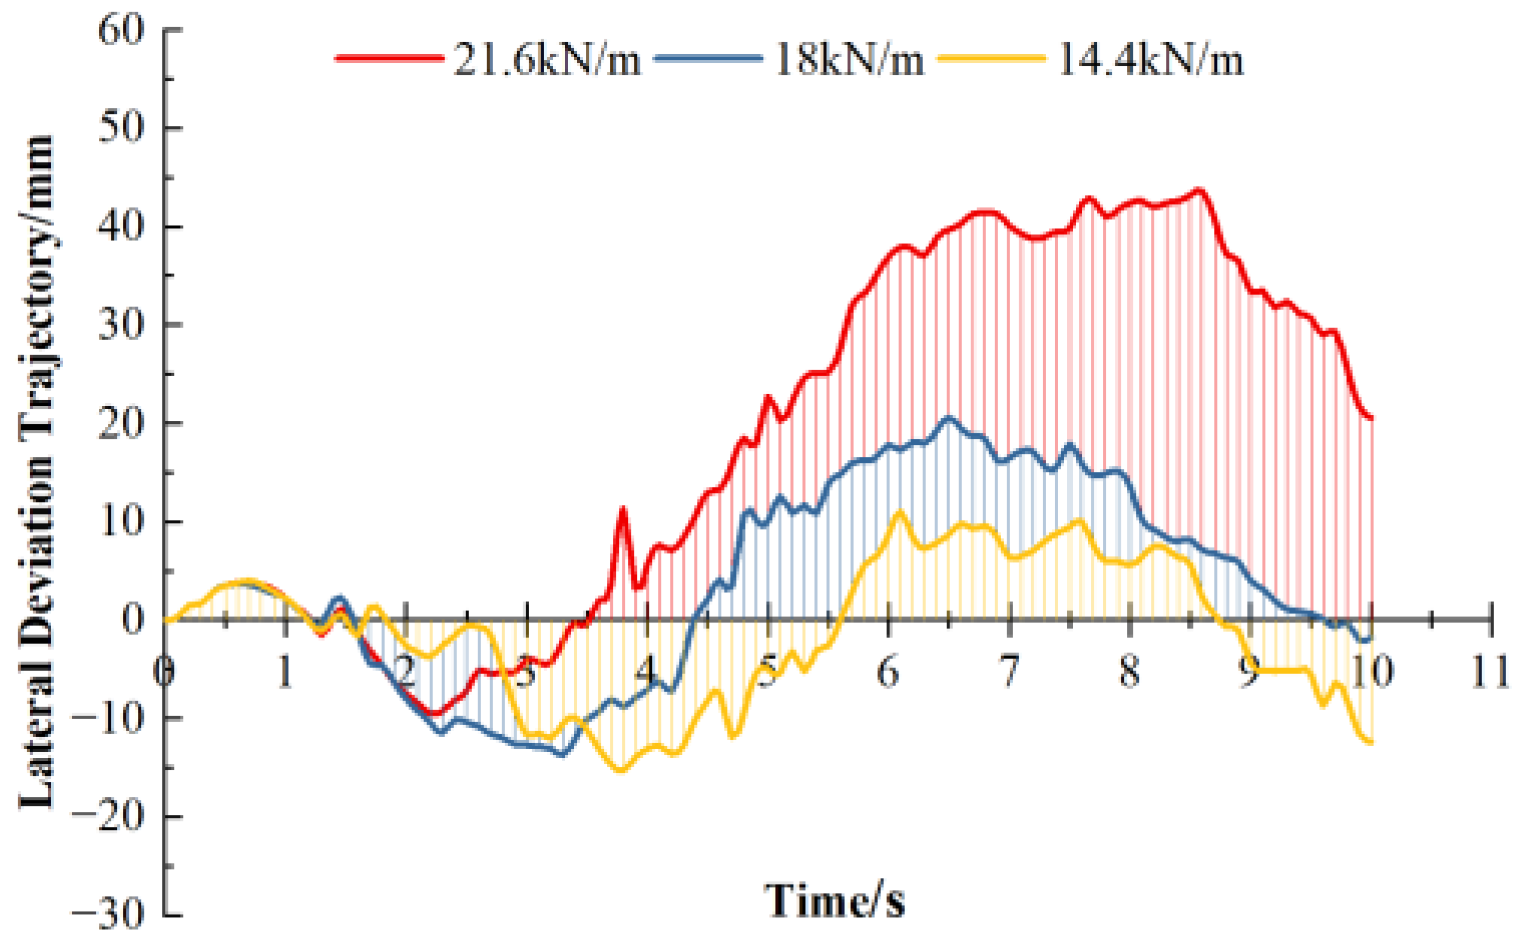
3.3. Simulation Results for Different Suspension Stiffness

Setting the damping coefficient in the Spring option to 900 N·s/m, simulations were conducted with suspension stiffness values of 14.4 kN/m, 18 kN/m, and 21.6 kN/m. The results include the comparison of chassis vertical displacement with road surface excitation for each stiffness condition, along with the horizontal motion trajectory of the center of mass, as shown in Figure 13 and Figure 14.
From Figure 13, it can be observed that the chassis reaches an equilibrium state before 3 s and then accelerates smoothly into a field road with undulations. Due to the numerous data points, eight peak values that better reflect the chassis undulation are selected and annotated in the figure. Throughout the simulation process, the road surface excitation ranges from −29.3 to 45.2 mm, with a standard deviation of 18.2 mm2. The vertical displacement range of the center of mass is −25.9 to 10.5 mm. When the spring stiffness is 21.6 kN/m, 18 kN/m, and 14.4 kN/m, the standard deviations for the three sets of data are 7.033 mm2, 6.789 mm2, and 6.643 mm2, respectively. The standard deviations of the data for the three sets of spring stiffness values indicate that the damping effect is significant. It is analyzed that, based on the initial stiffness value of 18 kN/m, reducing the spring stiffness appropriately will improve the damping effect of the chassis.
From Figure 14, it can be observed that the center of mass of the chassis exhibits a lateral swinging trajectory around the longitudinal axis in the direction of travel. The closer the trajectory is to the horizontal axis, the better the straight-line stability. Therefore, the impact of the three stiffness values on straight-line stability is as follows: 14.4 kN/m > 18 kN/m > 21.6 kN/m. This indicates that when the stiffness is 14.4 kN/m, the straight-line stability is better, with an overall fluctuation range of −16 to 10 mm. Increasing the stiffness will reduce straight-line stability because as stiffness increases, spring deformation decreases, which weakens the damping effect and leads to increased vehicle body bouncing, resulting in instability during travel.

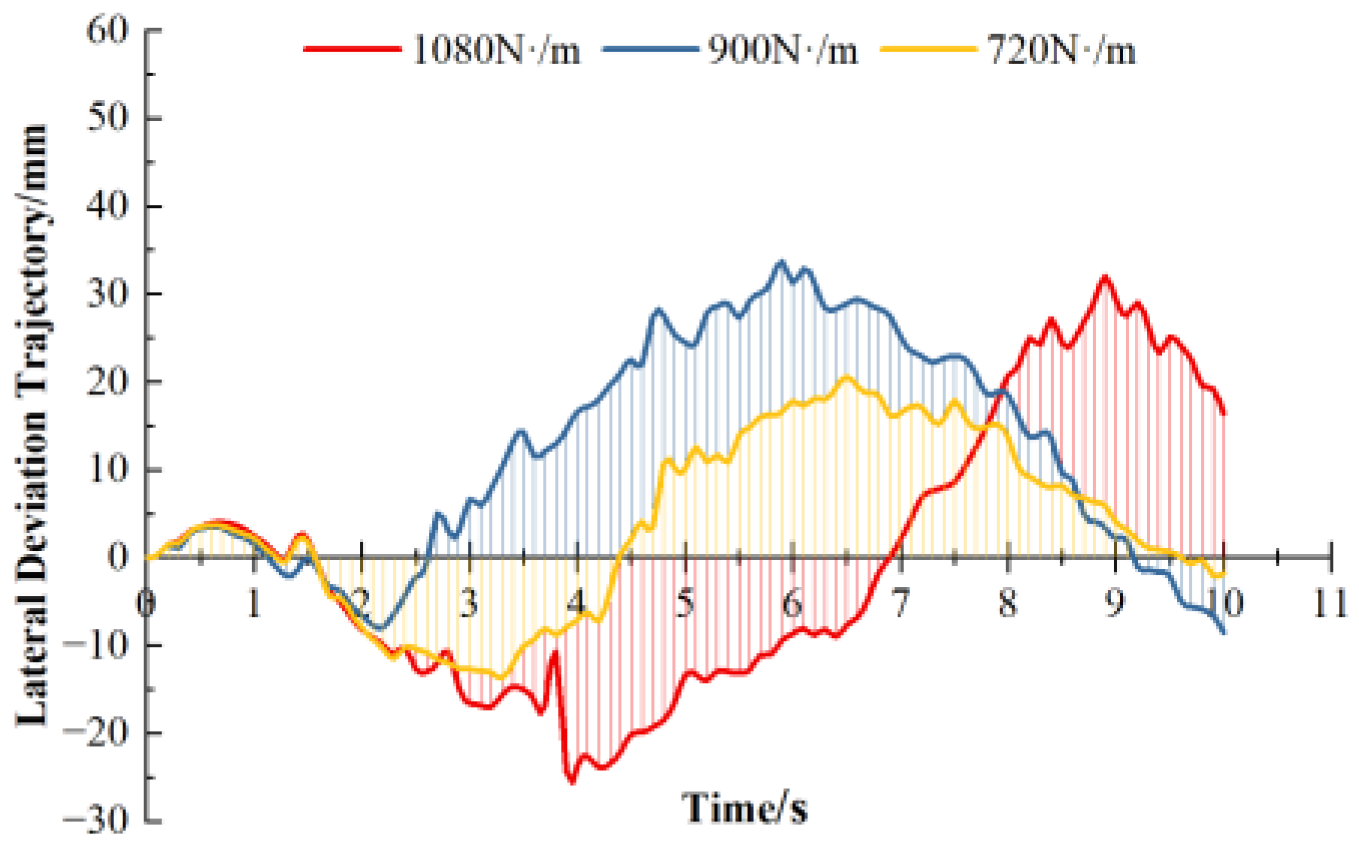
3.4. Simulation Results for Different Suspension Damping

With the spring stiffness set to 18 kN/m in the Spring option, simulations were conducted with suspension damping values of 720 N·s/m, 900 N·s/m, and 1080 N·s/m. The results include the comparison of chassis vertical displacement with road surface excitation for each damping condition, along with the horizontal motion trajectory of the center of mass, as shown in Figure 15 and Figure 16.
From Figure 15, it can be observed that the range of vertical displacement of the center of mass is −23.6 to 7.9 mm. Similarly, eight peak values are selected for annotation. When the damping of the shock absorber is 1080 N·s/m, 900 N·s/m, and 720 N·s/m, the standard deviations for the three sets of data are 6.988 mm2, 6.788 mm2, and 6.980 mm2, respectively. A damping value of 900 N·s/m is considered optimal for the chassis. The analysis indicates that reducing damping increases the sensitivity of the shock absorber rebound but also increases the extension displacement. While increasing damping reduces the extension displacement, it also slows down the rebound speed of the shock absorber. In the case of continuous undulations, this can lead to the chassis not returning to the equilibrium position promptly, resulting in a decrease in damping effectiveness.
From Figure 16, it can be observed that the center of mass of the chassis exhibits a lateral swinging trend around the longitudinal axis in the direction of travel. Among the three damping levels, the impact on straight-line stability is as follows: 900 N·s/m > 720 N·s/m > 1080 N·s/m. This means that when the damping is 900 N·s/m, straight-line stability is better, with an overall fluctuation range of −15 to 18 mm. The analysis is as follows: when damping is 720 N·s/m, the extension stroke of the damper increases, resulting in larger vertical displacement during travel, along with left–right oscillations of the vehicle, leading to veering; when damping is 1080 N·s/m, due to the slower rebound speed of the damper, damping capability decreases, and the vehicle deviates from its direction of travel due to reduced tire grip, resulting in a decrease in straight-line stability.

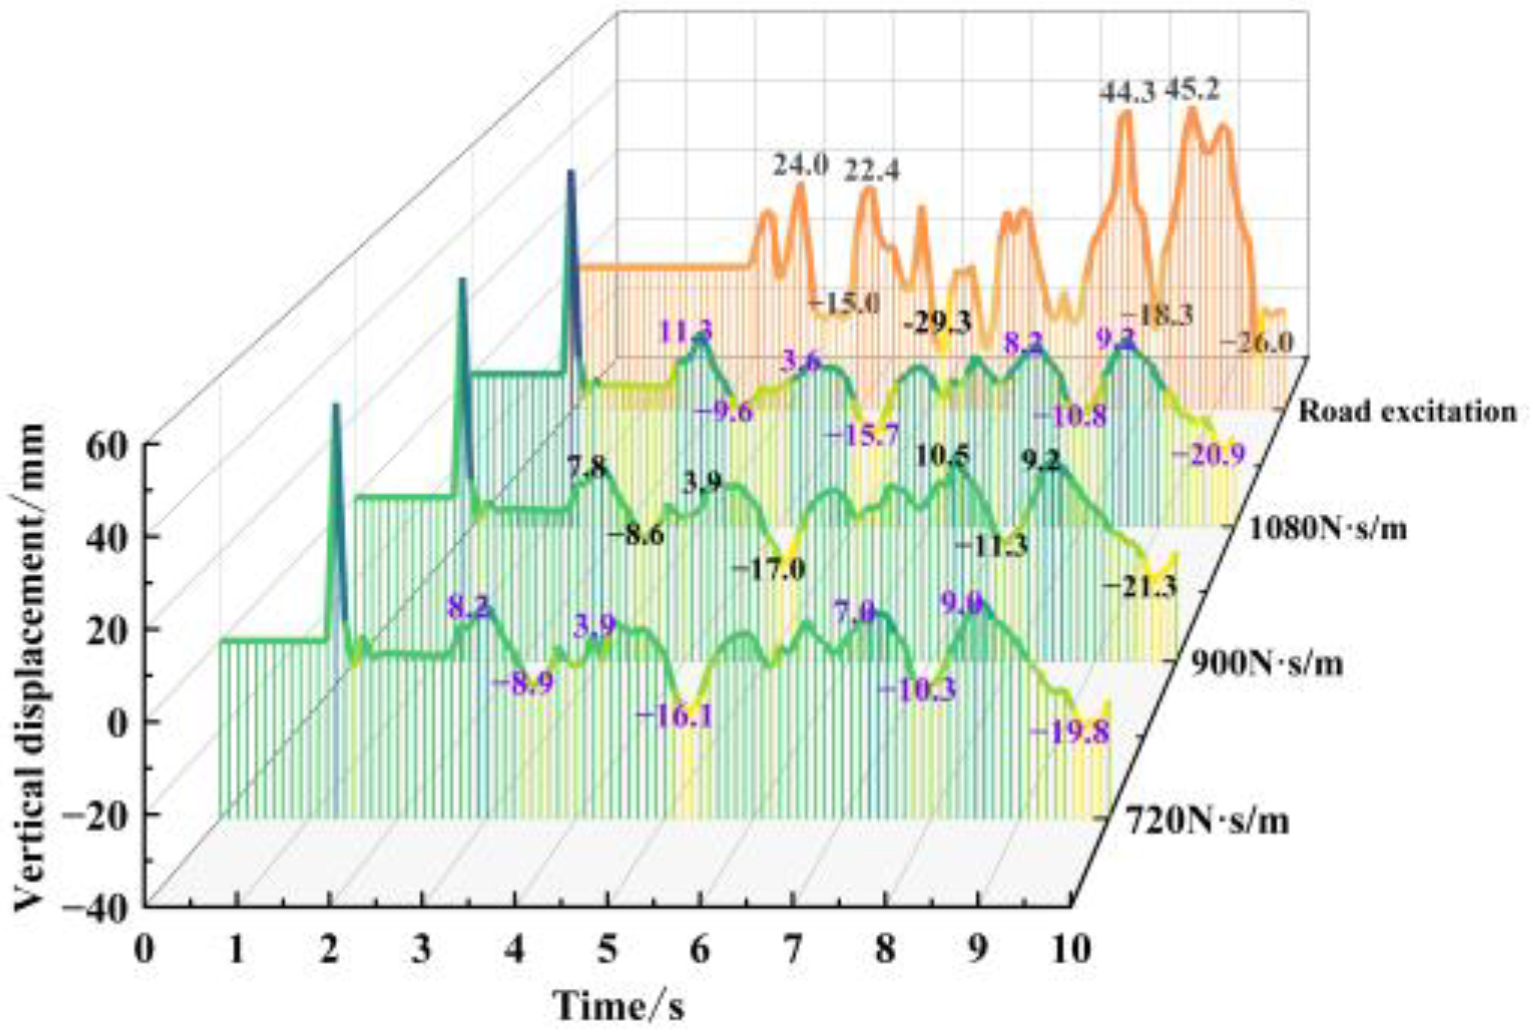
3.5. Simulation Analysis of Optimal Stiffness and Damping Combination

Setting the stiffness in the Spring option to 14.4 kN/m, 18 kN/m, and 21.6 kN/m, and separately configuring suspension damping as 720 N·s/m, 900 N·s/m, and 1080 N·s/m, nine comprehensive factorial simulation experiments were conducted. The results compare the chassis vertical displacement with road excitation under different conditions, as shown in Figure 15, Figure 17 and Figure 18. The standard deviation of the chassis center-of-mass vertical displacement for each experimental group were calculated, as presented in Table 3.
The standard deviation of the chassis center-of-mass vertical displacement reflects the degree of data dispersion, thereby indicating the damping situation of the chassis. The standard deviation of the vertical displacement of the road surface excitation is 18.2 mm2. Analyzing the data from Table 3, it can be concluded that all nine sets of experiments can clearly reflect a significant damping effect. The chassis exhibits the best damping effect when the stiffness is 14.4 kN/m and the damping is 900 N·s/m.

4. Experimental Validation
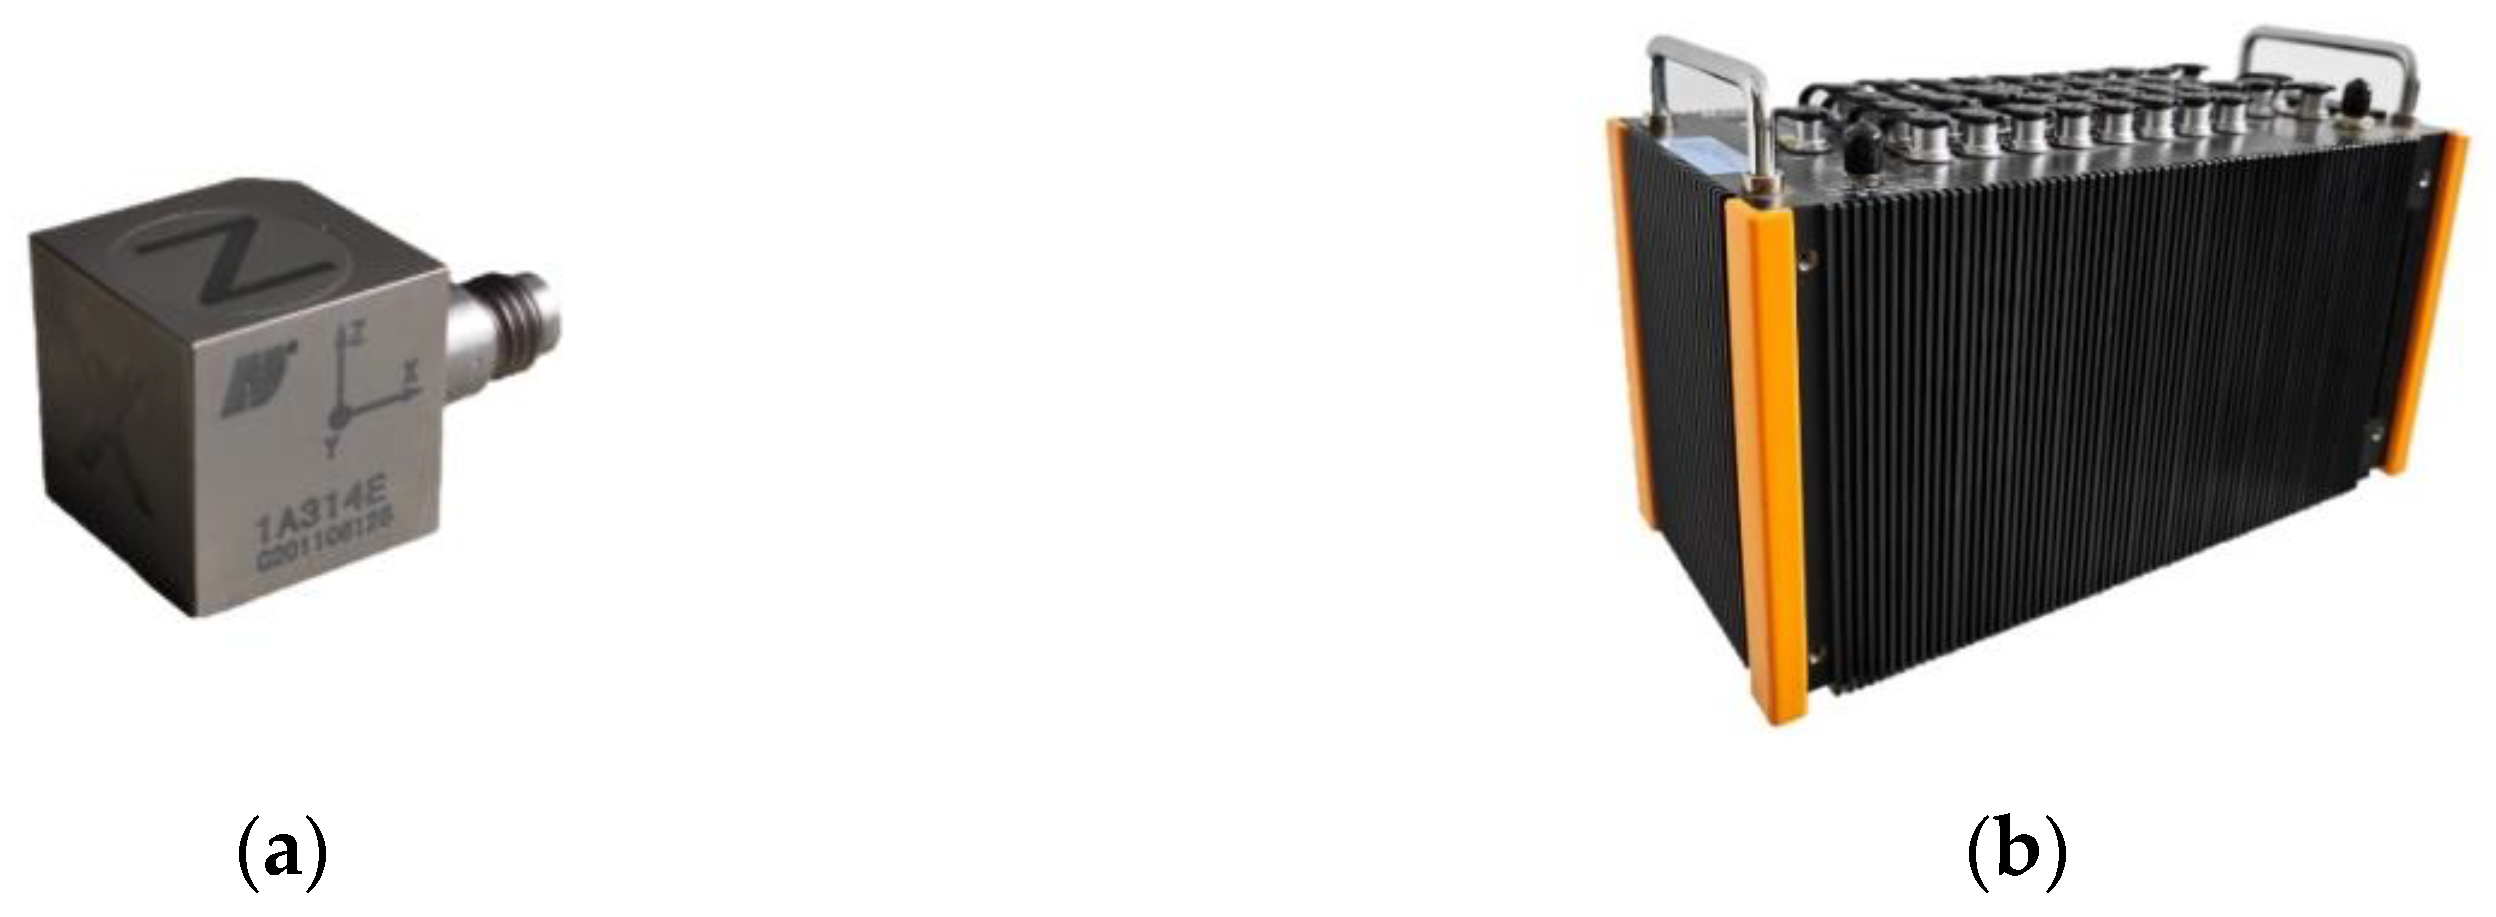
4.1. Test Equipment

The DH5902N rugged dynamic signal test and analysis system was used for collecting vibration data related to the smoothness of the seeding robot chassis, as shown in Figure 19. Three-axis acceleration sensors were mounted on the chassis frame to capture vibration signals during motion. The detected signals were transmitted to the dynamic signal acquisition device, and after processing by the dynamic signal analysis system, the data were transferred to computer software. This allowed us to obtain acceleration time-domain signals related to chassis vibration within the software.

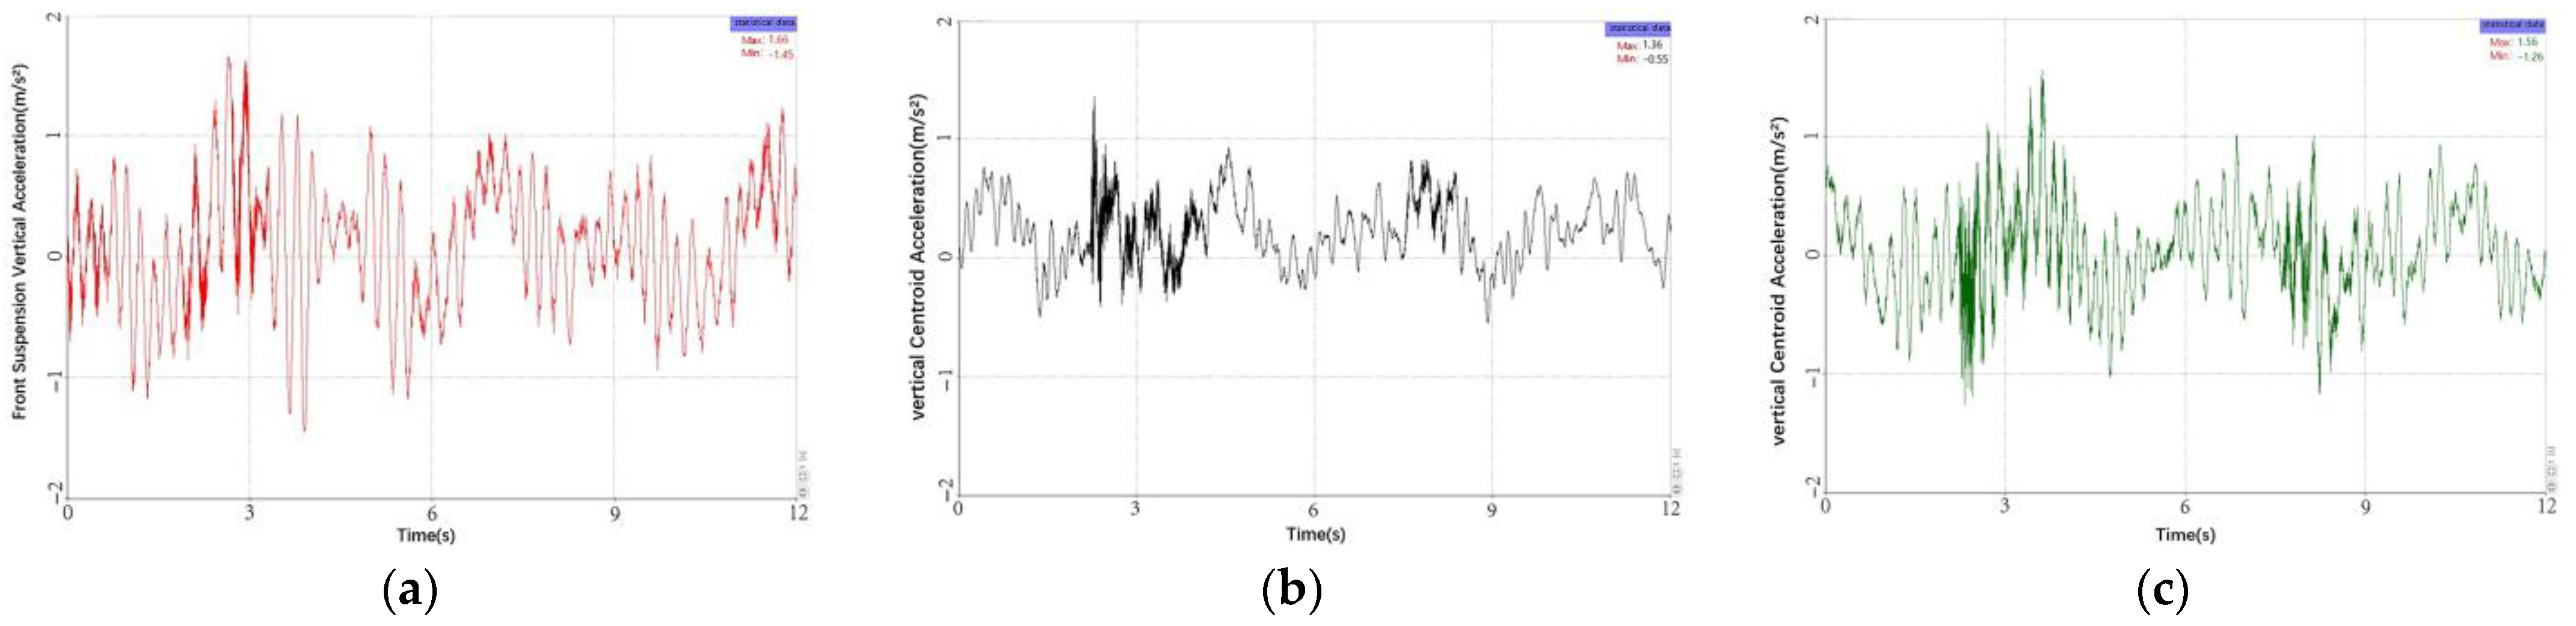
4.2. Vibration Signal Acquisition

In this study, the seeding equipment was designed to be rigidly connected to the chassis at the center of mass, and during testing, a suspension frame with the same mass distribution as the seeding equipment was installed to ensure consistency with the chassis center of mass during actual seeding operations. Therefore, acceleration sensors were installed at three test points: the front of the chassis, the center of mass, and the rear of the chassis, to characterize the smoothness of the front and rear of the chassis as well as the seeding equipment. Based on the previous simulation results, experiments were conducted by reducing the damping coefficient of the rear suspension, as shown in Figure 20.

4.3. Experimental Results and Analysis

The vertical acceleration feedback from various parts of the seeding robot chassis smoothness test was obtained using the dynamic signal test and analysis system software. The vertical motion acceleration signals from the first 12 s of data collection are shown in Figure 21.
From the time-domain plots of the three measurement points, it can be observed that the vertical acceleration amplitudes at all three test points are within the range of −1.45 to 1.66 m/s2, which meet the criteria for good smoothness performance. The overall vibration is relatively uniform with no significant abrupt changes. This indicates that the selected damping system for the seeding robot chassis has good vibration-reduction characteristics. The vibrations at the front and rear suspension positions are greater than those at the middle of the chassis. This suggests that ground vibration impact has been attenuated by the damping system by the time it reaches the middle of the chassis. The maximum impact occurs around 3 s, with slightly higher peak vertical acceleration at the front suspension compared to the rear suspension, at 1.66 m/s2. This is likely due to the larger mass of the battery installed at the front suspension, which results in slightly less effective damping compared to the rear suspension. The range of vertical acceleration amplitudes at the chassis center of mass is −0.55 to 1.36 m/s2, which is consistent with the peak values from the earlier simulation results (−1.9 to 1.7 m/s2). This reflects a high level of consistency between the simulation model and the actual model. Additionally, the decrease in negative acceleration peak compared to the simulation results indicates that the optimized suspension damping parameters have effectively improved the smoothness performance. Overall, the experimental results validate the effectiveness of the damping system and support the simulation findings, demonstrating improved chassis smoothness.

5. Discussion and Conclusions

By obtaining road excitation data in MATLAB/Simulink software and creating a road model based on RecurDyn software, the virtual prototype model of the four-wheeled robot chassis, previously built in SolidWorks, was imported. Dynamic simulations were conducted based on this model to explore the chassis’ straight-line performance and vertical displacement of the chassis center of gravity under different suspension stiffness and damping values. This allowed for an understanding of the suspension’s damping performance. The specific conclusions are as follows:
  • On the basis of the initial stiffness values, reducing the spring stiffness appropriately will improve the damping effect of the chassis. Specifically, when the stiffness is set to 14.4 kN/m, the vertical displacement of the chassis center of gravity is minimized, and the straight-line performance is optimized. This is because increasing stiffness leads to reduced spring deformation, weakening the damping effect, and causing vertical bouncing of the chassis due to reduced ground adhesion of the wheels, resulting in instability during travel.
  • Comparing the simulation results under different damping settings, it can be concluded that the chassis exhibits the smallest vertical displacement of the center of gravity and the best straight-line performance when the damping coefficient is set to 900 N·s/m. This is because reducing damping increases the sensitivity of the shock absorbers to rebound while also increasing the extension displacement. Conversely, increasing damping, although reducing extension displacement, slows down the rebound speed of the shock absorbers, preventing them from quickly returning to their equilibrium position. This leads to a reduction in damping effectiveness when encountering continuous bumps in the road.
  • The simulation results and experiments demonstrate that the four-wheel robot chassis exhibits good ride comfort and reliable operation. Future research will focus on field trials of the prototype under various road conditions and further in-depth parameter optimization. The road excitation generation method and dynamic simulation approach used in this paper are considered to be realistic and reliable, providing a method for optimizing suspension parameters for similar wheeled chassis.

Author Contributions

Methodology, Z.L. and X.L.; software, Z.L. and Y.F.; investigation, Y.L. and J.T.; data curation, Y.J. and R.W.; writing—original draft, Y.F.; writing—review and editing, Y.F. and X.L. All authors have read and agreed to the published version of the manuscript.

Funding

This research was funded by the Chengdu Science and Technology Key Research and Development Support Program (project number: 200-YF05-01084-SN) and the Special Project of the National Modern Agricultural Industry Technology System, Sichuan Legume and Coarse Grain Innovation Team (project number: SCCXTD-2024-20).

Institutional Review Board Statement

Not applicable.

Informed Consent Statement

Not applicable.

Data Availability Statement

Data are contained within the article.

Acknowledgments

The authors would like to thank all teachers and students for their invaluable support, especially X.L.

Conflicts of Interest

The authors declare no conflict of interest.

References

  1. Fu, J.; Ma, R. Research progress in the effects of mechanical compaction on soil properties and soil erosion in farmland. Trans. Chin. Soc. Agric. Eng. 2022, 38 (Suppl. S1), 27–36. [Google Scholar]
  2. Tang, Y.; Lu, X.; Yi, J. Evaluating the Spatial Spillover Effect of Farmland use Transition on Grain Production—An Empirical Study in Hubei Province. Ecol. Indic. 2021, 125, 107478. [Google Scholar] [CrossRef]
  3. Sun, W.; Li, C.; Wang, J. Research on Ride Comfort of an Off-road Vehicle with Compound Suspension. Chin. J. Autom. Eng. 2022, 44, 105–114+122. [Google Scholar]
  4. Zhang, J.; Chen, S.; Zhao, Y. Design and Testing of a Hydropneumatic Suspension with Continuously Adjustable Damping. Chin. J. Autom. Eng. 2015, 5, 282–289. [Google Scholar]
  5. Qiu, C.; Shen, Y.; Shi, D. Positive Real Optimization and Performance Analysis of New Type Vehicle Electromechanical Suspension. J. Vib. Shock 2021, 40, 76–81. [Google Scholar]
  6. Tian, R. Integrated Optimization Control and Software Architecture Design of Multi-dimensional Dynamics in Automotive Chassis Domain. Ph.D. Thesis, Jilin University, Changchun, China, 2023. [Google Scholar]
  7. Xie, J.; Zhang, Q. Simulation Analysis of Vehicle Ride Comfort Based on Simulink. Mech. Electr. Technol. 2013, 36, 14–18. [Google Scholar]
  8. Yu, X.; Liu, S. Simulation and Analysis of the Dissipative Control System of an Active Suspension. J. Beijing Univ. Technol. 2012, 38, 39–44. [Google Scholar]
  9. Tan, G.; Lu, Z. Steering Analysis of Tracked Wheeled Mobile Platform Based on RecurDyn. J. Agric. Mech. Res. 2023, 45, 238–243. [Google Scholar]
  10. Lv, X.; Meng, X. Design and Simulation of Small Tracked Vehicle Based on RecurDyn. Equip. Manuf. Technol. 2023, 02, 152–155. [Google Scholar]
  11. Zhang, Q.; Li, N. Joint Simulation of Small Wheeled Platform Based on RecurDyn and Matlab/Simulink. Comput. Meas. Control 2018, 26, 112–115. [Google Scholar]
  12. Ruchelshausen, A.; Biber, P.; Dorna, M. BoniRob: An Autonomous Field Robot Platform for Individual Plant Phenotyping. Precis. Agric. 2009, 9, 841–847. [Google Scholar]
  13. Analog Dialogue. Available online: https://www.analog.com/en/analog-dialogue/articles/inertial-sensors-and-autonomous-operation-in-robots.html (accessed on 18 October 2022).
  14. Zhang, J.; Chen, D. Design and Experiment of Four-wheel Independent Steering Driving and Control System for Agricultural Wheeled Robot. Trans. Chin. Soc. Agric. Eng. 2015, 31, 63–70. [Google Scholar]
  15. Sun, X.; Chu, Y.; Fan, J. Research of Simulation on the Effect of Suspension Damping on Vehicle Ride. Energy Procedia 2012, 17, 145–151. [Google Scholar] [CrossRef]
  16. Zhang, B.; Tan, C.; Dai, T. Ride Comfort and Energy Dissipation of Vehicle Suspension System under Non-stationary Random Road Excitation. J. Sound Vib. 2021, 511, 116347. [Google Scholar] [CrossRef]
  17. Rafael, T.; Joan, V.; Monzer, A. Modeling of an Active Torsion Bar Automotive Suspension for Ride Smoothness and Energy Analysis in Standard Road Profiles. IFAC PapersOnLine 2019, 52, 181–186. [Google Scholar]
  18. Huang, A. Yaw Stability of Four-wheel Independently Steering Unmanned Truck Control Research. Master’s Thesis, Hebei University of Technology, Tianjing, China, 2021. [Google Scholar]
  19. Li, M.; Li, L. Simulation of Vibration Characteristics of Lumped and Multibody Coupled Human-vehicle Model. J. Shandong Univ. Technol. 2024, 38, 61–67. [Google Scholar] [CrossRef]
  20. Gandhi, P.; Adarsh, S. Performance Analysis of Half Car Suspension Model with 4 DOF using PID, LQR, FUZZY and ANFIS Controllers. Proc. Comput. Sci. 2017, 115, 2–13. [Google Scholar] [CrossRef]
  21. Huang, D.; Wang, B. Research on Assessment Method of Vibration Control Feature of Suspension System of Vehicle. J. Ordnance Equip. Eng. 2021, 42, 142–146. [Google Scholar]
  22. ISO 8608:2016; Mechanical Vibration—Road Surface Profiles—Reporting of Measured Data. International Organization for Standardization: Geneva, Switzerland, 2016.
  23. GB/T 7031-2005; Mechanical Vibration—Road Surface Profiles—Reporting of Measured Data. Standards Press of China: Beijing, China, 2005.
  24. Yu, Z. Automotive Theory; Machinery Industry Press: Beijing, China, 2007; pp. 86–88. [Google Scholar]
  25. Zhao, B.; Dong, J. Establishment and simulation of time domain model for Band-Limited White Noise pavement roughness. Auto Appl. Technol. 2019, 3, 89–90+115. [Google Scholar]
  26. Pang, G.; Chen, L. Fundamentals of Automotive System Dynamics and Control Technology; Tsinghua University Press: Beijing, China, 2017; pp. 185–188. [Google Scholar]
  27. Liang, X. Research on Ride Comfort Analysis and Control Strategy Ofautomobile Air Suspension System. Master’s Thesis, Shenyang University of Technology, Shenyang, China, 2022. [Google Scholar]
  28. Gao, J. The Vehicle Ride Comfort Analysis and Research by Nonlinear Simulation Model and Test. Master’s Thesis, Dalian Jiaotong University, Dalian, China, 2021. [Google Scholar]
  29. Zhang, X.; Li, H. Analysis on Accelerations of Vehicle Body during Vertical Vibration. Railw. Stand. Des. 2011, 10, 8–11. [Google Scholar]
Figure 1. Research flow chart.
Sustainability 15 16868 g001
Figure 2. Overall model of the robot chassis: 1. chassis frame; 2. modular wheels; 3. seeding equipment and other working components.
Sustainability 15 16868 g002
Figure 3. Modular wheel: 1. steering motor; 2. shock absorber; 3. auxiliary support mechanism; 4. worm gear and worm reducer; 5. steering shaft; 6. steering shaft sleeve; 7. hub motor.
Sustainability 15 16868 g003
Figure 4. Kinematic pair constraint of suspension and wheel.
Sustainability 15 16868 g004
Figure 5. Four-degrees-of-freedom 1/2 vibration model of the seeding robot chassis.
Sustainability 15 16868 g005
Figure 6. Time domain model of the road excitation.
Sustainability 15 16868 g006
Figure 7. Initial position of the chassis.
Sustainability 15 16868 g007
Figure 8. Chassis position when simulation is completed.
Sustainability 15 16868 g008
Figure 9. Vertical acceleration change diagram of the chassis centroid.
Sustainability 15 16868 g009
Figure 10. Pitch angular displacement change diagram of the chassis.
Sustainability 15 16868 g010
Figure 11. Dynamic deflection variation diagram of the front and rear suspension: (a) front suspension dynamic deflection; (b) rear suspension dynamic deflection.
Sustainability 15 16868 g011
Figure 12. Comparison diagram of the road excitation and the chassis centroid displacement.
Sustainability 15 16868 g012
Figure 13. Comparison of vertical centroid displacement and road excitation under different stiffnesses with a damping coefficient of 900 N·s/m.
Sustainability 15 16868 g013
Figure 14. Lateral deviation trajectory of chassis centroid under different stiffnesses.
Sustainability 15 16868 g014
Figure 15. Comparison of vertical centroid displacement and road excitation under different damping with a stiffness of 18 kN/m.
Sustainability 15 16868 g015
Figure 16. Lateral deviation trajectory of chassis centroid under different damping.
Sustainability 15 16868 g016
Figure 17. Comparison of vertical centroid displacement and road excitation under different damping with a stiffness of 14.4 kN/m.
Sustainability 15 16868 g017
Figure 18. Comparison of vertical centroid displacement and road excitation under different damping with a stiffness of 21.6 kN/m.
Sustainability 15 16868 g018
Figure 19. DH5902N ruggedized dynamic signal test and analysis system: (a) triaxial accelerometer; (b) DH5902N data acquisition instrument.
Sustainability 15 16868 g019
Figure 20. Acceleration sensor installation and ride smoothness test: (a) installation position of the triaxial accelerometer; (b) ride smoothness test of the seeding robot chassis.
Sustainability 15 16868 g020
Figure 21. Time-domain diagram of vertical acceleration: (a) front suspension vertical acceleration; (b) vertical acceleration of chassis centroid; and (c) rear suspension vertical acceleration.
Sustainability 15 16868 g021
Table 1. Chassis Parameters.
Key ParametersUnitsData
Machine sizemm1140 (Length) × 1200 (Width) × 870 (Height)
Travel Speedm/s1
Chassis total masskg200
Damping type Spring-damping damper
Wheel diametermm388
Table 2. Parameter definitions of the dynamic model of the seeding robot chassis.
NameDefinitionDataNameDefinitionData
mChassis structure total ass200 kgθcChassis angular displacement about center of massrad
JChassis pitch moment of inertia57.9 kg·m2xChassis vertical displacement of center of massm
aDistance from chassis center of mass to rear axle0.475 mbDistance from center of mass to front axle0.375 m
q1Excitation on the front axle wheels due to road surfacemq2Rear axle wheel excitationm
kt1Vertical stiffness of the front axle tires25 kN/mkt2Vertical stiffness of rear axle tire25 kN/m
m1Front axle unsprung mass10 kgm2Rear axle unsprung mass10 kg
x1Front axle unsprung mass displacementmx2Displacement of rear axle unsprung massm
c1Front axle suspension vertical damping900 N·s/mc2Vertical damping of rear axle suspension900 N·s/m
k1Front axle suspension vertical stiffness18 kN/mk2Vertical stiffness of rear axle suspension18 kN/m
x3Front suspension vertical displacementmx4Vertical displacement of rear suspensionm
Table 3. Standard deviation of vertical displacement of the center of mass under different stiffness and damping values.
Test NumberStiffness (kN/m)Damping (N·s/m)Standard Deviation (mm2)
114.47206.803
214.49006.643
314.410806.966
4187206.980
5189006.789
61810806.988
721.67207.156
821.69007.033
921.610807.282
Disclaimer/Publisher’s Note: The statements, opinions and data contained in all publications are solely those of the individual author(s) and contributor(s) and not of MDPI and/or the editor(s). MDPI and/or the editor(s) disclaim responsibility for any injury to people or property resulting from any ideas, methods, instructions or products referred to in the content.

