Article

Choice Modeling of Laundry Detergent Data for Sustainable Consumption

1
AI, Neurotechnology and Business Analytics Laboratory, Plekhanov Russian University of Economics, Stremyanny Lane, 36, Moscow 117997, Russia
2
ABC Department Politecnico di Milano, Polytechnic University of Milan, Leonardo da Vinci Square, 32, 20133 Milan, Italy
*
Author to whom correspondence should be addressed.
Sustainability 2023, 15(24), 16949; https://doi.org/10.3390/su152416949
Submission received: 16 October 2023 / Revised: 23 November 2023 / Accepted: 29 November 2023 / Published: 18 December 2023
(This article belongs to the Section Economic and Business Aspects of Sustainability)

Abstract

:
Consumer choice modeling takes center stage as we delve into understanding how personal preferences of decision makers (customers) for products influence demand at the level of the individual. The contemporary choice theory is built upon the characteristics of the decision maker, alternatives available for the choice of the decision maker, the attributes of the available alternatives and decision rules that the decision maker uses to make a choice. The choice set in our research is represented by six major brands (products) of laundry detergents in the Japanese market. We use the panel data of the purchases of 98 households to which we apply the hierarchical probit model, facilitated by a Markov Chain Monte Carlo simulation (MCMC) in order to evaluate the brand values of six brands. The applied model also allows us to evaluate the tangible and intangible brand values. These evaluated metrics help us to assess the brands based on their tangible and intangible characteristics. Moreover, consumer choice modeling also provides a framework for assessing the environmental performance of laundry detergent brands as the model uses the information on components (physical attributes) of laundry detergents. Through a comprehensive evaluation of product performance, including brand tangible estimation, we shed light on the sustainability attributes of laundry detergents, offering a roadmap for consumers and manufacturers alike to make more informed, environmentally responsible choices of laundry detergents based on their physical attributes. Knowing the estimates of the attributes for the laundry detergent products, manufacturers can modify their physical attributes, e.g., decrease the amount of the detergent needed for one wash while increasing the total weight of the laundry powder in the package. In this way, more ecology- and consumer-friendly decisions can be made by manufacturers of laundry detergents.

1. Introduction

As global awareness of our collective environmental impact grows, sustainable practices are becoming increasingly important, while it may be easy to overlook laundry detergents, these everyday cleaning agents can make a significant difference in the eco-friendliness of our daily routines. By understanding the environmental implications of traditional laundry detergents and making conscious choices in selecting and using alternatives, we can significantly reduce our ecological footprint.
Traditionally laundry detergents impact the environment through release of chemical components, non-biodegradable ingredients, and plastic packaging. As for chemical components, conventional laundry detergents often contain harmful chemicals, such as phosphates, fragrances, and optical brighteners. These toxic ingredients can leach into water supplies, causing harm to aquatic life and contributing to environmental pollution. As for non-biodegradable ingredients, many traditional laundry detergents contain non-biodegradable substances, such as synthetic surfactants. When discharged into the environment, these substances accumulate over time, posing potential threats to ecosystems and public health. As for plastic packaging, the plastic bottles commonly used to package laundry detergents are composed of non-renewable resources, like petroleum, and contribute to plastic pollution. Improper disposal leads to the contamination of waterways, marine life, and the wider environment. Adopting sustainable laundry practices, such as using energy-efficient machines and eco-friendly detergents, can significantly reduce the environmental impact of clothing care. Recent research [1,2] underscores the importance of these practices, highlighting their potential to mitigate water and energy consumption, thereby promoting a more environmentally conscious approach to laundry routines. Tomsic, Ofentavšek and Fink [3] investigate the use of different types of laundry detergent at different washing temperatures and suggest using powders with a certain composition. Nawaz and Sengupta [4] analyze the role of each detergent component in affecting the environment. Järvi and Paloviita [5] examine how households read, comprehend, and adhere to the directions on detergent packages and dosage guidelines.
The sustainable laundry practice would be to use the correct amount of detergent because overusing laundry detergent can lead to excessive chemical waste and water pollution. To ensure sustainable washing practices, the correct amount of the detergent must be measured as recommended by the detergent manufacturer. In addition, it is recommended to adjust customers’ washing habits: opting for cold water is a greener choice, conducting full loads instead of multiple smaller loads which conserves both water and energy, etc. In this study, the approach of brand equity is applied to evaluate the brand value of laundry detergents with an emphasis on sustainability, a vital aspect of modern microeconomics and consumer behavior. By delving into consumer choice modeling, we address the challenge of determining the value of eco-friendliness of laundry detergents brands. Consumer choice modeling is primarily concerned with forecasting demands and understanding how personal preferences for sustainable products impact the balance between supply and demand. For customers, choosing a laundry detergent signifies selecting from diverse sustainable alternatives available in the market to maximize their self-interests, as directed by the utility function, while adhering to the constraints of their consumption levels and environmental impact. The subject of this research holds relevance across various sectors, including fast-moving environmentally friendly consumer goods, both packaged items and non-durables, as well as durable products like electric vehicles. Moreover, it extends to services that integrate sustainable practices, such as green transportation, eco-conscious healthcare, responsible banking, and environmentally minded insurance providers.
Systematic investigation substantiates, presented in study [6], confirm the relevance of sustainability in consumers’ purchase choices. The article [7] addresses diverse applications of discrete choice modeling, spanning topics such as energy-related decisions, climate change considerations, and transportation choices. Additionally, it delves into areas such as tourism preferences with a focus on climate change mitigation, wildlife conservation strategies, and ecosystem management.
Our research focuses on modeling consumer behavior, choice differences (heterogeneity) among consumers, and measuring product value. Product value is modeled through a consumer behavior model using a hierarchical probit. As there are many parameters to estimate, the Markov Chain Monte Carlo simulation (MCMC) is used as a suitable method.
Sustainable detergents are often marketed with claims of reduced environmental impact. Product choice models can be utilized to assess and communicate these environmental benefits effectively. Through comprehensive analysis, including life cycle assessments and ecological footprint evaluations, brands can provide consumers with transparent information about the ecological advantages of choosing sustainable detergents. This, in turn, empowers consumers to make informed choices aligned with their environmental values. Choice modeling, through its intricate analysis of consumer preferences, offers a systematic approach to understanding the intricate decision-making processes that govern product selection. By incorporating factors such as environmental consciousness, ingredient transparency, and packaging preferences, choice modeling enables the identification of critical attributes that influence consumers towards sustainable choices. The comprehensive insights derived from choice modeling can inform the development of targeted marketing strategies and product formulations that align with consumer values, fostering the adoption of more environmentally friendly detergent options. Additionally, choice modeling allows for the exploration of trade-offs within consumer decision dynamics, providing a nuanced understanding of the factors that may hinder or promote the acceptance of sustainable detergent alternatives. In essence, the hypothesis rests on the premise that choice modeling provides a robust analytical framework to unravel the complexities of consumer decision making in the context of laundry detergent sustainability, thereby offering valuable insights for industry stakeholders and policymakers seeking to enhance the ecological footprint of household cleaning products.
Products are associated with consumer products; financial, retail, and management services; people; places; and ideas. Levitt [8] provides a framework for understanding what a product is and how it is created. According to Doyle’s [9] interpretation of Levitt’s scheme, each product revolves around a substantial essence—a good that fulfills the primary needs of consumers. This substantive essence is what economic experts argue logical consumers contemplate when making decisions. Nonetheless, for the achievement of triumphant sales in a competitive market, this crucial essence must be presented as a fundamental product. It ought to be packaged in a user-friendly manner, and the customers ought to be educated about its characteristics and caliber. In addition, it should be crafted for simplicity of use. There are extra tactics to boost the product’s merit, like providing warranties of performance, financing options, dependable delivery, and efficient post-purchase services. Lastly, the prospective product encompasses all the potential strategies employed to generate customer preference and fidelity.
The importance of our study lies in its dedicated exploration of consumer behavior and sustainability dynamics within the laundry detergent sector through the meticulous application of choice modeling techniques. The research endeavors to unravel the intricacies of consumer decision-making processes concerning laundry detergents. The significance lies in its potential to elucidate the factors influencing sustainable consumption patterns in this specific product category, offering valuable insights into the preferences and trade-offs that consumers make

2. Literature Review

Recent advancements in research [10,11,12] have brought attention to the imperative of sustainable consumption through the application of sophisticated choice models and the lens of product equity. Scholars have increasingly recognized the intricate interplay between consumer choices and the environmental consequences of those decisions. Choice models, leveraging techniques such as discrete choice experiments and conjoint analysis, have emerged as powerful tools to dissect the preferences and decision-making processes underlying sustainable consumption patterns.
Product equity has been defined by Farquhar [13] as the additional value instilled in a product by attributing it a specific brand name. Due to the recent recognition of a product as an asset and its value contribution to the firm productivity policy, questions regarding how to define product value and how to measure it have become a serious matter in academic and industrial research. According to Keller and Lehmann [14], “Product equity is the differential effect that product knowledge has on consumer response to the marketing of that product”. This definition highlights the power of brand knowledge in influencing consumer behavior and preferences. Pappu and Quester [15] emphasize that “customer-based brand equity (CBBE) can be regarded as the differential response of consumers toward a focal branded product compared to their response to an unbranded (or differently branded) version of the same product, and this differential response is a function of the customers’ knowledge of the brand”.
Product value (equity) is a controversial subject since there were many approaches and views regarding how to define it. However, there are two perspectives from which to consider this concept in general: the value of the product to the firm and the value of the product to the consumer.
In our work, we take a consumer perspective, for which the product name can be defined as the collection of the concepts that a consumer learns to associate with a certain product (represented by the product). It is very obvious in this context that product value has many implications when there is an extension of one product to many under different product names. The measurement of product equity can be carried out through the utility and preferences that the consumer attaches to the product name within the framework of choice model.
We divided all studies about the value of the product to the consumer into two large groups. The first group is represented by research about contribution of producting to physical products, such as Tauber [16], Aaker and Keller [17], and Schlossberg [18]. These researchers consider the product name as a collection of concepts. They also study the associations of consumers in response to product name and finally talk about the product extension across several products. They extend the idea of product formation of Levitt and see the product name as a multi-faceted symbol that consumers come to associate with specific concepts through their interactions and experiences with that product. According to Aaker and Keller [17], when judging the launch of a new product extension, consumers are likely to be more accepting if they perceive a degree of congruence in terms of product compatibility or shared attributes. That is to say, if a company, already known for a specific product type or set of values, offers a new product that aligns closely with that existing image, consumers are apt to respond more positively. Keller and Lehmann [14] have continued to build on earlier work, considering a brand name as a collection of concepts. They explored consumer associations related to brand names and brand extensions across multiple products. Brand name functions as a collection of ideas that consumers link to a product. When a corporation grows its product line, it leverages these familiar brand names across new product categories within their portfolio, effectively maximizing their most significant assets—consumer recognition, positive sentiment, and the impressions linked to the brand name.
The second group is represented by researchers such as Louviere and Johnson [19], Yovovich [20], and Sharkey [21] who measure the value or usefulness that consumers assign to product names directly. This is achieved through conjoint analysis where consumers evaluate combinations of product attributes and product names. The exposed preferences are then disassembled into two parts: the utility linked to the product attributes and the value associated with the product names. Tybout and Hauser [22] use the model of consumer decision making developed by Hauser and Urban [23] and apply it to the marketing audit for mature product with the purpose of identifying further actions that can increase profitability. Shocker and Srinivasan [24] review main models existing at that time with the purpose of increasing implementability of marketing concepts, permitting consumer inputs to be used at the earliest stages in the development and selection of marketing strategies. Kamakura and Russell [25] adopt the theoretical model of consumer decision making discussed by Tybout and Hauser. Andrews, Luo, Fang, and Ghose [26] explored how online channels can be utilized to measure and influence brand equity. These studies often employ conjoint analysis, wherein consumers rate combinations of product features and brand names, with the resulting preferences being broken down into utility linked to product features and value assigned to brand names.
More recent research, such as that by Gensler, Völckner, and Egger [27], has re-evaluated and expanded upon existing models to improve the implementation of marketing concepts and better integrate consumer input during early stages of marketing strategy development and selection. In the realm of consumer decision making, innovative studies like Netzer, Lattin, and Srinivasan [28] and Schweidel, Park, and Jamal [29] have taken previous models into account and further explored the factors that determine consumer preferences and brand choice, revolutionizing the way marketers approach customer engagement and brand positioning. He and Calder [30] used respondent-driven sampling to investigate consumer responses to varying levels of brand equity.
In Section 3, we delve into the fundamental models and principles used to calculate product equity. Section 3 is dedicated to the application of these models, specifically on the appraisal of products through the lens of the consumer choice paradigm. Utilizing these evaluations, we shed light on product performance in Section 4. This section particularly focuses on measurable aspects of a brand, with an emphasis on the sustainability-centric attributes tied to laundry detergents.

3. Materials and Methods

3.1. Research Model

Choice modeling offers a sophisticated means of estimating the value of a brand by dissecting and quantifying the attributes that influence consumer decisions. It is necessary in order to identify consumer preferences and the trade-offs consumers make during the purchase process. Understanding these preferences is critical for managing brand value. By identifying the attributes most valued by consumers, businesses can ascertain how their brand and products stand out from competitors, allowing them to strategically emphasize these unique features in marketing efforts. Choice modeling can indicate how sensitive customers are to price changes of goods or services and how those changes affect the perceived value of a brand. It is essential for aligning product development with consumer desires and forecasting how new products or changes to existing products will impact brand value. Choice modeling helps to reveal different consumer segments based on their preferences, aiding in tailored brand strategies for diverse markets. Understanding which aspects of a brand drive consumer choices enables companies to optimize their marketing mix—product, price, place, and promotion. In the context of choice modeling, “brand value” refers to the utility or valuation that consumers place on not just the tangible aspects of a product or service (“brand tangible value—BTV”) but also the intangible elements associated with a brand itself (“brand intangible value—BIV”). The purpose is to decompose the brand’s value into discernible factors—like quality, reputation, and emotional connection—that influence consumer selection among competitive alternatives. Normally, in order to evaluate the brand value, the surveys or experiments are made that mimic the marketplace decisions in which consumers choose among different brands with varying levels of attributes. In our study, we use panel scanner data on consumer choices made among different product offerings. These choices include various attributes and levels, including brand as one of the choice factors. Using statistical modeling, the utility values are estimated for each attribute and level in the study. The greater the utility, the more preferred the attribute level. The model quantifies the relative importance of each attribute (including the brand) in the decision-making process. The value of the brand is construed as the part of the utility that can be attributed to the brand itself, separated from the product or service’s attributes. It becomes a quantifiable metric that indicates how much the brand name adds to the product’s desirability. The brand value, is determined by utility scores specifically attributed to the “Brand name” variable. We compare the utility scores of one brand against those of competing brands. The higher the utility score for a brand, the higher its brand value in the eyes of the consumer. If it turns out that “brand name” as an attribute carries significant weight in the utility model and the brand scores well, it suggests that this brand is strong and contributes positively to consumer choice. If not, there may be work to do on brand perception. Moreover, comparing the utility scores (and thus brand value) can show how changes in other attributes can potentially raise the brand’s value. Based on the findings, if the brand has a high value, a company might decide to leverage this by expanding presence or increasing prices slightly; if brand value is lower than desired, a company may need to invest in marketing or improve the attributes that drive choice (like customer service or product quality). Continuous or periodic choice modeling studies can track changes in brand value over time, helping a company measure the impact of brand strategies and make adjustments as needed. This entire process not only helps to quantify the brand value of each brand in the choice set but also guides management in making informed decisions to maximize that value through strategic business and marketing actions.
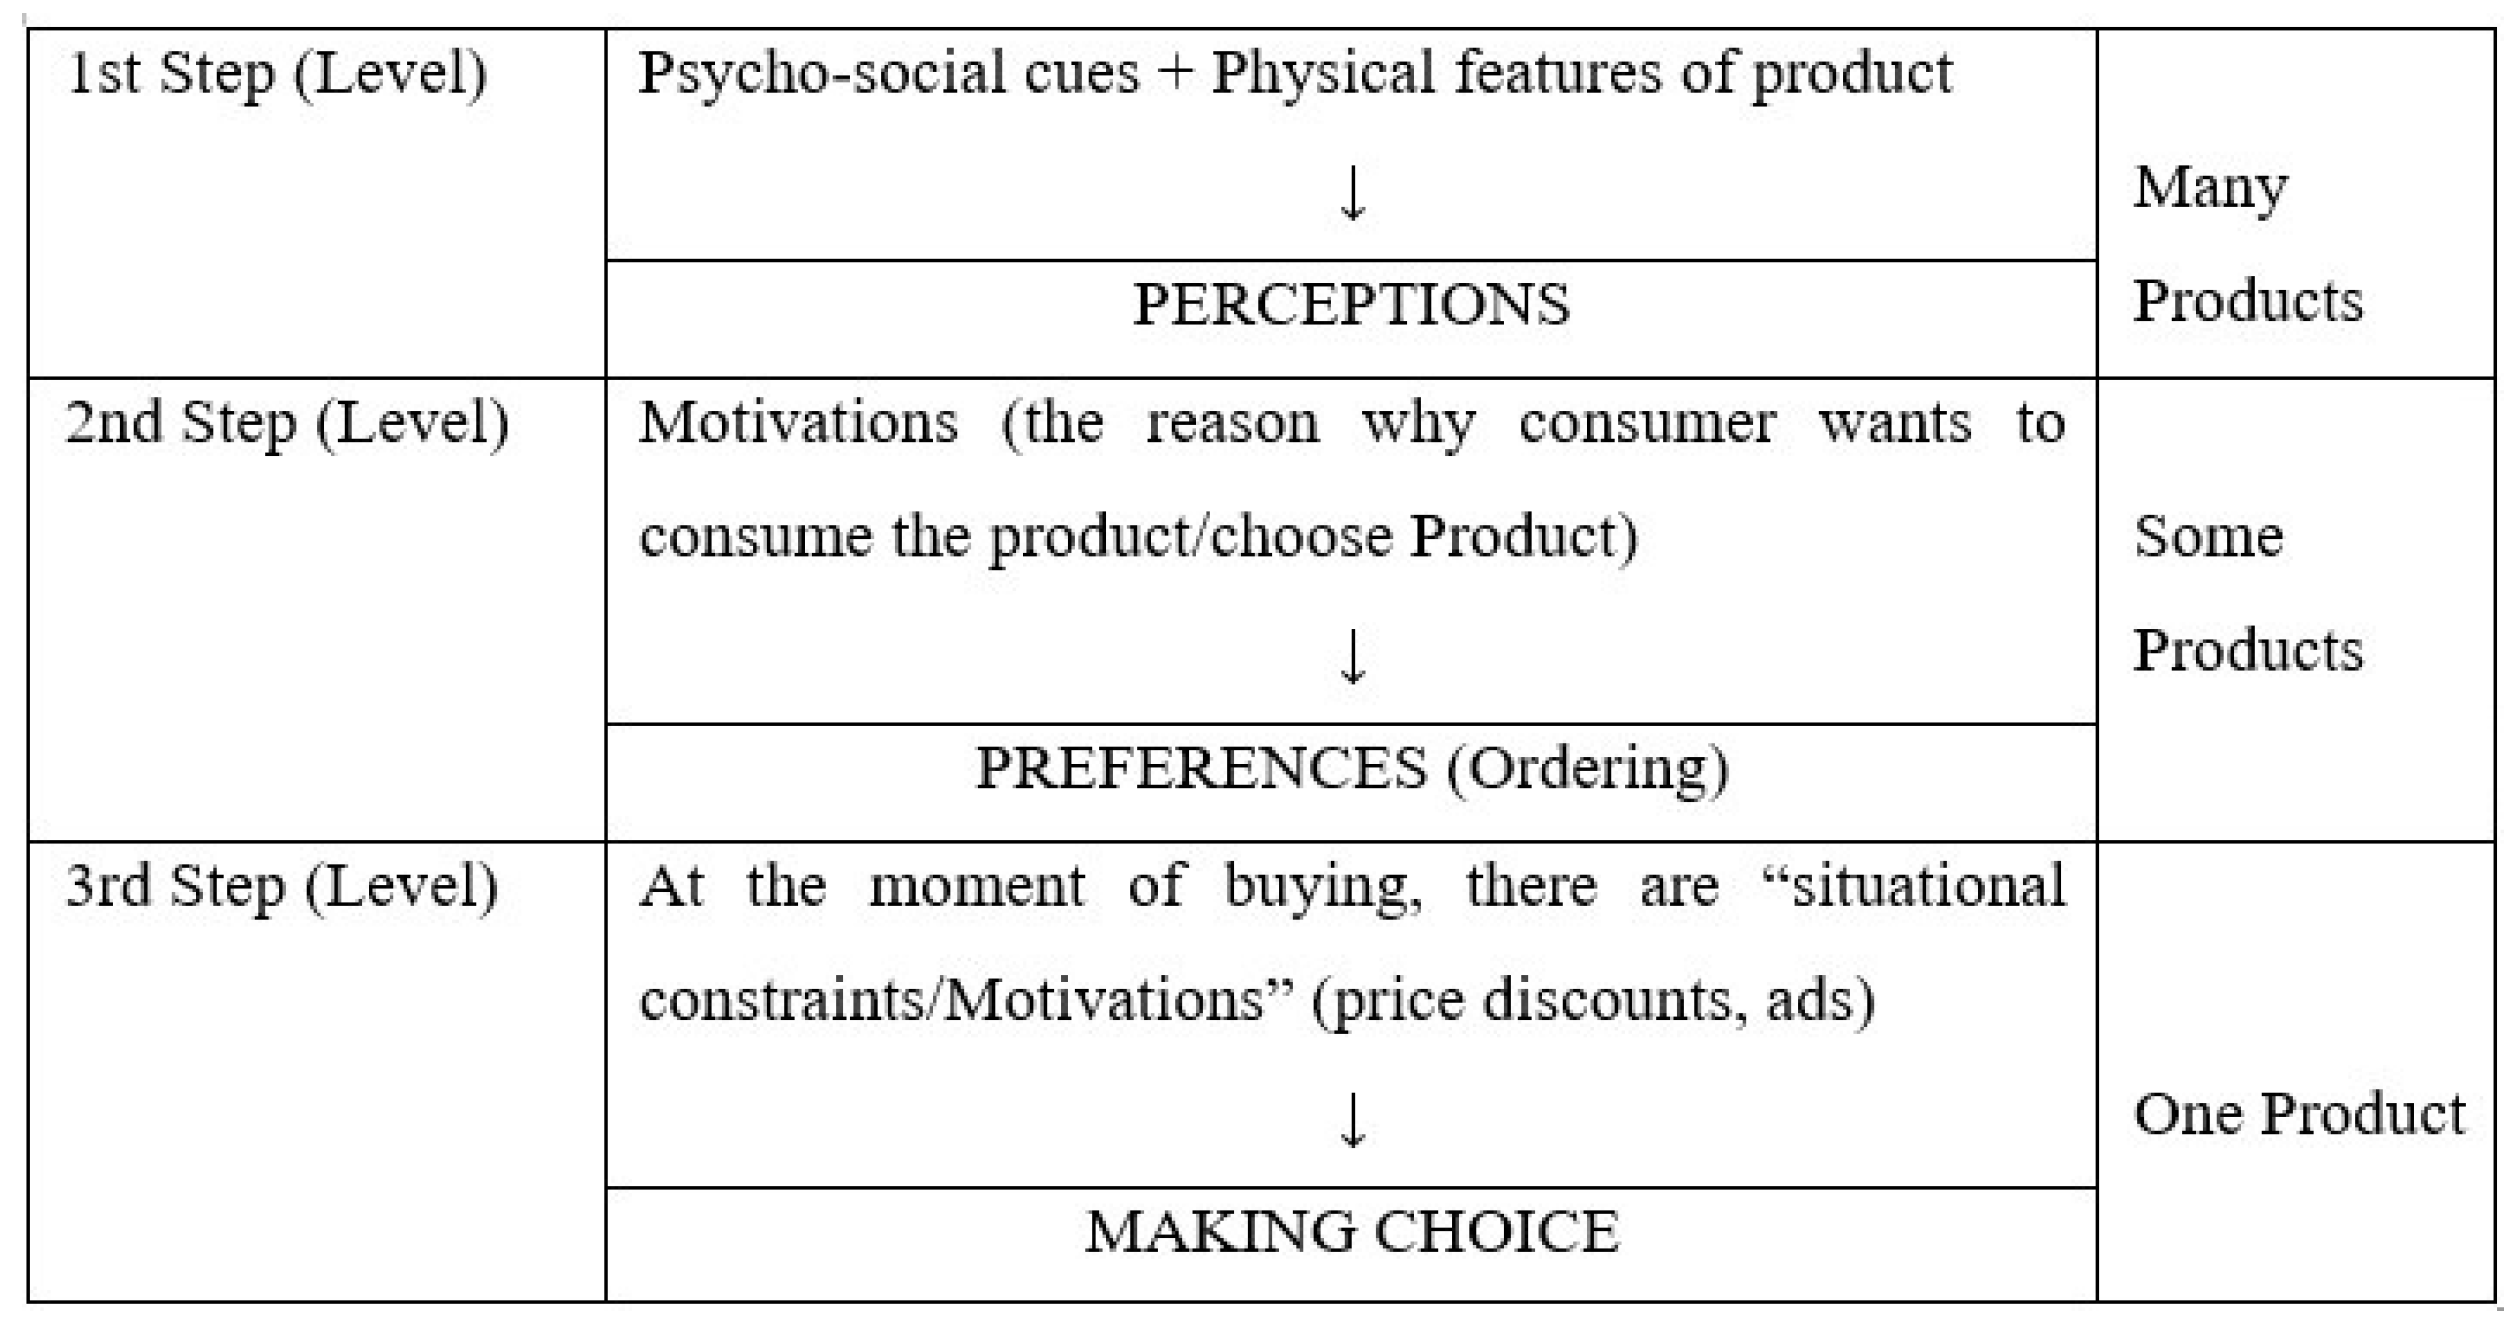
In order to see the formation of a product’s tangible and intangible value, we will present three steps leading to choice of a consumer, within which the distinction between two measures should become clear. The conceptual framework for conceptualizing consumer choices is revealed in Figure 1.
The initial stage starts with the evaluation of a product’s physical attributes and the psychological and social aspects of the consumer. Tybout and Hauser suggest that Brunswik’s model can be utilized to understand the connection between these attributes and the resultant subjective assessments or perceptions [31]. According to this model, physical features r of the product, such as (in our case) concentration of surface-active agent (S.A.A.), presence of bleach in the laundry detergent, as well as the type of package, the amount of detergent needed for 30 L of water, and net weight of the detergent in the package, form the fundamentals for consumers’ perception ( Y h ) of the detergent washing power of the detergent product j. A physical feature does not necessarily lead to a unique perception but contributes to the different perceptions in different ways. Determining the effect of non-physical aspects of a product on consumer perceptions can be challenging due to the sheer volume of such cues and their subjectivity at the individual level.
A product j has R physical features D j r ( r = 1 , 2 , , R ) . For a consumer h, their perception is formulated as a function of product j physical features and consumer h psychosocial cues. Hence, the perception Y h j q for the attribute q ( q = 1 , 2 , , Q ) by consumer h about product j is
Y h j q = r = 1 R w h r q D j r + v h j q ,
where Y h j q is the attribute perception for product j on an attribute q ( q = 1 , 2 , , Q ) for a consumer h, D j r is a product j’ s actual physical features R, w h r q —coefficients that represent the R physical characteristics of product j into its perceived attributes in a Q-dimensional attribute space—and v h j q is an error due to the perceptional distortions which arise in response to the psychosocial cues.
So, consumers form perceptions based on a combination of physical attributes ( r = 1 R w h r q D j r ) and a distortion of these attributes ( v h j q ). For example, consumers might form their perception of “washing power” attribute of a laundry detergent based upon the information that the consumer has about the physical features of a product (e.g., the amount of S.A.A. and bleach needed to wash dirty clothes) and upon advertisement of special cleaning substances that the product has.
In the second step, after collecting (which was performed in the initial step) all the attribute perceptions Y h j q q ( q = 1 , 2 , , Q ) , the consumer is going to order “by preference” these attributes using a weight factor θ q . So, we can (by addition) obtain the preferences of product j by consumer h as such:
P h j = q = 1 Q θ h q Y h j q + φ h j ,
where P h j are the preferences for product j by a consumer h, θ h q is the relative importance assigned to each perceived attribute q by a consumer h, and φ h j is a factor in the preferences which is not contained in the attribute perceptions Y h j q of product j.
These importance weights θ h q reflect how consumer h translates their perceptions of the available products into preferences.
At this stage, the “engineering parameters”, which relate the physical characteristics of the product to the consumer’s evaluation of the product, are denoted as
δ h r = q = 1 Q w h r q θ h q
The coefficients δ h r are not attribute importance weights.
The intangible part of the product’s value, which arises from different product associations and perceptual distortions, is denoted as
φ h j = φ h j + q = 1 Q ( θ h q v h j q ) ,
where φ h j is a factor in the preferences which is not contained in the attribute perceptions Y h j q of product j and q = 1 Q ( θ h q v h j q ) is a factor in the preferences, which is based on importance weights of perceived attribute, such as “washing power”, “bleaching power”, and “amount of foam”, and perceptional distortions that emerge as a reaction to psychosocial signals, for example, to the advertising about those attributes.
As a result, we obtain a product j’s value for a consumer h decomposed into a tangible component ( r = 1 R δ h r D j r ), which is directly linked to the physical characteristics of the product, and an intangible part ( φ h j ), which emerges from misconceptions and other associations related to the product.
Summarizing, we obtain
α h j = φ h j + r = 1 R δ h r D j r ,
which is defined in terms of product value as
B V h j = B I V h j + B T V h j ,
and aggregated for all consumers.
Following K-R, we should notice that φ h j is unobservable for each consumer h, so we need to respecify α h j as follows
α h j = γ j + r = 1 R δ h r D j r + ω h j ,
where γ j is the market-wide product j intangible value, common for all consumers, and ω h j is an aggregation error, indicating the diversity among consumers, such that
φ h j = γ j + ω h j ,
where
γ j = s f s φ s j ,
and f s is the size of segment as s = { h } and f s = 1 / H
Thereby, we can define the product value as
B I V j = γ j ,
and
B T V j = h f h B T V h j ,
such that
B T V h j = r = q R δ h r ^ D j r
The third step consists of a choice; when adding to the product value, the consumer h will consider constraints about product j at time of choosing t (or other products) to make the final choice and hence to give to a product j the final value from the consumer standpoint.
The main hypothesis that motivates our model developed in this paper is that the choice of the brand is explained by physical attributes of products, social characteristics of the consumer, and situational factors (such as promotions).

3.2. An Empirical Study

We applied the proposed product value measures to six powder laundry detergent products in Japan. Our data comprise two data types differing in their nature: scan panel data and product attribute data.
Our scan panel data consist of scanner records for household purchases of six primary products of detergent over 100 weeks during 3 years (2014–2016) for 98 households. Altogether there are 10,000 observations. This number also includes the observations when the concerned products were not purchased, and thus we exclude them from our analysis. The data were collected by a Japanese marketing research company conducting audience measurement for television and radio—Video Research, Ltd. (Tokyo, Japan).
Our final dataset covers 730 purchases made by 98 households in one market. These purchase data include the name of the product chosen and marketing mix variables such as
  • Each household’s television advertising exposure;
  • Each household’s advertising leaflet exposure;
  • Binary data on in-store promotion (display) when a purchase has been observed;
  • Price for each product at the time of purchase.
A summary of the products with respect to the key variables used in our analysis is presented in Table 1.
Product attribute data consist of such attributes as the amount of surface-active agent (%) and bleach (binary), as well as type of package, standard amount of the detergent for 30 L, and net weight. Values are presented in Table 2.
For covariates, we use the following variables: price, in-store promotion, and product attributes.
The scan panel dataset contains no demographic data for respective households, e.g., income, family size, age, and gender. Instead of these data, our study uses household-specific information, the total number of purchases over the period.
These datasets were supplied by Video Research Inc., Tokyo, Japan, and Japan Soap and Detergent Association.

4. Results

4.1. Empirical Results

4.1.1. Model Parameter Estimation Results

In the first stage of our data analysis, we estimated the parameters of the multinomial model.
Table 3 shows that the posterior mean of consumer’s parameter estimates, the standard deviation, and the number of consumers with statistically significant estimate tested by 95% HPD regions (the last two columns denote the number of consumers with positive and negative signs of their parameter estimates). We can stipulate that all the parameter estimates are statistically significant for almost all the sampled consumers. All of the 98 consumers have statistically significant price estimates and react negatively, as expected, to the price. The negative mean here is quite large and indicates an inverse relationship between price and the probability of a product being chosen, i.e., as price increases, the likelihood of choosing the product decreases. The negative impact of the price is significant and has relatively low uncertainty. The positive mean of the display suggests that more prominent display of products is associated with a higher probability of customers choosing the product, with a moderate amount of certainty (as reflected by the quite low standard deviation compared to the mean). Only two consumers have a negative response to display, but those estimates are not significant.
As for the intercept parameters, a similar conclusion can be made regarding the statistical significance of their estimates over the whole sample of consumers. All products have positive effects, suggesting they are all associated with rather high choice probability. However, the standard deviations are relatively large compared to the means, indicating substantial uncertainty about these estimates. However, negative estimated values are recorded for a number of consumers; for instance, 30 units, over 25% of the sample size, have a negative value of the intercept estimate for product 4. For product 4, the HPD (+) is 67, which is lower than others, meaning that the estimate for this product attribute is less consistently positive than for others. This might signify that it has lesser predictive power or a weaker association with choice.
As for the products, the largest estimate of intercepts is 2.514, for product 1. The smallest is 1.173 for product 4, which is 2.14 times smaller than that of product 1.
Figure 2 illustrates histograms of each households’ Bayes estimates of market response parameters. Shapes of these distributions are not unimodial. The posterior distribution shows some graphs where there is a concentration or kind of clustering of the values of parameters around some points, which confirms the heterogeneity. In addition, all households have a negative response to the price, and these results are statistically significant. As for the display, two households show a negative reaction to this type of promotion.

4.1.2. Hierarchy Level 1 Estimation Results

Table 4 shows that the posterior mean of attributes estimates and the number of households having a statistically significant estimate tested by 95% HPD regions, with the number of households for which HPD is positive and negative. Investigating these estimation results, we can notice that the number of households who have statistically significant response to the attributes differs from attribute to attribute, but stays large enough that the assumption of heterogeneity can be verified and valid.
Regarding the average of estimates for the attributes, the highest is 1.195 of net-w (net weight of the detergent in the box). The lowest is −0.009 for g/30 L (gram of detergent for 30 L of water). In the case of g/30 L, if consumer has to use more detergent for 30 L, he will tend to have less utility for the detergent product with such a type of attribute.
As mentioned above, our dataset does not contain basic demographic information such as income and number of family members. However, we use a household-specific variable—total number of purchases. This variable is used for exploratory analysis. The relationship between households’ market response parameters and products’ estimates and household-specific information is summarized in Table 5. The relationship between the attributes and household-specific information is summarized in Table 6.
Table 5 presents estimation results of hierarchical model. The parameter on total number of purchase for product 3 is estimated as a negative value (−0.040), which indicates that the household that purchases product 3 has a negative reaction to it. From the estimate of parameter for the relation between display and price with the total number of purchase, we observe that a household negatively responds to display and price.

4.1.3. Hierarchy Level 2 Estimation Results

The relationship between the attributes and household-specific information is summarized in Table 6.

4.2. Interpretation of the Empirical Results

4.2.1. Estimates of Intercept Parameters

Figure 3 portrays histograms of households’ Bayes estimates of intercept parameters.
These distributions are important for measuring product value. The hypothesis of heterogeneity is confirmed as it shows that these distributions are not always unimodial. Moreover, the product for which the number of households with a negative reaction to the product value is the highest is product 4 (30 out of 98), and that with the lowest is product 1 (8 out of 98). Estimates of product 1, which has the largest average household estimate, are of −1.939–5.726; those of product 4, which has the smallest average household estimate, are −5.014–5.686.

4.2.2. Product Value Measurements

Product value market-wide measurements are computed by the following equation
B V j = s f s α s j ,
using the α s j estimates, whose posterior distributions are demonstrated in the previous subsection and reported in Table 4 as posterior means of the intercepts.
For the interpretation of the results, we use the following standardized B V j ^ , whose results are reported in Table 7. The standardization was conducted as follows: We have, by assumption, that
B V j h = B T V j h + B I V j h , j = 1 , . . . , 6 ,
then, we define
B V ˜ j h = B V j h B V h ¯ B T V ˜ j h = B T V j h B T V h ¯ ,
so that
B V ˜ j h j = 1 6 = 0 = B T V ˜ j h j = 1 6 = 0 + B I V ˜ j h j = 1 6 = 0 , h = 1 , . . . , 98
Then in order to get B V ˜ j , for the product j and for the whole market
B V ˜ j = h = 1 H B V ˜ j h / H , for all j
and accordingly
B T V ˜ j = h = 1 H B V ˜ j h / H , for all j B I V ˜ j = B V ˜ j B T V ˜ j , for all j
The measures of B V ˜ j are displayed in Table 7, and the estimates of B V almost correspond to the choice shares of consumers in the real market, except for product 5 and 6, proving that in principle the indicator of brand value from the consumer performs well while consolidating much more information from the market as a simple market (choice) share.
We have to pay special attention to the B T V values as they do not correspond to the choice shares, meaning that the consumers might not be particularly aware of the laundry detergent product specifications written on the packaging and rather make their choices based on non-physical product-related attributes such as price and advertising.

5. Discussion

In our approach, we followed the framework proposed by Kamakura and Russell (K-R); however, in our model, there are a few key advancements that need to be highlighted.
Unlike K-R’s logit specification, our model leans on a probit framework, where the random variable in the utility equation follows a normal distribution.
A significant distinction from the K-R model is that our approach accounts for heterogeneity at the individual consumer level rather than within consumer segments. This shift means moving from a finite mixture to a continuous one, with “s” envisaged to approach “h” in magnitude.
The concept of product value is especially relevant, where it serves as a diagnostic instrument to assess the overall performance of a product, incorporating both its tangible and intangible aspects. An uncomplicated ranking of products based on market shares does not necessarily illuminate the explanations behind a product’s particular performance level.
In the grand scheme of the environment, laundry detergents may seem a trivial factor. Yet, they harbor the significant possibility to enhance the sustainability quotient of our daily habits. By transitioning to environmentally conscious substitutes, embracing sustainable laundry habits, and critically examining packaging options, we can collectively contribute to the safeguarding of our planet for the generations yet to come.

6. Conclusions

6.1. Contributions

We believe that the concept of product value offers a new perspective. It aims to provide managers or analysts with alternate metrics to evaluate product performance by taking into account the fundamental factors behind market share variations.
BV has been fine-tuned to account for immediate circumstances, such as temporary pricing fluctuations and product placement. B I V implements a measure that adjusts not only for immediate circumstances but also accommodates the physical attributes of the product. B I V serves as a tool that supplies insights into intangible factors like advertising and channel strength, contributing to the development of a robust product. B I V quantifies the elusive aspects that are challenging for rivals to undermine. In this sense, B I V can be more important than B V itself.
In this study, we developed behavior-centered metrics of product equity for individual consumers. Our employed approach relies on the use of residual data, which gauges the consumer-attributed value to a product based on the choice patterns reflected in scanner data—a representation of consumer behavior in the marketplace.
Product value serves as a gauge of the inherent worth or utility a product holds for its consumers, once extraneous situational elements are accounted for and subtracted. Comprising both tangible and intangible components, product value seeks to quantify the core allure a product possesses to consumers.
B I V , though the product value metric, is undeniably valuable; it behooves us to use it with caution. This is primarily due to its basis in residual utility measurement, whereby its authenticity is directly influenced by the way product value gets delineated within the choice model. Furthermore, its reliance on a specific suite of physical attributes meant to gauge the tangible aspects of the product also mandates discerning application. Thus, while powerful, the tool should be employed judiciously to ensure accurate and appropriate interpretations.
This technique’s limitation primarily lies in its suitability for products with a substantial presence of product-related attribute associations. The reason being, it struggles to differentiate between varying non-product-related attribute associations. As a consequence, its strategic decision-making utility becomes considerably reduced in different circumstances.
In essence, this approach represents a “static” perception of product equity, a stark comparison to the “process” view. In this latter perspective, consumer responses are understood concerning perceptions, preferences, and behaviors in response to diverse marketing activities. Our methodology’s beneficial advancement would be to cultivate this “process” understanding. Such advances promise fresh instruments to explore product equity’s underpinnings, expanding the consumer-based product equity framework that accentuates the need to utilize an array of research techniques to fully grasp the diverse potential sources and outcomes of product equity.

6.2. Applications

One of the fundamental applications of product choice models is in shaping educational and awareness campaigns. By identifying the factors that drive consumer preferences, marketers can develop targeted messaging that educates consumers about the benefits of choosing sustainable detergents. This proactive approach aids in demystifying the misconceptions surrounding eco-friendly products and encourages widespread adoption.
The methods and conclusions presented in the study offer valuable insights that can be practically applied in the business realm, particularly within the laundry detergent industry. The research, which involves analyzing consumer preferences and behaviors, can guide companies in developing sustainable laundry detergent products that align with consumer values. By understanding the factors that influence consumer choices, businesses can tailor their marketing strategies to highlight the sustainable aspects of their products. Moreover, the findings may inform product innovation, helping companies design environmentally friendly formulations or packaging that appeal to eco-conscious consumers. Implementing the insights gained from choice modeling can also aid in optimizing pricing strategies, ensuring that consumers perceive the value of sustainable features in relation to the cost. Ultimately, the practical application of these methods can enhance a company’s competitive edge by aligning their laundry detergent offerings with the growing demand for sustainable and environmentally friendly products in the market.

6.3. Limitations

The present study is not immune to certain methodological limitations that warrant acknowledgment and consideration in the interpretation of the findings. Firstly, a notable limitation arises from the relatively modest size of the dataset under examination. The small sample size may constrain the generalizability of the study outcomes to broader consumer populations, necessitating caution in extrapolating the observed trends and behaviors. Furthermore, the dataset is characterized by a limited inclusion of marketing parameters, which may curtail the comprehensiveness of the analysis. The absence of a more extensive array of marketing variables could potentially restrict the depth of insights into the multifaceted determinants of consumer choices in the context of sustainable laundry detergent consumption. It is imperative to recognize these constraints when contextualizing the study’s outcomes and to consider them as avenues for future research endeavors aimed at enhancing the robustness and applicability of findings within a broader empirical landscape.

Author Contributions

Conceptualization, M.K.; methodology, M.K., N.M. and A.C.; software, N.M.; validation, M.K. and A.C.; formal analysis, V.P.; investigation, A.C.; resources, N.M.; data curation, N.M.; supervision, V.P. All authors have read and agreed to the published version of the manuscript.

Funding

This research was funded by the Ministry of Science and Higher Education of the Russian Federation, grant number FSSW-2023-0004.

Data Availability Statement

Data are contained within the article.

Acknowledgments

The authors would like to express gratitude to Terui, N. (Tokyo University of Science, Japan) for his insightful guidance and expertise during the process of the development of the conceptual framework of this research.

Conflicts of Interest

The authors declare no conflict of interest.

References

  1. Miilunpalo, S.M.; Räisänen, R. Clean Laundry with Pure Conscience—A Study on Laundry Practices Among Finnish Consumers. Int. J. Consum. Stud. 2018, 43, 153–165. [Google Scholar] [CrossRef]
  2. Laitala, K.; Klepp, I.; Boks, C. Changing Laundry Habits in Norway. Int. IJC 2012, 36, 228–237. [Google Scholar] [CrossRef]
  3. Tomsic, B.; Ofentavšek, L.; Fink, R. Toward sustainable household laundry. Washing quality vs. environmental impacts. Int. J. Environ. Health Res. 2023, 1–12, online ahead of print. [Google Scholar] [CrossRef]
  4. Nawaz, T.; Sengupta, S. Silver Recovery from Laundry Washwater: The Role of Detergent Chemistry. Acs Sustain. Chem. Eng. 2017, 6, 600–608. [Google Scholar] [CrossRef]
  5. Järvi, P.; Paloviita, A. Product-related information for sustainable use of laundry detergents in Finnish households. J. Clean. Prod. 2007, 15, 681–689. [Google Scholar] [CrossRef]
  6. Saija, M.E.; Daniotti, S.; Bosco, D.; Re, I. A Choice Experiment Model for Sustainable Consumer Goods: A Systematic Literature Review and Workflow Design. Sustainability 2023, 15, 13183. [Google Scholar] [CrossRef]
  7. Grilli, G.; Ferrini, S. Discrete choice modeling in environmental and energy decision-making: An introduction to the special issue. J. Environ. Plan. Manag. 2022, 65, 1203–1209. [Google Scholar] [CrossRef]
  8. Levitt, T. Marketing Imagination: New; Simon and Schuster: New York, NY, USA, 1986. [Google Scholar]
  9. Doyle, P. Building successful brands: The strategic options. J. Mark. Manag. 1990, 5, 77–95. [Google Scholar] [CrossRef]
  10. Guillen-Royo, M. Sustainable consumption and wellbeing: Does on-line shopping matter? J. Clean. Prod. 2019, 229, 1112–1124. [Google Scholar] [CrossRef]
  11. Fischer, M.; Foord, D.; Frecè, J.; Hillebrand, K.; Kissling-Naef, I.; Meili, R.; Brechbuehler Peskova, M.; Risi, D.; Schmidpeter, R.; Stucki, T. Sustainable Consumption. In Sustainable Business. SpringerBriefs in Business; Springer Nature: London, UK, 2023; pp. 105–116. [Google Scholar]
  12. Ki, C.W.; Li, C.; Chenn, A.; Chong, S.; Cho, E. Wise consumer choices in online secondhand luxury (OSHL) shopping: An integrated model of motivations, attitudes, and purchase intentions for OSHL as wise, conspicuous, and sustainable consumption. J. Retail. Consum. Serv. 2024, 76, 103571. [Google Scholar] [CrossRef]
  13. Farquhar, P.H. Managing brand equity. Mark. Res. 1989, 1, 24–33. [Google Scholar]
  14. Keller, K.L.; Lehmann, D.R. Brands and Branding: Research Findings and Future Priorities. Mark. Sci. 2006, 25, 740–759. [Google Scholar] [CrossRef]
  15. Pappu, R.; Quester, P. How does brand innovativeness affect brand loyalty? Eur. J. Mark. 2016, 50, 1–43. [Google Scholar] [CrossRef]
  16. Tauber, E.M. Brand franchise extension: New product benefits from existing Brand Names. Bus. Horizons 1981, 24, 36–41. [Google Scholar] [CrossRef]
  17. Aaker, D.A.; Keller, K.L. Consumer Evaluations of Brand Extensions. J. Mark. 1990, 54, 27–41. [Google Scholar] [CrossRef]
  18. Schlossberg, H. Brand Value Can Be Worth More Than Physical Assets: Key Factor Is How Much Income Is Derived from the Name. Mark. News 1990, 24, 6. [Google Scholar]
  19. Louviere, J.R.J. Measuring Brand Image with Conjoint Analysis and choice Models. J. Retail. Consum. Serv. 1994, 1, 21–29. [Google Scholar] [CrossRef]
  20. Yovovich, B.G. What Is a Brand Really Worth? Adweek’s Marketing Week: New York, NY, USA, 1988; Volume 8, pp. 18–20. [Google Scholar]
  21. Lazarsfeld, P.F.; Berelson, B.; Gaudet, H. The People’s Choice; Adweek’s Marketing Week: New York, NY, USA, 1989; pp. 6–10. [Google Scholar]
  22. Tybout, A.M.; Hauser, J.R. A Marketing Audit using a Conceptual Model of Consumer Behavior: Application and Evaluation. J. Mark. 1981, 45, 82–101. [Google Scholar] [CrossRef]
  23. Hauser, J.R.; Urban, G.L. A Normative Methodology for Modeling Consumer Response to Innovation. Oper. Res. 1977, 25, 579–619. [Google Scholar] [CrossRef]
  24. Shocker, A.D.; Srinivasan, V. Multiattribute Approaches for Product Concept Evaluation and Generation: A Critical Review. J. Mark. Res. 1979, 16, 159–180. [Google Scholar] [CrossRef]
  25. Kamakura, W.A.; Russell, G.J. Measuring brand value with scanner data. Int. J. Res. Mark. 1993, 10, 9–22. [Google Scholar] [CrossRef]
  26. Andrews, M.; Luo, X.; Fang, Z.; Ghose, A. Mobile Ad Effectiveness: Hyper-Contextual Targeting with Crowdedness. Mark. Sci. 2016, 35, 218–233. [Google Scholar] [CrossRef]
  27. Egbert, H.; Greiff, M.; Xhangolli, K. Pay What You Want Pricing (PWYW) ex post Consumption: A Sales Strategy for Experience Goods. J. Innov. Econ. Manag. 2015, 16, 249–264. [Google Scholar] [CrossRef]
  28. Netzer, O.; Lattin, J. A Hidden Markov Model of Customer Relationship Dynamics. Mark. Sci. 2008, 27, 185–204. [Google Scholar] [CrossRef]
  29. Schweidel, D.; Park, Y.H.; Jamal, Z. A Multiactivity Latent Attrition Model for Customer Base Analysis. Mark. Sci. 2014, 33, 273–286. [Google Scholar] [CrossRef]
  30. He, J.; Calder, B.J. The experimental evaluation of brand strength and brand value. J. Bus. Res. 2020, 115, 194–202. [Google Scholar] [CrossRef]
  31. Brunswik, E. The Conceptual Framework of Psychology. In International Encyclopedia of Unified Science; University of Chicago Press: Chicago, IL, USA, 1952. [Google Scholar]
Figure 1. Consumer decision-making model.
Sustainability 15 16949 g001
Figure 2. Posterior distributions of response parameters.
Sustainability 15 16949 g002
Figure 3. Posterior distributions of response parameters.
Sustainability 15 16949 g003
Table 1. Description of the laundry detergent scan panel data.
Laundry DetergentChoice ShareSum of Times of ExposureAverage Display RateAverage Price
Product 10.38216320.3640.662
Product 20.24111830.2780.712
Product 30.1339760.0650.763
Product 40.1224160.0420.823
Product 50.0691830.2260.919
Product 60.0535990.1390.919
Sample Size: 98 households, 70 weeks, 730 purchase occasions.
Table 2. Detergent attribute data.
Laundry DetergentS.A.A.BleachPackageg/30 LNet-W
Product 14201250.375
Product 24110250.75
Product 33911300.75
Product 43811250.75
Product 54010250.75
Product 64001250.75
Table 3. Detergent attribute data.
Posterior MeanS.D.HPD(+)(-)
Market Response Parameter
Display1.5230.61898962
Price−4.3310.63998098
Product 12.5141.67696897
Product 22.1881.846978710
Product 31.3131.674987919
Product 41.1732.258976730
Product 51.5291.939977819
Product 61.3581.659957817
Table 4. Hierarchical model estimation results for physical attributes.
Posterior MeanS.D.HPD(+)(-)
Constant−13.8770.900933657
S.A.A.0.3111.636935835
Bleach0.7593.303945935
Package0.6324.244955837
g/30l−0.0090.474945143
net-w1.19510.311955738
Table 5. Hierarchical model estimation results for 6 products, display and price.
Product 1Product 2Product 3Product 4Product 5Product 6DisplayPrice
Y j c
Constant−0.0690.8011.3250.8120.291−0.1502.557−3.261
(0.112) *(0.351)(0.452)(0.353)(0.213)(0.152)(0.630)(0.711)
θ ν
Total number of purchase0.3390.143−0.0400.0460.1650.218−0.139−0.144
(0.229)(0.149)(0.079)(0.086)(0.160)(0.184)(0.147)(0.148)
* ()…posterior standard deviation.
Table 6. Hierarchical model estimation results for attributes and demographic data.
ConstantS.A.A. BleachPackg/30 LNet-W
κ
Constant−4.3820.163−0.1020.052−0.0740.187
(6.058)(0.140)(0.314)(0.395)(0.049)(0.922)
ς
Total number of purchase−0.094−0.0070.0530.0240.0100.030
(0.746)(0.017)(0.037)(0.047)(0.006)(0.111)
Table 7. Product value measurements (with quantities scaled to their means).
BTVBIVBVChoice Share
Product 1−0.5711.4050.8350.382
Product 20.2990.2100.5090.241
Product 30.823−1.189−0.3660.133
Product 40.310−0.817−0.5060.122
Product 5−0.2110.061−0.1500.069
Product 6−0.6520.330−0.3210.053
BV = BIV + BTV. Note: The sum of BV, BTV, and BIV is adjusted to be zero when considering all products.
Disclaimer/Publisher’s Note: The statements, opinions and data contained in all publications are solely those of the individual author(s) and contributor(s) and not of MDPI and/or the editor(s). MDPI and/or the editor(s) disclaim responsibility for any injury to people or property resulting from any ideas, methods, instructions or products referred to in the content.

