Abstract
Foreign investment in renewable energy generation projects is a critical part of the Belt and Road Initiative. Under the background of the market economy, the electric energy will participate in power market competition among the countries along the line, and the sales revenue will be settled in the local currency. The exchange rate of the countries along the Belt and Road fluctuates frequently and widely, thereby posing significant risks to the investment income of the projects. To address this problem, this paper proposes the concept of Ek as the effective exchange rate expressed by the on-grid price, investment cost per kilowatt electricity generation equipment, and annual operating cost rate of unit power generation capacity. Moreover, this paper presents a model of power generation cost, income, and earning expressed by the real exchange rate. The flexibility formula of the fluctuation of power generation cost, income, profit, and internal rate of return relative(IRR) to Ek is derived, and the effect of exchange rate level and fluctuation on projects is analyzed. With the wind power projects invested by China in Pakistan taken as an example, the trend during the entire life cycle is calculated. The changes in net profit rate, IRR, and levelized cost of energy (LCOE) are calculated under Chinese currency appreciation of 10%, 20%, and 35% and 5% and 10% reduction of investment cost per unit. As the Chinese currency appreciates and the project IRR declines significantly, LCOE decreases slightly, but this decrease is not sufficient to compensate for the losses caused by the decline in IRR. The following effective measures are proposed to deal with the exchange rate fluctuation of foreign renewable energy generation projects: building energy Internet, reducing project cost, and using Chinese currency as the settlement currency. In this paper, a solution is provided for investments in renewable energy projects in regions where exchange rates fluctuate greatly.
1. Introduction
The Belt and Road Initiative (BRI) has promoted the deployment of renewable energy to achieve sustainability. It is essential to reveal the influence of renewable energy on low-carbon economic development [1]. The BRI involves many countries in Asia, Europe, and Africa, most of which are in the stage of industrialization take-off or rapid development, as well as countries such as Pakistan, Laos, Nepal, and Bangladesh that are backward in economic development, lack power and other infrastructure, and face energy shortages. The rapid industrialization of these countries has rapidly increased their demand for energy. However, due to insufficient national financial funds, lagging infrastructure construction, and backward energy development technology, their energy consumption is dominated by fossil energy, and rich clean energy resources have not been effectively developed. Countries and regions along the “Belt and Road” urgently need to improve their own clean energy development and utilization capacity, so as to more effectively improve energy security and reduce dependence on fossil energy to achieve sustainable development. Therefore, China’s foreign investment in renewable energy will continue to inject impetus into the green and low-carbon development of developing countries. Vigorously developing renewable energy is an important strategic measure to promote diversified and clean energy development and cultivate strategic emerging industries, as well as address the urgent need to protect the ecological environment, cope with climate change, and achieve sustainable development.
In 2015, the Paris Agreement issued by the Paris Climate Change Conference made arrangements for addressing global warming after 2020 (UNFCC 2015) [2]. The Paris Agreement aims to control the rise in global temperature lower than 2 °C relative to the pre-industrial period. To curb global warming, improving energy structure and promoting energy transition towards a clean and low-carbon mode has increasingly become an international consensus. To manage the impacts and minimize the risks of climate change, strong, rapid, and sustained global actions are imperative to limit emissions in the coming decades. Utilizing the two-step system generalized method of moments model is proposed, which evaluates the effects of climate aid on carbon emissions reduction and the impact mechanism through energy structure optimization [3]. Thus, the application and promotion of renewable energy become particularly important.
The countries along the Belt and Road have gradually become important destinations for investments in renewable energy (RE) generation projects by China. China invested in eight RE projects in Pakistan, India, and other countries in 2015 and 2016 [4]. With the international capital, large-scale RE bases will be built along the Belt and Road to meet the demand for clean power in local and neighboring countries, alleviate the energy crisis, and improve the quality of the environment. The International Renewable Energy Agency (IRENA) released the “RENEWABLE CAPACITY” in 2022 [5], which pointed out the total renewable energy of China, India, Pakistan, and other countries along the Belt and Road from 2012 to 2021, as shown in Table 1. In 2013, the concept of the Belt and Road was proposed. After the implementation of the concept in 2015, the total renewable energy of countries along the Belt and Road showed an increasing trend. In 2021, the total renewable energy of China increased by 337% compared with 2012, Pakistan increased by 180%, India by 243%, and Bangladesh by 195%. The International Energy Agency (IEA) released the report of the “Carbon Neutralization Road Map of China’s Energy System” in 2021 [6], which affirmed China’s contribution to the development of clean energy in the world.

Table 1.
Total amount of renewable energy in the Belt and Road countries (MW).
Ashwani et al. [7] reviewed the current situation, development, major achievements, and future development potential of RE in India and analyzed the existing policies to promote RE development. Most countries along the Belt and Road are developing countries whose exchange rates experience large and frequent fluctuations. Guiding enterprises to use the financial instruments available in the financial market to minimize exchange rate risk provides an important strategy [8]. Given the large investments in energy cooperation projects, project operating periods reaching up to 20 years, and the large number of stakeholders involved, including investors, energy producers, energy accommodation, and allocation countries, many risk factors such as exchange rate fluctuations exist. Therefore, economic analysis and risk assessment prior to project site selection and capacity are especially important. Ximei et al. [9] researched the existing risk factors such as policy, technology, and market in RE investment projects by using systematic dynamics. Through this model, the relationship between risk and return of renewable energy industry is analyzed, and a more reasonable investment decision is given. Perry [10] studied the key risk factors of RE investment enterprises by using a variable beta model. Their results showed that the growth in sales can reduce corporate risk, and the rise of oil price can increase corporate risk.
The allocation of resources by means of price is necessary for the sustainable and healthy development of RE power generation projects [11]. The economic analysis of RE projects includes the analysis of project IRR and levelized cost of energy (LCOE) by using data such as on-grid price, investment cost of power generation equipment, project operating cost rate, project repair cost rate, land lease price, loan interest rate, tariff rate, and VAT rate. Yujin et al. [12] constructed a cost model of fire coal, wind, and photovoltaic power generation with environmental and resource externalities and conducted an empirical analysis. Taking into account the initial investment cost, operation and maintenance cost, effective utilization hours of resources, loan interest rate, capital ratio, and industry-weighted average cost of capital (WACC), Xiaolu et al. [13] constructed an economic analysis model of RE power generation technology, analyzed the economics of African wind power bases, estimated the cost of African wind power and photovoltaic power generation and the transmission cost between Africa and Europe, and analyzed the economics of transmission between Africa and Europe. Martin et al. [14] proposed an LCOE analysis model and analyzed wind power projects, with the costs of the power plant such as the equipment investment cost, loan interest, operation and maintenance cost, tax payable, government subsidy, tax deduction, and land use fee taken into account. Qihe et al. [15] calculated the IRR of wind power, photovoltaic power plant, and distributed photovoltaic in China’s different provinces by using the LCOE model and analyzed the power plant size, clean energy accommodation and allocation, market competition, and other key problems in the grid parity era of new energy. Hao et al. [16] believed that the PVC method cannot accurately reflect the investment profitability of power generation projects. They then proposed a method of measuring the LCOE of wind power generation cost on the wind model and conducted sensitivity analysis of the selected wind turbines. Ximei et al. [17] proposed an LCOE model of wind power that is suitable for China. According to these researchers, the main factors that affect the cost of wind power generation include the utilization hours of the wind power plant, cost of power generation equipment per unit kilowatt hour, interest rate on long-term loans, and cost of operation and maintenance. In the literature [18,19,20], the economics of photovoltaic power generation was analyzed by using the LCOE model.
Many risks are present for foreign investment, which is why the risk factors for the economics analysis of RE projects need to be taken into account. The China Central Asia Multilateral Investment Agreement has been established and Chinese enterprises have been guided to change their energy investment mode to reduce the investment risk of Chinese enterprises in the energy industry in Central Asia. Hui [21], taking China’s direct investment in Central Asia as an example, pointed out that the energy systems and religious forces of each country aggravate the risks of foreign energy investment. Huiqing [22] summed up three types of risks in the foreign energy investment process (non-economic risk, economic risk, and internal risk of enterprises), analyzed the causes and measures of various risks, and proposed a strategy that will enable energy enterprises in China to control the risks of overseas investment on the basis of cases of large-scale energy enterprises in the United States and the United Kingdom. Hugo et al. [23] used the Iberian benchmark as an example to study the impact of market mechanisms, such as technological development, power ancillary services, labor, and carbon trading, on energy markets. Daniel et al. [24] assessed the value-at-risk and expected shortfall that emerges during the transition from traditional energy to RE by using backtesting techniques. Almona et al. [25], taking the transition to RE of the Boston area as an example, assessed the role of energy policy in promoting or impeding renewable energy by means of argumentative discourse. Shinji et al. [26] used Slovakia’s international trade expansion as an example and recommended that enterprises must properly assess exchange rate fluctuation risks and take appropriate measures to reduce corporate losses. On the basis of data from Japan’s foreign direct investment (FDI) panel for nine Asian economic entities from 1987 to 2008, Ivan et al. [27] found that FDI decreased as Japan devalued against host countries, and investment activity increased with exchange rate fluctuations. In this paper, the role of exchange rate and political environment in the decision-making for investments by multinational corporations in Japan was studied. Panel data analysis of 56 developed countries and developing countries from 1995 to 2012 shows that multinational corporations cannot bear the exchange rate risks and political risks of developing countries. Shamsuddin et al. [28] studied the determinants of FDI by using the single-equation econometric economic model of 36 developing economic entities. They found that market size, labor cost, and exchange rate stability were important factors that affect the site selection of FDI. Magali et al. [29] studied the impact of exchange rate fluctuations on FDI from developed economic entities and found that the large fluctuations in exchange rates impede the inflow of FDI.
The investment in clean energy investment projects is typically large, with 70%–80% of the investment amount being invested in the early stage of project construction. However, the project earnings need to be obtained year by year throughout approximately 20 years of the project life cycle. The exchange rate of each country’s currency against Chinese currency changes every day. The daily fluctuations of the US dollar, the Pakistan rupee (PKR), and the Kazakhstan tenge against Chinese currency during July to December 2019 are shown in Figure 1. As can be seen from the figure, the exchange rate fluctuation of the US dollar against Chinese currency is relatively stable with little fluctuation; the daily exchange rate fluctuation of the Kazakhstan tenge against Chinese currency is moderate; and the daily exchange rate fluctuation of the PKR against Chinese currency is large, with a maximum daily fluctuation range of −4.12%. The recent three-year exchange rate trend of the three currencies against Chinese currency is shown in Figure 2. The exchange rate fluctuation of the US dollar against Chinese currency is between 6.3% and 7.3%, while the exchange rate fluctuations of PKR and tenge against Chinese currency have a downward trend, with the exchange rate of PKR experiencing a sharp decline against Chinese currency. This finding shows that Chinese currency has been appreciating against the PKR and tenge in the past three years.
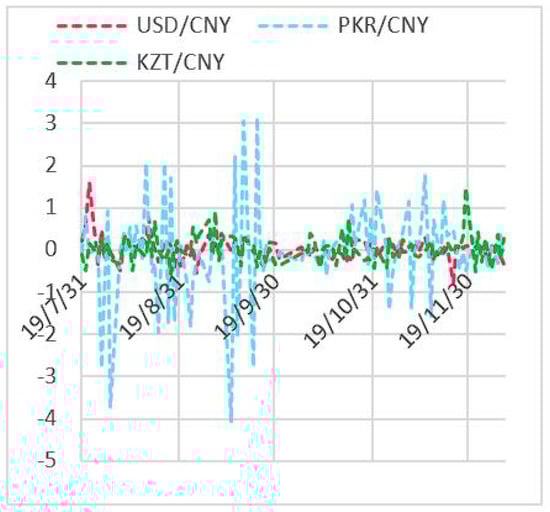
Figure 1.
Daily fluctuation chart of exchange rate from July to December 2019.
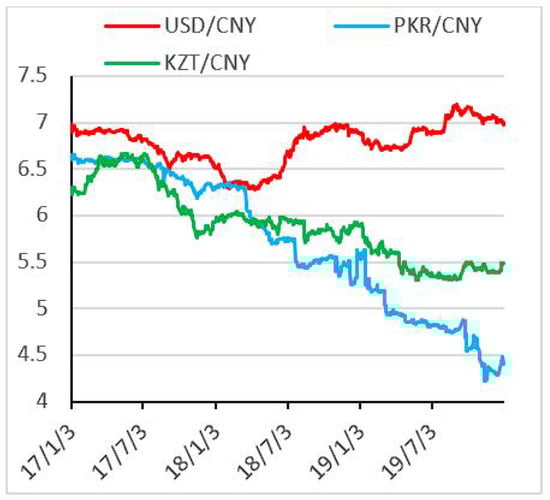
Figure 2.
Exchange rate trend of foreign currency/RMB in 2017–2019.
The annual fluctuation values of PKR, Indian rupee, Bangladesh kata, Kyrgyzstan com, and Kazakhstan tenge against Chinese currency in the past four years are listed in Table 2. As shown by the table, the exchange rate of the PKR against Chinese currency has decreased significantly year by year, with a decrease of 20.48% in 2018. The exchange rate of the Indian rupee against Chinese currency increased slightly in 2017 compared with that in 2016 and decreased slightly in 2018 and 2019. The exchange rate of the Bangladesh kata against Chinese currency decreased by 7.394% in 2017 compared with that in 2016, and slightly increased in 2018 and 2019. The exchange rate trend of the Kyrgyzstan com against Chinese currency is consistent with that of the Bangladesh kata. The exchange rate of the Kazakhstan tenge against Chinese currency shows a slight downward trend year by year.
Table 2.
Exchange rate levels and annual fluctuation values of foreign currency/Chinese currency in 2016–2019.
Pakistan, India, Bangladesh, and other countries are geographically close to China and have rich amounts of clean energy, but their power generation cannot meet their economic development, which is why they need to develop their power markets with the help of foreign powers. Therefore, they have become the important countries for clean energy power generation along the Belt and Road, in which China is investing. The clean energy Internet along the Belt and Road is constructed, as shown in Figure 3, to accumulate and allocate the abundant hydropower, photovoltaic power, and wind power in all countries; eliminate the power shortage in Pakistan, India, and Bangladesh; and greatly improve the environmental quality.
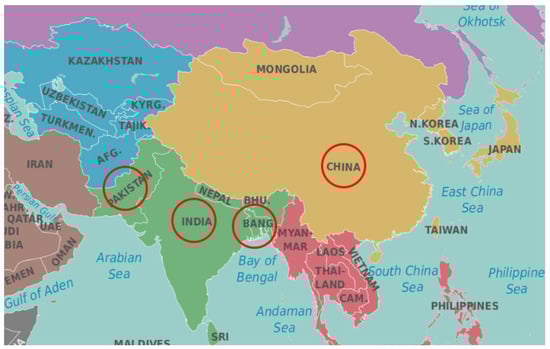
Figure 3.
Energy Internet of Central Asia.
In the context of the phasing-out of various subsidies for RE power generation projects, the impact of various risk factors, including exchange rate, on the economic performance of RE power generation projects needs to be fully considered. Xiaolin et al. [30] analyzed the effect of exchange rate fluctuation on enterprise investment from the micro level on the basis of data from China’s industrial enterprises matching with customs trade. Qingbin et al. [31] constructed four stochastic volatility models and conducted empirical research on the exchange rate risk of Chinese currency. Guangxu et al. [32] studied a fuzzy multiattribute information fusion approach for finance investment selection with expert reliability. GuoDing [33] studied the link between energy prices and real effective exchange rates on the basis of panel data from 10 energy exporters and 23 commodity exporters between 1980 and 2011. Exchange rate fluctuation is an important economic risk in foreign investment projects. In [34,35], the impact of exchange rate levels and fluctuations on corporate earnings from an economic perspective was analyzed by using the overall industrial data. In [36,37,38], the risk factors of clean energy investment in the countries along the Belt and Road were summarized and evaluated by using the ANP cloud model. The study points out that the economic risks posed by exchange rates to enterprises tend to change, but it failed to analyze the specific risks of exchange rate levels and fluctuations to energy investment in countries along the Belt and Road.besides, Yan tan et al. [39] discussed the impact of foreign direct investment on renewable energy consumption, and used the generalized method of moment (GMM) models—both system GMM and difference GMM model—to verify the robustness of the paper’s work. This was more to elaborate the relationship between foreign direct investment and renewable energy consumption from the perspective of environmental regulation, and they did not establish an evaluation model from the perspective of investment and income. Khan et al. [40] estimated the short-term and long-term impacts of technological innovation, finance, and foreign direct investment on renewable energy, nonrenewable energy, and CO2 emissions in 69 countries of the “Belt and Road Initiative”. Using robust standard error regression and dynamic GMM estimators, the results showed that the technological innovations, economic growth, and foreign direct investment have a negative impact on renewable energy. In contrast, financial developments is a significant positive determinant of the study area’s renewable energy sector. Therefore, it is necessary to study the investment in renewable energy from the perspective of finance and exchange rate. Due to the different research objectives, the evaluation model of the above documents cannot be adapted to the research in this paper.
As one of the important countries investing in renewable energy along the the Belt and Road, China must fully consider the important impact of the appreciation of the RMB and exchange rate fluctuations on energy investment, so as to provide key theoretical basis and response methods for investment decisions of enterprises. This paper aims to study the specific economic risks posed by exchange rate fluctuations to foreign investment in RE projects by using specific economic data, analyzing the exchange rate fluctuation risk capacity that the projects can bear, and proposing effective measures for exchange rate fluctuations.
This paper makes the following contributions:
- It deduces the main factors that are affected by exchange rate fluctuations in foreign RE investment: electricity selling income, labor cost, value-added tax, and land use tax.
- It presents the concept of real exchange rate in foreign RE investment projects; deduces the flexibility formula of cost, income, and earning of power generation project; and provides a model of foreign RE investment income.
- Taking China’s investment in Pakistan wind power project as an example, this work calculates the economic risks caused by the exchange rate fluctuations and provides the range of exchange rate fluctuations that the project can bear.
- This work proposes three effective measures to deal with exchange rate fluctuation risks of foreign investment in RE power generation projects: reducing project cost, building energy Internet, and using Chinese currency as the settlement currency.
The structure of this paper is shown in Figure 4.
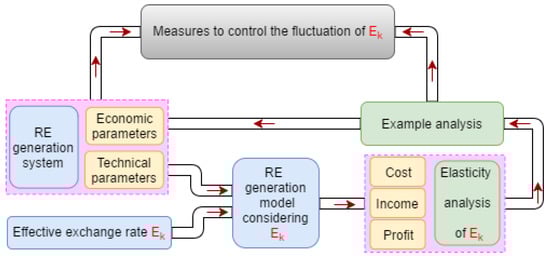
Figure 4.
System structure diagram.
Firstly, the paper introduces the basic concept and mathematical expression of the real effective exchange rate of power generation projects; then, the paper focuses on the cost, income, and income models of foreign clean energy investment projects; subsequently, it analyzes the impact of exchange rate fluctuations on investment returns. The next part analyzes the effectiveness of the model through an actual case. Finally, it summarizes that exchange rate instability must be taken into account when investing in renewable energy projects. At the same time, it gives the impact of RMB appreciation on investment income, and summarizes the effective measures to deal with exchange rate fluctuation risk for RE power generation projects invested in abroad.
2. Real Effective Exchange Rate of Power Generation Project
China invests in RE projects abroad and sells the produced electric energy to other countries. Under the market economy, it will become a trend to take the currency of the accommodation and allocation country as the settlement currency to participate in the competition in the power markets of various countries [41]. As an investor, China unifies its economic data by using Chinese currency as a measure, which is conducive to economic analysis and risk assessment. From the perspective of China, power generation equipment, labor force for project operation, and land belong to the import resources, and the electric energy produced belongs to the export resources. is the nominal exchange rate between Chinese currency and the currency of country k, that is, the amount of Chinese currency converted from the unit currency of country k. represents the real effective exchange rate for export resources, while represents the real effective exchange rate for import resources. The real effective exchange rate is the ratio of the price of resources in China to that of other countries, indicating the relative price level of China and other countries.As shown in Table 3.
Table 3.
Symbol and meaning of real exchange rate.
The real effective exchange rate indicated by the ongrid price, the cost of power generation equipment per unit kilowatt hour, land lease tax, and project operation cost are as follows:
The real effective exchange rate for the same country’s market in the same year is . Regardless of the difference between the two markets, in the same country’s market. is used to represent the real effective exchange rate in the subsequent calculation.
The environment for foreign investment in various countries is different, the factors that affect investment returns are different, and the fluctuation range of currency exchange rate is different. Therefore, the concept of real effective exchange rate for China’s foreign investment is established. According to the complex environment of China’s foreign renewable energy investment, the concept of real effective exchange rate is of great practical significance for building a reasonable cost, income, and income model.
3. Cost–Income Model of Foreign RE Investment Projects
Three main entities operate in China’s foreign RE investment projects. The first one is China, which uses state-of-the-art power generation equipment and technology that are used to seek appropriate RE investment projects in countries along the Belt and Road. The second one is the countries where RE projects are established. These countries have rich RE resources, but their power production is unable to meet the present needs of their economic development, and a large part of the power produced by the projects is accommodated and allocated locally. The third one is the countries of RE power accommodation and allocation. These countries are geographically close to the countries where the project is located, requiring RE power to supplement their power shortages or to replace fossil energy sources with RE power to improve their ecological environment. The cost and income structure of foreign RE investment projects is shown in Figure 5.
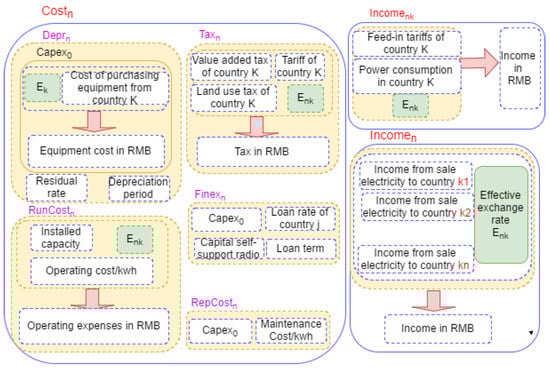
Figure 5.
Cost–income structure chart of foreign RE power generation.
3.1. Foreign Investment Income Model
The main cost involved in RE power generation is the cost of power generation equipment. With the development of power generation technology, the cost of power generation equipment has decreased considerably in the past two years. In areas with high-quality RE resources, the cost of wind power generation and photovoltaic power generation is close to or lower than the on-grid price, and subsidies for RE power generation are being phased out in various countries. In this model, the revenue from RE power generation is the revenue from electric energy selling. is the project electric power quantity accommodated and allocated by China in the n year, and is the electric power quantity accommodated and allocated by K countries, including country L, where the projects are located.
3.2. Foreign Investment Cost Model
The costs of foreign RE investment projects include the power generation equipment and installation and commissioning costs (), operation and maintenance costs (), taxes (), and financing costs (), which are incurred in the initial stage of project construction. The operation cost includes the financial, insurance, and labor costs of the project, which is related to the total installed capacity of the project and the labor cost of the country where the project is located in this model. The maintenance cost is used for the daily and emergency maintenance and care of power generation equipment, which is related to Capex0. The taxes on foreign energy investment projects include import tariff on power generation equipment, lease taxes on land used for the projects, and VAT on the power production activities. Large investments are made in RE power generation projects, which is why finding a third party to borrow money from is necessary, thus resulting in financing costs.
N is the life of the power generation project by year; , Cap, and are the total installed capacity of the project, the installed capacity of domestic power generation equipment, and the installed capacity of foreign power generation equipment, respectively; Tariff and _ are the tariff and tariff rates of power generation equipment imported by country K, respectively; and are the VAT and VAT rates in the n year of the project, respectively; and _ are the lease tax and land lease tax rates in the n year of the project, respectively; is the total power generation in the n year of the project; UtiHour is the annual effective utilization hours of clean energy.
4. Influence of Exchange Rate Fluctuation on Investment Income
On the basis of the exchange rate of the year of the project construction period, when Chinese currency appreciates, the real exchange rate expressed by will increase, and the cost, benefit, profit, and profit rate in the foreign clean energy investment income model will be affected.
4.1. Impact on Investment Income
Formula (4) can be summarized as follows:
The flexibility of electric energy selling income (Income) to the real exchange rate is
As can be seen from Formula (11), represents the proportion of electric energy selling income in the total income in country k, reflecting the dependence of power generation projects on country k. The rise of indicates the appreciation of Chinese currency. If Chinese currency appreciates by 1% against the currency of country K (assuming that the on-grid price and electric energy accommodation and allocation will not change with the fluctuation of the exchange rate), the electric energy selling income of the electric field will be reduced by %.
With the assumption that each country that accumulates and allocates electric energy is independent, the changes in project income caused by exchange rate changes can be expressed as follows:
The vast majority of the electric energy produced by foreign clean energy investment projects will be accumulated and allocated in country L, where the project is located, and the surrounding countries. If electric energy is accumulated and allocated by several countries, then Chinese currency will appreciate against the currencies of some countries and depreciate against that of others, and the flexibility of the project income to the real exchange rate will be less than the maximum value of the real change in the exchange rate; that is, the range of the project income affected by exchange rate fluctuation will be reduced. The maximum range of fluctuation is set as .
4.2. Impact on Project Cost
The cost of the project consists of five parts: depreciation cost, tax during operation period, project operation cost, maintenance cost, and financing cost. Depreciation cost is the cost of the fixed assets of the project apportioned to the depreciation period. Fixed-asset investment occurs during the project construction period, and the exchange rate of that year is the benchmark exchange rate. Tariff is the tax incurred when equipment is exported to the country where the power generation project is located during the construction period of the project. The maintenance cost rate is related to the investment cost of fixed assets. The reliability of power generation equipment increases year by year with the change in service life, and the maintenance cost rate also increases year by year, which is not affected by the change of exchange rate. Financing cost is the cost of loaned capital during the project construction period. The contract is signed in the year of project construction to determine the repayment method and loan interest rate. Depreciation cost, tariff, and maintenance cost account for 80–90% of the total cost of RE power generation projects [42]. Therefore, the exchange rate level in the year of project construction determines that the LCOE of power production of the project is as follows:
Value-added tax, land use tax, and operation cost expressed at the real exchange rate are shown in formulas (7)–(9). Value-added tax, land use tax, and operation cost on the electric energy selling occur in country L, where the project is located. The flexibility of power generation cost to the real exchange rate of country L is as follows
The increase in represents the appreciation of Chinese currency. As can be seen from formula (14), when Chinese currency appreciates by 1% against the currency of country L, the cost of power generation will reduce; represents the ratio of the sum of the value-added tax, land use tax, and operating cost in Chinese currency in country L to the total cost.
The flexibility formula for the costs incurred by other countries that accumulate and allocate the project’s electric energy to the effective exchange rate () is as follows:
Then, the cost changes caused by exchange rate changes can be expressed as follows:
Among the K countries that have trade relations with China on the projects, Chinese currency appreciates against the currencies of some countries and depreciates against that of others. The maximum range of fluctuation is set as .; the project cost is related to the real exchange rate of many countries, thereby reducing the range of the project cost with the real exchange rate.
4.3. Impact on Project Profit
In the same country’s market, regardless of the difference between buyer’s market and seller’s market, when , the flexibility formula of the real exchange rate to the profit (income minus cost) of the generation project is as follows:
The discrete form of the above formula is
With the assumption that each foreign market is independent, the change in enterprise profit caused by exchange rate fluctuation for an enterprise that is trading with K foreign markets can be expressed as follows:
The above formula shows that
- First bullet: a high profit rate of an enterprise corresponds to a small impact of the change in the exchange rate on it;
- Second bullet: as long as the enterprise profit is positive: , then , indicating that the exchange rate fluctuation has a greater impact on revenue than on income, and the impact on income is greater than that on cost;
- Third bullet: for enterprises (or years) that can make profits normally, when , the project income decreases with the appreciation of Chinese currency.
4.4. Impact on Internal Income
Internal rate of return (i.e., the project IRR) at which income equals cost during the RE power generation project cycle is as follows:
is an increasing function of , and decreases with the appreciation of Chinese currency. Thus, the IRR decreases with the appreciation of Chinese currency.
4.5. Evaluation Algorithm for the Impact of Chinese Currency Appreciation on Power Generation Projects
The appreciation of Chinese currency during the project operation has a series of effects on the cost, income, revenue, IRR, and dynamic investment payback period of the project, as shown in Figure 6.
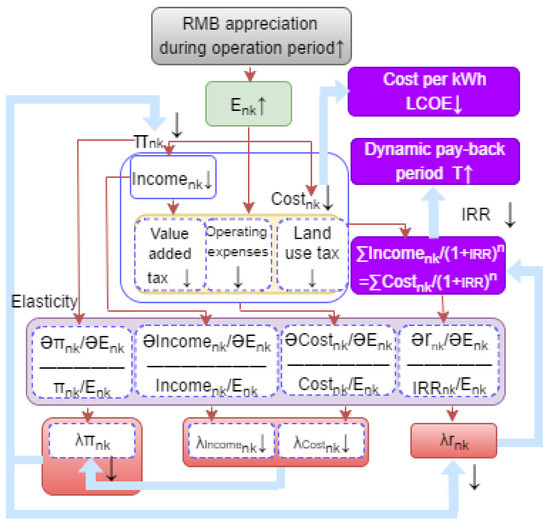
Figure 6.
Linkage chart of Chinese currency appreciation.
In this paper, a set of software is compiled on the Vensim and MATLAB platforms to evaluate a series of linkage reactions brought about by Chinese currency appreciation. The following details are input: unit power cost, capacity, residual value rate, depreciation period, loan time, loan rate, annual maintenance cost rate of power generation equipment, exchange rate of the country where the power generation projects are located, annual operation cost rate of the project, on-grid price of each accumulation and allocation country, tariff of each country, annual cost, income, and income of software output and each present value discounted to the first year, project IRR, dynamic investment payback period, and flexibility of each parameter (). Then, the trend chart of key parameters is drawn. The software flow is as follows in Figure 7:
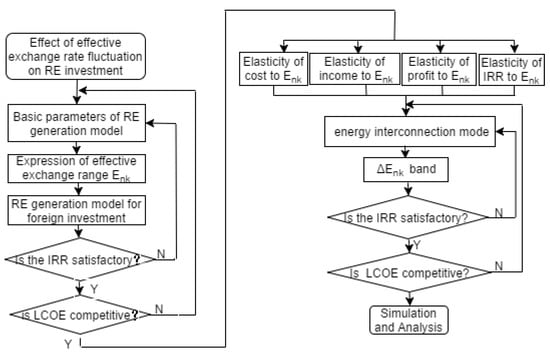
Figure 7.
Flowchart of exchange rate fluctuation analysis.
5. Example Analysis
China adopted the EPC + O & M cooperation mode for its investment in the Sachal wind power project in JP, Sindh, Pakistan. On 28 April 2012, the construction period of the contract project was determined as 15 months. This project had 331.5 MW permanent magnetic direct-drive wind turbines with a total installed capacity of 49.5 MW and a total investment of USD 130 million. The average wind speed was 7 m/s, and the wind direction was stable. The annual utilization time was 2757 h, the annual utilization rate of wind turbine was 99%, and the average annual generated power energy was 136.5 GWH. The project started on 11 December 2015 and began commercial operation on 10 April 2017. The produced electric energy was fully purchased by the government of Pakistan, according to the pricing method of cost plus return, with the project IRR of 15–17%. In accordance with the agreement between China and Pakistan, the import tariff and consumption tax of wind power equipment were waived [43].
The unit power generation equipment cost of the project was CNY 16,421.5/kWh, according to the calculation.
5.1. Investment Period Cost
The investment cost of the wind power plant in Table 4 during the construction period was CNY 812.864 million (the exchange rate of the US dollar against Chinese currency was USD 6.2528 on 15 February 2015), in Figure 8 including the acquisition expenses of wind turbine units, towers and transformers, grid-connected equipment costs, equipment transportation costs, equipment installation costs, and other costs. The depreciable life of the fixed assets of the project is 12 years, with a residual rate of 4% and an annual depreciation rate of 8%. The annual depreciation expense is used to repay the loan principal and interest, and the annual depreciation cost is CNY 65.2912 million, with a residual value of CNY 32.51456 million.
Table 4.
Investment in wind power plant during the construction period.
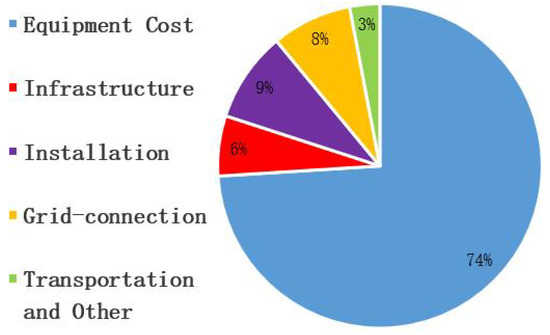
Figure 8.
Investment during the construction period.
On 15 February 2015, Sachal Energy Development Co., Ltd., (Islamabad, Pakistan) and the Industrial and Commercial Bank of China signed a project loan agreement in Beijing. The Industrial and Commercial Bank of China provided 85% of the total investment, and the remaining 15% was provided by Sachal Energy itself. The principal and interest of CNY 85.3646 million will be repaid annually, of which the interest is shown in Table 5.
Table 5.
Annual interest repaid by equal principal and interest method.
5.2. Dynamic Cost
Dynamic cost includes the operation cost of the wind power plant (labor cost, financial cost, material cost, insurance cost, etc.), which is related to the total installed capacity of the wind power plant and is reflected by the operation cost of power generation equipment per kW, with an annual growth rate of 3.5%. The performance of the power generation equipment decreases year by year. The maintenance and repair rate is 0.7% in the first, second, and third years, 1.3% in the fourth to the 13th year, and 2.4% in the 14th to the 20th year. The parameters VAT and land lease rates are shown in Table 6. Under the EC + P contract mode, an onshore contract is adopted for design and construction, and an offshore contract is adopted for equipment procurement and supply. Advance payment of income tax is exempted in Pakistan.
Table 6.
Operation cost data of wind power plant of Pakistan and China.
5.3. Analysis of Exchange Rate Fluctuation
The contract stipulates that Pakistan’s Federal Electricity Procurement Agency will procure all the electricity.
The three real exchange rates are basically equal, consistent with the theoretical reasoning above, and . If the total net income during the whole project cycle is equal to the total net cost, then the project IRR = 16.937%, which is higher than the WACC of the power generation industry (9.7%) in Pakistan. According to the calculation of WACC, the dynamic payback period of the project (year) can be obtained, thereby meeting the requirements of the investment return period of the project. The project LCOE at the time is CNY 0.8439 (PKR 12.81), within the range of Pakistan’s wind power selling price (PKR 13.1998/kWh). This finding shows that the economic status of the project is good under the exchange rate standard at that time. To analyze the tendency of the cost, income, and profit in the life cycle of a project to cause fluctuations in the exchange rate, assuming that the exchange rate level does not change throughout the life cycle, this paper studies the trend of each parameter in the project operation cycle under the fixed exchange rate.
As shown in Table 7, it has been at 1 throughout the life cycle, because the current electric energy of the project has been accumulated and allocated by Pakistan and the positive ratio of income follows exchange rate fluctuations. The depreciation cost and financing cost of the project are apportioned over the previous 12 years. From the 13th year, both have no costs, and , , and profit rate (%) change dramatically in the 13th year. In this year, the profit rate of the project reaches the maximum value of 68.9%, and the profit rate increases by 60.14%, thereby indicating that the depreciation cost and financing cost account for a large proportion in the wind power project. A large fluctuation occurs during the entire project cycle, with a maximum value of 114.8 in the ninth year and a minimum value of −45.7 in the eighth year. As shown in Figure 9, has aninverse proportion change of profit rate, around the eighth and ninth years when the profit rate changes from negative to positive, the absolute value of profit rate is 0.689% in the ninth year with the corresponding of 114.8, and the maximum value of the project profit rate is 68.9 in the 20th year, with the corresponding of 1.13. After the 13th year, gradually decreases with the increase in the maintenance cost year by year in the later stage of the project. When A is less than or equal to 1, to clearly show the trend of , , and , the 9th root of || >2 is extracted so that the absolute values of all data are less than 2, as shown in Figure 10. The figure shows that || > > , thereby indicating that the exchange rate fluctuation has the greatest impact on .
Table 7.
Cost, income, and profit flexibility.
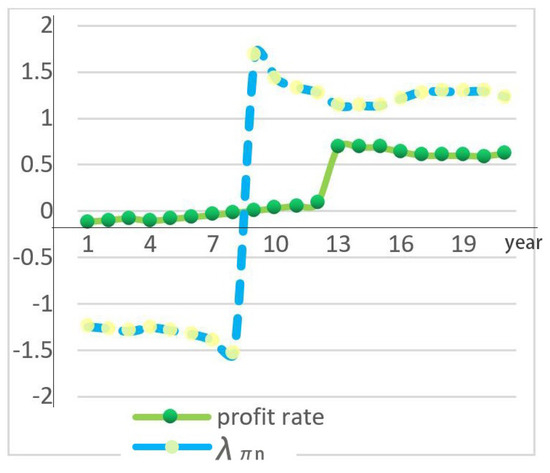
Figure 9.
Relation of and profit rate.
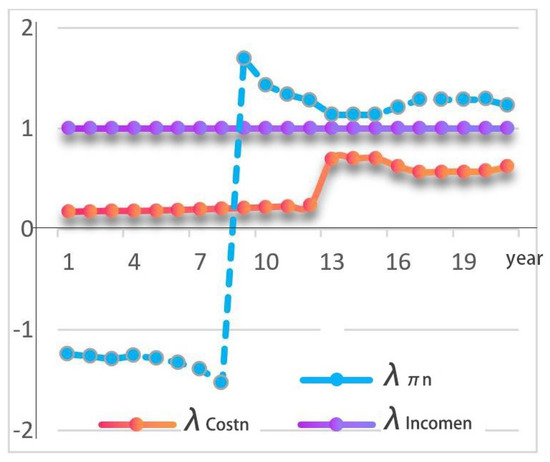
Figure 10.
Trend of income, Cost, and .
5.4. Economic Analysis of Exchange Rate Fluctuation Project
Section 5.3 shows that the fluctuation range of project parameters affected by exchange rate is not consistent under different profit rate levels. The main factor that determines the cost of wind power projects is the unit cost of power generation equipment. On the basis of the unit power cost of power generation equipment mentioned in the previous project, the main parameters of the project with the exchange rate fluctuations is studied when the cost of power generation equipment is reduced by 5% and 10%. The actual effective exchange rate changes every year throughout the 20-year period of the project’s operation. Chinese currency is assumed to appreciate by 10%, 20%, and 35% in the fifth year. The main parameters of the system are calculated as follows:
In Table 8, the first gray block is the benchmark interest rate, which is the total net profit rate of the project (calculated when the WACC of power generation projects in Pakistan is 8%), IRR, and LCOE of unit electricity. The other three blocks in the same row are the benchmark power generation costs, with the real effective exchange rate increasing by 10%, 20%, and 35%, respectively, in the fifth year. The other two blocks in the same column of this block are system data with a 5% and 10% decline in the cost per unit power generation equipment, respectively, under the benchmark interest rate. The rest of the data blocks are arranged in a similar manner. Different columns in the same row indicate changes in the real effective interest rate, and different rows in the same column indicate changes in the cost per unit power generation equipment.
Table 8.
Analysis of the main project parameters in different scenarios.
In accordance with the calculation data, under the benchmark cost of unit power generation equipment, when Chinese currency appreciates 5%, the net profit rate of the project (Netprofitrate%) decreases to −4.116%, the IRR decreases to 4.102%, and LCOE decreases to CNY 0.634, with the project having poor economic performance at this time. If the cost per unit power generation equipment decreases by 5% and Chinese currency appreciates by 35%, then Netprofitrate% = 0.0623%, IRR = CNY 8.075, and LCOE = CNY 0.609; at this point, the project only meets the requirements. When the cost per unit power generation equipment and Chinese currency appreciate by 35%, Netprofitrate% = 4.24%, IRR = CNY 15.52, and LCOE = CNY 0.583; thus, the economics of the project is in good. A three-dimensional diagram that uses the cost per unit power generation equipment and the exchange rate as independent variables and Netprofitrate%, Netprofitrate%, r%, and LCOE as dependent variables is shown in Figure 11, Figure 12, Figure 13 and Figure 14.
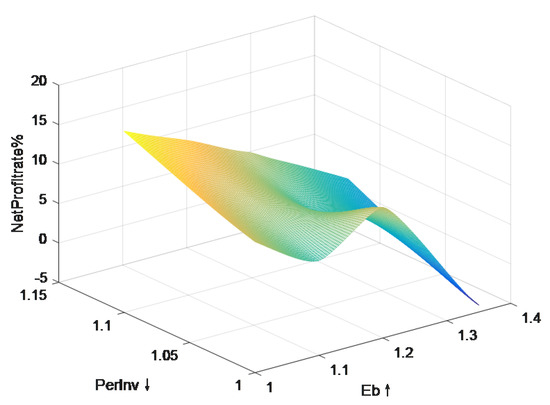
Figure 11.
Three-dimensional diagram of the fluctuation of Netprofitrate% with perInv and Eb.
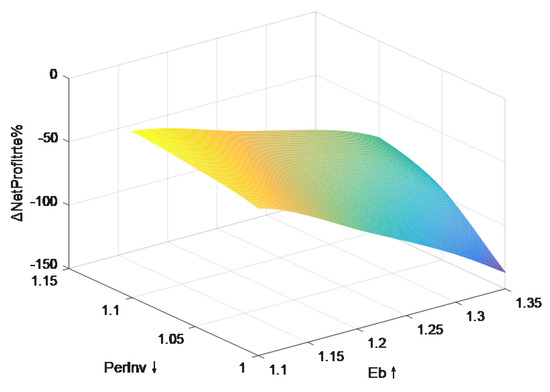
Figure 12.
Three-dimensional diagram of the fluctuation of Netprofitrate% with perInv and Eb.
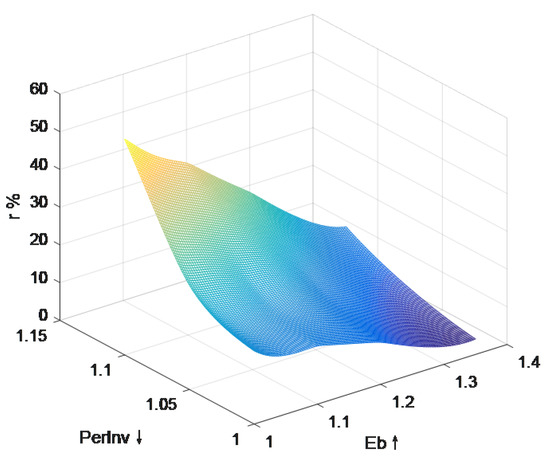
Figure 13.
Three-dimensional diagram of the fluctuation of r% with perInv and Eb.
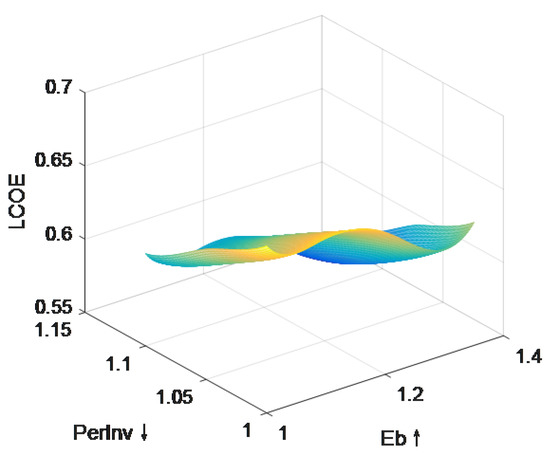
Figure 14.
Three-dimensional diagram of the fluctuation of LCOE with perInv and Eb.
Taking WACC as 8% and the cost recovery within 20 years as the economic criteria for the project, research shows that the maximum Chinese currency appreciation is 27.168% when the unit power generation cost is CNY 14,738/kWh. When the unit power generation cost is CNY 14,001/kWh, the maximum Chinese currency appreciation that the project can bear is 35.368%. When the unit power generation cost is CNY 13,264/kWh, the maximum Chinese currency appreciation that the project can bear is 43.562%.
5.5. Building Energy Accommodation and Allocation Internet
Section 5.3 indicates that Chinese currency appreciation will pose great economic risks to power generation enterprises. Building an energy Internet in the four geographically adjacent countries of China, Pakistan, India, and Bangladesh will reduce corporate risk. Power production in India and Bangladesh cannot meet the needs of these countries’ economic development. The cost of reliability for the on-grid price of the electric energy sold to India and Bangladesh needs to be taken into account. After reliability adjustment, the electricity prices in India and Bangladesh are INR 7.8577/kWh (excluding power transmission fee and export tariff) and BDT 10/kWh (excluding power transmission fee and export tariff). Data for each country are shown in Table 9.
Table 9.
Energy internet to improve system economic performance.
After the energy Internet is built, Pakistan accumulates and allocates 60% of the electric energy, while China, India, and Bangladesh accumulate and allocate 10%, 15%, and 15% of the electric energy, respectively. The exchange rates of each country from 2016 to 2019 since the start of the project are shown in Table 9. The exchange rates of 2020–2036 are estimated to be the average exchange rates of each country in the first four years. After calculation, the net profit rate of the project is increased from −0.491 to 5.229, and the IRR is increased from 7.668 to 12.142. The data show that the energy Internet has greatly improved the economic performance of the project.
6. Conclusions
This paper deduces the main factors of RE’s foreign investment subject to exchange rate fluctuations. The concept of real exchange rate in RE foreign investment projects was proposed, the elasticity formula of cost, income, and income of power generation projects to real exchange rate was derived, and the RE foreign investment income model was constructed. Taking China’s investment in Pakistan wind power project as an example, we calculated the economic risks brought by exchange rate fluctuations to the project, and gave the range of exchange rate fluctuations that the project can withstand. Three effective measures to deal with the risk of exchange rate fluctuation for RE power generation projects invested abroad were given: the first measure reduces the project cost and raises yields, hedging the economic risk caused by exchange rate fluctuations with profits. The second measure builds an energy accommodation and allocation Internet, offsetting the economic risks caused by exchange rate fluctuations because the exchange rate fluctuations between currencies vary in size and direction in different periods. The third measure uses Chinese currency as the settlement currency to avoid exchange rate fluctuations and reduces the risk factors of RE power generation projects.
The development and construction of renewable energy in the Belt and Road are subject to many factors. In the investment process, it is necessary to consider the economic factors, political environment, currency stability factors, exchange rate fluctuations, and other factors of the investing country and the invested country. Therefore, in the process of China’s investment in renewable energy, the impact of RMB appreciation on investment is unique. Because of this, the concept of real exchange rate is proposed in this paper, and the cost, income, and benefit model of foreign clean energy investment projects is also unique, which provides an important analysis and decision-making model for the Belt and Road countries’ investment, and provides a very important theoretical basis for enterprises’ investment decisions.
This paper started from the real effective exchange rate and constructed an investment income model. The model mainly considers the impact of RMB appreciation, cost, exchange rate, and other factors on renewable energy investment, and it obtained comparative results. Next, we will further investigate the operation mode of the renewable energy market, and the impact of market regulators, new producers, changes in national policies, and investment environments in different countries on the model. It is expected that the future research can be more comprehensive and accurate for analysis and decision-making.
Author Contributions
Conceptualization, methodology and writing, H.W.; review and supervision, D.E.; simulation, validation and Experiment, W.Z. All authors have read and agreed to the published version of the manuscript.
Funding
This work is supported by “the Fundamental Research Funds for the Central Universities”, Southwest Minzu University (Grant No. 2021101). This work is also supported by National Natural Science Foundation of China (Grant Nos. 72174172, 71774134).
Institutional Review Board Statement
Not applicable.
Informed Consent Statement
Not applicable.
Data Availability Statement
The data that support the findings of this study are openly available at: https://data.worldbank.org.cn/ and https://www.eia.gov/.
Conflicts of Interest
The authors declare no conflict of interest.
References
- He, J.; Chen, J.; Peng, H.; Duan, H.L. Exploring the effect of renewable energy on low-carbon sustainable development in the Belt and Road Initiative countries: Evidence from the spatial-temporal perspective. Environ. Sci. Pollut. Res. 2021, 28, 39993–40010. [Google Scholar] [CrossRef] [PubMed]
- NDRC (National Development and Reform Commission) People’s Republic of China. Enhanced Actions on Climate Change: China’s Intended Nationally Determined Contributions; NDRC (National Development and Reform Commission) People’s Republic of China: Beijing, China, 2015. Available online: https://en.ndrc.gov.cn/ (accessed on 15 December 2022)In Chinese.
- Zeng, A.; Sheng, Y.; Gu, B.; Wang, Z.; Wang, M. The impact of climate aid on carbon emissions reduction and the role of renewable energy: Evidence from the Belt and Road countries. Environ. Sci. Pollut. Res. 2022, 29, 77401–77417. [Google Scholar] [CrossRef] [PubMed]
- Ding, J.G.; Zhang, C. Belt and Road Initiative and International Governance of Climate Change. Contemp. Int. Relations 2018, 9, 53–59. [Google Scholar]
- Renewable Energy Statistics 2022. Available online: https://www.irena.org/Data (accessed on 10 July 2022).
- Guo, K. Carbon Neutralization Road Map of China’s Energy System. Int. Energy Agency (IEA) Rep. 2021, 10, 133–147. [Google Scholar]
- Kumar, A.; Kumar, K.; Kaushik, N.; Sharma, S.; Mishra, S. Renewable energy in India: Current status and future potentials. Renew. Sustain. Energy Rev. 2010, 14, 2434–2442. [Google Scholar] [CrossRef]
- Denisa, A.Z.; Abed, A.Z. Exchange rate risks and their impact upon the energy market. Acta Montan. Slovaca 2007, 12, 251–257. [Google Scholar]
- Liu, X.; Zeng, M. Renewable energy investment risk evaluation model based on system dynamics. Renew. Sustain. Energy Rev. 2017, 73, 782–788. [Google Scholar] [CrossRef]
- Sadorsky, P. Modeling renewable energy company risk. Energy Policy 2012, 40, 39–48. [Google Scholar] [CrossRef]
- Chen, G.; Liang, Z.; Dong, Y. Analysis and reflection on the marketization construction of electric power with Chinese characteristics based on energy transformation. Proc. CSEE 2020, 40, 369–379. [Google Scholar]
- Li, Y. Study and Application of Power Generation Cost Model Based on Environmental and Resource Externality; North China Electric Power University: Beijing, China, 2017. [Google Scholar]
- Wang, X.L.; Na-Na, L.I.; Xie, G.H. Economic Analysis of Renewable Energy Generation and Transcontinental Transmission for Africa-Europe. J. Glob. Energy Interconnect. 2018, 1, 81–86. [Google Scholar]
- Martin, J.; Ramsey, D. The economics of wind energy. Renew. Sustain. Energy Rev. 2009, 13, 1372–1382. [Google Scholar] [CrossRef]
- Lou, Q.; Xie, G.; Li, N. Research on new energy economic evaluation and development trend of new energy power generation in grid parity period. Electr. Power 2019, 52, 1–9. [Google Scholar]
- Cai, H.; Zhu, H.; Wu, X. Techno-economic analysis of wind power system based on LCOE and PVC methods. J. Jiangsu Univ. (Nat. Sci. Ed.) 2016, 34, 438–442. [Google Scholar]
- Liu, X.; Bai, K.; Deng, C.; Song, P.; Yang, W. Research on levelized cost of energy model of large-scale wind power project. Renew. Energy Resour. 2016, 34, 1853–1858. [Google Scholar]
- Chen, R.; Sun, Y.; Chen, S.; Shen, H. LCOE analysis of grid-connected photovoltaic power generation project. Renew. Energy 2015, 33, 731–735. [Google Scholar]
- Li, G.; Kou, G.; Peng, Y. Heterogeneous large-scale group decision making using fuzzy cluster analysis and its application to emergency response plan selection. IEEE Trans. Syst. Man Cybern. Syst. 2021, 52, 3391–3403. [Google Scholar] [CrossRef]
- Hernández-Moro, J.; Martinez-Duart, J.M. Analytical model for solar PV and CSP electricity costs: Present LCOE values and their future evolution. Renew. Sustain. Energy Rev. 2013, 20, 119–132. [Google Scholar] [CrossRef]
- Weng, H. Belt and Road strategy and risk and strategy for China’s direct investment in energy industry in Central Asia. Pract. Foreign Econ. Relations Trade 2009, 12, 85–88. [Google Scholar]
- Kong, H. Research on the Foreign Investment Risk of Chinese Energy Companies Based on the One Belt and One Road Strategy; Capital University of Business and Economics: Beijing, China, 2019. [Google Scholar]
- Morais, H.; Pinto, T.; Vale, Z. Adjacent Markets Influence Over Electricity Trading—Iberian Benchmark Study. Energies 2020, 13, 2808. [Google Scholar] [CrossRef]
- Velásquez-Gaviria, D.; Mora-Valencia, A.; Perote, J. A comparison of the risk quantification in traditional and renewable energy markets. Energies 2020, 13, 2805. [Google Scholar] [CrossRef]
- Tani, A.; Morone, P. Policy Implications for the Clean Energy Transition: The Case of the Boston Area. Energies 2020, 13, 2615. [Google Scholar] [CrossRef]
- Takagi, S.; Shi, Z. Exchange rate movements and foreign direct investment (FDI): Japanese investment in Asia, 1987–2008. Jpn. World Econ. 2011, 23, 265–272. [Google Scholar] [CrossRef]
- Deseatnicov, I.; Akiba, H. Exchange rate, political environment and FDI decision. Int. Econ. 2016, 148, 16–30. [Google Scholar] [CrossRef]
- Shamsuddin, A.F. Economic determinants of foreign direct investment in less developed countries. Pak. Dev. Rev. 1994, 2, 41–51. [Google Scholar] [CrossRef]
- Dauvin, M. Energy prices and the real exchange rate of commodity-exporting countries. Int. Econ. 2014, 137, 52–72. [Google Scholar] [CrossRef]
- Li, X.; Si, D.; Economics, S.O. RMB Exchange Rate and Enterprise Investment Behavior:Theoretical and Empirical Evidence. J. Shanghai Univ. Financ. Econ. 2019, 21, 50–63. [Google Scholar]
- Meng, Q.; Song, X.; Song, Z. Risk prediction of Chinese currency exchange rate based on Stochastic Volatility Models (SV). Financ. Account. Mon. 2019, 24, 151–157. [Google Scholar]
- Li, Y.; Kou, G.; Li, G.; Hefni, M.A. Fuzzy multi-attribute information fusion approach for finance investment selection with the expert reliability. Appl. Soft Comput. 2022, 126, 109270. [Google Scholar] [CrossRef]
- Wu, G. The Impact of the Enterprises’ Effective Exchange Rates on Profits. J. World Econ. 2017, 5, 49–71. [Google Scholar]
- Jiang, P.F. The Impact of the Enterprises’ Real Effective Exchange Rates on Cost-Profit Ratios. J. Tech. Econ. Manag. 2018, 12, 22–27. [Google Scholar]
- Li, Y.; Kou, G.; Li, G.; Peng, Y. Consensus reaching process in large-scale group decision making based on bounded confidence and social network. Eur. J. Oper. Res. 2022, 303, 790–802. [Google Scholar] [CrossRef]
- Ekholm, K.; Moxnes, A.; Ulltveit-Moe, K.H. Manufacturing restructuring and the role of real exchange rate shocks. J. Int. Econ. 2012, 86, 101–117. [Google Scholar] [CrossRef]
- Wu, Y.; Wang, J.; Ji, S.; Song, Z. Renewable energy investment risk assessment for nations along China’s Belt & Road Initiative: An ANP-cloud model method. Energy 2019, 190, 12. [Google Scholar]
- Li, G.; Kou, G.; Li, Y.; Peng, Y. A group decision making approach for supplier selection with multi-period fuzzy information and opinion interaction among decision makers. J. Oper. Res. Soc. 2021, 73, 855–868. [Google Scholar] [CrossRef]
- Yan Tan, U.U. The effect of foreign direct investment on renewable energy consumption subject to the moderating effect of environmental regulation:Evidence from the BRICS countries. Renew. Energy 2022, 201, 135–149. [Google Scholar] [CrossRef]
- A Khan, C.Y. Impact of technological innovation, financial development and foreign direct investment on renewable energy, non-renewable energy and the environment in belt & Road Initiative countries. Renew. Energy 2021, 174, 479–491. [Google Scholar]
- Mann, C.L. Prices, profit margins, and exchange rates. Fed. Res. Bull. 1986, 72, 366–397. [Google Scholar]
- Klitgaard, T. Exchange rates and profit margins: The case of Japanese exporters. Econ. Policy Rev. 1999, 5, 41–54. [Google Scholar]
- Tian, S.; Qi, D. Impacts of chinese currency’s Exchange Rate Fluctuation on Profits of Export-oriented Firms. Forum World Econ. Politics 2019, 5, 43–61. [Google Scholar]


Disclaimer/Publisher’s Note: The statements, opinions and data contained in all publications are solely those of the individual author(s) and contributor(s) and not of MDPI and/or the editor(s). MDPI and/or the editor(s) disclaim responsibility for any injury to people or property resulting from any ideas, methods, instructions or products referred to in the content. |
© 2023 by the authors. Licensee MDPI, Basel, Switzerland. This article is an open access article distributed under the terms and conditions of the Creative Commons Attribution (CC BY) license (https://creativecommons.org/licenses/by/4.0/).