Article

The Possibility of Using Superconducting Magnetic Energy Storage/Battery Hybrid Energy Storage Systems Instead of Generators as Backup Power Sources for Electric Aircraft

1
Department of Electrical Engineering, University of Ha’il, Ha’il 55476, Saudi Arabia
2
Department of Electronic and Electrical Engineering, University of Bath, Bath BA2 7AY, UK
3
Department of Electrical Power Engineering, School of Electronics, Communications and Computer Engineering, Egypt-Japan University of Science and Technology (E-JUST), Alexandria 21934, Egypt
4
Department of Electrical Power and Machines Engineering, Faculty of Engineering, Tanta University, Tanta 31511, Egypt
*
Author to whom correspondence should be addressed.
Sustainability 2023, 15(3), 1806; https://doi.org/10.3390/su15031806
Submission received: 1 December 2022 / Revised: 11 January 2023 / Accepted: 16 January 2023 / Published: 17 January 2023

Abstract

:
The annual growth rate of aircraft passengers is estimated to be 6.5%, and the CO2 emissions from current large-scale aviation transportation technology will continue to rise dramatically. Both NASA and ACARE have set goals to enhance efficiency and reduce the fuel burn, pollution, and noise levels of commercial aircraft. However, such radical improvements require radical solutions. With the current traditional aircraft designs based on gas turbines or piston engines, these goals are infeasible. Small-scale aircraft have successfully proven emission reductions using energy storage systems, such as Alice aircraft. This paper involves an investigation of the possibility of using superconducting magnetic energy storage (SMES)/battery hybrid energy storage systems (HESSs) instead of generators as backup power sources to improve system efficiency and reduce emissions. Two different power system architectures of electric aircraft (EA) were compared in terms of reliability and stability in a one-generator failure scenario. As weight is crucial in EA designs, the weights of the two systems were compared, including the generators and energy storage systems. The two EA systems were built in Simulink/MATLAB to compare their reliability and stability. With the currently available technologies, based on the energy density of 250 Wh/kg for lithium-ion batteries and a power density of 8.8 kW/kg for generators, the use of the generators as backup sources proved more efficient than the use of HESS. The break-even point was observed at 750 Wh/kg for battery energy density. Any value more than the 750 Wh/kg energy density makes HESS lighter and more efficient than generators.

1. Introduction

1.1. Background and Motivation

The transportation sector is the largest source of carbon dioxide (CO2) emissions in the US, accounting for 27% of emissions [1]. Given that the annual growth rate of freight traffic is 4.4%, and the annual growth rate of aircraft passengers is estimated to be 6.5% [2], CO2 emissions from current aviation transportation technology will continue to rise dramatically. Many organizations, including the National Aeronautics and Space Administration (NASA) and the Advisory Council for Aviation Research and Innovation in Europe (ACARE), have developed targets to limit atmospheric pollution and reduce greenhouse gases, in response to growing concerns about global warming and pollution. ACARE Flightpath 2050 targets reductions of 75% in fuel burn, 90% in NOx emissions, and 65% in noise. Meanwhile, NASA N + 3 2035 targets reductions of 60% in fuel burn, 80% in NOx emissions, and 71 dB noise relative to the year 2000 [3,4].
Both NASA N + 3 and ACARE 2050 have aggressive improvement goals. Traditional aircraft designs (gas turbine or piston engine) are inefficient (~40% efficiency) [5] and cannot reduce CO2 emissions, NOx emissions, and external noise levels, to the targets set by these organizations. For these goals to be met, the aircraft and its propulsion system must operate at their highest efficiency. Using batteries as an energy source is one obvious solution. At present, few electric aircraft operate solely on battery systems. In 2014, Airbus produced the E-Fan, a two-seat, fully electric, battery-powered aircraft for use as a trainer and tour-seat touring aircraft [6]. Eviation Alice is a battery-powered electric aircraft with zero emissions that can accommodate 11 passengers, including two crew members. It operates with two motors, with 700 kW per motor [7]. Even though ultralight, small-sized, and short-distance aircraft can be powered by batteries alone, commercial flights cannot be powered by batteries alone due to their low energy density (Wh/kg).

1.2. Literature Review

The UK government has provided funding for the Distributed Electrical Aerospace Propulsion (DEAP) project to Airbus, Rolls Royce, and Cranfield University. In order to generate the necessary thrust, the funded group examined the viability of deploying a distributed propulsion system in aircraft with two gas turbine high-temperature superconducting (HTS) generators and eight HTS motor-driven fans [8].
NASA has a slightly different path to achieve its environmental goals. NASA introduced the concept of the turboelectric distributed propulsion (TeDP) system in 2005. Moving the gas turbine engines away from the propellers is the major goal of TeDP. The power architecture of electric aircraft resembles a small microgrid with numerous gas turbine engines and motors attached to fans or propellers, allowing for the hybridization of energy sources, such as batteries and superconducting magnetic energy storage (SMES) to increase system efficiency [9]. SMES is an electromagnetic device with a superconducting coil that has been cooled below its critical cryogenic temperature to create a magnetic field through the flow of a DC current, thus storing electrical energy [10]. Power density, response time, and charge/discharge cycles are all better in SMES devices than in other energy storage technologies [11,12]. Another concept currently under development at NASA is boundary layer ingestion (BLI), which involves moving the engines to the rear of the aircraft instead of attaching them underneath the wings, thus reducing drag by taking advantage of the slow air flown over the fuselage. BLI can reduce fuel burn by up to 8% [13].
Both DEAP and TeDP systems are based on superconducting electrical networks. Power density (kW/kg) and torque density (Nm/kg) are higher in superconducting electrical components than in typical electrical components [14]. Electric aircraft (EA) can overcome the weight issue through superconductivity. NASA’s Research and Technology for Aerospace Propulsion (RTAPS) proposed the most notable EA idea, N3-X [15]. N3-X combines the benefits of TeDP, BLI, and superconducting technology to achieve maximum efficiency with minimal weight.
In March 2021, to investigate the effects of superconducting materials and cryogenic fuels such as liquid hydrogen (H2) on the performance of the electrical propulsion systems in aircraft, Airbus developed the “Advanced Superconducting and Cryogenic Experimental PowerTraiN Demonstrator” (ASCEND). ASCEND will evaluate electric architectures with and without onboard liquid H2 for applications ranging from several hundred kilowatts to several megawatts [16,17].

1.3. Contribution

This paper is focused on an investigation and comparison of two different power system architectures for EA during a one-generator failure scenario. The first power architecture was a generator–backup-generator (GBG) system, for which each generator was designed to operate at 50% capacity during normal operation, and either generator could serve as a backup power source for the other one during a one-generator failure. However, in the second power architecture, the generators worked at their highest power capacities during normal operation, and a battery bank was installed to support the system during a generator failure. Thus, it was defined as a battery–backup-generator (BBG) system. For both GBG and BBG systems, a SMES was added to the power system architecture to supply the high transient current during the generator failure. In order to compare the two systems, NASA’s planned N3-X TeDP power system architecture, the Inner Bus Tie Concept (IBTC) [9], was selected. In IBTC, a DC power system architecture supports four generators powering sixteen motors driving propellers. Two generators and eight motors are used in this paper for simplification. In the two models, the two generators powered eight motor-driven propellers, as shown in Figure 1. Both the GBG and BBG systems were slightly different from those shown in Figure 1 in terms of energy storage. In the comparison between the two systems, system stability, motor speed, and DC-link voltage were considered. The weights of the two systems were also compared. Aircraft stability is important during a one-generator failure scenario, and weight is important for system efficiency. When the aircraft’s weight is lower, the aircraft’s efficiency is higher, and vice versa.
The remaining sections of the study are as follows: A detailed explanation of the two EA models is provided in Section 2. The system description is discussed in Section 3. The energy storage control method is explained in Section 4. Section 5 involves the simulation results for the two models. A detailed analysis of system sizing is provided in Section 6. Section 7 presents the conclusions of this study.

2. Model Analysis

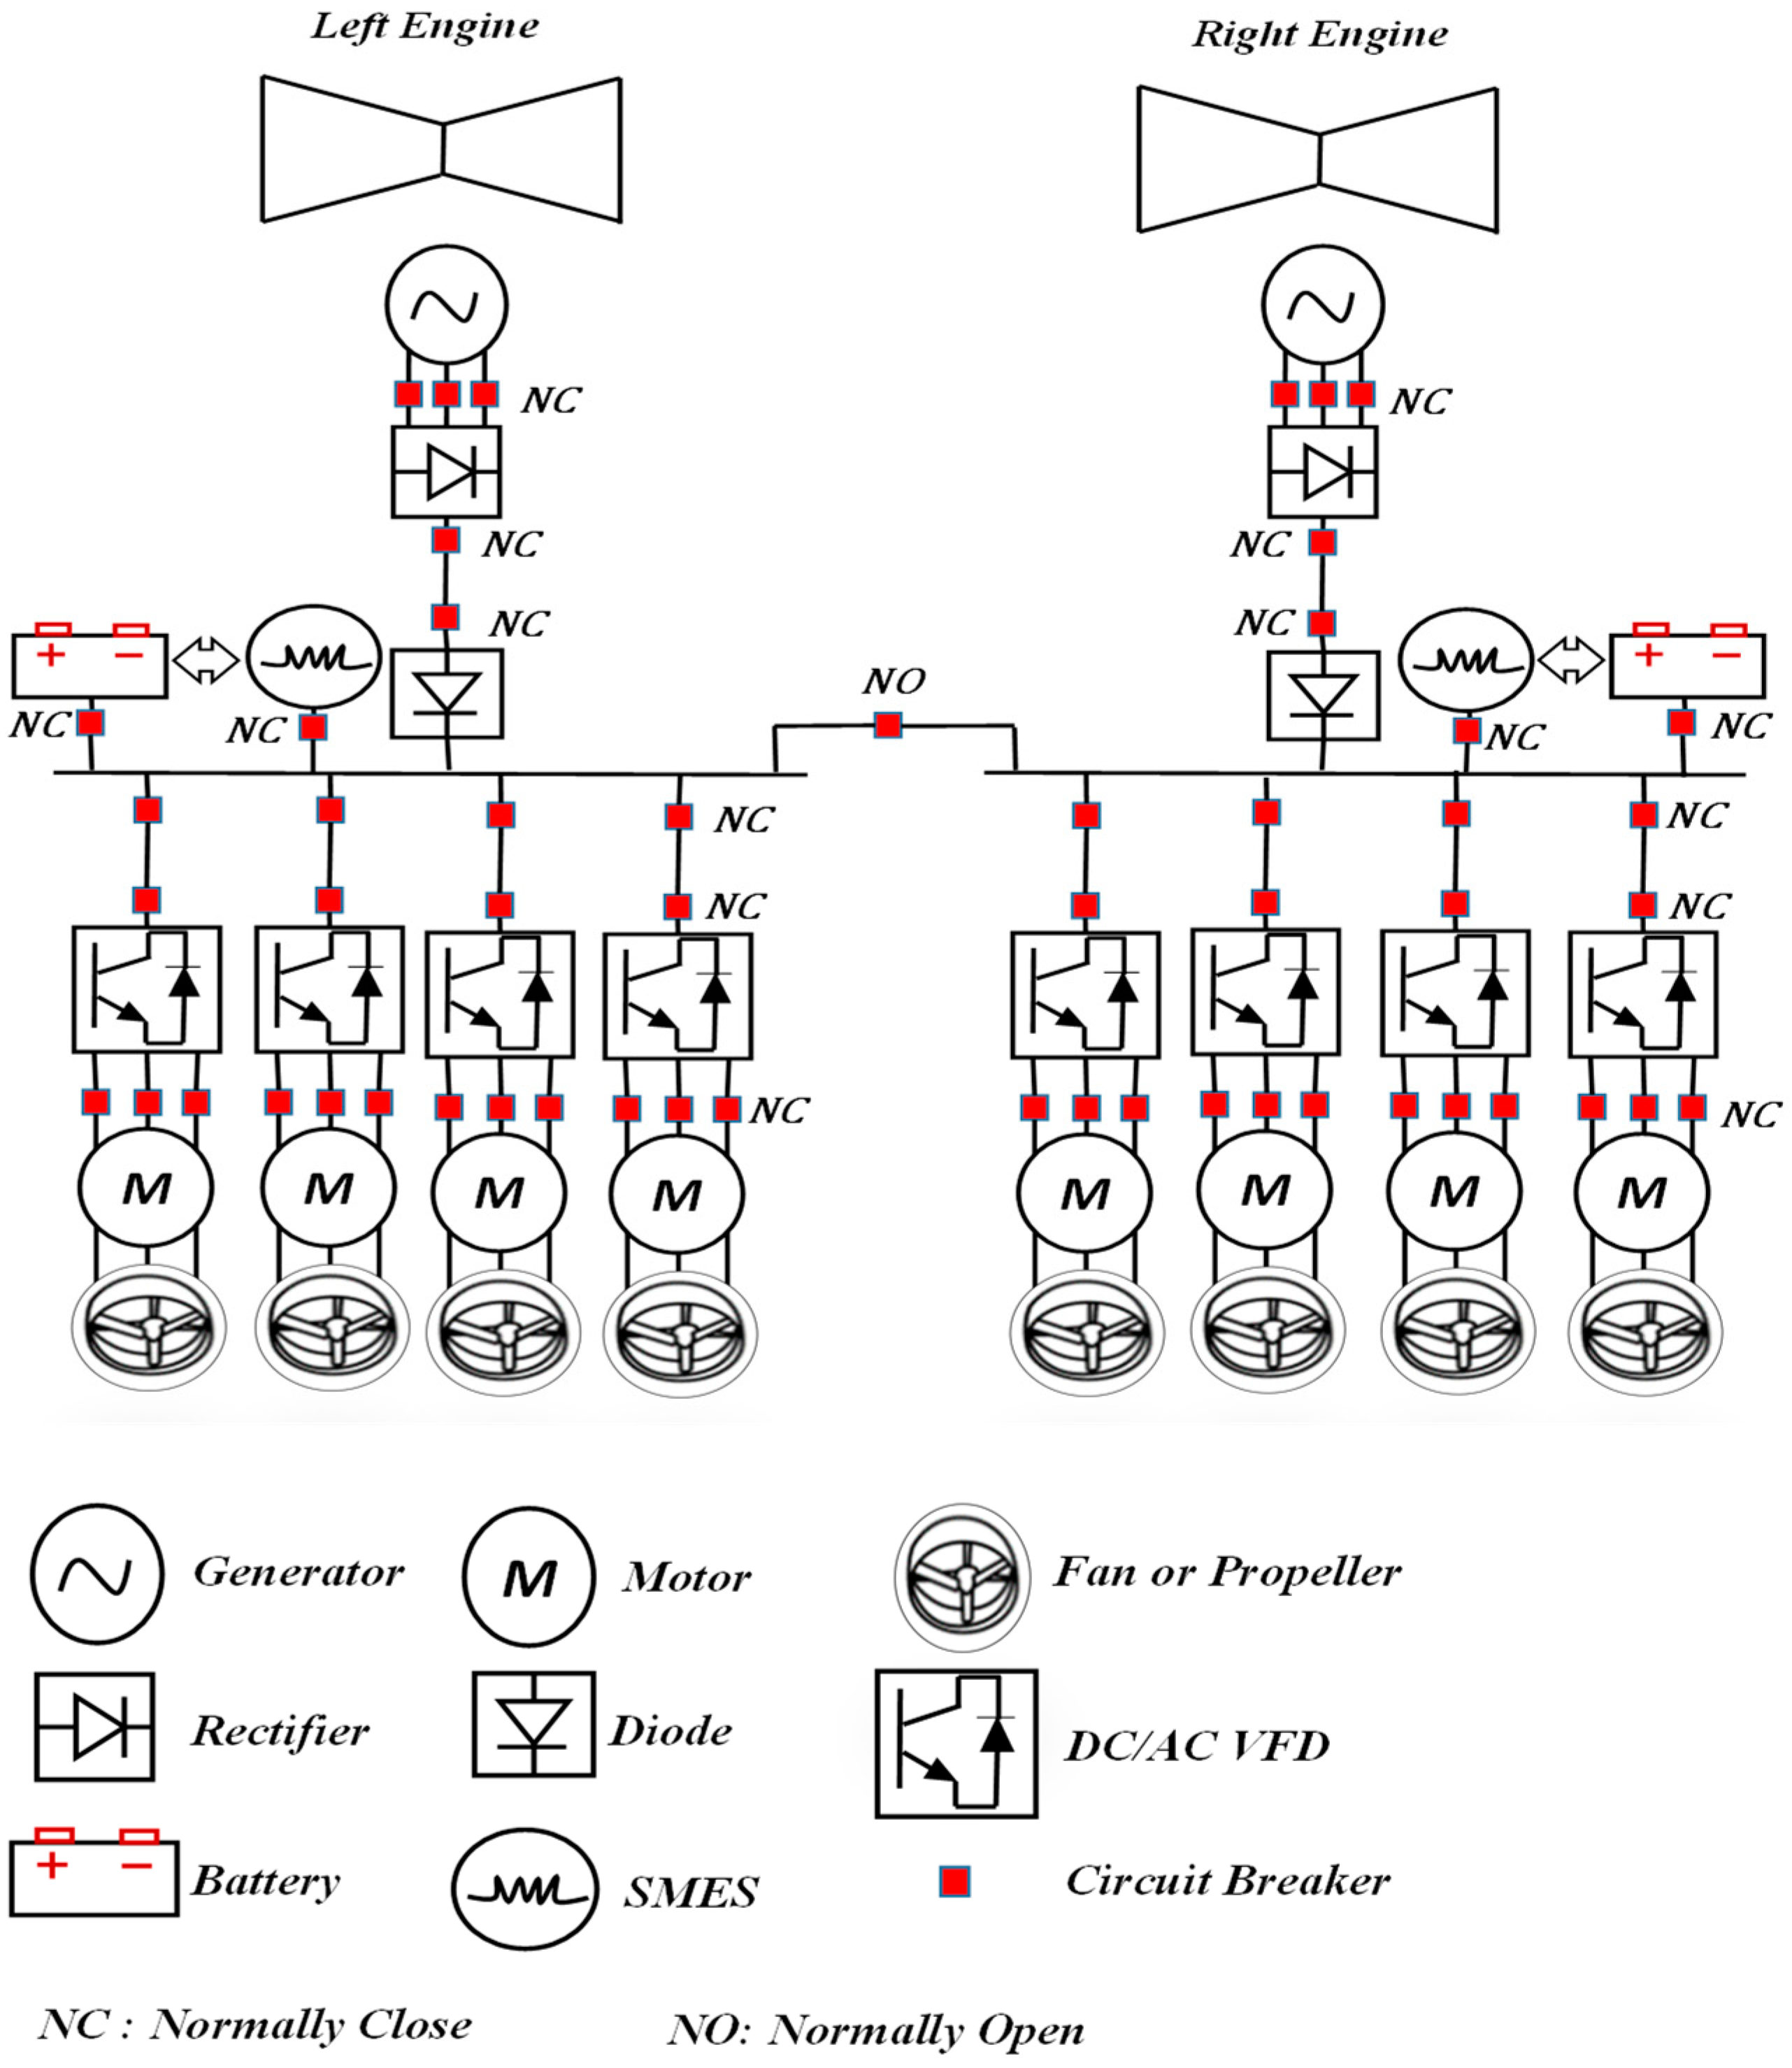
2.1. Generator–Backup-Generator (GBG) System

In this architecture, each generator supplied a set of four motors during normal operation. However, the generators were sized to operate at 50% of their capacities during normal operation to support the other set of motors during the one-generator failure scenario. The design parameters of the GBG system are shown in Table 1.
The capacities of the generators and motors were taken based on the data of the proposed aircraft by NASA [9]. The take-off power was 1.79 MW, and the nominal rating at cruise was 1.5625 MW per motor. A generator’s highest available ramp-up rate was 50 MW/min [18,19]. When a fault occurred in one generator, the other generator increased its output power from 6.25 MW to 12.5 MW to supply the whole system. It took the generator approximately 7.5 s to reach 12.5 MW based on a 50 MW/min ramp-up rate. As the generator ramp-up rate was relatively slow, unbalanced power between loads (motors set) and generators would occur, leading to instability in the EA power system. Thus, a SMES device was installed to supply the propulsion system during the increase in the generator output power to ensure system stability.
Table 1. The design parameters of the EA GBG.
Parameter QuantityValue
Generator214.91 MW, 6 kV, 1694 kg [20]
Motor81.86 MW (≈2500 hp)
SMES24.34 kWh, 434 kg, 1.73 m3 [12]

2.2. Battery–Backup-Generator (BBG) System

In the BBG design, the generators were rated to supply one set of motors during normal operation at their rated capacities. Therefore, the size of the generators was half the ones in the GBG design. However, a hybrid energy storage system (HESS) was installed in the EA to support the system and to work as an emergency power supply during a one-generator failure scenario. The design parameters of the BBG design are shown in Table 2.
The battery bank capacity was calculated to supply a set of four motors with 1.5625 MW (cruise-rated power) per motor for 10 min in an emergency scenario. As SMES has a higher power density than batteries, SMES works better with the high transient currents needed by motors once the generator fails and until the battery is used as a backup source for long-term generator failure. The charge/discharge prioritization between the SMES and the battery bank was controlled via a dynamic droop control. The SMES and battery bank sizes and weights were estimated using the data from [12,21], respectively.

3. System Description

In this section, the propulsion system, SMES, and battery bank are discussed in detail.

3.1. Electric Propulsion Motor

A permanent magnet synchronous motor (PMSM) was used as the electric propulsion motor due to its high power density and high efficiency [22]. The motor and the propeller are directly correlated. The mechanical load power of the motor is represented by (1), where n represents the propeller rotational speed, and Q is the propeller’s torque. The relationship between the supply frequency and the motor speed can be expressed by (2), where n represents the propeller rotational speed, f r is the supply frequency, and P is the number of motor poles. The power capacity of the propulsion motor was 2500 hp (≈1.86 MW).
  P m e c = 2 π n Q  
n = 120 f r P    
The motor speed is controlled by a variable frequency drive (VFD) based on a proportional–integral–derivative (PID) controller. It is a closed loop control that compares the actual motor speed with the reference speed and generates different pulses to the three arms of the DC/AC inverter, thus changing the frequency, and according to (2), the speed is adjusted accordingly. Figure 2 shows the motor control schematic.

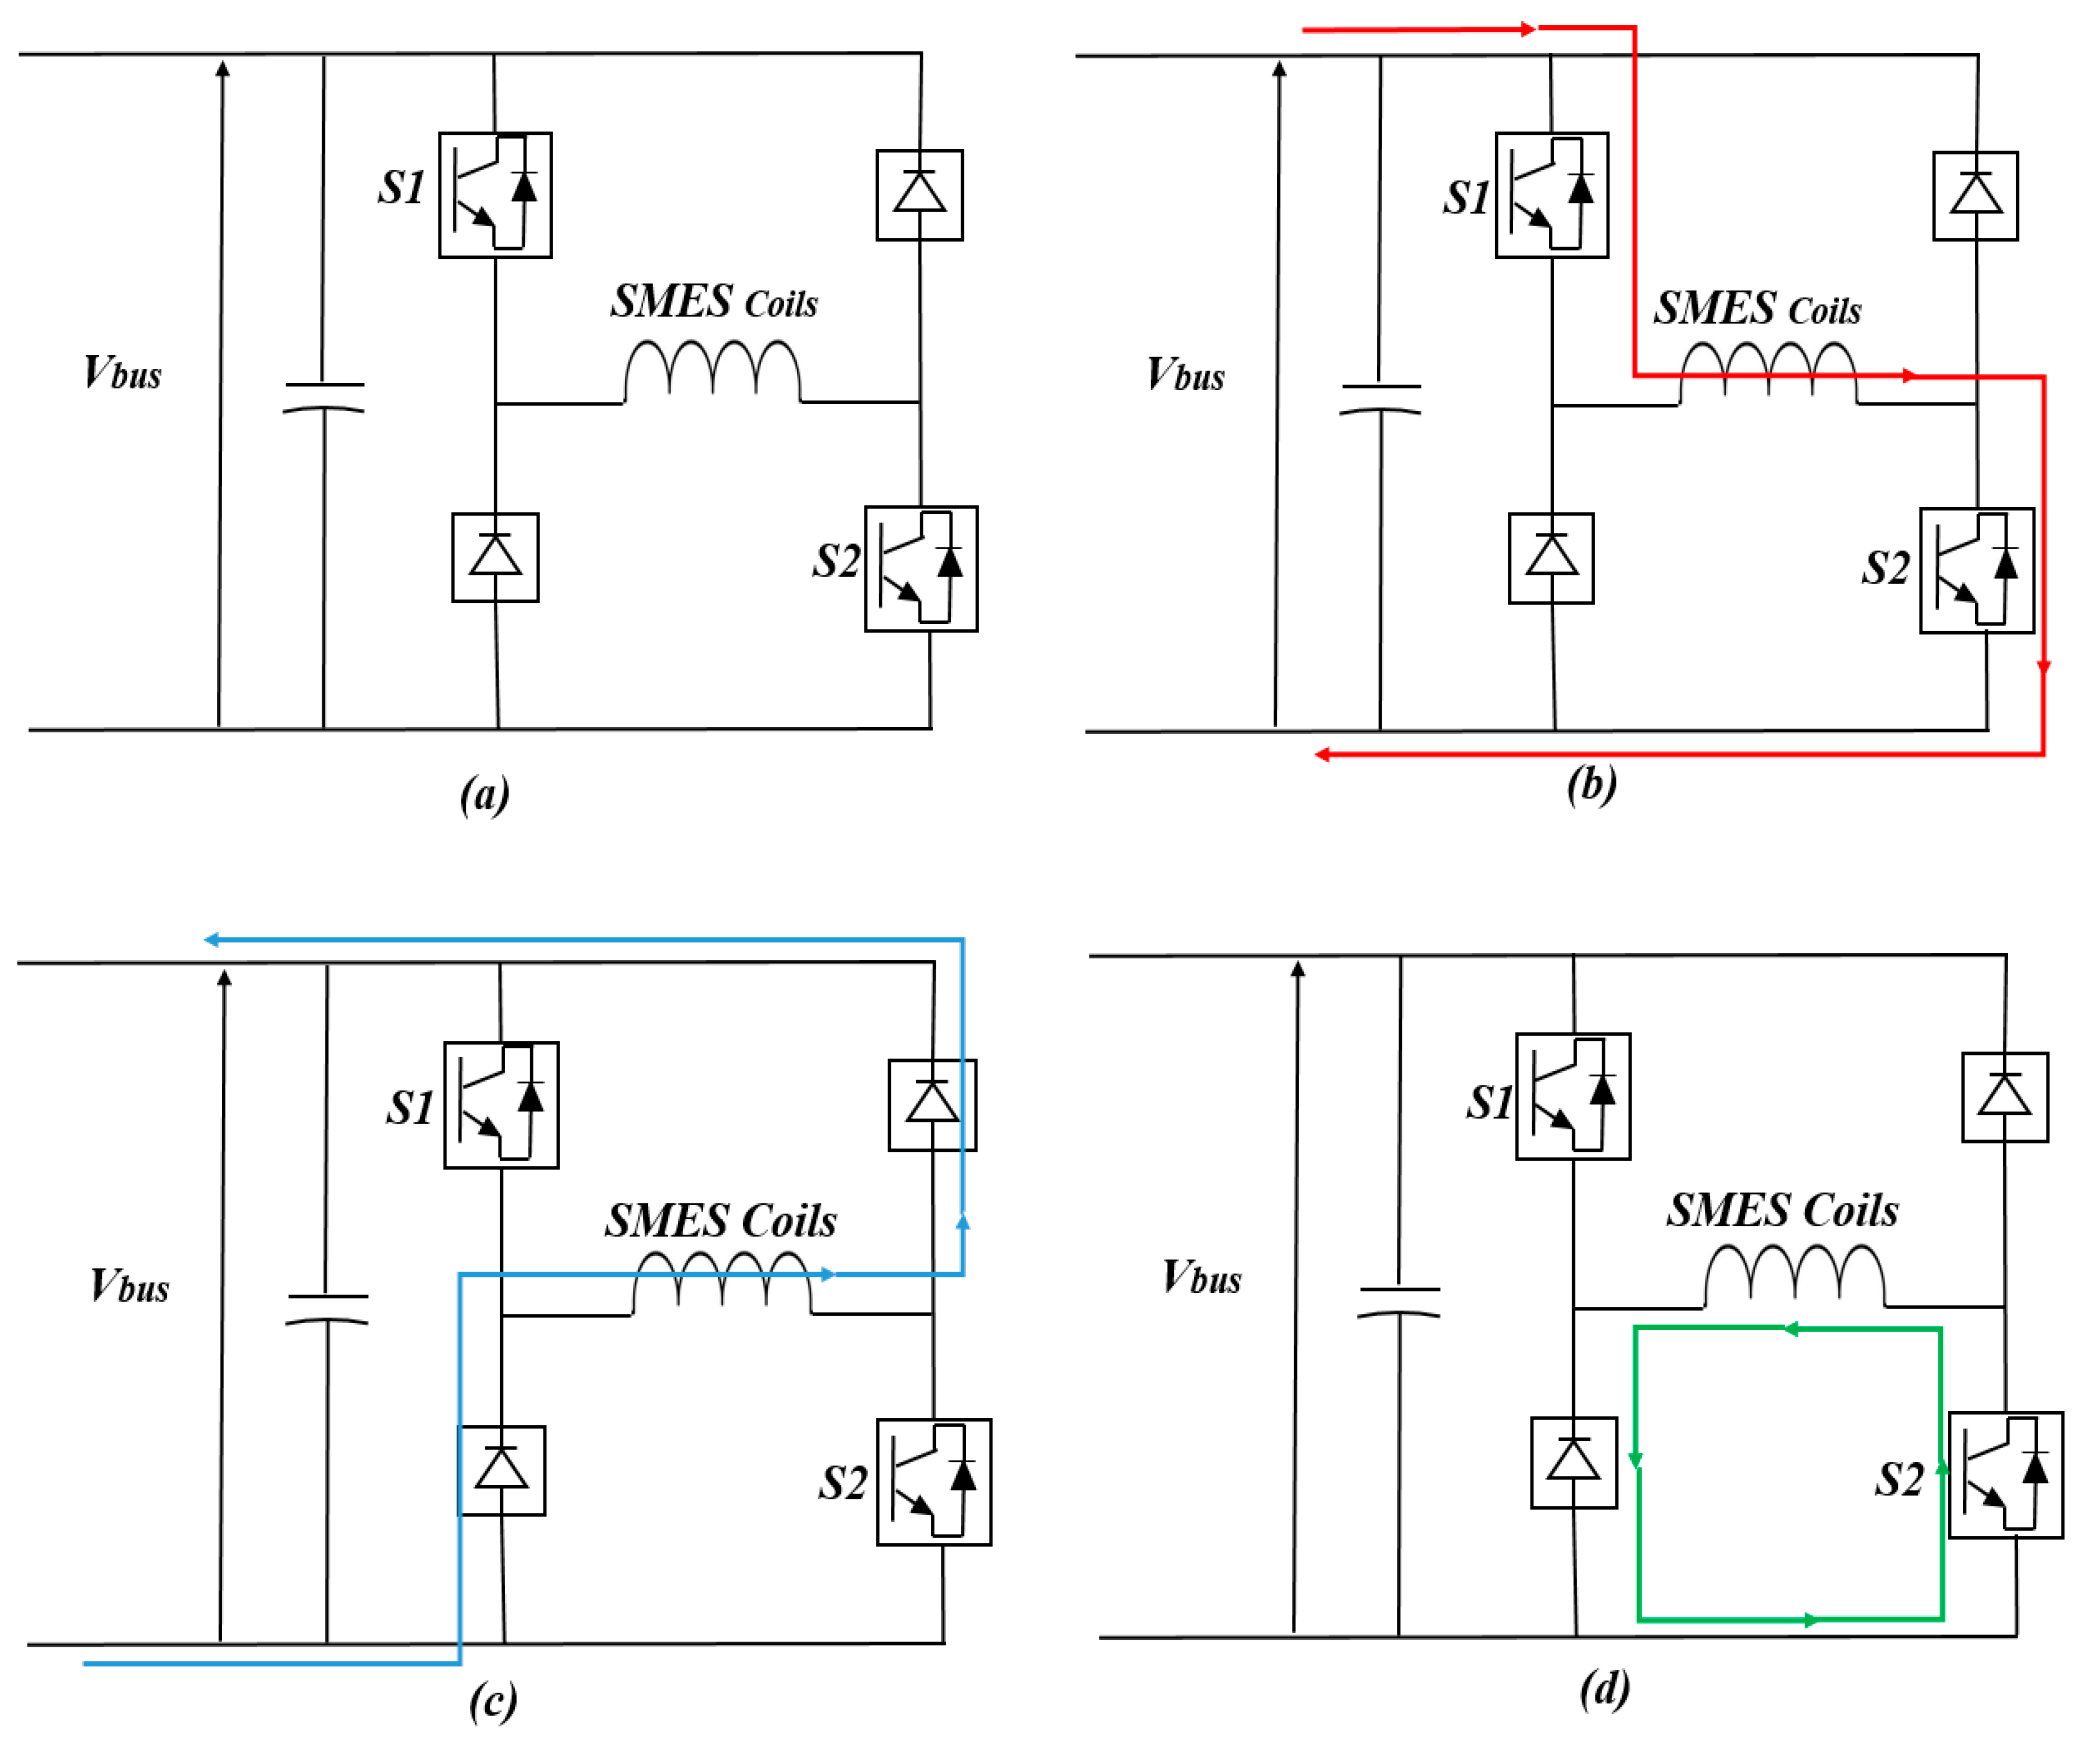
3.2. Superconducting Magnetic Energy Storage (SMES)

A SMES works well in improving power stability and maintaining motor speeds. As the generator’s ramp-up rate was not high enough to supply and maintain the power demands of the motor set during the generator failure, SMES became necessary to enhance the amount of energy given in a short amount of time. The use of SMES has been proposed and deployed in several applications, such as hybrid cars and electric aircraft [22,23]. The stored energy of the SMES is calculated using (3).
SMES control will be discussed in the next section, and the weight and size will be discussed in the section that involves the analysis of system sizing.
                                                                E s m e s = 1 2 L I S M E S 2                                                    

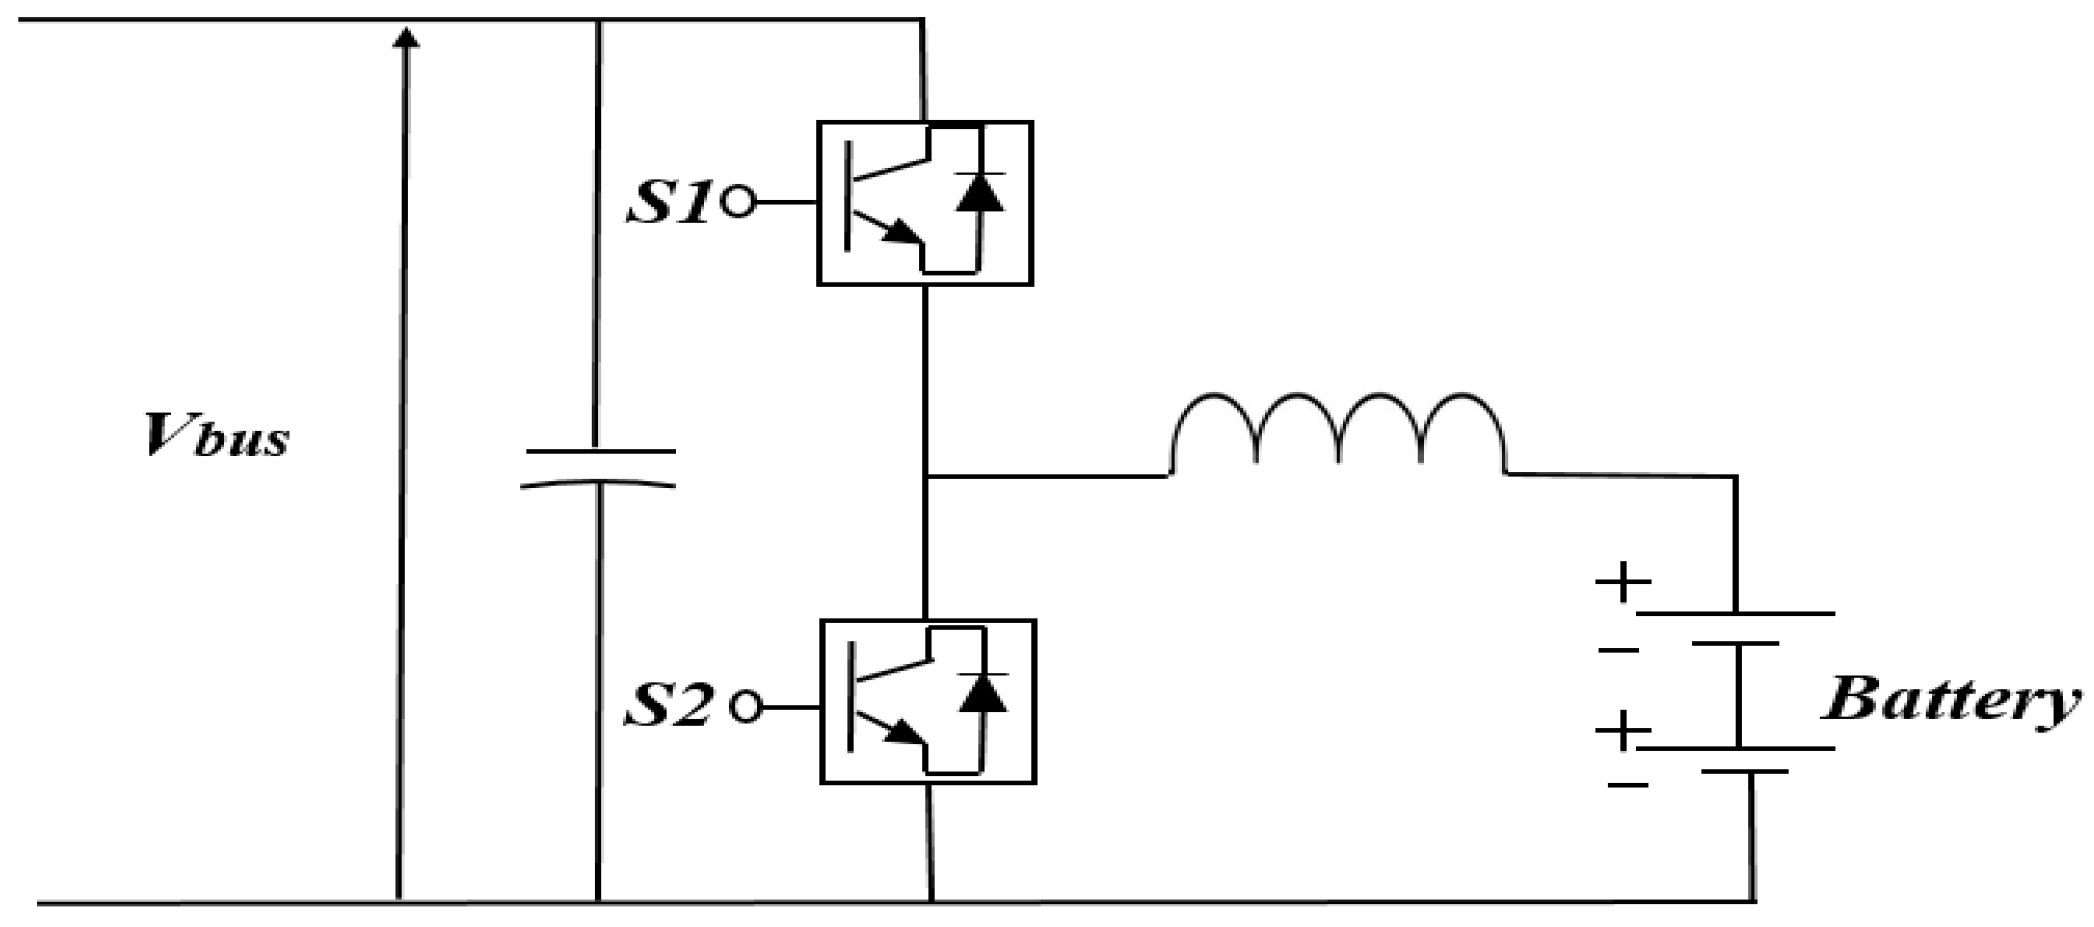
3.3. Battery Bank (Lithium Ion)

Lithium-ion batteries were implemented in the EA in the BBG design to address the long-term generator failure. Lithium-ion batteries outperform other battery types in terms of energy density, self-discharge, efficiency, and maintenance requirements [24,25]. As the weight is crucial in the EA design, finding an extremely high-density energy storage solution can help achieve the environmental goals and improve EA efficiency. The best option for currently available energy storage technologies is lithium-ion batteries with 250 Wh/kg [21]. The battery’s state of charge (SOC) was adjusted between 10% and 90% to prevent deep discharge and overcharging. The battery capacity was calculated as 1.041 MWh using (4) to cover the requirements of a set of four motors for 10 min and to maintain the battery SOC constraints.
Battery control will be discussed in the next section, and the weight and size will be discussed in the section that involves the analysis of system sizing.
B a t t e r y   C a p = M o t o r   l o a d s × t i m e   h o u r S O C U p p e r   C o n t . + L o w e r   C o n t .                  

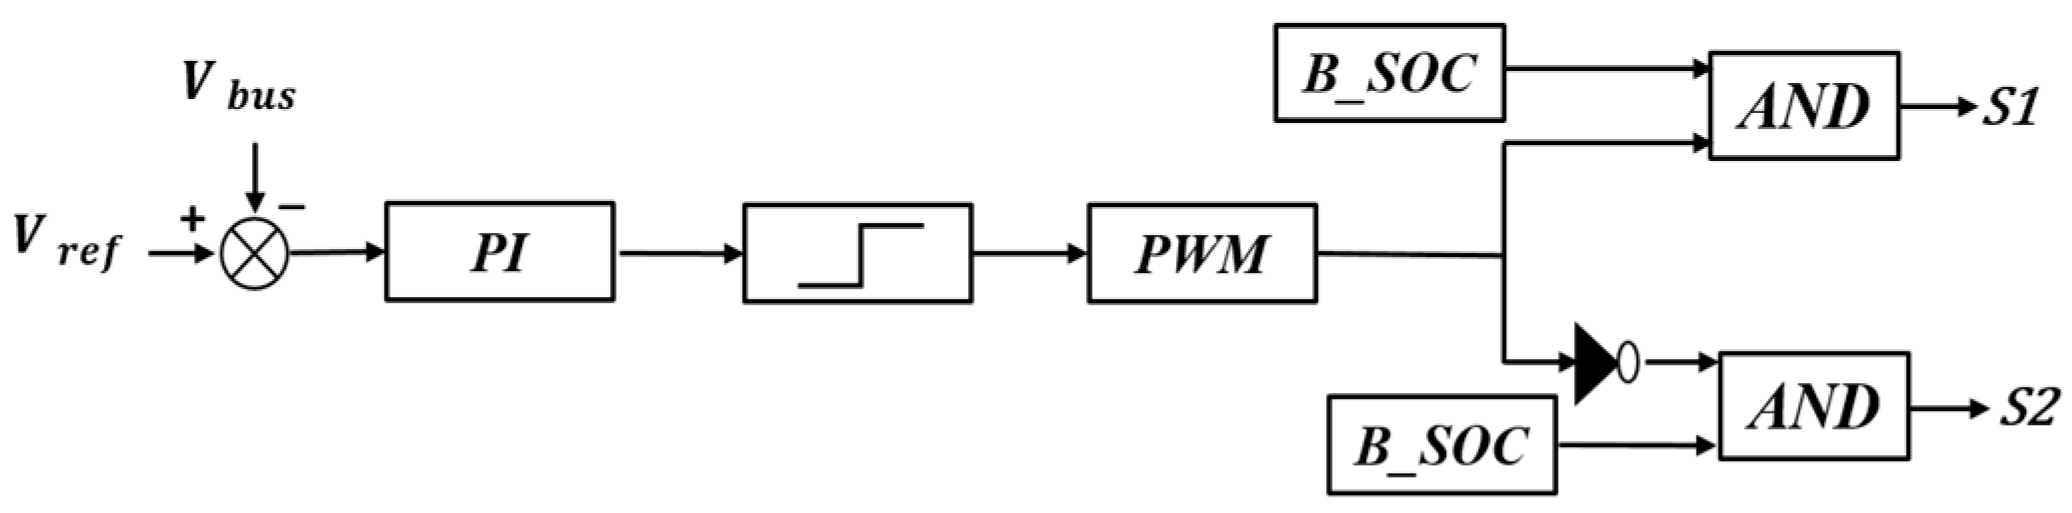
4. Energy Storage Control Method

4.1. Generator–Backup-Generator Design Control

In the GBG design, two generators, eight motors, and two SMES devices were installed in the EA power system architecture, as shown in Figure 1, without batteries. The main DC bus was rated at 6 kVDC, as recommended by NASA [26]. SMES was installed in the system to overcome the slow ramp-up of the generator during the one-generator failure scenario. If the generator failed, the SMES would immediately discharge by sensing the voltage drop on the DC bus. A diode was installed in the system to prevent the SMES from feeding the failed generator. The other generator supplied both sets of motors in 7.5 s. Then, the SMES returned to standby mode.
The primary DC bus voltage was kept within the necessary range, defined as (Vref(min) < Vbus < Vref(max)). The IEEE standard [27] specifies that the DC voltage tolerance limits must be ±10%. However, in this design, SMES discharged when the voltage dropped to 0.97 pu of the nominal voltage. The reason is that when one generator fed both sets of motors, the voltage at the main DC bus was around 0.985 pu of the nominal voltage. Thus, the SMES could allow the second generator to ramp up while discharging.
The charging and discharging of the SMES were controlled using an H-bridge DC/DC converter. As depicted in Figure 3, it was composed of two diodes (D1, D2), two IGBTs (S1, S2), and an output capacitor. The discharge mode, standby mode, and charge mode were the three operating modes for SMES.
  • (Vbus < Vref(min)) Discharge mode
If a generator failed to operate, the DC bus voltage would drop below 0.97 pu of the nominal voltage. As a result, S1 and S2 would turn off, thus turning on D1 and D2, allowing the SMES to discharge to maintain the voltage at 0.97 pu of the nominal voltage, as shown in Figure 3c.
2.
(Vref(max) > Vbus > Vref(min)) Standby mode
When the second generator supplied both sets of motors and returned the voltage to the required range of 0.985 pu, the SMES entered standby mode. The SMES would operate in standby mode by keeping S1 off and S2 on, as shown in Figure 3d. Hence, no output current from the SMES was needed.
3.
(Vbus > Vref(max)) Charge mode
When the voltage exceeded the upper voltage limit Vref(max), the controller turned on S1 and S2, allowing the SMES to charge the SMES coils, as shown in Figure 3b.

4.2. Battery–Backup-Generator Design Control

In the BBG design, two generators, eight motors, two SMES devices, and a battery bank were installed in the EA. If a generator failure would occur, the SMES devices would immediately discharge, and then the battery bank would be used to address the long-term failure. The SMES and the battery bank were controlled to discharge at 0.98 pu of the nominal voltage. A dynamic droop control controlled the charge/discharge prioritization. Since the SMES had a higher power density, it was immediately discharged by the dynamic droop control. When the SMES current decreased, the SMES discharge rate was reduced to allow the battery to ramp up its discharge rate. The charging and discharging of the batteries were controlled by a half-bridge DC/DC bidirectional converter based on a PI controller, as shown in Figure 4.
This control method compares the main DC bus voltage to the reference voltage Vref, which in this case was 0.98 pu. Based on the SMES current rate, the PI controller enabled the battery to change the charge and discharge rates. The voltage gradually declined as the SMES current began to reduce due to the dynamic droop control. The PI controller enabled the battery to discharge while maintaining the power needed by the load, as shown in Figure 5. The battery’s SOC was kept between 10% and 90% by the controller. More details about the SMES/Battery HESS circuit and the control can be found in our previous study [18].

5. Simulation Results

The main goal of this work is to compare the two power system designs, GBG and BBG, in terms of stability and weight. This section involves a comparison of the stability of these two systems during a one-generator failure scenario. As the two systems are slightly different, each system is individually discussed.

5.1. Generator–Backup-Generator Simulation Results

The Simulink/MATLAB environment was used to model the simplified EA displayed in Figure 1. The simulations showcased two different types of systems: GBG and BBG.
The simulation results demonstrated that both the GBG and BBG systems performed well during the one-generator failure scenario, keeping the motor running at the desired speed while keeping the main bus voltage within the allowed range. The system was subjected to a generator failure during the cruise at t = 10 s. In the GBG system, when the generator failed, the SMES immediately discharged to maintain the DC link voltage at the required range. The SMES was controlled to discharge when the voltage dropped to 0.97 pu of the nominal voltage. The reason is that when one generator fed the whole system, the DC-link voltage was 0.98 pu of the nominal voltage. Figure 6a shows the DC-link voltage from 8 to 10 s at normal operation. When the left generator (GL) failed, the SMES discharged and maintained the voltage at 0.97 pu from 10 to 17.554 s, as shown in Figure 6a. The DC-link voltage increased to 0.98 at 17.554 s, which means that the right generator (GR) achieved its highest capacity.
GR’s and GL’s active powers are shown in Figure 6b. When GL failed at t = 10 s, GL’s active power dropped to zero, and the circuit breaker between the generators closed after 4.5 ms to allow GR to feed the left set of motors. GR’s active power began increasing from 6.25 MW to 12.5 MW to feed both motor sets and took 7.5 s to achieve the new power demand.
The system required 12.5 MW at cruise to feed the eight motors. However, the system suffered from power deficiency between 10 and 17.5 s, as seen in the figures. The SMES supplied the main bus with the required current until GR reached 12.5 MW. The SMES current is shown in Figure 6c.
One of the important metrics in the reliability of aircraft is the speed stability of their motors/propellers. Figure 6d shows the right motor (MR) and left motor (ML) speeds before, during, and after the one-generator failure occurred. Both motors were constant at 4000 rpm regardless of the generator failure.

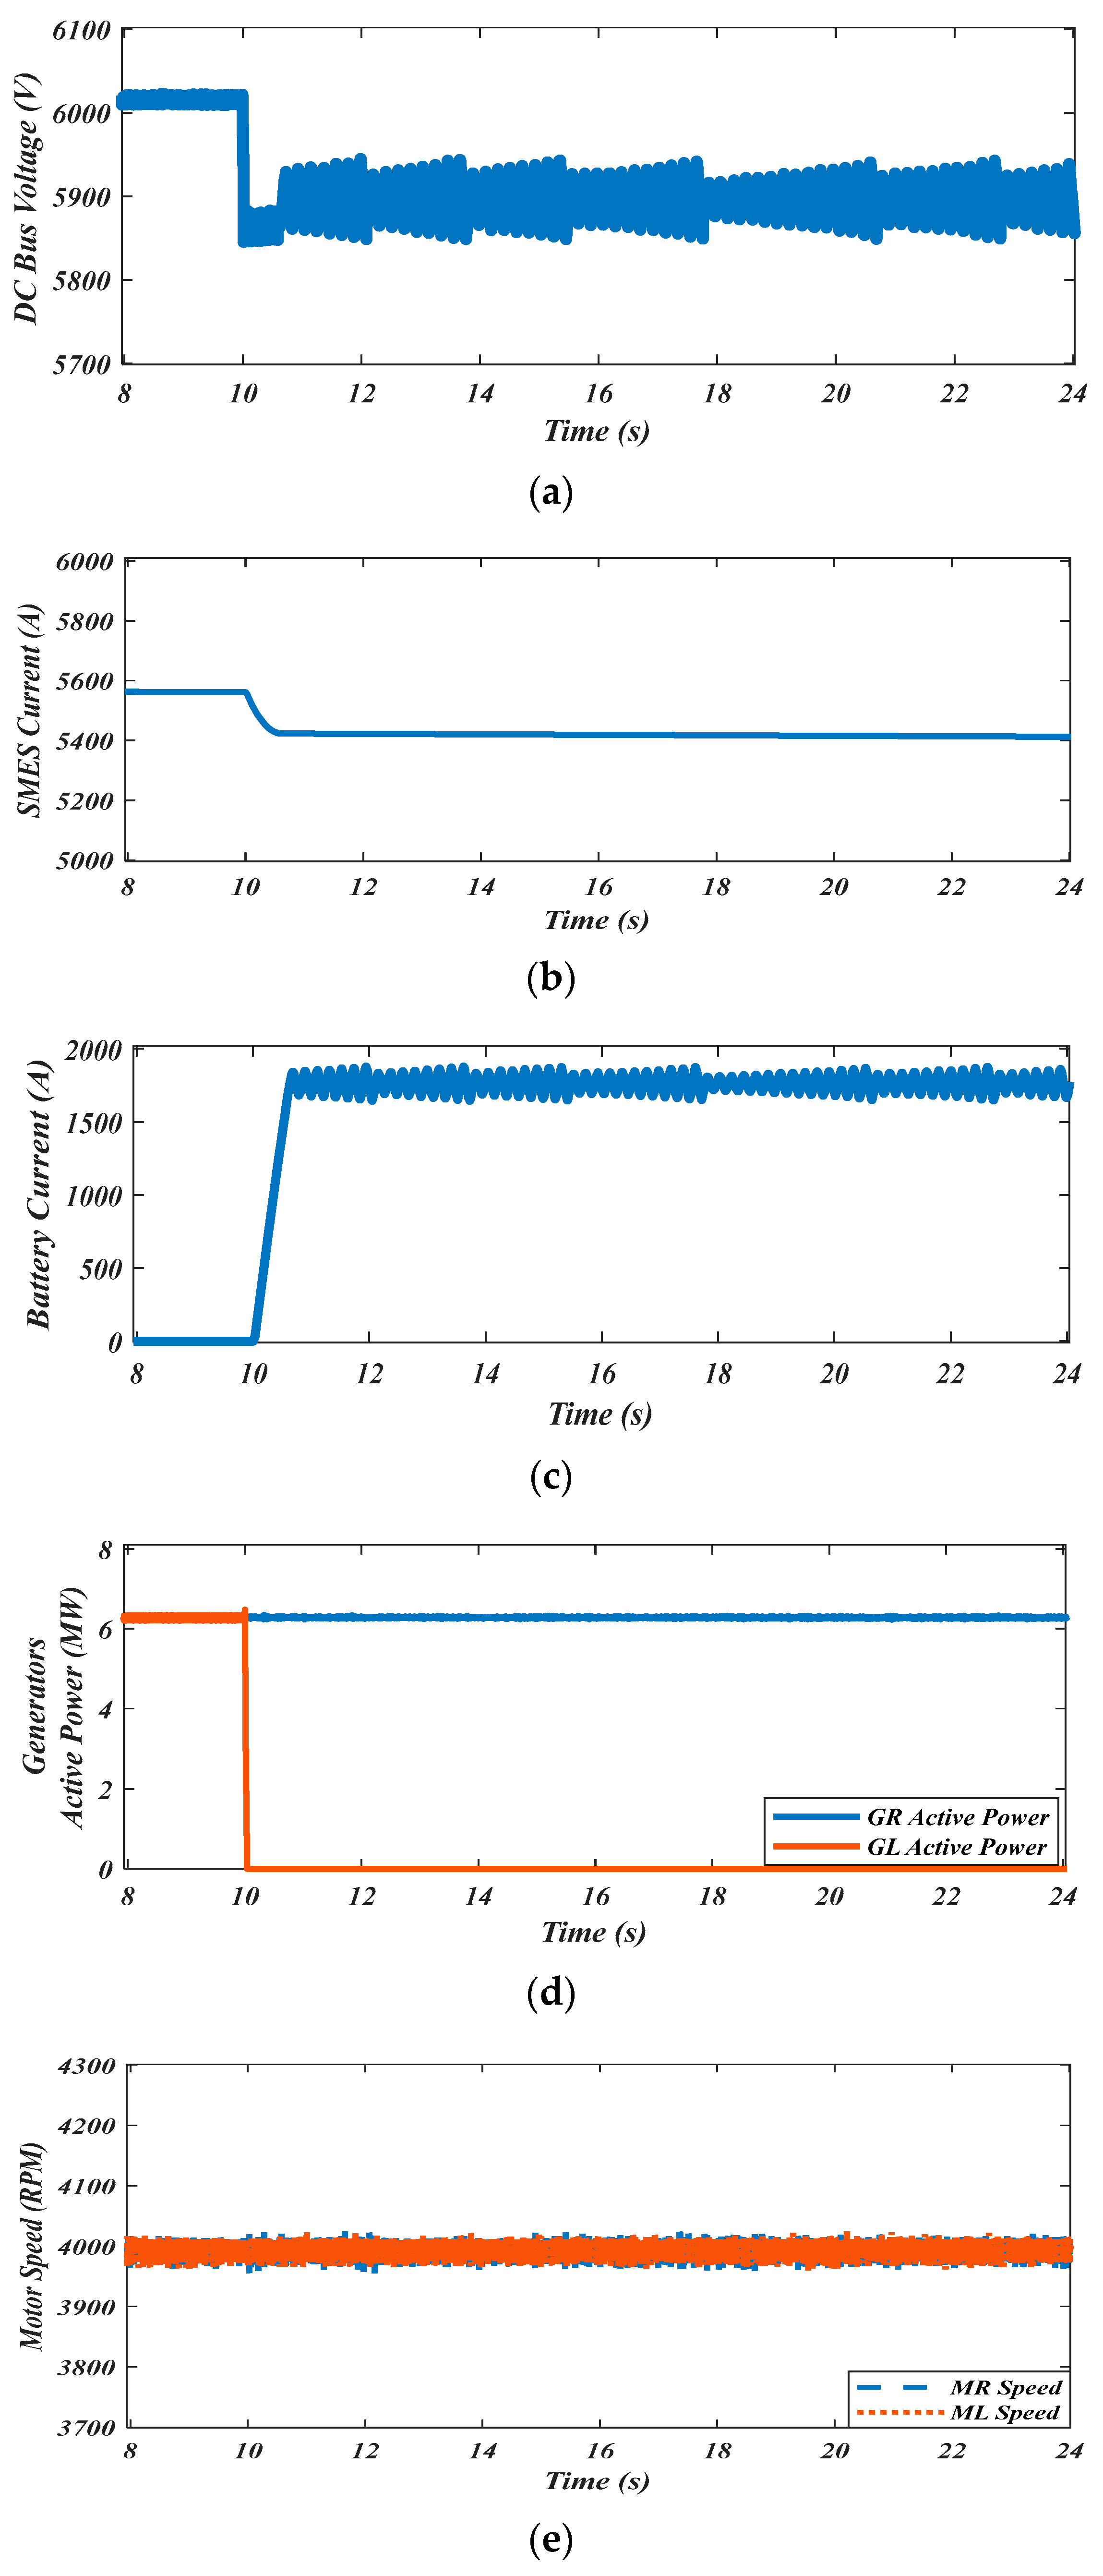
5.2. Battery–Backup-Generator Simulation Results

The main difference between the BBG and GBG power system architectures was that in the GBG, GR worked as a backup power source for GL, whereas in the BBG, a battery bank was installed in the EA to work as an emergency power source instead of the oversized generators. In the BBG power system architecture, when GL failed, the SMES immediately discharged to address the short-term failure. The battery bank was then used instead of GR to compensate for the long-term failure, discharging to feed the four motors for up to 10 min based on its 1.302 MWh capacity, as calculated by (4). Figure 7a shows the DC-link voltage in the BBG architecture, while the SMES and battery currents are shown in Figure 7b and Figure 7c, respectively.
Figure 7a shows the voltage at normal operation at 6 kVDC from 8 to 10 s. At 10 s, the system was subjected to a one-generator failure. The SMES immediately discharged to maintain the voltage at the required range and the motors at the required speed. The speeds of the two motors, MR and ML, are shown in Figure 7d. The SMES and the battery bank were controlled to discharge when the voltage dropped to 0.99 and 0.98 pu, respectively.
Both systems showed good performance when a generator failure occurred regarding voltage and motor speed stability, as shown in Figure 6d and Figure 7e. The next section discusses the sizing study and some future scenarios.

6. System Sizing Study

One of the main parameters of EA design after system reliability is weight. There is always a trade-off between the system’s reliability and its weight. The weights of the two power system architectures are compared and discussed in this section. In the BBG system, the generators were half of the capacities and weight of the ones in the GBG system. Based on the power density of 8.8 kW/kg for a generator, the total weight of the generators was 1694 kg and 3388 kg for BBG and GBG systems, respectively. However, in the GBG system, each generator worked as a backup power source for the other during the generator failure. In the BBG system, a battery bank was integrated into the EA to work as a backup power source. The battery bank was installed in the system to feed a set of four motors for 10 min as an emergency power source. The battery bank’s capacity was 1.302 MWh, and it weighed 5208 kg based on the highest available energy density for lithium-ion batteries (250 Wh/kg) [21]. Figure 8 shows the weight comparison between the BBG and GBG systems with some future predictions based on battery technology trends. The figure shows that, with the energy density at 250 Wh/kg, the GBG weight was 3388 kg, which was much lighter than the BBG at 6902 kg. At 750 Wh/kg energy density, the BBG weight was almost equal to the weight of the GBG. However, at 1 kWh/kg, the weight of the BBG was 2996 kg, lighter than the weight of the GBG at 3388 kg. When the battery energy density increased, the BBG weight decreased because the battery’s overall weight decreased.

7. Conclusions

This paper investigated and compared the use of SMES/Battery HESS and generators as backup power sources in terms of system stability and weight. The simulation results showed that both systems had high stability in terms of motor speed and could maintain the bus voltage at the required range during a one-generator failure scenario. With the currently available technologies, the use of the GBG system is more efficient than the BBG system. Several factors affect the efficiency of the aircraft, including generators, batteries, systems’ reliability, and safety. However, in this work, two factors have been studied to determine which systems can be more efficient in the future: the power density of the generators and the energy density of the batteries. Therefore, if battery energy densities improve faster than the power density of generators, BBG systems will be more efficient than GBG systems in the future, and vice versa. In future work, the system’s reliability and safety impact on the system efficiency will be investigated.

Author Contributions

Conceptualization, H.A. and X.P.; methodology, H.A. and M.K.; software, H.A. and I.A.; validation, X.P. and D.-E.A.M.; formal analysis, H.A., A.A. and M.A.; resources, H.A.; writing—original draft preparation, H.A.; writing—review and editing, X.P., M.K., I.A., A.A., M.A. and D.-E.A.M.; supervision, X.P. and D.-E.A.M. All authors have read and agreed to the published version of the manuscript.

Funding

This research has been funded by the Scientific Research Deanship at the University of Ha’il—Saudi Arabia, through project number RG-21 087.

Institutional Review Board Statement

Not applicable.

Informed Consent Statement

Not applicable.

Data Availability Statement

Not applicable.

Conflicts of Interest

The authors declare no conflict of interest.

References

  1. United States Environmental Protection Agency (EPA). Sources of Greenhouse Gas Emissions. 2020. Available online: https://www.epa.gov/ghgemissions/sources-greenhouse-gas-emissions (accessed on 6 September 2022).
  2. ICAO. Medium-Term Passenger and Freight Traffic Forecasts. 2013. Available online: https://www.icao.int/sustainability/pages/eap_fp_forecastmed.aspx (accessed on 6 September 2022).
  3. Suder, K.L. Overview of the NASA Environmentally Responsible Aviation Project’s Propulsion Technology Portfolio. In Proceedings of the 48th AIAA/ASME/SAE/ASEE Joint Propulsion Conference & Exhibit, Atlanta, Georgia, 30 July–1 August 2012; pp. 1–23. [Google Scholar] [CrossRef] [Green Version]
  4. ACARE. Strategic research & innovatino agenda. Development 2017, 1, 26–28. [Google Scholar] [CrossRef]
  5. Epstein, A.H. Aeropropulsion for commercial aviation in the twenty-first century and research directions needed. AIAA J. 2014, 52, 901–911. [Google Scholar] [CrossRef]
  6. Airbus Group. “E-Fan: The New Way to Fly”, Brochure. 2015. Available online: http://company.airbus.com/service/mediacenter/download/?uuid=48b1bd2c-a428-4c65-82e5-ed3e923bd142 (accessed on 7 September 2022).
  7. Eviation. Eviation Alice. 2022. Available online: https://www.eviation.com/aircraft/ (accessed on 14 September 2022).
  8. Berg, F.; Palmer, J.; Miller, P.; Husband, M.; Dodds, G. HTS Electrical System for a Distributed Propulsion Aircraft. IEEE Trans. Appl. Supercond. 2015, 25, 1–5. [Google Scholar] [CrossRef]
  9. Armstrong, M.J.; Blackwelder, M.; Bollman, A.; Ross, C.; Campbell, A.; Jones, C.; Norman, P. Architecture, Voltage, and Components for a Turboelectric Distributed Propulsion Electric Grid. 2015; pp. 1–270. Available online: https://ntrs.nasa.gov/search.jsp?R=20150014237 (accessed on 14 September 2022).
  10. Mukherjee, P.; V Rao, V. Design and development of high temperature superconducting magnetic energy storage for power applications—A review. Phys. C Supercond. Its Appl. 2019, 563, 67–73. [Google Scholar] [CrossRef]
  11. Hasan, N.S.; Hassan, M.Y.; Majid, M.S.; Rahman, H.A. Review of storage schemes for wind energy systems. Renew. Sustain. Energy Rev. 2013, 21, 237–247. [Google Scholar] [CrossRef]
  12. Farhadi, M.; Mohammed, O. Energy storage technologies for high-power applications. IEEE Trans. Ind. Appl. 2016, 52, 1953–1962. [Google Scholar] [CrossRef]
  13. Uranga, A.; Drela, M.; Hall, D.K.; Greitzer, E.M. Analysis of the aerodynamic benefit from boundary layer ingestion for transport aircraft. AIAA J. 2018, 56, 4271–4281. [Google Scholar] [CrossRef]
  14. Armstrong, M.J.; Ross, C.A.H.; Blackwelder, M.J.; Rajashekara, K. Propulsion system component considerations for NASA N3-X turboelectric distributed propulsion system. SAE Int. J. Aerosp. 2012, 5, 344. [Google Scholar] [CrossRef]
  15. Armstrong, M.J.; Ross, C.A.H.; Blackwelder, M.J. Trade studies for NASA N3-X turboelectric distributed propulsion system electrical power system architecture. SAE Int. J. Aerosp. 2012, 5, 325–336. [Google Scholar] [CrossRef]
  16. Ybanez, L.; Colle, A.; Nilsson, E.; Berg, F.; Galla, G.; Tassisto, M.; Rivenc, J.; Kapaun, F.; Steiner, G. ASCEND: The first step towards cryogenic electric propulsion. IOP Conf. Series: Mater. Sci. Eng. 2022, 1241, 012034. [Google Scholar] [CrossRef]
  17. Airbus Press Release. Airbus to Boost ‘Cold’ Technology Testing as Part of Its Decarbonisation Roadmap. Airbus Newsroom, no. March, 2021. Available online: https://www.airbus.com/en/newsroom/press-releases/2021-03-airbus-to-boost-cold-technology-testing-as-part-of-its (accessed on 25 September 2022).
  18. Alafnan, H.; Zhang, M.; Yuan, W.; Zhu, J.; Li, J.; Elshiekh, M.; Li, X. Stability Improvement of DC Power Systems in an All-Electric Ship Using Hybrid SMES/Battery. IEEE Trans. Appl. Supercond. 2018, 28, 1–6. [Google Scholar] [CrossRef] [Green Version]
  19. Van Vu, T.; Gonsoulin, D.; Diaz, F.; Edrington, C.S.; El-Mezyani, T. Predictive control for energy management in ship power systems under high-power ramp rate loads. IEEE Trans. Energy Convers. 2017, 32, 788–797. [Google Scholar] [CrossRef]
  20. Haran, K.S.; Kalsi, S.; Arndt, T.; Karmaker, H.; Badcock, R.; Buckley, B.; Haugan, T.; Izumi, M.; Loder, D.; Bray, J.W.; et al. High power density superconducting rotating machines—Development status and technology roadmap. Supercond. Sci. Technol. 2017, 30, 123002. [Google Scholar] [CrossRef]
  21. Chin, K.B.; Brandon, E.J.; Bugga, R.V.; Smart, M.C.; Jones, S.C.; Krause, F.C.; West, W.C.; Bolotin, G.G. Energy Storage Technologies for Small Satellite Applications. Proc. IEEE 2018, 106, 419–428. [Google Scholar] [CrossRef]
  22. Elsherbiny, H.; Szamel, L.; Ahmed, M.K.; Elwany, M.A. High accuracy modeling of permanent magnet synchronous motors using finite element analysis. Mathematics 2022, 10, 3880. [Google Scholar] [CrossRef]
  23. Trevisani, L.; Morandi, A.; Negrini, F.; Ribani, P.L.; Fabbri, M. Cryogenic fuel-cooled SMES for hybrid vehicle application. IEEE Trans. Appl. Supercond. 2009, 19, 2008–2011. [Google Scholar] [CrossRef]
  24. Khedr, M.; Zeng, X.; Pei, X. Design of a bidirectional DC/DC converter for energy storage in electric aircraft. In Proceedings of the 2021 IEEE Design Methodologies Conference (DMC), Bath, UK, 14–15 July 2021; pp. 1–6. [Google Scholar] [CrossRef]
  25. Choi, J.-Y.; Choi, I.-S.; Ahn, G.-H.; Won, D.-J. Advanced power sharing method to improve the energy efficiency of multiple battery energy storages system. IEEE Trans. Smart Grid 2016, 9, 1292–1300. [Google Scholar] [CrossRef]
  26. Gemin, P.; Kupiszewski, T.; Radun, A.; Pan, Y.; Lai, R.; Zhang, D.; Wang, R.; Wu, X.; Jiang, Y.; Galioto, S.; et al. Architecture, Voltage and Components for a Turboelectric Distributed Propulsion Electric Grid (AVC-TeDP). 2015; Volume 1, pp. 1–107. Available online: https://ntrs.nasa.gov/api/citations/20150014583/downloads/20150014583.pdf (accessed on 29 September 2022).
  27. IEEE Std. 1709–2010; IEEE Recommended Practice for 1 kV to 35 kV Medium-Voltage DC Power Systems on Ships, no. November. IEEE: Piscataway Township, NJ, USA, 2010. [CrossRef]
Figure 1. Simplified EA including HESS.
Sustainability 15 01806 g001
Figure 2. Variable frequency drive (VFD) control for electric propulsion motor.
Sustainability 15 01806 g002
Figure 3. SMES DC/DC converter control in three different modes: (a) circuit topology, (b) charge mode, (c) discharge mode, and (d) standby mode.
Sustainability 15 01806 g003
Figure 4. DC/DC bidirectional converter based on PI controller.
Sustainability 15 01806 g004
Figure 5. Block diagram of the battery DC/DC converter.
Sustainability 15 01806 g005
Figure 6. GBG system: (a) DC bus voltage, (b) active power of GL and GR before and after the generator failure, (c) SMES current, and (d) the propulsion motor speed of MR and ML.
Sustainability 15 01806 g006
Figure 7. (a) The DC bus voltage in the BBG system, (b) SMES current, (c) battery output current, (d) active power of GL and GR before and after the generator failure, and (e) the propulsion motor speed of MR and ML.
Sustainability 15 01806 g007
Figure 8. Weight comparison between GBG and BBG systems.
Sustainability 15 01806 g008
Table 2. The design parameters of the EA BBG.
Parameter QuantityValue
Generator27.455 MW, 6 kV, 847 kg [20]
Motor81.86 MW (≈2500 hp)
Battery1 Battery Bank1.302 MWh, 5208 kg, 2.17 m3 [15,19]
SMES24.34 kWh, 434 kg, 1.73 m3 [12]
Disclaimer/Publisher’s Note: The statements, opinions and data contained in all publications are solely those of the individual author(s) and contributor(s) and not of MDPI and/or the editor(s). MDPI and/or the editor(s) disclaim responsibility for any injury to people or property resulting from any ideas, methods, instructions or products referred to in the content.

