Abstract
Coal has been the fundamental energy source supporting China’s energy supply and consumption. This paper examines convergence clubs for per capita coal consumption among 30 provinces of China between 1997 and 2019 by means of a nonlinear time-varying factor model. Meanwhile, the ordered probit model is further used to identify the causes affecting convergence. The results of analyses of data strongly support the existence of convergence clubs, indicating that there are four convergence clubs and one divergence group at the interprovincial level. Among the factors that potentially influence provincial coal consumption, the GDP-per capital, industrial structure, intensity of environment regulations and carbon emissions are positively related to per capita coal consumption, while investment in fixed assets, degree of openness to the outside world and technological progress are negatively related to per capita coal consumption. Increases in GDP-per capital, industrial structure, intensity of environment regulations and carbon emissions enhance the odds of belonging to a high coal consumption intensity club. Increases in investment in fixed assets, degree of openness to the outside world and technological progress reduce the odds of belonging to a high coal consumptions intensity club. These findings help policy makers to set coal production and consumption targets for different regions and reduce the differences in coal consumption across regions.
1. Introduction
Energy is the material basis of human activities and a prerequisite for economic development [1]. The importance of energy and the scarcity of energy resources determine that whoever has mastered energy can master the space for its development and an important source of wealth creation [2]. It is essential to make better use of limited energy resources. Improving energy efficiency has become a top priority for most countries [3]. As the world’s largest energy consumer, in China, the stable supply and consumption of energy security is the basis for the sustainable and stable development of its economy and society as a whole [4]. Changing the “rough supply to meet the fast-growing demand” to “scientific supply to meet the reasonable demand” is a new requirement for China’s energy-consumption strategy [5]. China’s resource endowment is rich in coal and poor in oil and gas, which determines that coal is the most reliable security of energy consumption [6].
In China, the sustainable development of the national economy is closely linked to the use of coal [7]. Among the many industries in China, the largest consumption of coal is in the industrial sector [8]. However, coal resources are not only the material basis for industrial production, but also affect the production of other industries and people’s lives [9]. The use of coal produces a large number of pollutants in the process, exacerbating the pollution of the environment. The high consumption of coal produces greenhouse gases, such as carbon dioxide, which in turn leads to an accelerated rate of global warming [10,11,12]. China and India together account for half of the world’s coal consumption [13]. The developed countries, represented by the EU, have gradually increased the use of clean energy after reaching the EU Emissions Trading System in 2008 [14]. Since China accounts for a quarter of the world’s carbon dioxide emissions, it is also making a reasonable effort to reduce its use of coal energy [15,16]. At the same time, new energy sources are being encouraged to be developed and used. At present, China is in a phase of major energy transition, with demand for renewable energy and traditional energy sources to integrate and develop [17]. In 2022, a new global energy situation emerged, such as shortage of energy supply and soaring energy prices for coal, oil and gas [18,19]. China’s coal industry policy has also seen a new guidance, as energy security instead of structural adjustment has become the top priority in the energy sector [20]. Therefore, it is very meaningful to analyze and study the issue of coal consumption based on the energy situation of the international community.
As is well known, China’s coal reserves are distributed mainly in Shanxi, Shaanxi, west of Neimeng and Xinjiang, while consumption is mostly focused on the southeast coast, in the south and in other regions [21]. Coal production and consumption are reversed distributions, forming a mismatch between coal production and consumption, which inevitably leads to the pattern of “west coal transport to east, north coal transport to south” [22]. As the concentration of coal production capacity further increases, the distance of transportation becomes greater and the elasticity of national supply decreases, which makes it more difficult to stabilize the supply. Thus, it is necessary to formulate relevant energy supply policies according to the coal-consumption levels of each region in China. To maintain a healthy coal supply and demand relationship in China, developing the corresponding policies is, therefore, indispensable. However, there are so many provinces in China that it is not realistic to adopt a customized strategy for each of them. The study of the cross-province convergence of coal consumption levels helps segment the coal-consumption levels in the country. However, the heterogeneity of the coal-consumption levels across provinces due to the differences in development levels and coal reserves, as well as the change in energy mix under the “double carbon” target, may lead to a trend of “short-term divergence and long-term convergence” [23]. In this case, the use of traditional convergence measures ignores the existence of interprovincial time-varying characteristics, making the estimation results somewhat biased.
In this paper, the nonlinear time-varying factor model proposed by Philips and Sul [24] was adopted, which takes into account the time-varying characteristics among regions. More importantly, the context of this method allows us to assign provinces to different convergence clubs by using a simple clustering algorithm while allowing for the nonconvergence of individual provinces. The application of a time-varying factor, which allows for transitional dynamics and captures variation across provinces and cross time, is what makes this methodology distinctive. The method also enables the endogenous classification of convergence clusters. Additionally, it is not affected by the small sample characteristics of standard stationarity tests, such as unit root and cointegration tests, since it is not sensitive to the stationarity qualities of the time series under study. In this way, we can examine which factors lead to the formation of convergence. It is obvious that considering these issues is conducive to narrowing regional coal consumption differences to promote coordinated regional development and provide a sound scientific basis for energy policy formulation, which is crucial for policy makers.
To our knowledge, no previous empirical study has examined the coal consumption of China by means of a nonlinear time-varying factor model. Hence, we contribute to the literature on convergence in coal consumption in several important ways. First, we examine convergence in coal consumption to determine whether they form the same convergence club. This is important because proper consumption planning is required to reduce the variability of coal-consumption levels among provinces. Second, the factors affecting the convergence of coal consumption are investigated. It will be of theoretical and practical significance to close the coal-consumption gap and adjust the energy structure Third, the time series we use is a unique database that has not been previously employed for this purpose.
The rest of the paper is organized as follows. Section 2 briefly presents a short literature review. Section 3 describes the methodology we use to examine coal consumption levels convergence among 30 provinces. Section 4 describes the data set and reports our empirical findings. Section 5 discusses the causes of convergence club formation, and Section 6 concludes the paper.
2. Literature Review
The concept of convergence was first introduced by Solow [25] in a neoclassical growth model and is often applied in the field of economics. The convergence hypothesis can be subdivided into absolute convergence [26], conditional convergence [27] and club convergence [28]. Absolute convergence refers to a situation in which the per capita income of rich economies and that of poor economies gradually converge to a steady state over time. It means that poor economies grow faster than do rich economies, exhibiting a catch-up situation. Conditional convergence refers to the gradual convergence of the per capita incomes of poor and rich economies to their respective steady states. However, both conditional and absolute convergence ignore the case of the convergence of local economies, for which scholars have proposed the concept of club convergence [29]. Club convergence refers to a steady state in which regional growth rates with similar initial levels and structural characteristics reach a steady state. Baumol’s [30] analysis of Madison data for 1870–1979 found that productivity converges significantly in countries with similar initial conditions and structural characteristics but not in less developed countries. Moreover, Chatterji et al. [31,32] used empirical methods to test the club convergence hypothesis. The world is divided into two mutually exclusive convergence clubs, with rich club members having higher per capita income than those of flat-poor club members.
With the development of convergence theory, the associated research field has gradually expanded beyond economics [33,34,35,36], and there has been an increasing number of studies on energy consumption convergence. For example, Herrerias and Liu [37] studied the convergence of stochastic electricity intensity in Chinese provinces, taking into account the correlation of the technology level and economic geography of each province. Mishra and Smyth [38] used 1971–2011 Association of Southeast Asian Nations (ASEAN) countries, with the panel data of energy consumption per capita as the study sample, and a convergence analysis was conducted using the panel Kwiatkowski–Phillips–Schmidt–Shin (KPSS) smoothness test and Lagrange multiplier unit root test. Moreover, Sheng et al. [39] explored the relationships among energy demand, transportation costs, economic growth and national policies using regression analysis. Solarin et al. [40] used the renewable energy consumption of 27 Organization for Economic Co-operation and Development (OECD) countries as the study target, using a convergence test based on a fractional integration approach. Mulder and De [41], Meng et al. [42], Fallahi and Voia [43], and others also used the energy intensity of OECD countries as the target of their study. Liddle [44] conducted a convergence test on a sample of energy intensity data for two different time periods and different volumes, showing that geographical differences affect the rate of convergence and that the larger the sample the more members converge. Mohammadi and Ram [45] investigated the convergence of energy consumption in US states using both parametric and nonparametric methods.
The above studies of energy convergence have tended to ignore individual heterogeneity in the panel data and the possible tendency of “transient divergence and long-term convergence” between regions [46]. This misconception can be referred to as an eco-misperception. Spreafico and Landi [47] define eco-misperceptions as erroneous interpretations of the novice eco-designers, about the environmental sustainability of design solutions. In this case, it is necessary to use the nonlinear time-varying factor model proposed by Philips and Sul [48,49], and a new convergence test—the log t-test—which has also become an important method for studying club convergence. In view of its advantages, numerous scholars have extended the application of this method to different fields, such as regional economic [50,51], financial development [52] and agriculture [53]. This method was used to study the convergence of carbon dioxide (CO2) emissions among 128 countries during the period 1960–2003, and it was found that there were two independent convergence clubs [54]. Moreover, Zhang et al. [55] and Wang et al. [56] studied the convergence of CO2 emissions, while Olson and Zoubi [57], explored whether the global financial crisis led to convergence in the performance of Islamic and commercial banks in the Middle East, Africa and Southeast Asia in recent years using a log t-test. Additionally, Adebola et al. [58] used a log t-test on the ecological footprint per capita of 92 countries to finally obtain multiple convergence clubs. Sun et al. [59] used the Malmquist–Luenberger productivity index to assess the environmental performance of a large number of countries and found convergence clubs in a subsample of each decade. In order to address the probability factors that influence club ownership, some scholars have used the ordered probit model to investigate the causes of club convergence. Von Lyncker and Thoennessen [60] used an ordered probit model to estimate the effects of initial and geographic factors of club convergence. Li F et al. [61] used a nonlinear time-varying factor model to identify the convergence clubs of economic growth in 2286 counties in China and then examined the factors affecting club convergence using ordered probit models. Piao [62] and He and Lai [63] analyzed the causes of club convergence. The club convergence test and identification of the guest source market were further applied to examine the influencing factors of club convergence using an ordered logit model [64].
From the collation of the literature, scholars’ research on the convergence of energy consumption intensity provides a reference for this paper. Compared with intense discussion of convergence in energy intensity, that of per capita coal consumption, critical to the design of coal consumption and production policy, has not yet been thoroughly investigated. Several critical issues, such as research on coal consumption, which provinces have the same level of convergence, and how to adjust coal consumption to achieve overall convergence, need to be further investigated. In addition, the convergence of coal consumption explored by the classical convergence method ignores the heterogeneity among regions, and the reliability of the conclusions is compromised. These key issues are closely related to securing the safe supply of coal resources, as well as the balance of regional development. Based on this aspect, this study combines the above tests and the nonlinear time-varying factor model to test the convergence hypothesis of per capita coal consumption in 30 provinces and cities in China from 1997 to 2019. The ordered probit model is used to explore the club convergence factors. The study provides a reference basis for the rational allocation of coal production increase tasks implemented by the provinces to ensure energy security and supply.
3. Methods
In this section, we present the PS approach, proposed by Phillips and Sul (2007) to identify convergence of coal consumption in 30 Chinese provinces. We also briefly discuss the clustering algorithm proposed by PS, which allows us to classify the 30 Chinese provinces into convergence groups.
3.1. Logt Test
Let us consider panel data for a variable , i = 1,…,N and t = 1,…,T, where N and T are the number of provinces and sample size, respectively, and can be further decomposed as follows:
where is the common component, denotes the provinces’ characteristic component, and is the error term. In the model, can be further decomposed into a common component and an individual element, such that
where is an individual element, which possesses the respective time path and is used to measure the distance between individuals and the common factor. In Equation (2), is assumed to have some sort of deterministic or stochastically trending behavior. It is a time-varying factor model of Equation (1). Assume that the heterogeneity of is transient and becomes homogeneous in the steady state. Equation (2) is referred to as a nonlinear time-varying factor model. For any province i, if converges to a constant δ, then coal consumption converges to the same level in all provinces in the country. To more clearly represent the time-dependent specificity of , a semiparametric model needs to be constructed as follows:
In Equation (3), is fixed, is an idiosyncratic scale parameter, which denotes a constant term related to the idiosyncratic of province i and does not vary with time. Assume that . Parameter α denotes the rate of convergence. is a slow varying function. When , then . The function ensures that as long as α ≥ 0, converges to Accordingly, we can now formulate the null hypothesis of convergence as follows:
against the alternative
0: 𝛿𝑖 = 𝛿 and 𝛼 ≥ 0
1: 𝛿𝑖 ≠ 𝛿 𝛼 for some i and/or 𝛼 < 0
The null hypothesis implies that coal consumption in all provinces converges to a steady state. The alternative assumption implies that at least one province did not converge. This means that it is possible that coal consumption in all provinces did not converge. It is also possible that coal consumption in some provinces converged. To better test convergence, it is first necessary to construct a relative transfer path, :
We assume that the panel average and its limit as deviate from zero. The relative transfer path reflects the degree of divergence of the level of per capita coal consumption in province i from the mean and its trend over time. Clearly, when there is long-term convergence (that is, when the null hypothesis holds and the relative transfer coefficient , at which point the cross-sectional variance of tends to zero, that is, when t→∞), the following holds:
Next, the cross-sectional variance ratio is constructed and regressed on the following equation:
where r is the parameter that determines time t. As t = 23 < 50 in this paper, PS recommend setting r equal to 0.3. denotes a slowly varying function, and . is the estimate of in . represents the fitted coefficient of log t and converges to the speed of convergence parameter under the null hypothesis.
Finally, a one-sided test for in the null hypothesis of convergence is performed using and heteroskedasticity- and autocorrelation-consistent (HAC) standard errors. If , then the null hypothesis of convergence is rejected at the 5% level of significance. PS refer to the above method as the log t-test.
3.2. Club Convergence Algorithm
When the null hypothesis of overall convergence in all provinces is rejected, the clustering algorithm proposed by PS can be further used to determine whether there is club convergence, the steps of which are as follows. The club convergence test analysis flow chart is shown in Figure 1.
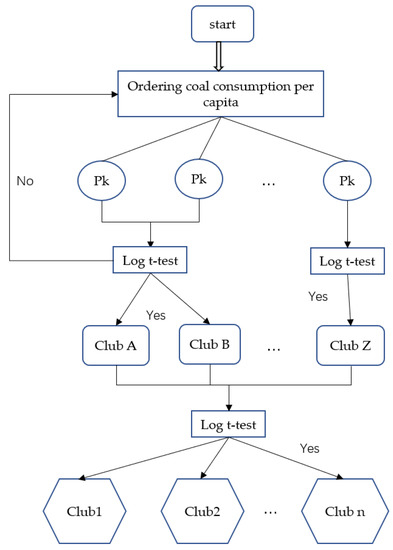
Figure 1.
Club convergence test analysis flow chart.
Step 1: Ordering. The average value of coal consumption per capita for all provinces in the final year is ranked from highest to lowest, and the average value is calculated using the following formula:
It is generally recommended that = 1/2 or = 1/3 be chosen.
Step 2: Core group formation. Based on the ranking result in Step 1, the k provinces with the highest mean values are added one by one to the alternative group of clubs. A log t regression is run for each alternative group, and the t-statistic is calculated until is less than the critical value of -1.65 for the first time. Then, core group members are screened out of k provinces with the following selection criteria:
If is not satisfied for , then the first province should be removed, and the above steps should be repeated for the second province down the line. If is not satisfied for the second province for k = 2, then this province is removed, followed by the third province, and so on. If the last province fails to satisfy the condition, there is no convergence club in the coal consumption.
Step 3: Club membership. In this step, we run log t regression for each province not included in the core convergence group (Step 2) and calculated t statistics. If (c is the set critical value, c ≥ 0), then the province should remain in the core convergence group , and the above steps should be repeated to obtain all members of the first converging club. At this point, a log t regression is performed on all provinces in that club to obtain , and if , then critical value c needs to be raised until for the first converging club.
Step 4: Stopping rule. Application of log t regression on the group of provinces not chosen in Step 3 to form a second convergence club. If , then all remaining provinces can form a second convergence club. Otherwise, steps 1 to 3 should be repeated until no convergence club can be identified, at which point the remaining provinces are considered divergent.
4. Results
4.1. Data
Our main analysis is based on per capita coal consumption. Based on data availability and completeness, the study sample consists of 30 provinces and cities in China, excluding Hong Kong, Macau, Taiwan and Tibet, and the study period is 1997–2019. Data are obtained from the China Statistical Yearbook (1997–2020) [65], China Energy Statistical Yearbook (1997–2020) [66] and statistical yearbooks of each region. The sample satisfies the independent identical distribution.
4.2. Full Panel Convergence
We employ the log t-test with the panel of per capita coal consumption of 30 provinces, the results of which are shown in Table 1.

Table 1.
Full convergence test.
As seen from Table 1, is −1.7635 and is −50.9917, which is much smaller than −1.65; that is, the null hypothesis of overall convergence is rejected at the 5% level of significance, which means that no full panel convergence of coal consumption in China exists.
4.3. Convergence Club Classification
Although there is no full panel convergence, this does not mean that there is no club convergence in the subsample of provinces. To find converging clubs, PS provided a clustering algorithm based on a nonlinear variable factor model that allows for the endogenous identification of provinces and cities, which in turn determines the existence and number of converging clubs, the final results of which are shown in Table 2.
Table 2.
Convergence club classification.
First, according to the log t-test, the 30 Chinese provinces in this study are divided into 4 initial clubs (Club1–Club4) and a divergence group. Among them, the t-statistics of the first 4 initial clubs are all greater than −1.65, indicating that the provinces within each initial club satisfy the convergence hypothesis. Second, the formed clubs are subjected to a merger test to test whether a larger convergent club could be formed. According to the results of the merger test, the t values of all the merger test coefficients are less than the critical values, indicating that none of the initial clubs could be merged. Therefore, it is proven that the initial club is the final convergent club formed. The geographical distribution of the members of these clubs is shown in Figure 2.
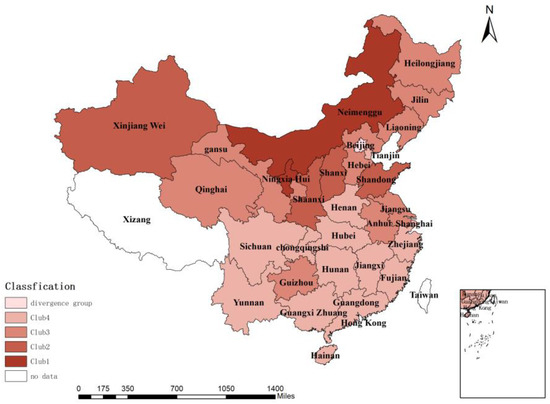
Figure 2.
Distribution of members in each club.
Figure 2 shows that the geographic locations of each club member are mostly distributed together, mainly because the changes in industrialization level, energy reserves, population size and economic level of each province not only affect the coal consumption level of the province but also radiate to other neighboring areas, thus affecting their convergence process. Figure 3 shows the geographic distribution of coal reserves in China; it can be seen that the geographic distribution of coal reserves is not exactly consistent with the geographic distribution of convergence clubs. Regionally, the distribution of Club1 to Club4 roughly follows the northern, central and southern regions of the Chinese map, respectively, with the only divergence group, i.e., Beijing, being in the northern region. Moreover, the economic strengths of each club’s members are not exactly the same, i.e., there are economically developed and relatively economically underdeveloped provinces in Club1, Club2, Club3 and Club4, indicating that the coal-consumption level in each region not only is linked to the level of economic development but also may be related to the energy structure, policies and regulations, geographical location, and environmental governance. A specific analysis of each club is presented below.
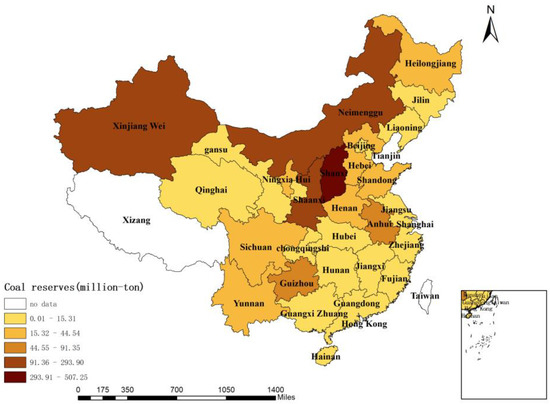
Figure 3.
Coal reserve distribution map.
Club1 includes Neimeng and Ningxia, which are both autonomous regions and geographically border each other. The difference in GDP per capita between these two provinces is significant. The GDP per capita of Neimeng is CNY 40,971.3. The GDP per capita of Ningxia is CNY 24,028.1. During the period 1997 to 2019, the per capita coal consumption of Club1 was increasing year by year. They have the fastest growth rate. For example, per capita coal consumption in Neimeng increased from 2.493 t to 19.305 t. Ningxia’s per capita coal consumption grew from 2.062 t to 19.746 t. These two provinces have the highest per capita coal consumption and the richest coal reserves compared to other provinces, and coal resources are the main source of their economic growth. However, these regions are less open to the outside world and have lower population density.
Club2 includes Shandong, Shanxi, Shaanxi and Xinjiang, which belong to the region with the next highest coal consumption. During the period 1997 to 2019, the per capita coal consumption of Club2 was increasing too. However, Club2’s growth is smaller than that of Club1. For example, per capita coal consumption in Shandong has increased from 1.124 t to 4.276 t. In addition to Xinjiang, Shanxi, Shaanxi and Shandong are relatively close to each other geographically. However, the economy of Xinjiang is relatively backward compared to those of the other provinces. The GDP per capita of Xinjiang is 23,586.9 yuan. However, since 2010, the state has introduced relevant policies to aid Xinjiang (Shanxi, Shaanxi and Shandong all aid Xinjiang), which to a certain extent promotes the development of its economy. At the same time, this situation also promotes the convergence of Xinjiang and other provinces, narrowing the differences among provinces.
Club3 includes Anhui, Gansu, Guizhou, Hebei, Heilongjiang, Jilin, Jiangsu, Liaoning, and Qinghai, which are mostly concentrated in the northern part of China, and their coal consumption shows convergence, indicating that the coal utilization rate and economic development level of these provinces are gradually shrinking. During the period 1997 to 2019, Club3’s per capita coal consumption was growing relatively slowly. For example, per capita coal consumption in Anhui has increased from 0.827 t to 2.623 t. There are many industrial provinces in Club3, for example, Heilongjiang, Jilin, and Liaoning. The annual average secondary industries are 45%, 47% and 48% respectively.
Club4 includes Fujian, Guangdong, Guangxi, Hainan, Henan, Hubei, Hunan, Jiangxi, Shanghai, Sichuan, Tianjin, Yunnan, Zhejiang and Chongqing. During the period 1997 to 2019, the growth of per capita coal consumption in Club4 is the slowest. For example, per capita coal consumption in Guangdong has increased from 0.716 t to 1.461 t. These provinces are mainly in the central and southern regions of China. These provinces include more coastal cities than do other provinces, and their level of economic development is higher. For example, the GDP per capita of Tianjin is CNY 67,574.3. As the proportion of the tertiary industry is increasing year by year, the industrial structure is improving, which prompts a reduction in the consumption of coal energy. At the same time, the reserves of coal resources in these provinces are not high, and thus, coal resources are not the main source of economic growth in these provinces.
The divergence group is Beijing because coal consumption in Beijing has been decreasing year by year since 2006, while those of all other provinces have been increasing year by year. According to the relevant information, in 2005, the National Development and Reform Commission agreed that the China Shougang Group would move out of Beijing and complete its relocation at the end of 2010. In 2013, Beijing released the “Beijing Clean Air Plan 2013–2017” to reduce CO2 emissions. With the introduction of relevant policies, Beijing, as the capital of China, has greatly reduced its coal consumption and adjusted its industrial structure.
4.4. Relative Transfer Path Analysis
To further investigate the dynamic change characteristics of different converging clubs, the relative transfer path is calculated for these four converging clubs and one diverging group according to Equation (4), which portrays the magnitude and trend of the change in coal consumption relative to the mean value. The relative transfer path values of clubs with high coal consumption are greater than 1, while those of clubs with lower coal consumption are less than 1. Figure 4 plots the average relative transfer paths for each club. It can be seen that the initial coal consumption of all converging clubs is relatively low, except for that of the divergent group. As of 2011, Club2, Club3, and Club4 all show an increasing trend in terms of relative transfer path values, and the relative transfer path value for the divergence group shows an overall decreasing trend during the study period. This decline was slow until 2011 and became faster after 2011. It should be noted that the relative transfer path values of Club2, Club3 and Club4 have all approached the direction of since 2011, while that of Club1 is always up, and that of the divergence group is always down. It can be seen that the coal-consumption levels across clubs show divergent characteristics. Therefore, to gradually reduce the level of coal consumption in China and, at the same time, ensure the security of energy consumption, it is necessary to make targeted implementation plans based on the characteristics of each province.
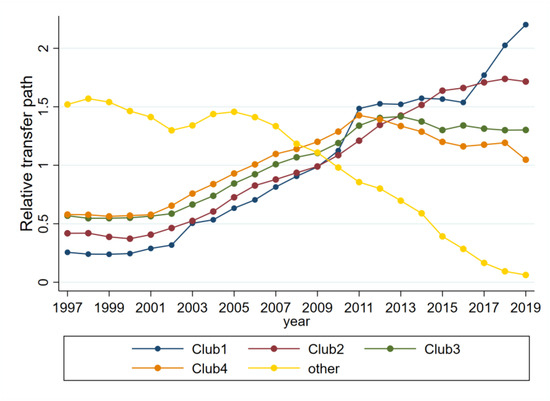
Figure 4.
Relative transfer paths for each club.
4.5. Analysis of Influencing Factors of Convergence Clubs
The previous section divides the coal consumption levels of 30 Chinese provinces into four convergence clubs and one divergence group, so the following question is a natural extension of the above analysis: what factors lead a province to converge into a certain club?
Based on the existing research results, this study considers mainly two influencing factors: initial conditions and structural characteristics. For initial conditions, the per capita coal consumption of each province and city in 1997 is selected as the indicator. For structural characteristics, gross domestic product (GDP) per capita, industrial structure, investment in fixed assets, total CO2 emissions of nine energy sources, degree of openness to the outside world, intensity of environmental regulations, geographical location and technological progress are selected as indicators. The definitions of the indicators and data sources are shown in Table 3.
Table 3.
Variables and sources.
By comparing the mean values of coal consumption corresponding to Club1 to Club 4 and the divergence group, we can see that their coal consumption levels are ordered from highest to lowest. Discrete variables based on the results of the division of convergence clubs were constructed. The values 1 to 5 are used to denote Club1 to Club4 and the divergence group, respectively, i.e., Club1 takes a value of 1, and the divergence group takes a value of 5. Then, the ordered probit model was used to analyze the reasons for the formation of convergence clubs. In the ordered probit model, the disturbances are assumed to obey the logistic distribution The model is set as follows:
where i represents each province, the dependent variable is the value taken for Club1 to Club5, denotes the estimated coefficients, denotes the explanatory variables, and denotes the disturbance terms. The specific regression results and the marginal effects of each explanatory variable at the mean are shown in Table 4. For a more visual analysis of the variation in the marginal effects of each explanatory variable on the probability of being in a certain club, we plot them graphically in Figure 5.
Table 4.
Marginal effects of factors on different club probabilities.
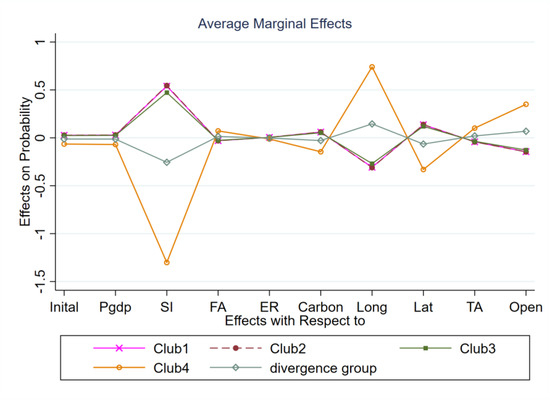
Figure 5.
Marginal effects.
The ordered probit regression results show that Pseudo R2 = 0.3924, corresponding to a p-value of 0.0000, and the significance of the regression coefficient is high, indicating that the regression model is valid. From Table 4, we can see that the regression coefficient of initial per capita coal consumption (Initial) is negative, while the corresponding marginal coefficients of Club1, Club2 and Club3 are positive, and the marginal effect coefficients of Club4 and the divergence group are negative, which indicates that the provinces with higher initial per capita coal consumption have a higher probability of belonging to Club1, Club2 and Club3, while the probability of belonging to Club4 and the divergence group is smaller. For every 1% increase in initial per capita coal consumption at the mean, the probability of the province belonging to Club1, Club2 and Club3 increases by 2.69%, 2.72% and 2.36%, respectively, while its probability of belonging to Club 4 and the divergence group decreases by 6.50% and 1.28%. It is because a large amount of coal resources is distributed in Club1, Club2 and Club3. The innate resource advantage leads Club1, Club2 and Club3 to be the clubs with high levels of coal consumption. Members of Club 4 are mostly distributed in the southern part of China and have fewer coal resource reserves, so they are considered as being in clubs with low coal-consumption levels. Similarly, the regression coefficient of carbon emissions (Carbon) is also negative. For every 1% increase in carbon emissions at the mean, the probability of the province belonging to Club1, Club2 and Club3 increases by 6.03%, 6.10% and 5.28%, respectively, while its probability of belonging to Club4 and the divergence group decreases by 14.56% and 2.86%, respectively. The reason for this may be that most of the members of Club4 and the divergence group belong to economically developed provinces, and with the national “double carbon” goal, these provinces have taken the lead in optimizing their energy structure, strengthening environmental protection and improving energy efficiency. Beijing, a member of the divergence group, has gradually shifted its local steel plants since 2010 and has introduced policies to protect the environment. Members of the other clubs are at the stage of economic development compared to those of Club4 and the divergence group, where coal is still the main source of energy consumption; in the latter, the intensity of environmental regulation is weak, and the production technology is relatively backward, resulting in higher energy consumption per unit.
The regression coefficient of openness to the outside world (Open) is positive, while the corresponding marginal coefficients of Club1, Club2 and Club3 are negative and those of Club4 and the divergence group are positive, indicating that the greater the degree of openness to the outside world, the smaller the probability of belonging to Club1, Club2 and Club3, and the greater the probability of belonging to Club4 and the divergence group. For every 1% increase in the degree of external openness at the mean, the probability of the province belonging to Club1, Club2 and Club3 decreases by 4.20%, 4.25% and 3.68%, respectively, while the probability of belonging to Club4 and the divergence group increases by 10.14% and 1.99%. The reason for this may be that those members of Club4 and the divergence group have introduced energy-saving technologies due to import/export trade, thus improving the efficiency of coal consumption, while those members of other clubs are relatively backward in terms of economic development and import and export mostly resource-intensive products, which undoubtedly increases coal input. Furthermore, the other regression coefficients can be interpreted similarly.
5. Discussion
The results of club convergence highlight the importance of tailoring energy consumption policies to converging clubs, which are composed of provinces with different characteristics and therefore different energy consumption needs. In addition, the spatial distribution of each club is different from the spatial distribution of coal reserves. For instance, some economically developed provinces have relatively high coal consumption, but few reserves. It may lead to the situation that the supply of coal exceeds the demand. At the same time, we identify four groups of provinces that converge to different equilibria in aggregated coal consumption and one diverging group. The overall trend of coal consumption in China is decreasing. In order to reduce CO2 emissions, coal consumption is being reduced in all provinces. Beijing, as the economic and political center of China, has taken the lead in responding to the “double carbon” policy, optimizing the energy structure and environmental protection. Since Beijing’s coal consumption is falling fastest, it becomes the only diverging group. The spatial distribution reveals that the provinces of each club are geographically concentrated. This indicates that neighboring provinces influence each other, which leads to the convergence of coal consumption.
Furthermore, we identify that the initial per capita coal consumption per capita, industrial structure, economic development level, environmental regulation intensity, and CO2 emissions significantly affect the club category to which each province belongs. Increases in GDP per capital, industrial structure, intensity of environment regulations and carbon emissions increase the odds of belonging to a high coal consumptions intensity club. Increases in investment in fixed assets, degree of openness to the outside world and technological progress added reduce the odds of belonging to a high coal consumptions intensity club. Each factor affects different clubs to different degrees. Of these, the secondary industry share has the greatest degree of influence on club convergence. The level of coal consumption in each province can be regulated by adjusting the industrial structure. It also confirms that club convergence methods can achieve convergence considering the presence of individual heterogeneity.
For clubs with high coal consumption, the consumption of coal can be reduced by adjusting the industrial structure, opening up and improving technological innovation. To date, many methods have been developed for controlling coal consumption, such as adjusting energy structure, improving power generation efficiency, advocating energy saving, utilizing renewable energy and exploring new energy. For the provinces with more coal mining enterprises, the technically backward coal mining enterprises should be eliminated: adhere to the combination of market regulation and government guidance; give full play to the decisive role of the market allocation of resources; and strengthen the rational guidance of national industrial policy to achieve optimal allocation of resources. The clubs with high coal consumption should promote the industrial technique level with the independent innovations, increase the industrial structure’s grade with the information system, strengthen the whole industrial competitive advantages based on the industrial agglomeration, and adjust the manufacturing industry construction by developing the multinational investment. The finding helps policy makers to set coal production and consumption targets for different provinces. The ultimate goal is to reduce the differences in coal consumption across provinces.
6. Conclusions and Policy Implications
In this study, the nonlinear time-varying factor model proposed by PS is used to screen and identify convergence clubs for interprovincial coal-consumption levels in China, and further, the ordered probit model is applied to study the factors and marginal effects affecting club grouping.
The results provide several insights. (1) There is no full panel convergence of coal consumption levels in China; however, there exist four convergence clubs and one divergence group, the geographical distributions of which are not consistent with that of China’s coal reserves. This finding indicates that there is a risk of uneven storage and use of coal across provinces in China. (2) At the same time, we identify four groups of provinces that converge to different equilibria in aggregated coal consumption and one diverging group. (3) The overall trend of coal consumption in China is decreasing, but each province is at a different stage of development, resulting in a greater variation in coal consumption levels across provinces. (4) The initial interprovincial coal consumption per capita, industrial structure, economic development level, environmental regulation intensity, and CO2 emissions significantly affect the club category to which each province belongs. Among the factors that potential influence provincial coal consumption, the GDP per capital, industrial structure, intensity of environment regulations and carbon emissions are positively related to per capita coal consumption, while investment in fixed assets, degree of openness to the outside world and technological progress are negatively related to per capita coal consumption.
The empirical findings of this study have profound policy implications. First, the heterogeneity of provinces should be taken into account when formulating and implementing initiatives to optimize the energy structure, especially with the current “double carbon” target, which aims not only to optimize the energy structure, but also to prevent the dilemma of coal shortages in each province. From the study results, we can see that there is no overall convergence of coal-consumption levels in China, and thus, a simple “one-size-fits-all” strategy is not reasonable. However, there are many provinces in China, so it is not practical to adopt a customized strategy for each province, and therefore, it is necessary to subdivide the 30 provinces and develop different strategies for different subdivisions. The strategy for each of the 30 provinces needs to be segmented so that different strategies can be developed for different segments.
Second, the exchange of experience between regions should be strengthened. Regions with a high level of coal consumption, such as Club1 and Club2, should actively adjust their industrial structure, refer to the experience of neighboring regions when formulating relevant policies, and strengthen the technology exchange across regions, which can not only avoid the waste of resources caused by the duplication of technological innovation, but also narrow the gap across regions.
Third, coal plays the role of the main type of energy in China. Club members with relatively high coal-consumption levels, such as Inner Mongolia, Ningxia, and Xinjiang, should actively adjust their industrial structure and improve the utilization rate of coal. Moreover, these members are guaranteed a national coal supply. In the face of energy supply and demand tensions, these members should accelerate the application of advanced mining technology development and increase their production capacity to respond to the uncertainty of the external environment with the certainty of domestic supply. Club members with intermediate coal-consumption levels, such as Anhui, Jiangsu, Heilongjiang, Guizhou, and Hebei, should increase their technological innovation and openness to the outside world, while those with lower coal-consumption levels, such as Shanghai, Sichuan, Guangdong, and Zhejiang, should further solidify the role of coal as a bottom-up guarantee and fully exploit the flexible adjustment capacity to use coal as an important “support” for energy security.
The above policy insights are still of value to other countries. In particular, it is important to tailor energy consumption policies to local conditions. Only a reasonable division of regions can lead to more targeted policies.
Finally, the findings should be expanded in future studies. The coal production of each region should be considered in the exploration of the club grouping factors. Further research is needed on club convergence tests for coal production.
Author Contributions
Conceptualization, Y.H.; methodology, B.W.; software, Y.H.; validation, Y.H.; formal analysis, Y.H.; data curation, Y.H.; writing—original draft preparation, Y.H.; writing—review and editing, B.W. and R.Q.; supervision, R.Q.; funding acquisition, Y.H. All authors have read and agreed to the published version of the manuscript.
Funding
This work was supported by the Independent Research fund of Joint National-Local Engineering Research Centre for Safe and Precise Coal Mining (No.EC2021013).
Institutional Review Board Statement
Not applicable.
Informed Consent Statement
Not applicable.
Data Availability Statement
Data is contained within the article.
Conflicts of Interest
The authors declare no conflict of interest.
Abbreviations
| Initial | Levels initial |
| Pgdp | GDP per capital |
| SI | Industrial structure |
| FA | Investment in fixed assets |
| ER | Environment regulation |
| Carbon | Carbon dioxide |
| Long | Longitude |
| Lat | Latitude |
| Open | Opening |
| TA | Technology advancement |
References
- Shi, D. Energy security and energy safety measures. Nanomaterials 1998, 12, 56–57. [Google Scholar]
- Central Documentary Research Office of the Communist Party of China. Excerpts from Xi Jinping’s Discourse on Socialist Social Construction; Central Literature Publishing House: Beijing, China, 2017. [Google Scholar]
- Adebayo, T.S.; Awosusi, A.A.; Bekun, F.V. Coal energy consumption beat renewable energy consumption in South Africa: Developing policy framework for sustainable development. Renew. Energy 2021, 175, 1012–1024. [Google Scholar] [CrossRef]
- Winzer, C. Conceptualizing energy security. Energy Policy 2012, 46, 36–48. [Google Scholar] [CrossRef]
- Huang, Y.; Yi, Q.; Kang, J.X.; Zhang, Y.G.; Li, W.Y.; Feng, J.; Xie, K.C. Investigation and optimization analysis on deployment of China coal chemical industry under carbon emission constraints. Appl. Energy 2019, 254, 113684. [Google Scholar] [CrossRef]
- Tang, X.; Jin, Y.; McLellan, B.C.; Wang, J.; Li, S. China’s coal consumption declining—Impermanent or permanent? Resour. Conserv. Recycl. 2018, 129, 307–313. [Google Scholar] [CrossRef]
- Liu, L.C.; Cheng, L.; Zhao, L.T.; Cao, Y.; Wang, C. Investigating the significant variation of coal consumption in China in 2002–2017. Energy 2020, 207, 118307. [Google Scholar] [CrossRef]
- Jiang, S.; Yang, C.; Guo, J.; Ding, Z. ARIMA forecasting of China’s coal consumption, price and investment by 2030. Energy Sources Part B Econ. Plan. Policy 2018, 13, 190–195. [Google Scholar] [CrossRef]
- Bloch, H.; Rafiq, S.; Salim, R. Coal consumption, CO2 emission and economic growth in China: Empirical evidence and policy responses. Energy Econ. 2012, 344, 518–528. [Google Scholar] [CrossRef]
- Tiwari, A.K.; Shahbaz, M.; Hye, Q.M.A. The environmental Kuznets curve and the role of coal consumption in India: Cointegration and causality analysis in an open economy. Renew. Sustain. Energy Rev. 2013, 18, 519–527. [Google Scholar] [CrossRef]
- Apergis, N.; Payne, J.E. Coal consumption and economic growth: Evidence from a panel of OECD countries. Energy Policy 2010, 38, 1353–1359. [Google Scholar] [CrossRef]
- Shahbaz, M.; Tiwari, A.K.; Nasir, M. The effects of financial development, economic growth, coal consumption and trade openness on CO2 emissions in South Africa. Energy Policy 2013, 61, 1452–1459. [Google Scholar] [CrossRef]
- Shahbaz, M.; Farhani, S.; Ozturk, I. Do coal consumption and industrial development increase environmental degradation in China and India? Environ. Sci. Pollut. Res. 2015, 22, 3895–3907. [Google Scholar] [CrossRef] [PubMed]
- Magazzino, C.; Mele, M.; Schneider, N. A machine learning approach on the relationship among solar and wind energy pro-duction, coal consumption, GDP, and CO2 emissions. Renew. Energy 2021, 167, 99–115. [Google Scholar] [CrossRef]
- Lei, Y.; Li, L.; Pan, D. Study on the relationships between coal consumption and economic growth of the six biggest coal con-sumption countries: With coal price as a third variable. Energy Procedia 2014, 61, 624–634. [Google Scholar] [CrossRef]
- Xie, X.; Ai, H.; Deng, Z. Impacts of the scattered coal consumption on PM2.5 pollution in China. J. Clean. Prod. 2019, 245, 118922. [Google Scholar] [CrossRef]
- Yang, X.; Zhang, J.; Ren, S.; Ran, Q. Can the new energy demonstration city policy reduce environmental pollution? Evidence from a quasi-natural experiment in China. J. Clean. Prod. 2021, 287, 125015. [Google Scholar] [CrossRef]
- Salah, W.A.; Abuhelwa, M.; Bashir, M.J.K. The key role of sustainable renewable energy technologies in facing shortage of energy supplies in Palestine: Current practice and future potential. J. Clean. Prod. 2021, 293, 125348. [Google Scholar] [CrossRef]
- Zhao, J.; Patwary, A.K.; Qayyum, A.; Alharthi, M.; Bashir, F.; Mohsin, M.; Abbas, Q. The determinants of renewable energy sources for the fueling of green and sustainable economy. Energy 2022, 238, 2029. [Google Scholar] [CrossRef]
- Xie, Y.; Wu, D.; Zhu, S. Can new energy vehicles subsidy curb the urban air pollution? Empirical evidence from pilot cities in China. Sci. Total Environ. 2021, 754, 142232. [Google Scholar] [CrossRef]
- Long, R.; Wang, H.; Chen, H. Regional differences and pattern classifications in the efficiency of coal consumption in China. J. Clean. Prod. 2016, 112, 3684–3691. [Google Scholar] [CrossRef]
- Li, R.; Leung GC, K. Coal consumption and economic growth in China. Energy Policy 2012, 40, 438–443. [Google Scholar] [CrossRef]
- Yu, J.L.; Shao, C.F.; Xue, C.Y. China’s aircraft-related CO2 emissions: Decomposition analysis, decoupling status, and future trends. Energy Policy 2020, 138, 12–15. [Google Scholar] [CrossRef]
- Phillips, P.C.B.; Sul, D. Transition modeling and econometric convergence tests. Econometrica 2007, 75, 1771–1855. [Google Scholar] [CrossRef]
- Solow, R.M. A contribution to the theory of economic growth. Q. J. Econ. 1956, 70, 65–94. [Google Scholar] [CrossRef]
- Barro, R.J.; Sala-I-Martin, X. Convergence. J. Political Econ. 1992, 100, 223–251. [Google Scholar] [CrossRef]
- Barro, R.J. Determinants of Economic Growth: A Cross-Country Empirical Study; The MIT Press: Cambridge, MA, USA; London, UK, 1998. [Google Scholar]
- Galor, O. Convergence? Inferences from theoretical models. Econ. J. 1996, 106, 1056–1069. [Google Scholar] [CrossRef]
- Barro, R.J.; Sala-i-Martin, X.; Blanchard, O.J.; Hall, R.E. Convergence across states and regions. Brook. Pap. Econ. Act. 1991, 1991, 107–182. [Google Scholar] [CrossRef]
- Baumol, W.J. Productivity Growth, Convergence, and Welfare: What the Long-run Data Show. Am. Econ. Rev. 1986, 76, 1072–1085. [Google Scholar]
- Chatterji, M. Convergence clubs and endogenous growth. Oxf. Rev. Econ. Policy 1992, 8, 57–69. [Google Scholar] [CrossRef]
- Chatterji, M.; Dewhurst, J.H.L. Convergence clubs and relative economic performance in Great Britain: 1977–1991. Reg. Stud. 1996, 30, 31–39. [Google Scholar] [CrossRef]
- Iacovone, L.; Sanchez, B.L.F.; Sharma, S. Regional Productivity Convergence in Peru; Social Science Electronic Publishing: Rochester, NY, USA, 2018. [Google Scholar]
- List, J.A. Have air pollutant emissions converged among U.S. regions? Evidence from unit root tests. South Econ. J. 1999, 66, 144–155. [Google Scholar] [CrossRef]
- FIingleton, B. Spurious spatial regression: Some monte carlo results with a spatial unit root and spatial cointegration. J. Reg. Sci. 1999, 39, 1–19. [Google Scholar] [CrossRef]
- Camarero, M.; Castillo, J.; Picazo-Tadeo, A.J.; Tamarit, C. Eco-efficiency and Convergence in OECD Countries. Environ. Resour. Econ. 2013, 55, 87–106. [Google Scholar] [CrossRef]
- Herrerias, M.J.; Liu, G. Electricity Intensity Across Chinese Provinces: New Evidence on Convergence and Threshold Ef-fects. Energy Econ. 2013, 36, 268–276. [Google Scholar] [CrossRef]
- Mishra, V.; Smyth, R. Convergence in energy consumption per capita among ASEAN countries. Energy Policy 2014, 73, 180–185. [Google Scholar] [CrossRef]
- Sheng, Y.; Shi, X.; Zhang, D. Economic growth, regional disparities and energy demand in China. Energy Policy 2014, 71, 31–39. [Google Scholar] [CrossRef]
- Solarin, S.A.; Gil-Alana, L.A.; Al-Mulali, U. Stochastic convergence of renewable energy consumption in OECD countries: A fractional integration approach. Environ. Sci. Pollut. Res. 2018, 25, 17289–17299. [Google Scholar] [CrossRef]
- Mulder, P.; De Groot, H.L.F. Structural change and convergence of energy intensity across OECD countries, 1970–2005. Energy Econ. 2012, 34, 1910–1921. [Google Scholar] [CrossRef]
- Meng, M.; Payne, J.E.; Lee, J. Convergence in per capita energy use among OECD countries. Energy Econ. 2013, 36, 536–545. [Google Scholar] [CrossRef]
- Fallahi, F.; Voia, M.C. Convergence and persistence in per capita energy use among OECD countries: Revisited using confidence intervals. Energy Econ. 2015, 52, 246–253. [Google Scholar] [CrossRef]
- Liddle, B. Revisiting world energy intensity convergence for regional differences. Appl. Energy 2010, 87, 3218–3225. [Google Scholar] [CrossRef]
- Mohammadi, H.; Ram, R. Convergence in energy consumption per capita across the U.S. states, 1970–2013: An exploration through selected parametric and non-parametric methods. Energy Econ. 2017, 62, 404–410. [Google Scholar] [CrossRef]
- He, Y. Economic Convergence in Transition Economy of China: An Empirical Study with a Nonlinear Time-varying Factor Model. Econ. Res. J. 2008, 7, 39–51. [Google Scholar]
- Spreafico, C.; Landi, D. Investigating students’ eco-misperceptions in applying eco-design methods. J. Clean. Prod. 2022, 342, 130866. [Google Scholar] [CrossRef]
- Phillips, P.C.B.; Sul, D. Economic transition and growth. J. Appl. Econom. 2009, 24, 1153–1185. [Google Scholar] [CrossRef]
- Phillips, P.C.B.; Sul, D. Some empirics on economic growth under heterogeneous technology. J. Macroecon. 2007, 29, 455–469. [Google Scholar] [CrossRef]
- Bartkowska, M.; Riedl, A. Regional convergence clubs in Europe: Identification and conditioning factors. Econ. Model. 2012, 29, 22–31. [Google Scholar] [CrossRef]
- Ghosh, M.; Ghoshray, A.; Malki, I. Regional divergence and club convergence in India. Econ. Model. 2013, 30, 733–742. [Google Scholar] [CrossRef]
- Liu, X.T.; Li, Q.; Wu, C. Dynamic Analysis of Agricultural Total Factor Productivity in China—Based on SFA Model and LOG(T) Regression Method. Chin. J. Agric. Resour. Reg. Plan. 2022, 16, e0257239. [Google Scholar]
- Wang, S.G.; Chen, Y.Q.; Tian, X. Research on the Development Status and Convergence of Digital Inclusive Finance in Chi-na—Investigation based on logt test. Lanzhou Acad. J. 2022, 6, 385–404. [Google Scholar]
- Panopoulou, E.; Pantelidis, T. Club convergence in carbon dioxide emissions. Environ. Resour. Econ. 2009, 44, 47–70. [Google Scholar] [CrossRef]
- Zhang, P.W.; Jia, G.S.; Mou, Q. Analysis of carbon productivity club convergence and conditioning factors in China’s construction industry. China Popul. Resour. Environ. 2019, 29, 40–49. [Google Scholar]
- Wang, Y.M.; Zhang, P.; Cai, C.D. An Empirical Study of the Convergence of Carbon Intensity in China. J. Xiamen Univ. 2014, 222, 120–128. [Google Scholar]
- Olson, D.; Zoubi, T. Convergence in bank performance for commercial and Islamic banks during and after the Global Financial Crisis. Q. Rev. Econ. Financ. 2017, 65, 71–87. [Google Scholar] [CrossRef]
- Solarin, S.A.; Tiwari, A.K.; Bello, M.O. A multi-country convergence analysis of ecological footprint and its components. Sustain. Cities Soc. 2019, 46, 101422. [Google Scholar] [CrossRef]
- Sun, H.; Kporsu, A.K.; Taghizadeh-Hesary, F. Estimating environmental efficiency and convergence: 1980 to 2016. Energy 2020, 208, 118224. [Google Scholar] [CrossRef]
- Von Lyncker, K.; Thoennessen, R. Regional club convergence in the EU: Evidence from a panel data analysis. Empir. Econ. 2017, 52, 525–553. [Google Scholar] [CrossRef]
- Li, F.; Li, G.; Qin, W.; Ma, H. Identifying economic growth convergence clubs and their influencing factors in China. Sustainability 2018, 10, 2588. [Google Scholar] [CrossRef]
- Shengren, P. Analysis of Convergence of Provincial Environmental Efficiency of China and Dynamic Processes. Manag. Rev. 2020, 32, 52–62. [Google Scholar]
- He, X.M.; Lai, Y.J. Environment Efficiency Club Convergence Analysis Based on the Nonlinear Time-Varying Factor Model. Soft Sci. 2017, 31, 103–106. [Google Scholar]
- Liu, Q.Q.; Song, R.; Zhou, G.M. Club convergence in China’s foreign tourist source market: Recognition method and convergence factors. Tour. Trib. 2021, 36, 88–102. [Google Scholar]
- Available online: https://data.stats.gov.cn/ (accessed on 19 September 2022).
- Available online: https://www.gtarsc.com/ (accessed on 19 September 2022).


Disclaimer/Publisher’s Note: The statements, opinions and data contained in all publications are solely those of the individual author(s) and contributor(s) and not of MDPI and/or the editor(s). MDPI and/or the editor(s) disclaim responsibility for any injury to people or property resulting from any ideas, methods, instructions or products referred to in the content. |
© 2023 by the authors. Licensee MDPI, Basel, Switzerland. This article is an open access article distributed under the terms and conditions of the Creative Commons Attribution (CC BY) license (https://creativecommons.org/licenses/by/4.0/).