

Study on the Cell Magnification Equivalent Method in Out-of-Plane Compression Simulations of Aluminum Honeycomb
 , ,
, ,
Abstract
:1. Introduction
2. Modeling Approaches and Test Validation
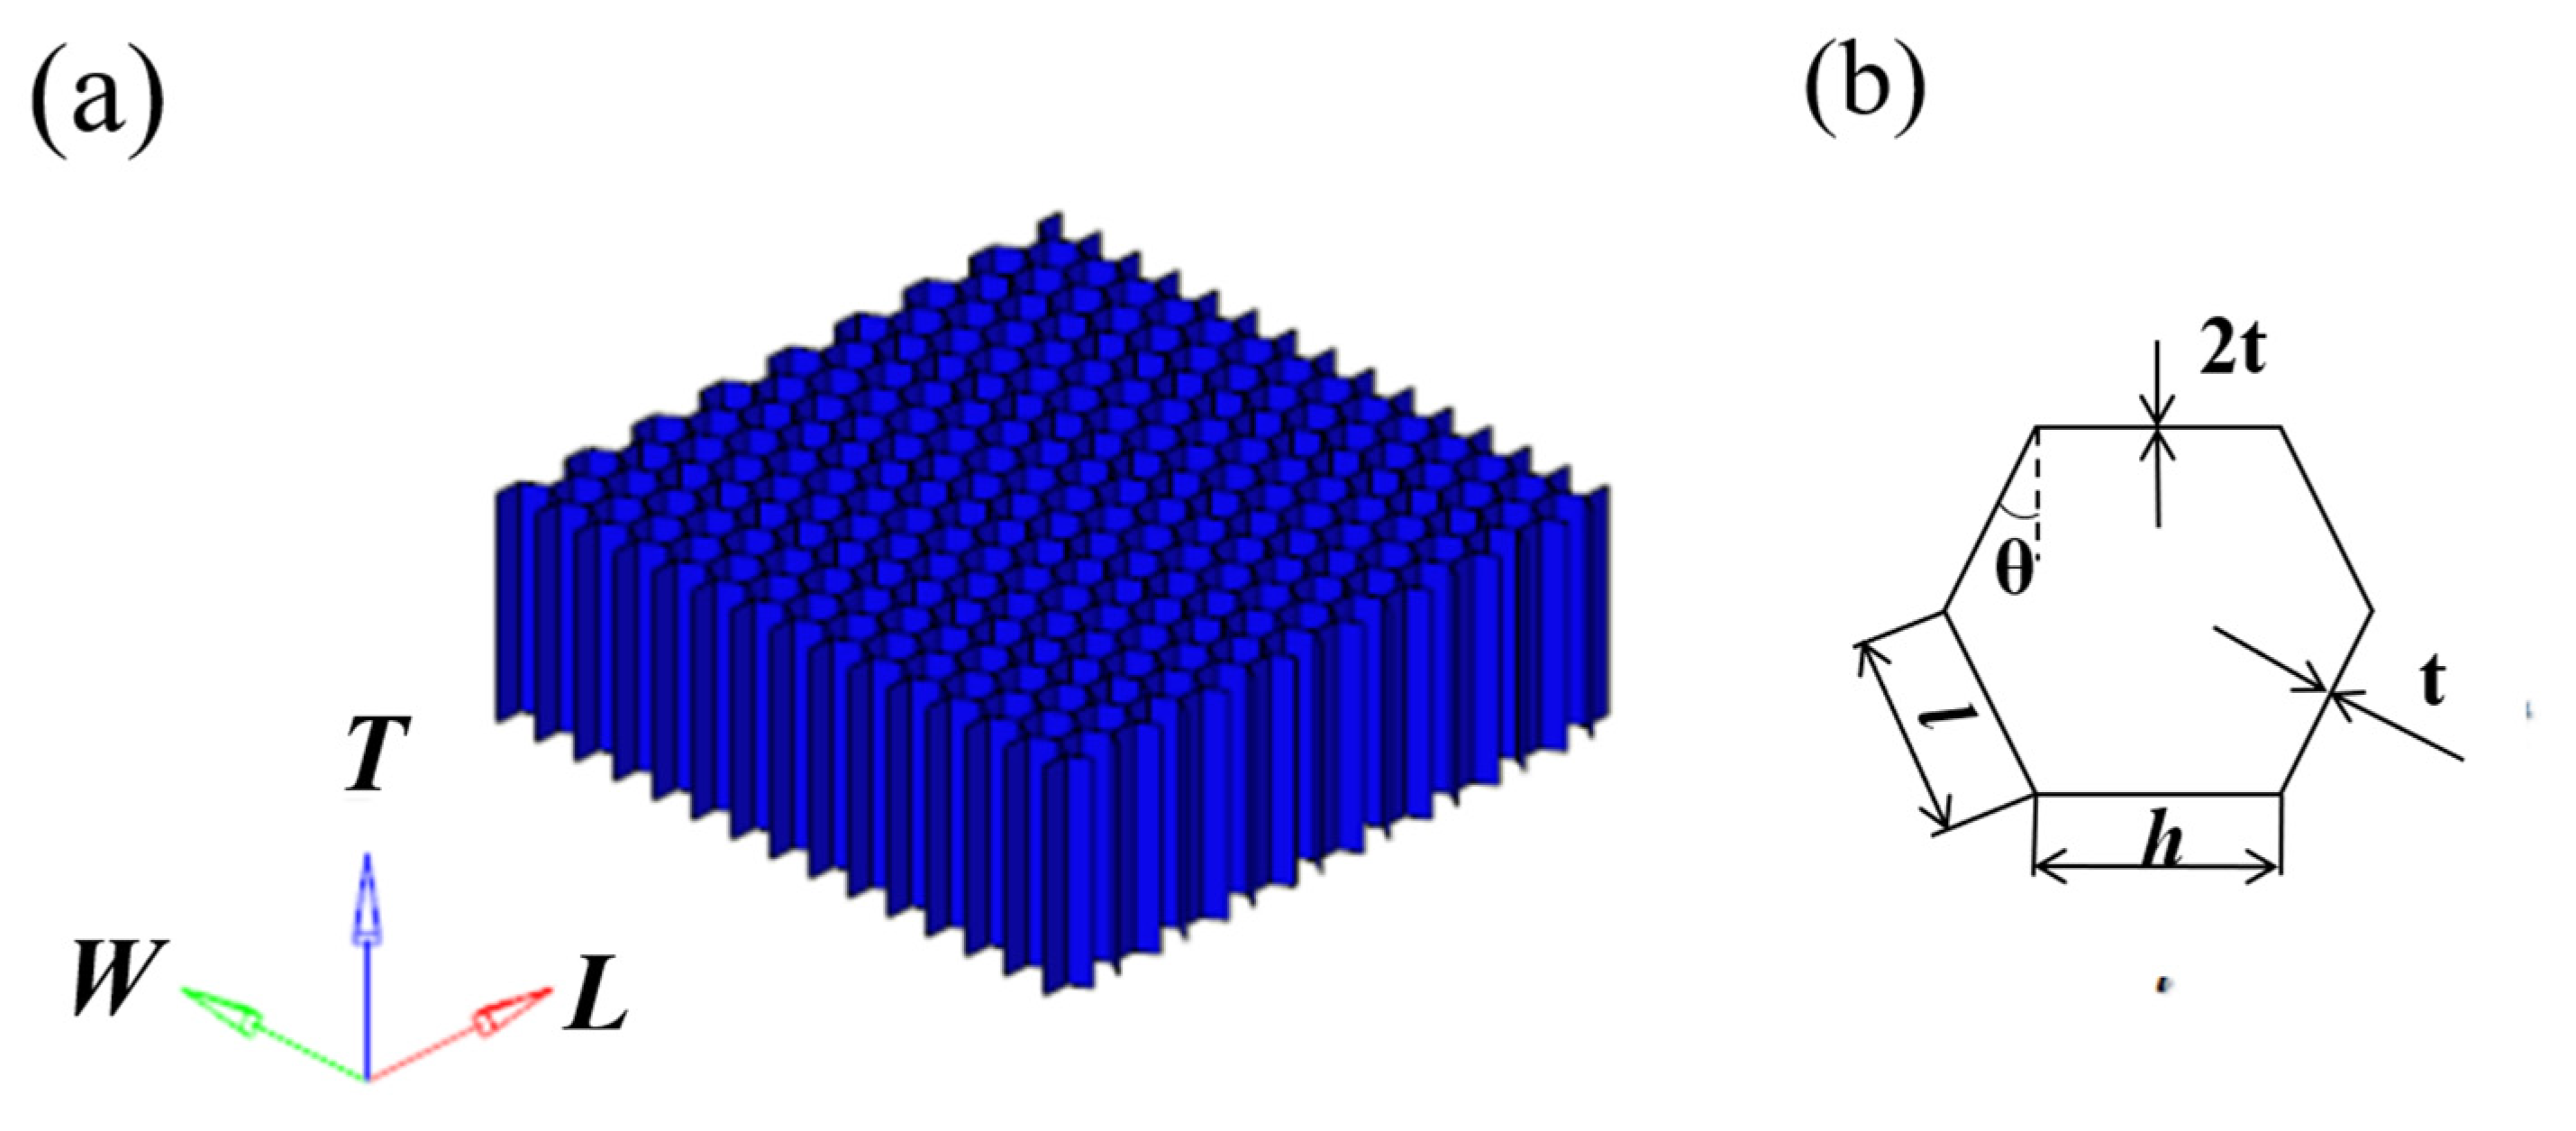
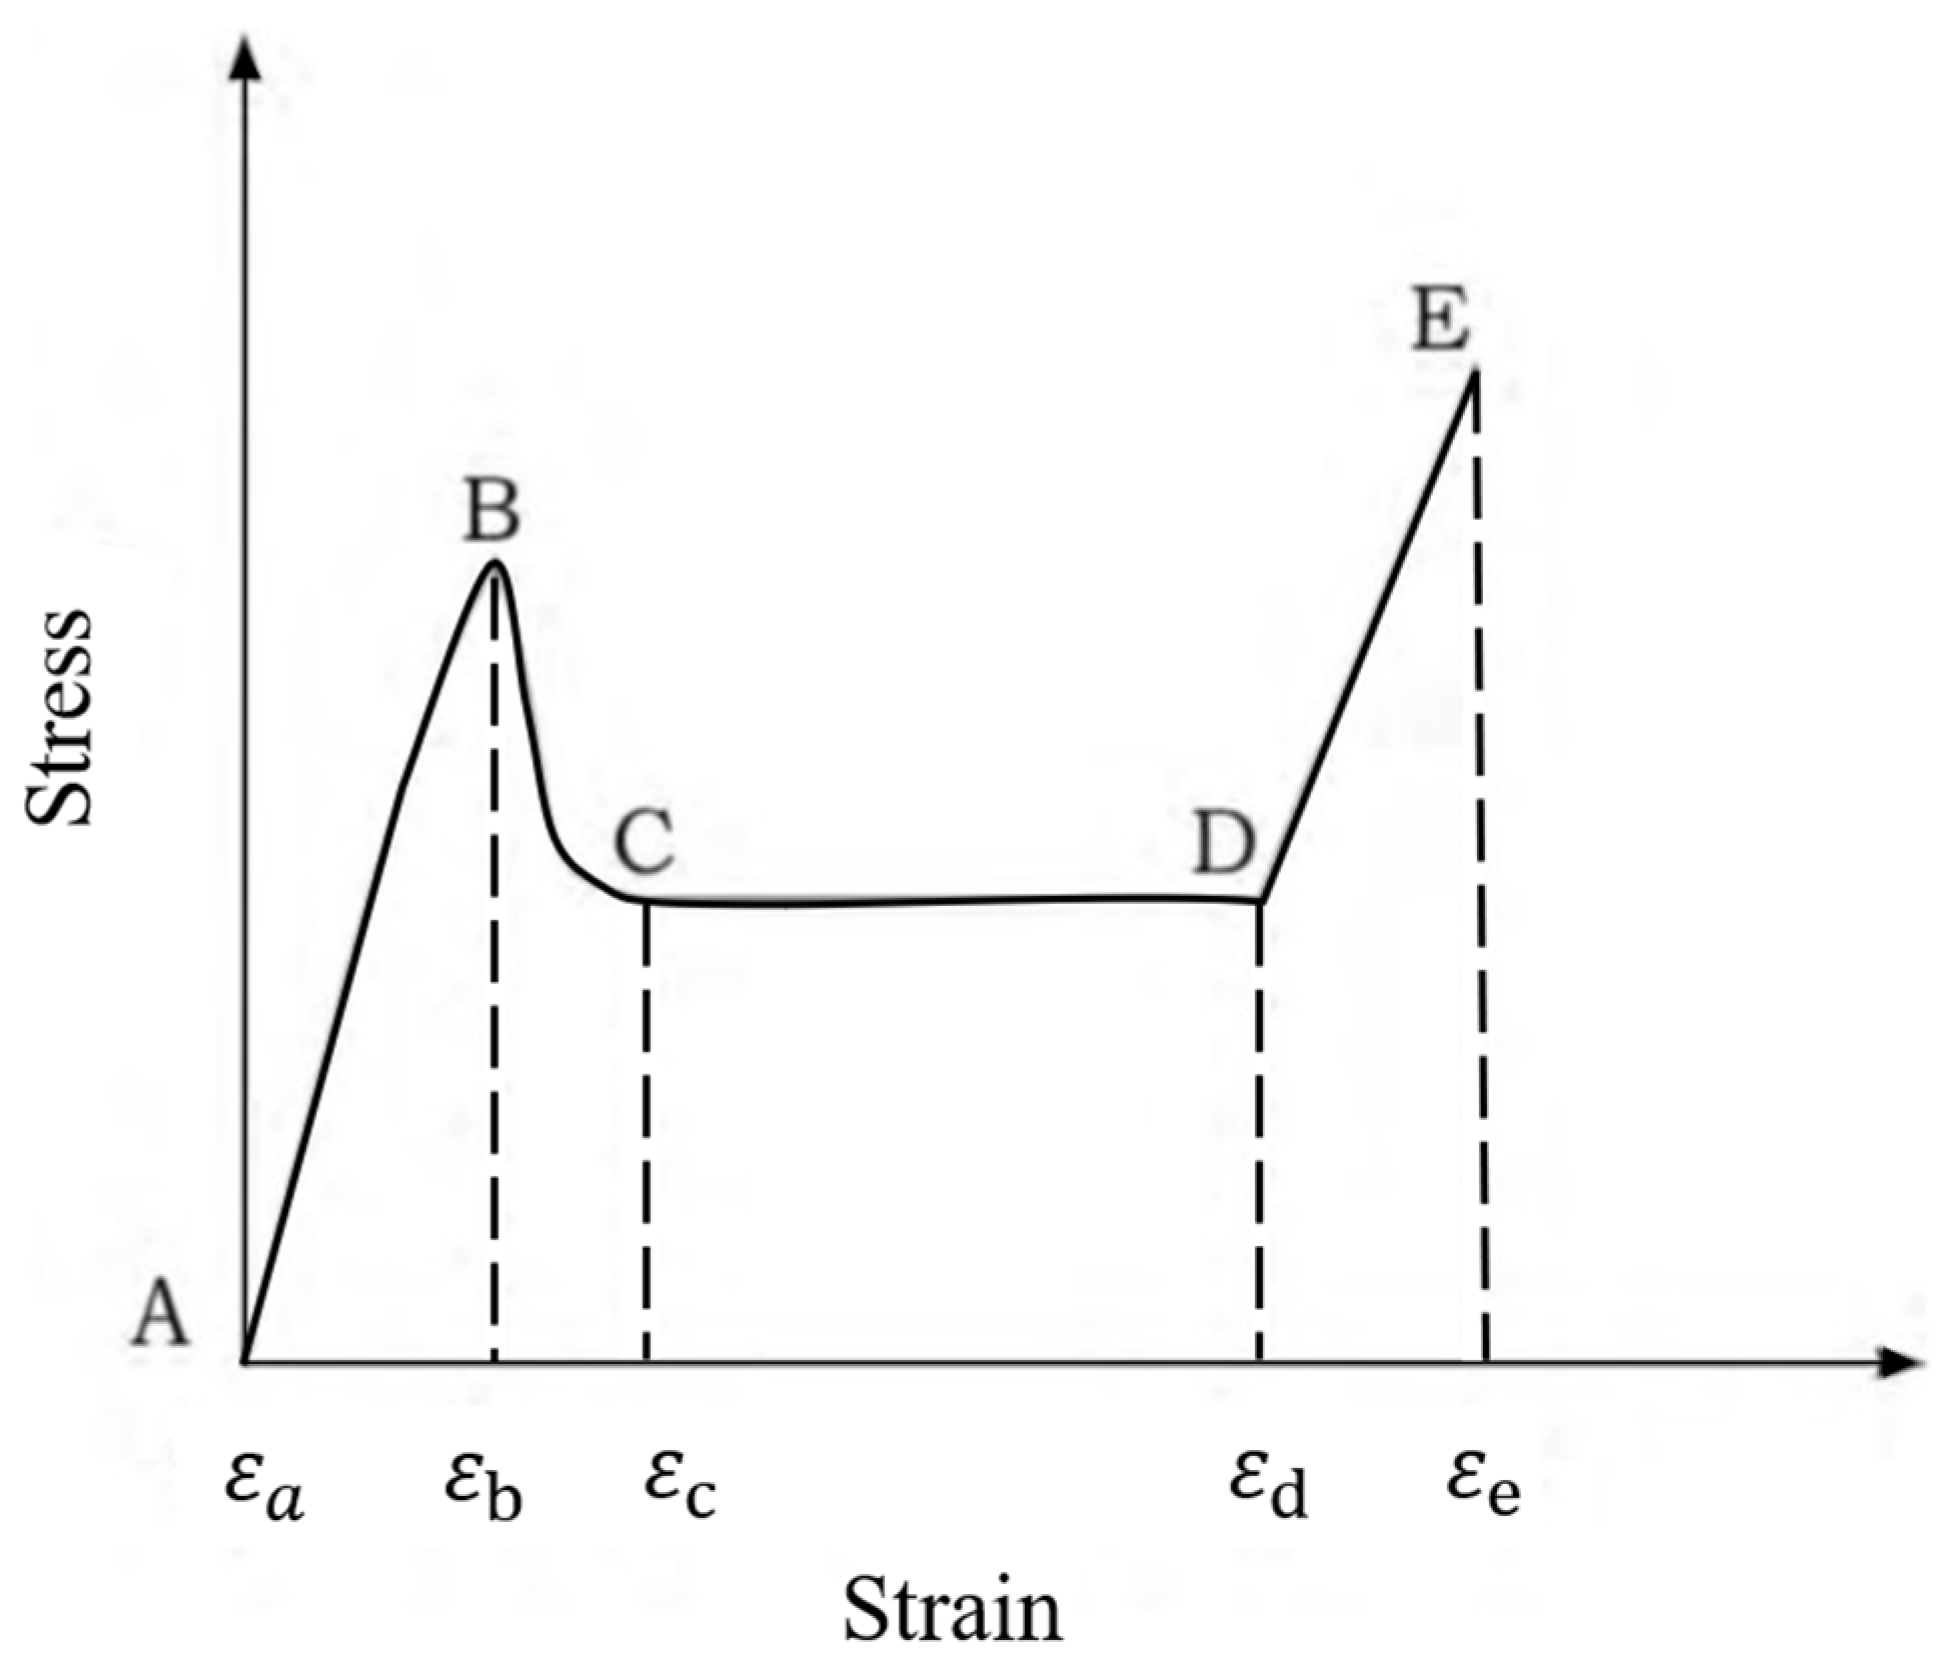
2.1. Basic Properties of Honeycombs and Evaluation Indicators of Honeycombs
2.2. Finite Element Model and Test Scheme
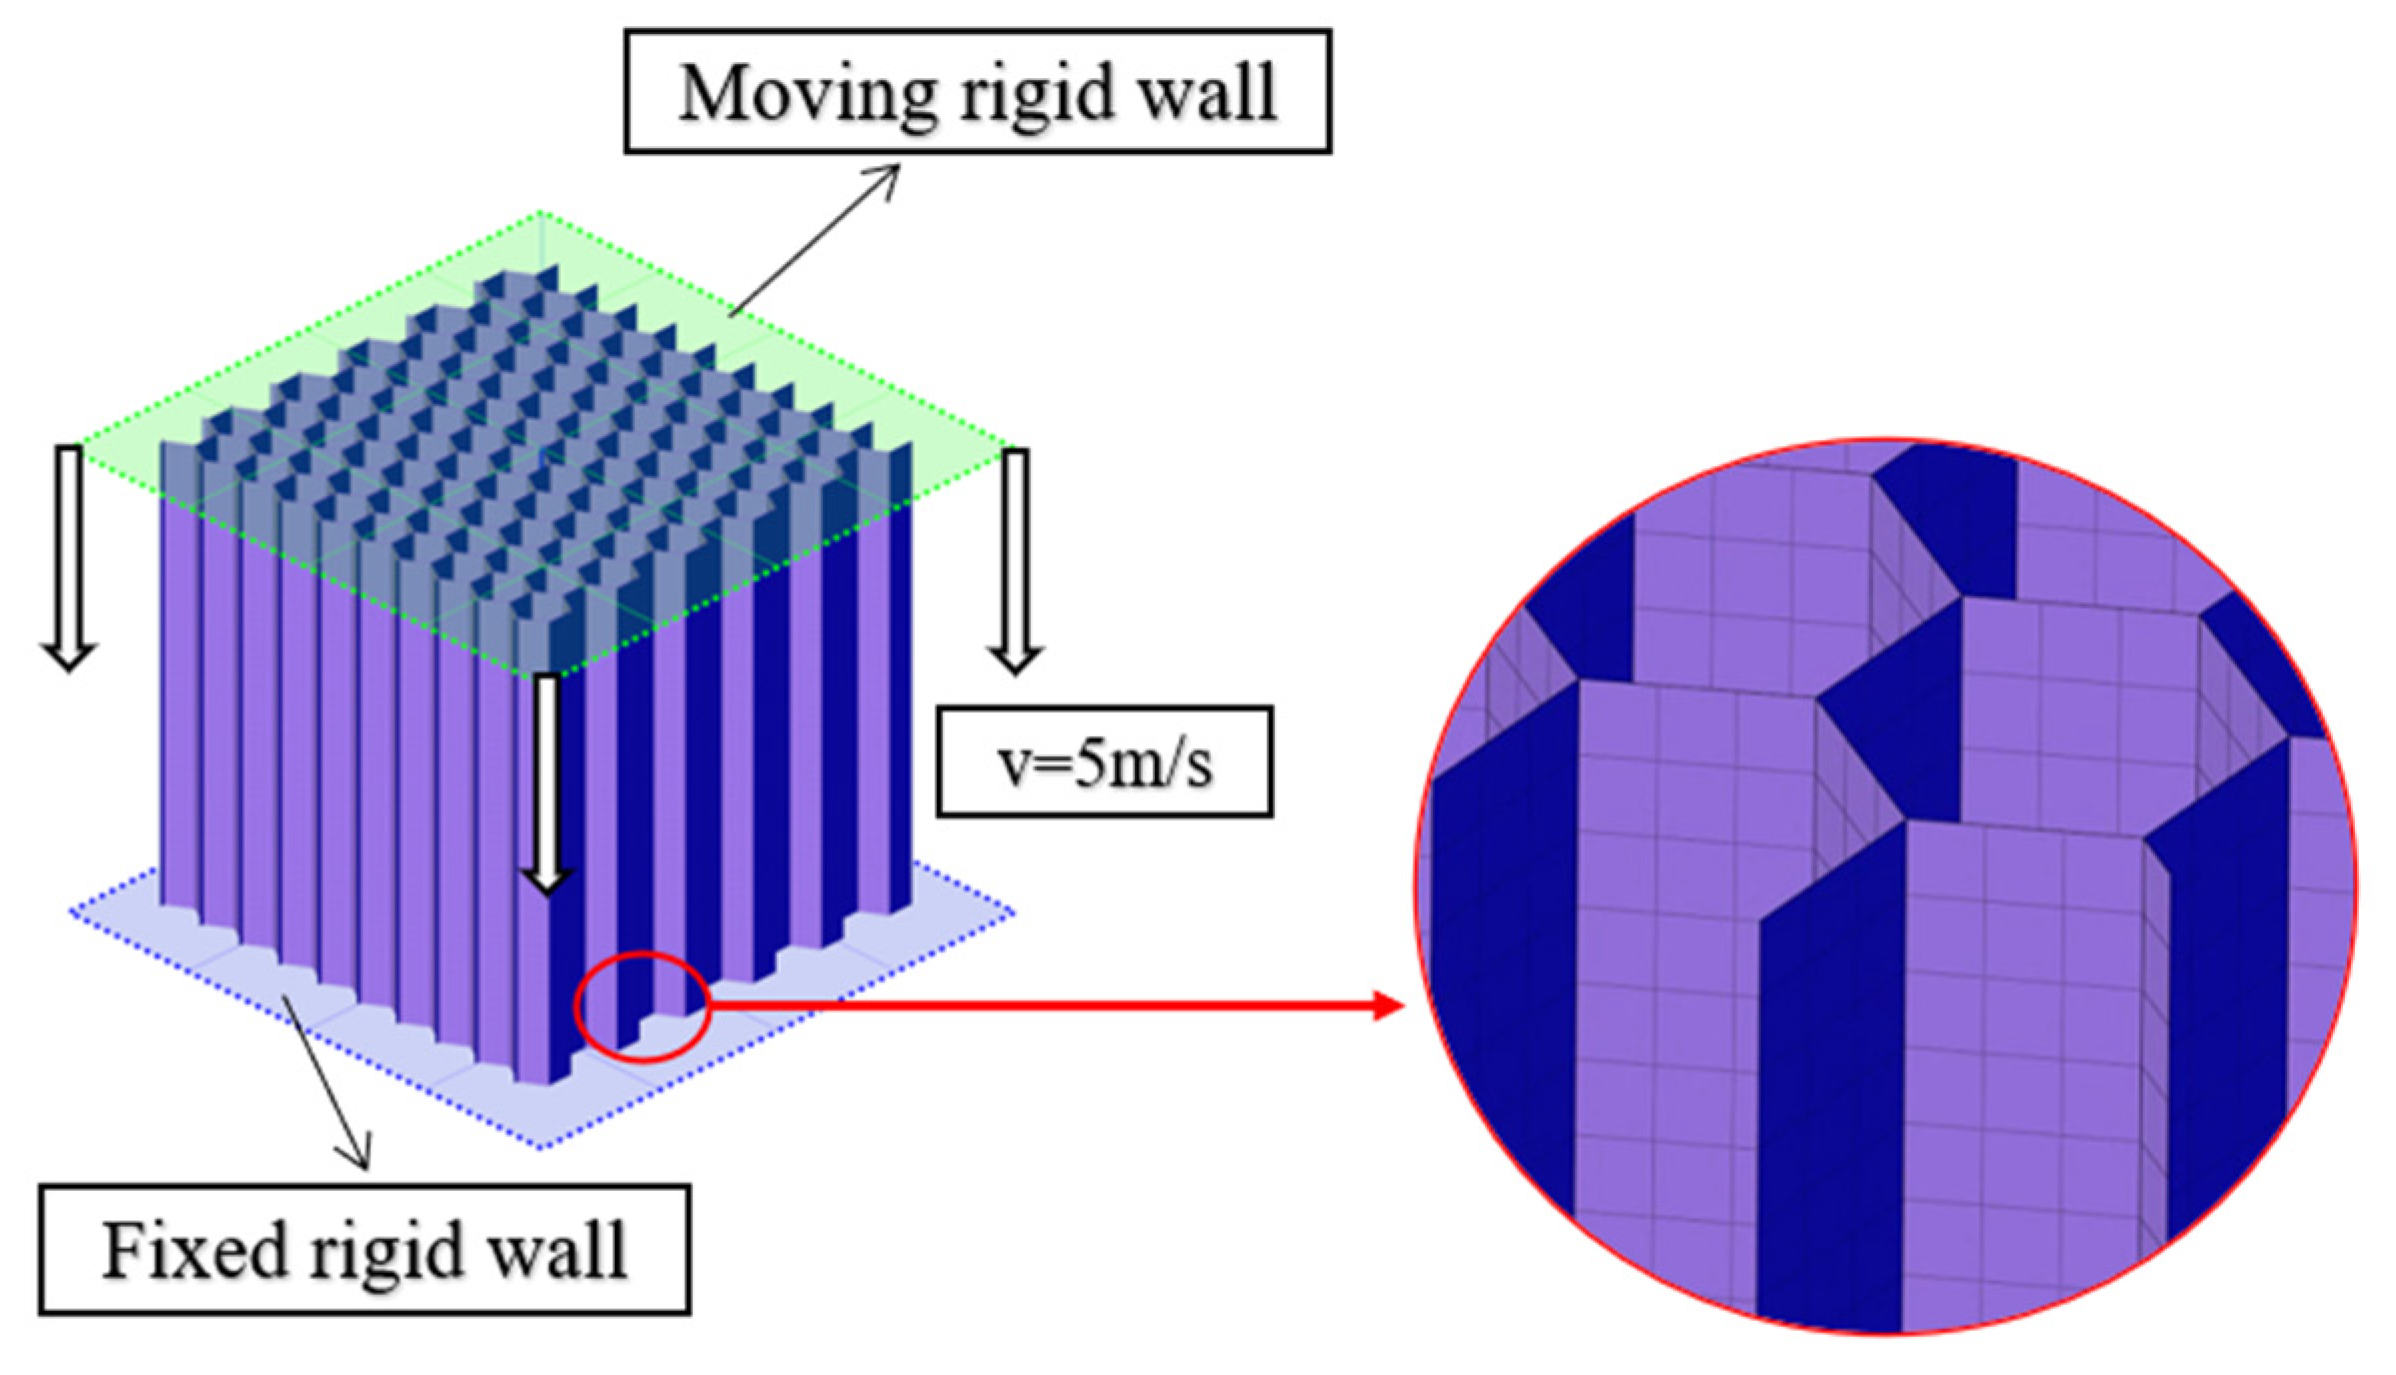
2.2.1. Finite Element Model
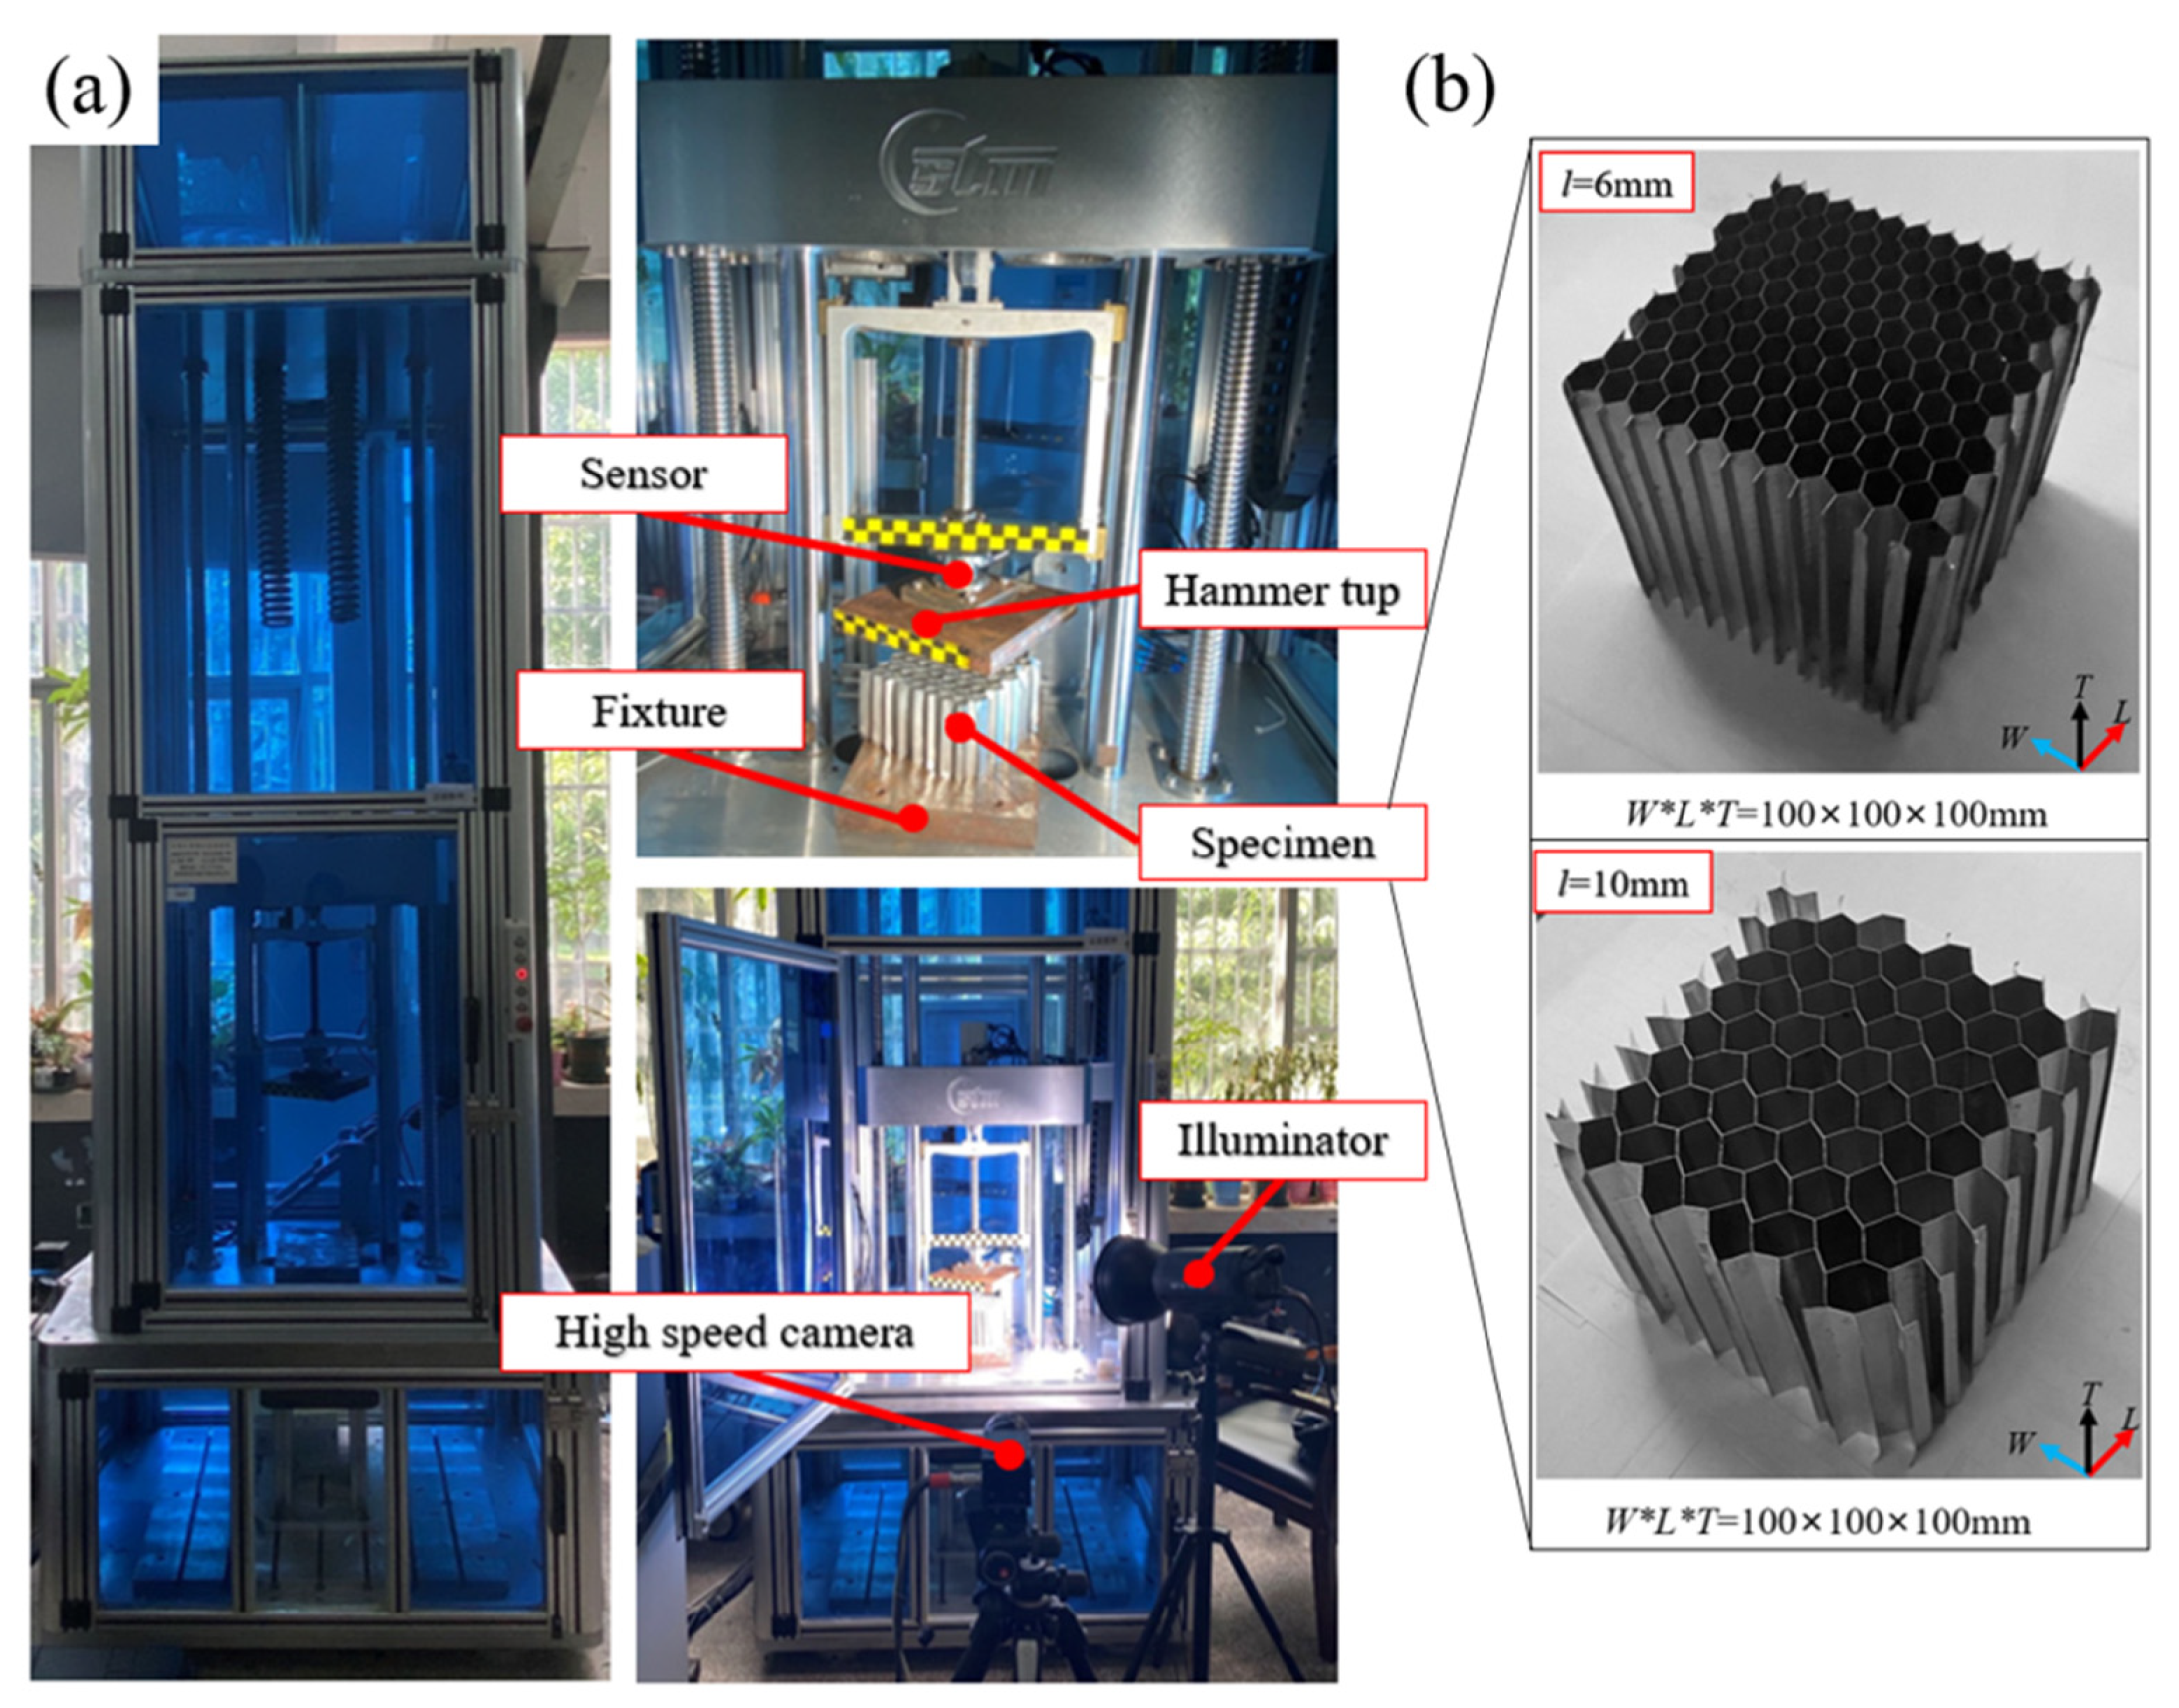
2.2.2. Specimens and Testing Procedure
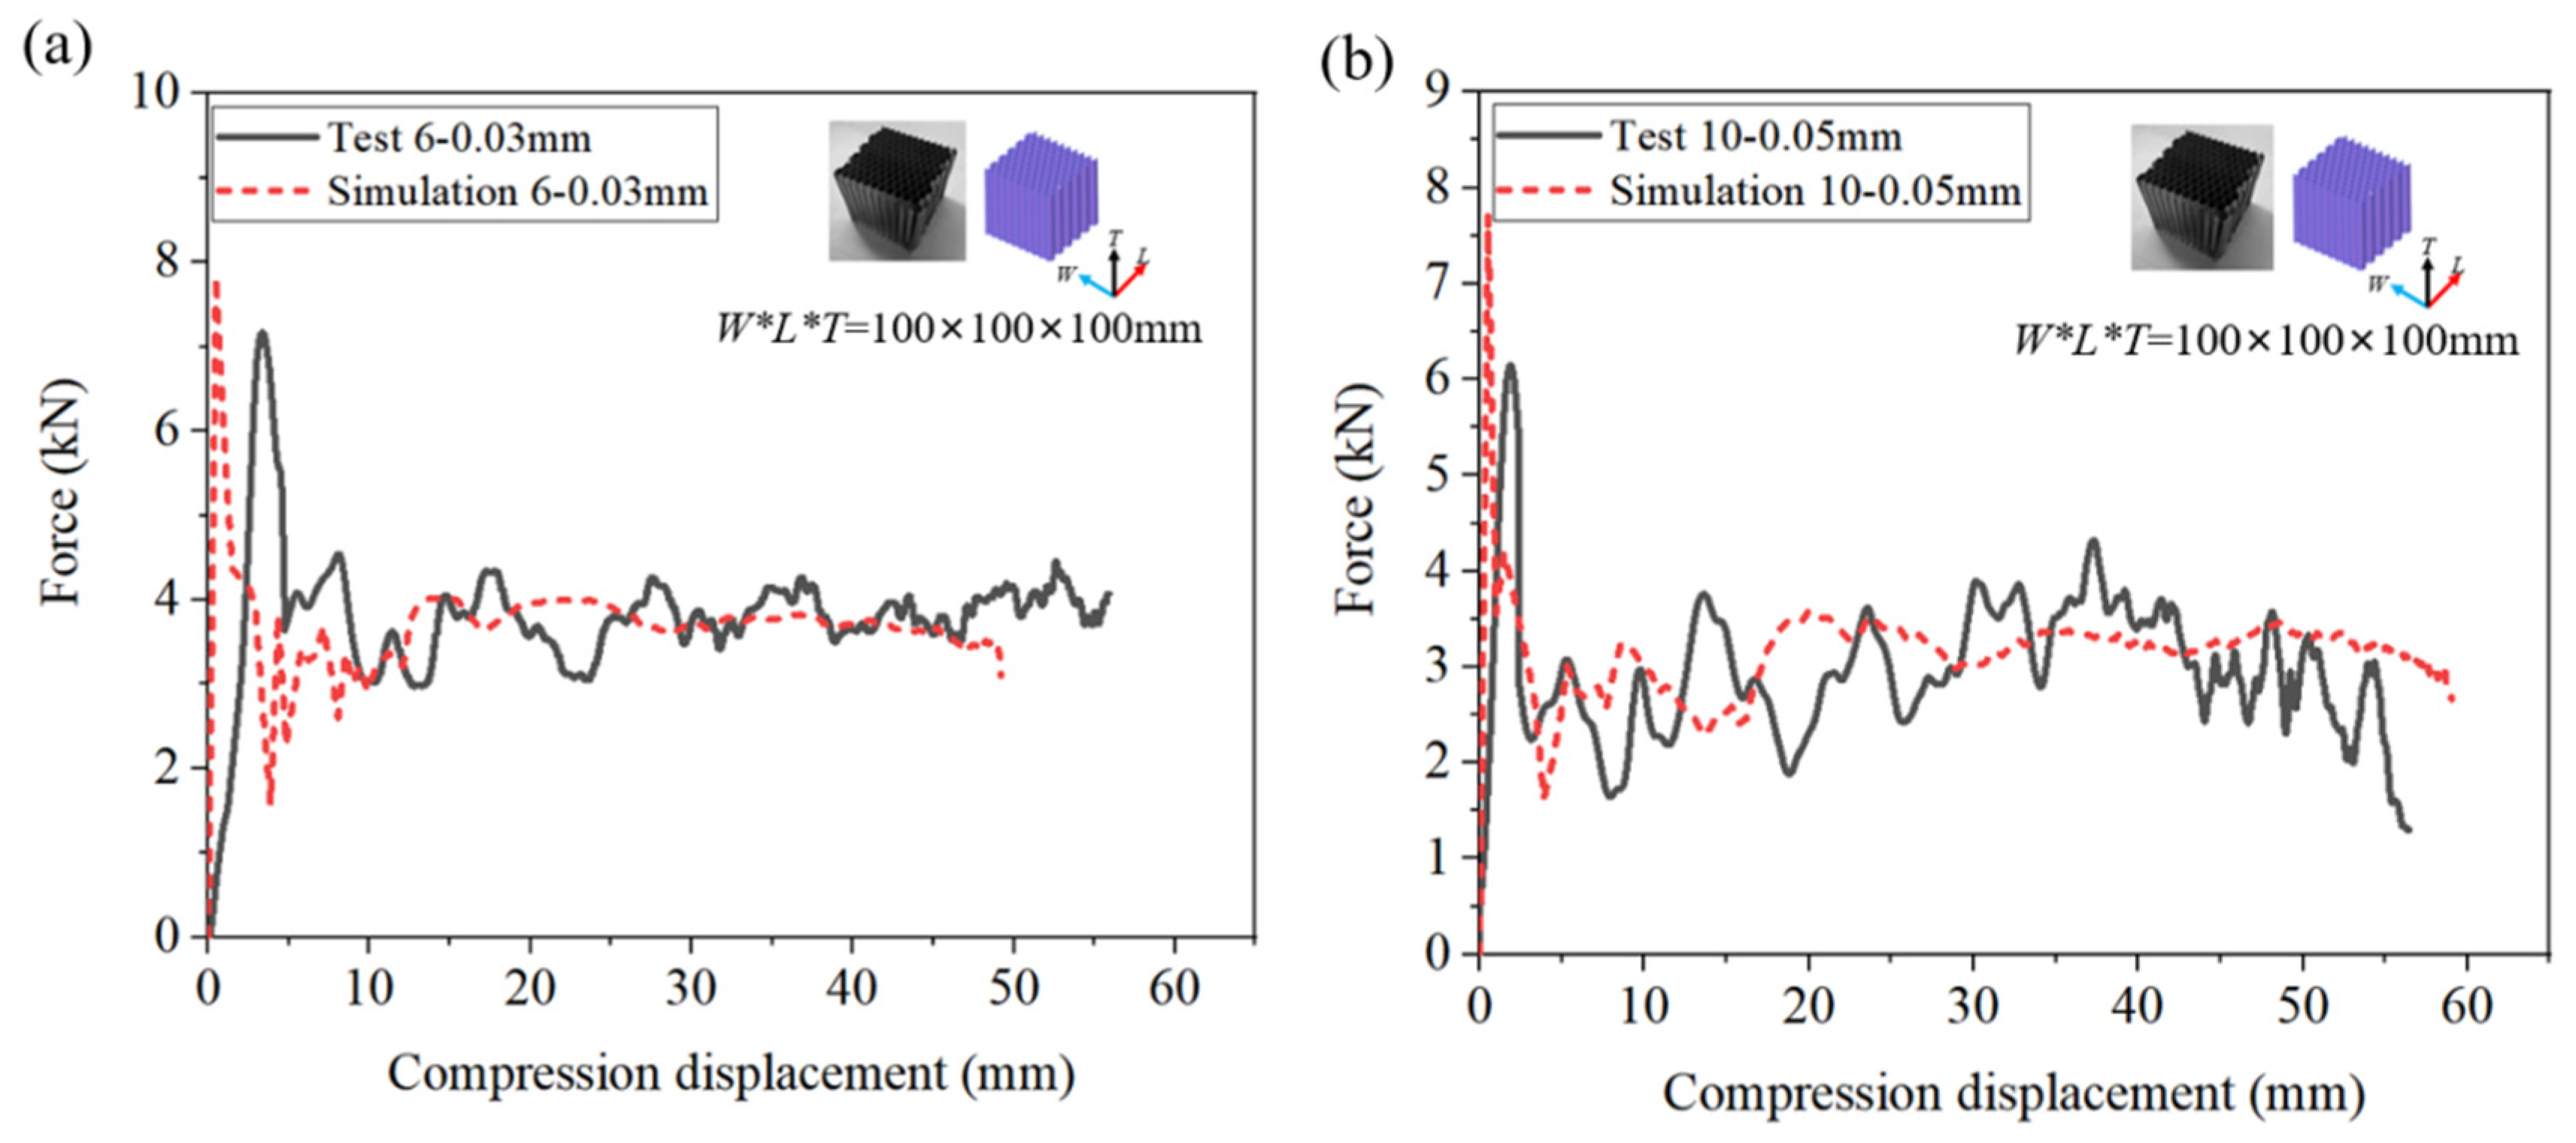
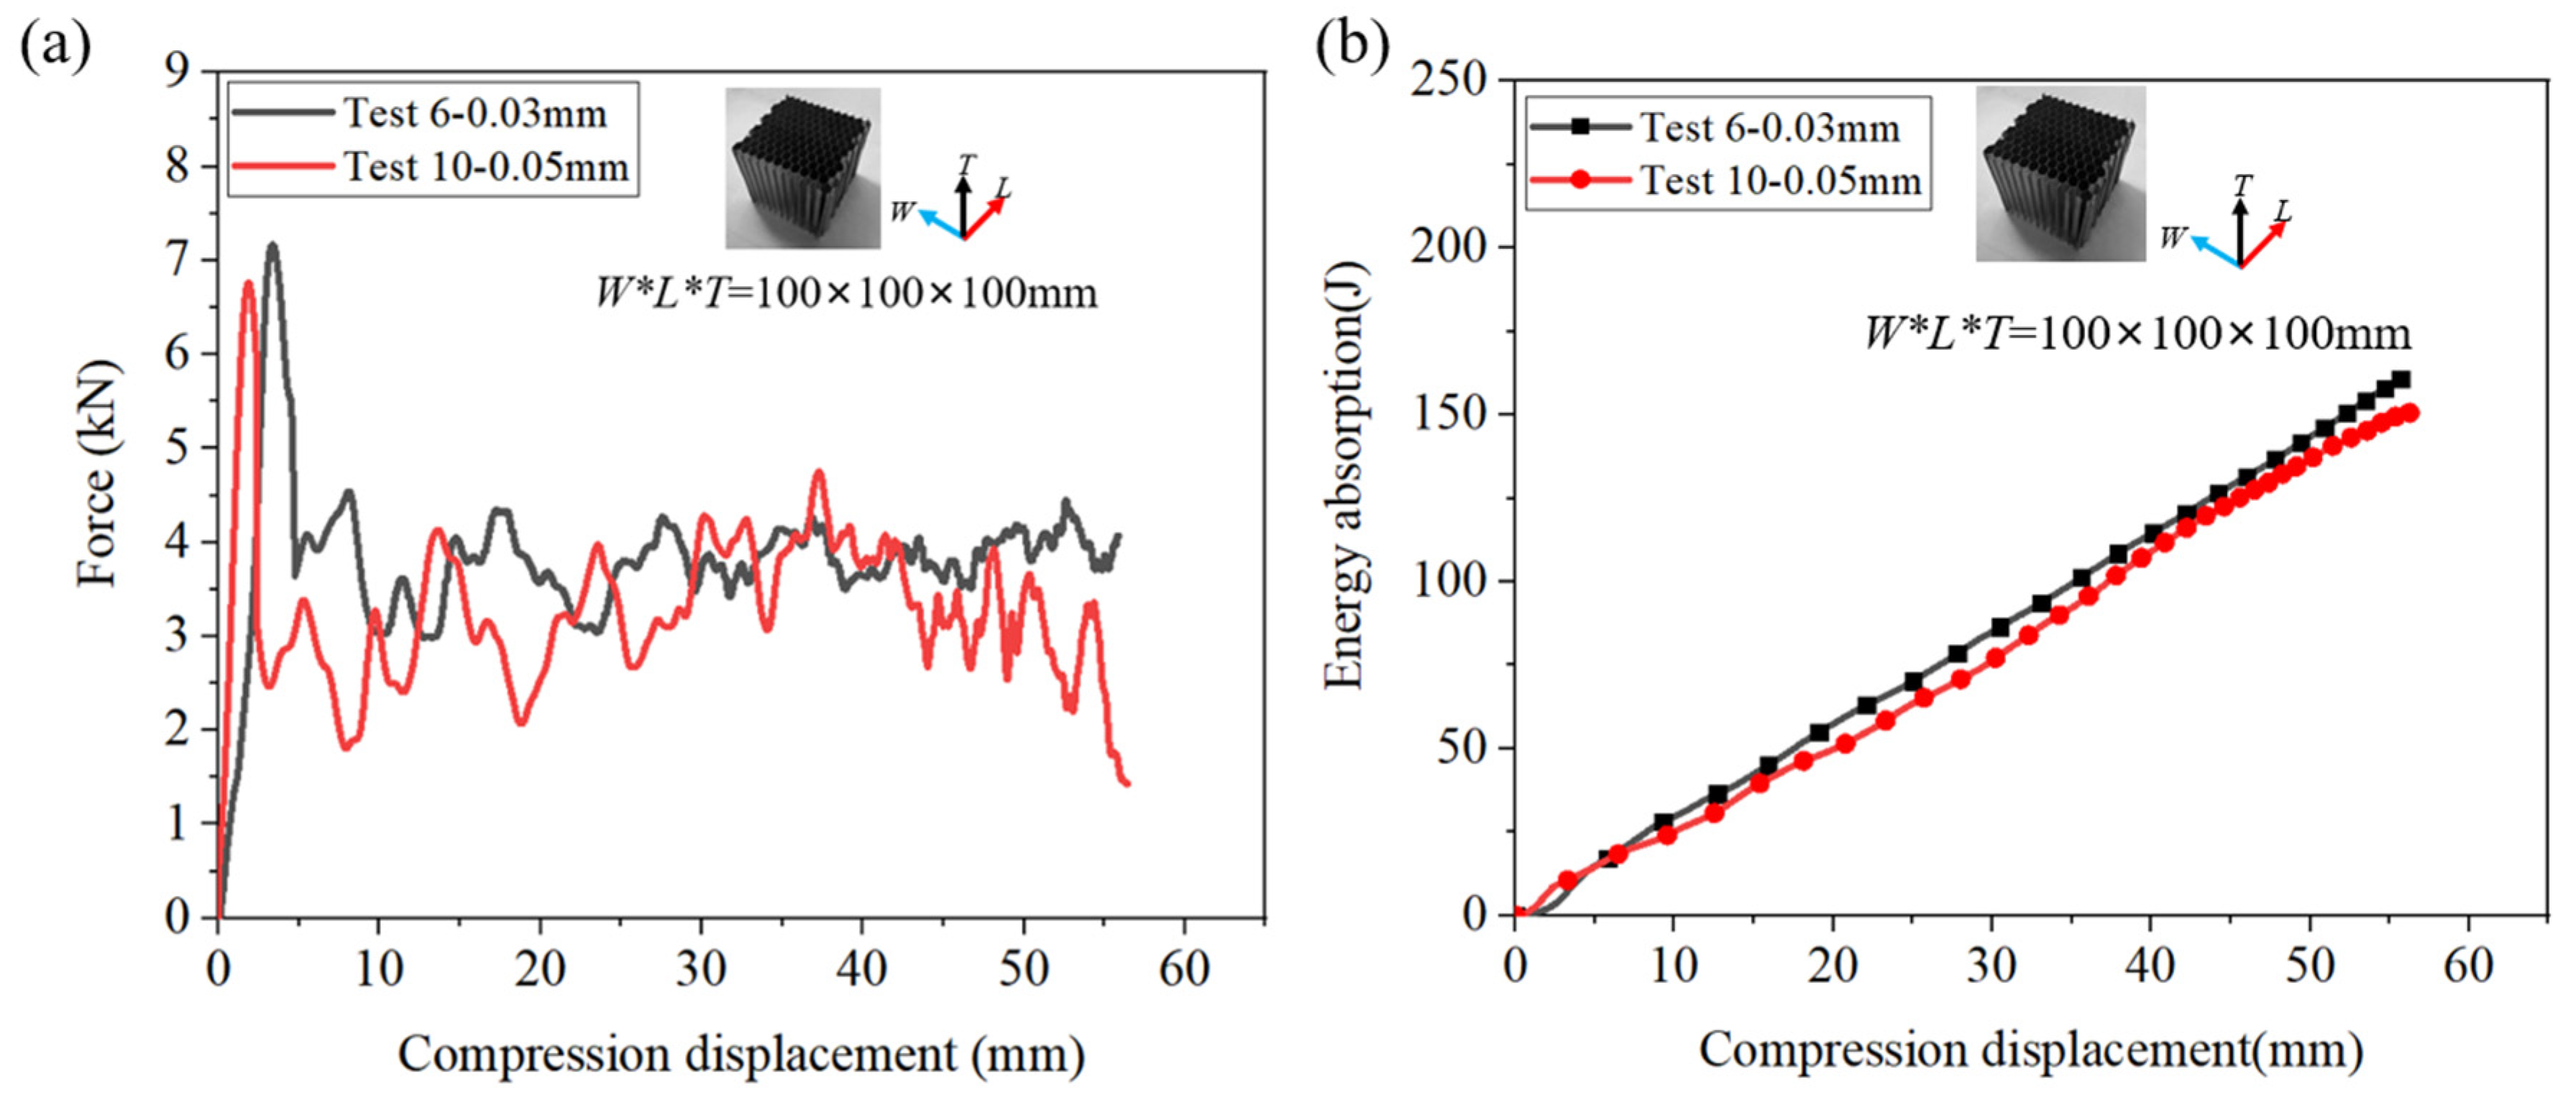
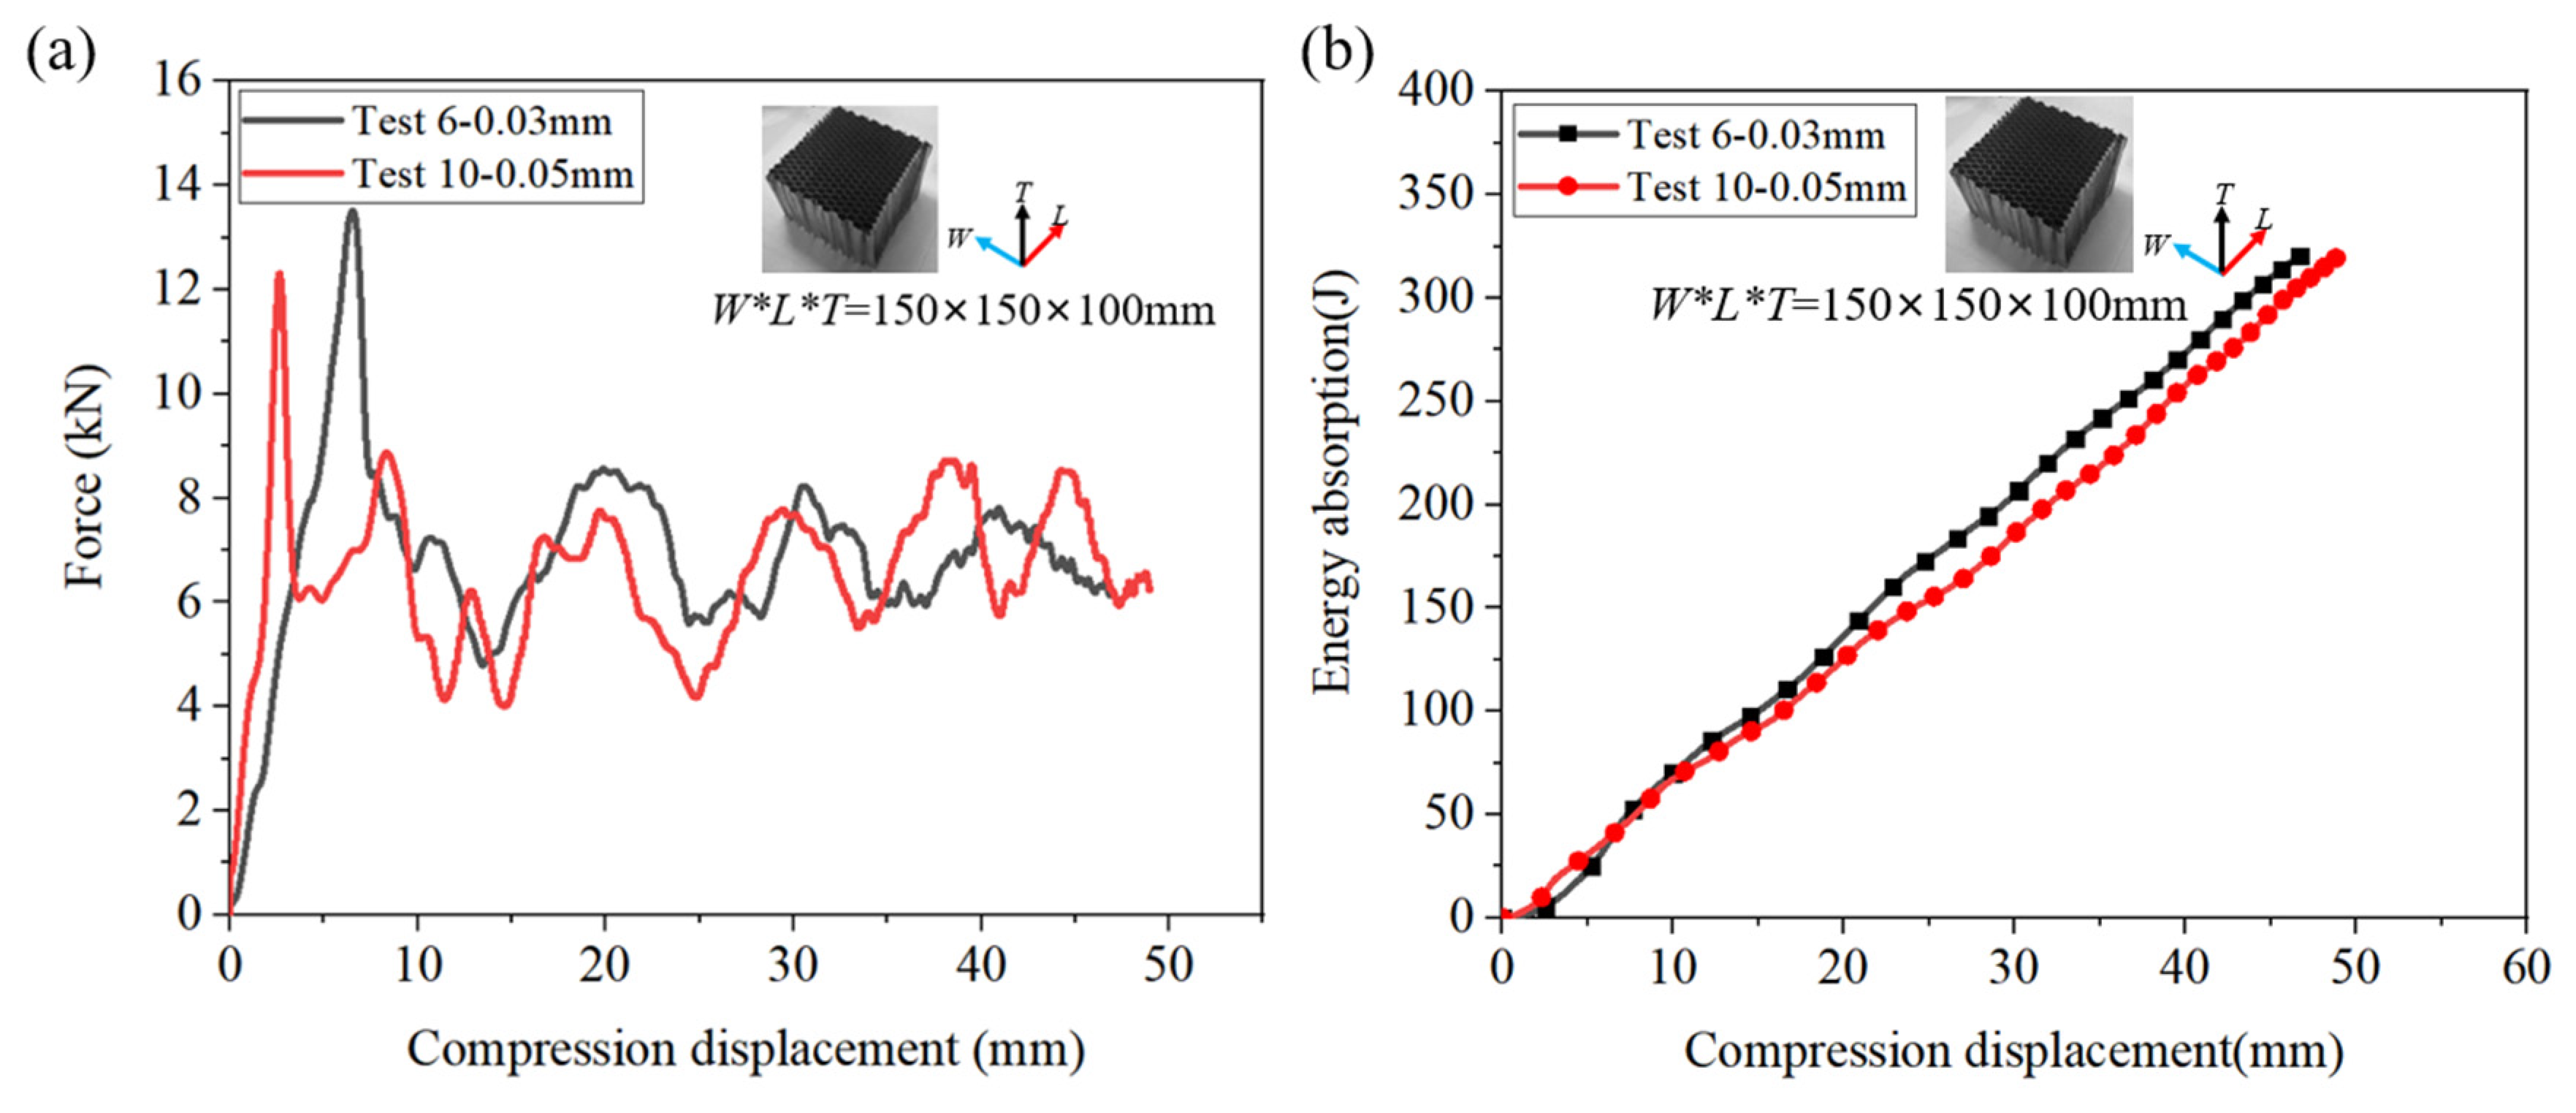
2.3. Validation of the Finite Element Models
2.4. Equivalent Model
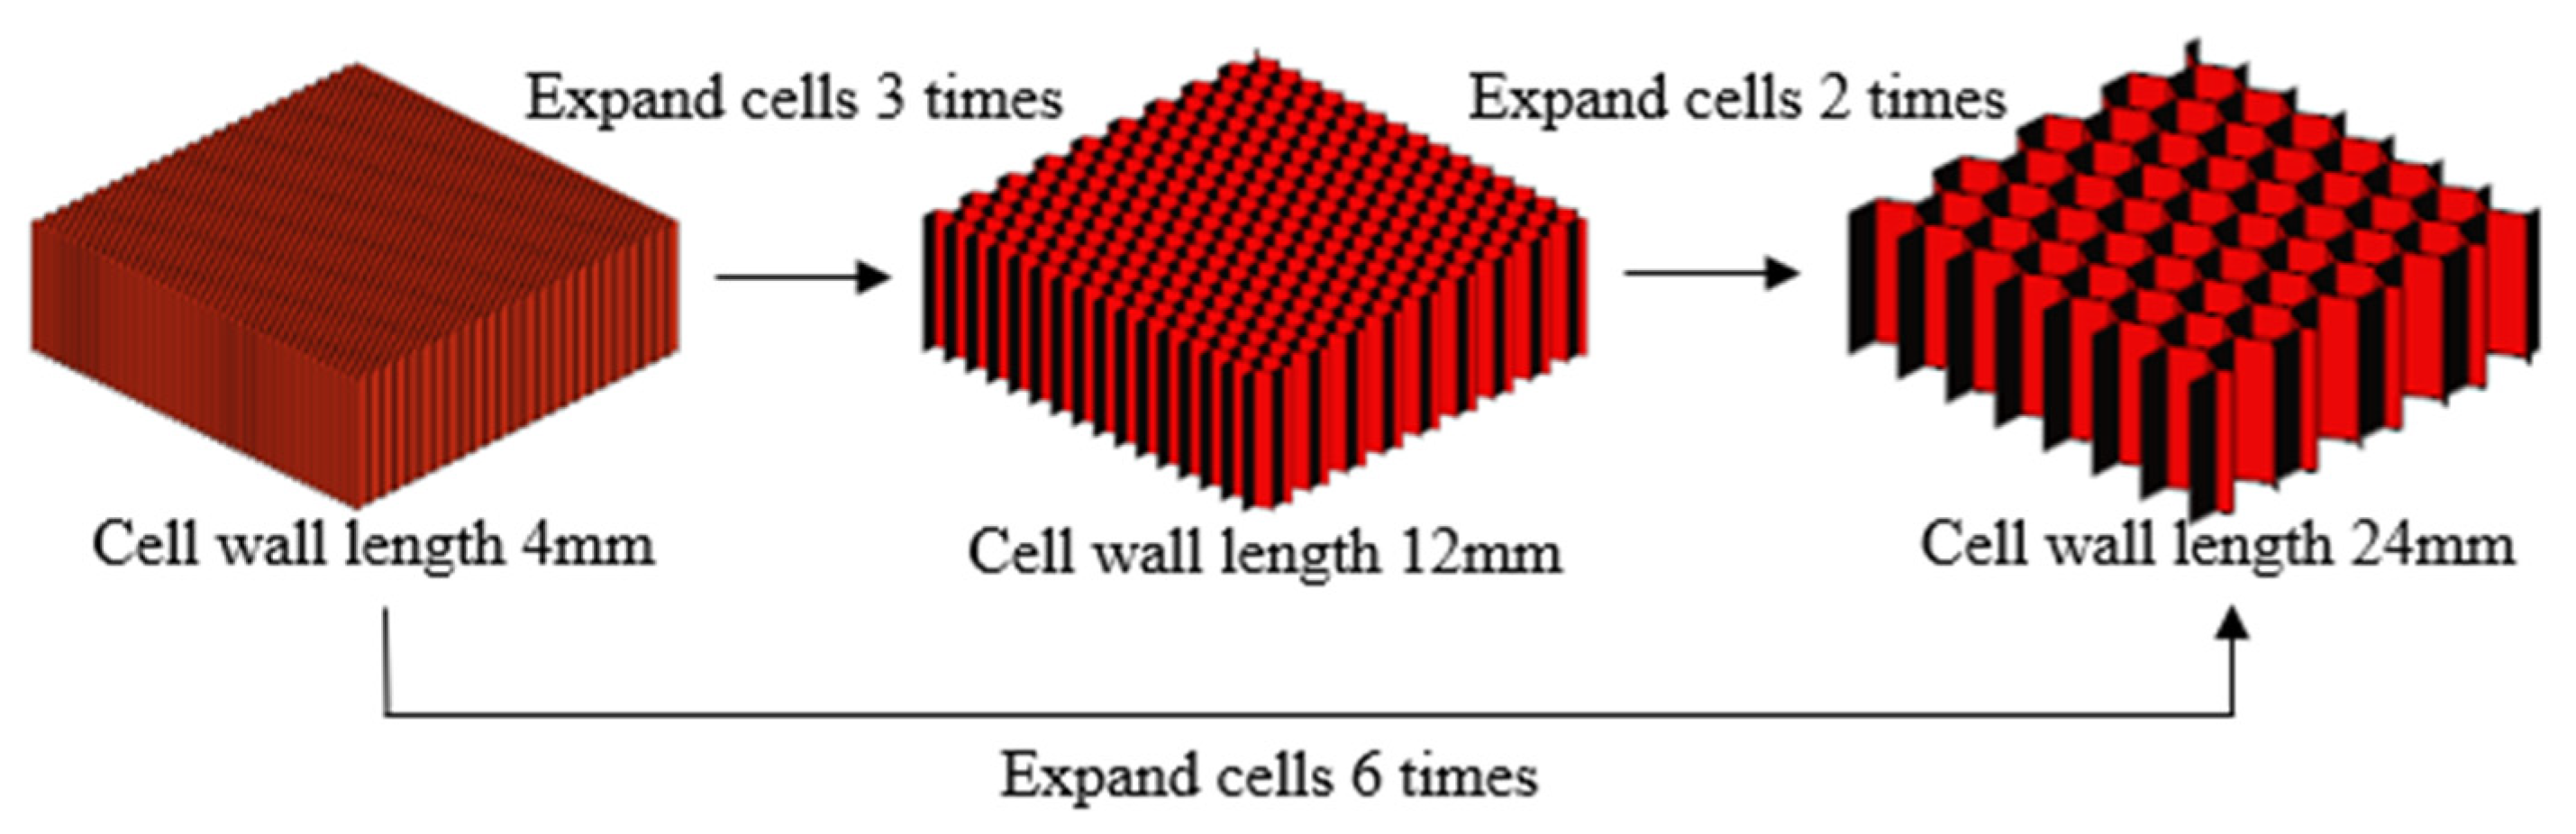
2.4.1. Expanded Cell Equivalence Method
2.4.2. Equivalent Finite Element Model
3. Simulation Results
3.1. Equivalent Model Results
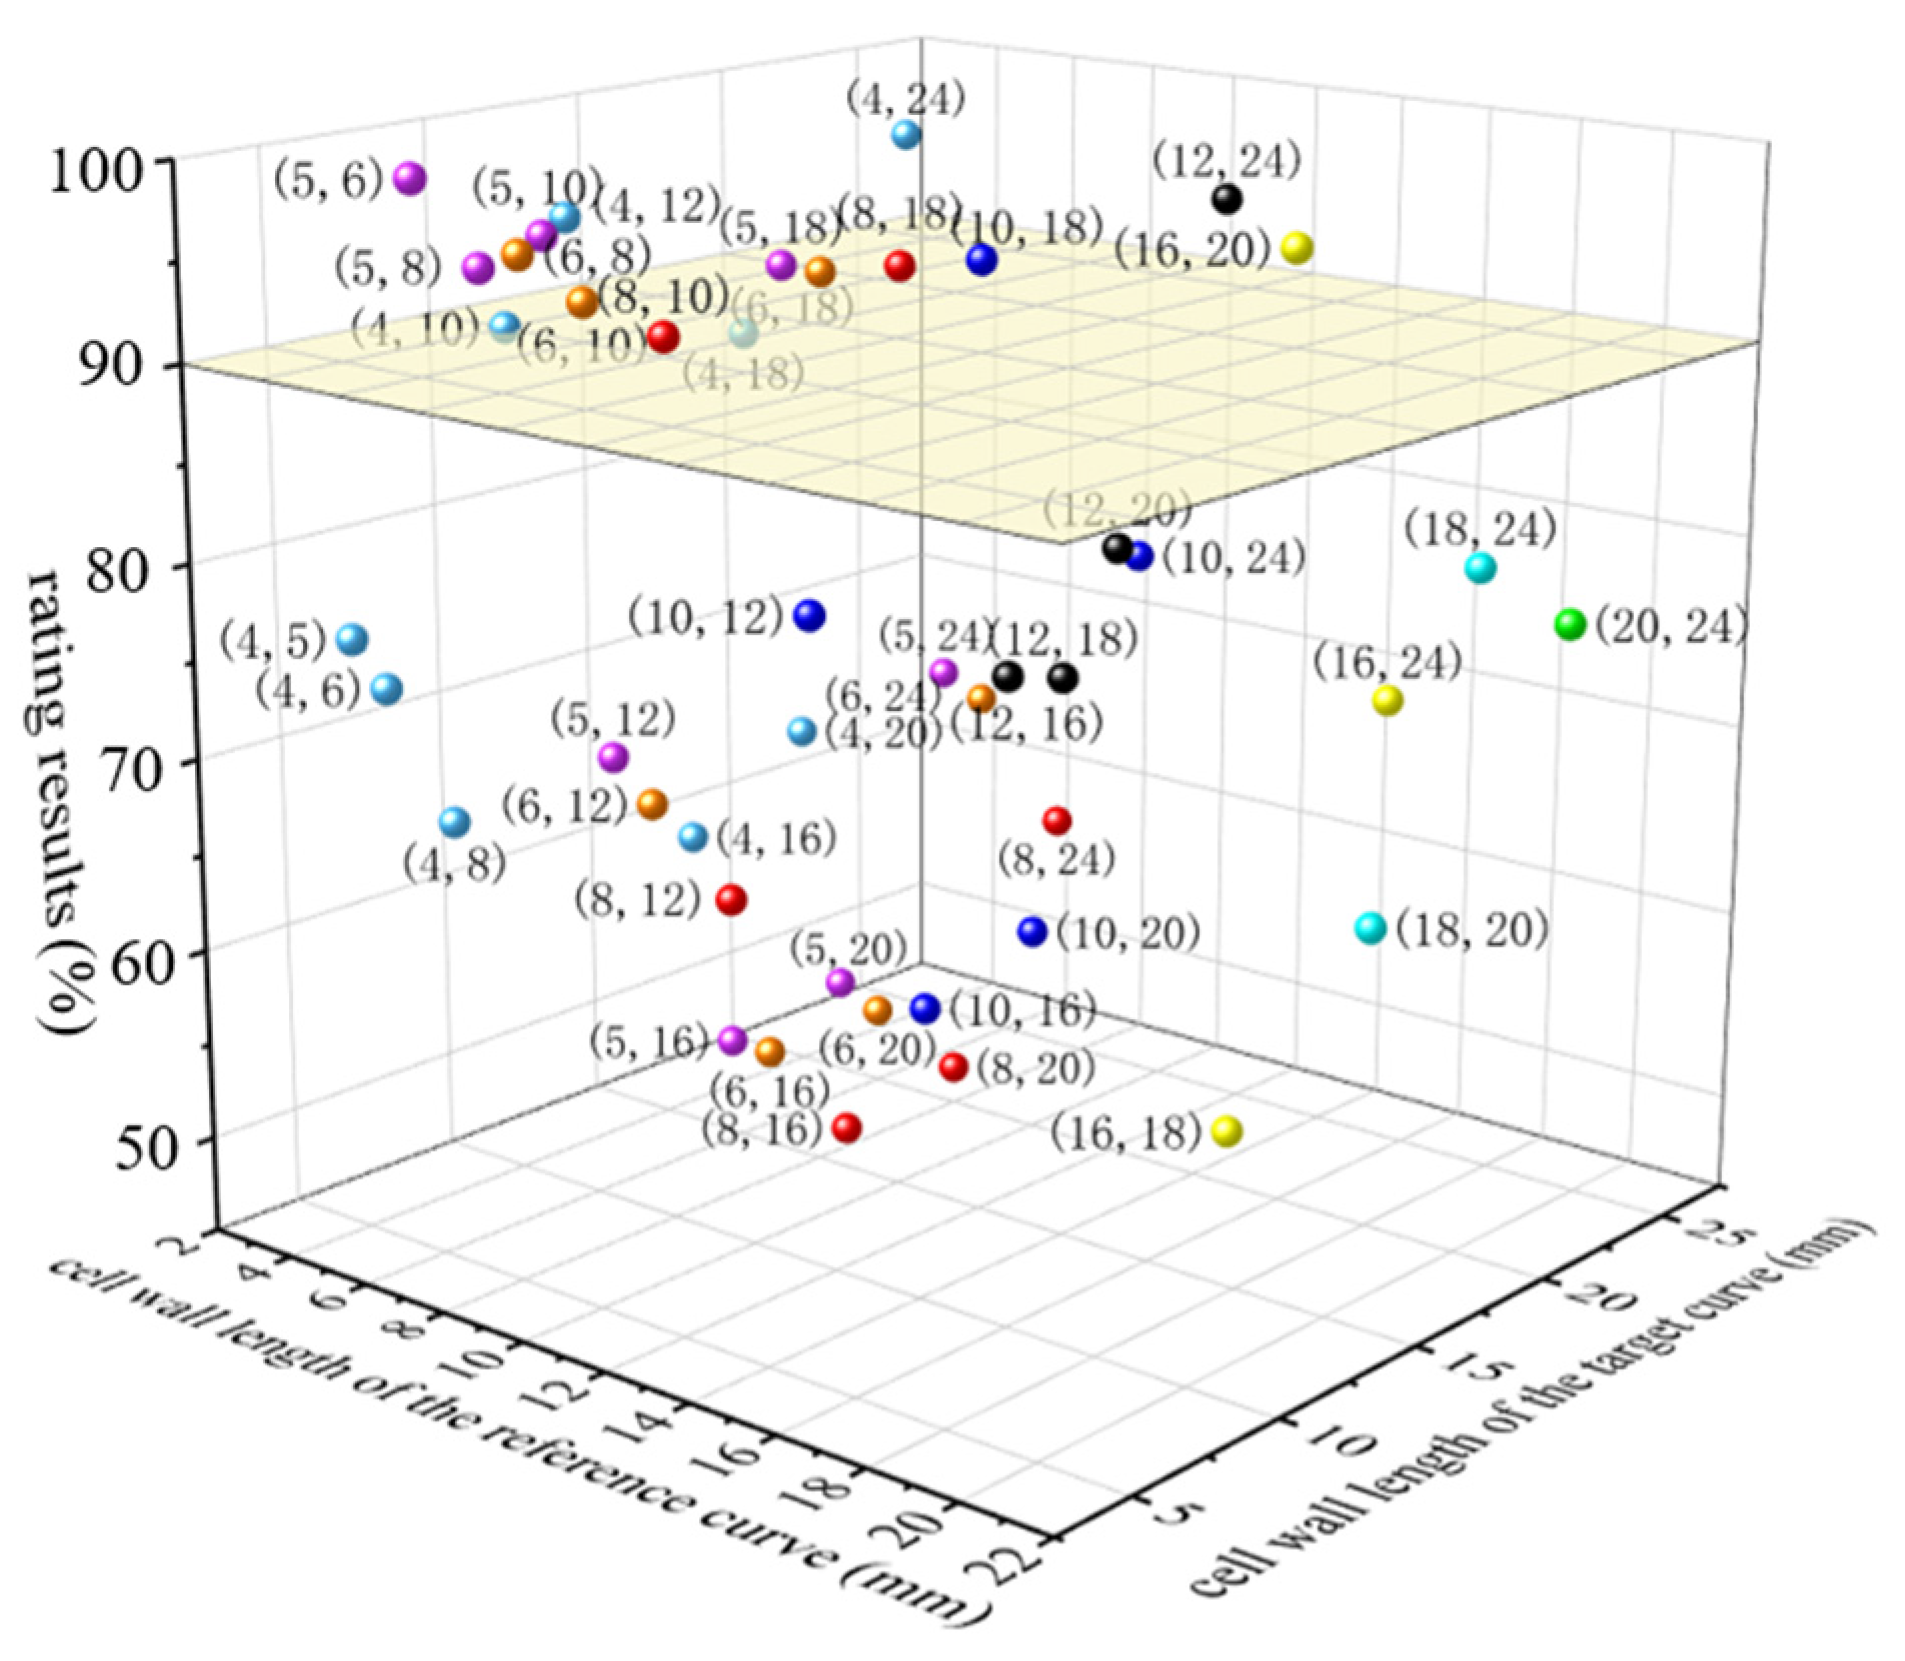
3.2. Determination of Cell Magnification Times
4. Discussion
4.1. Validation of Cell Magnification Times
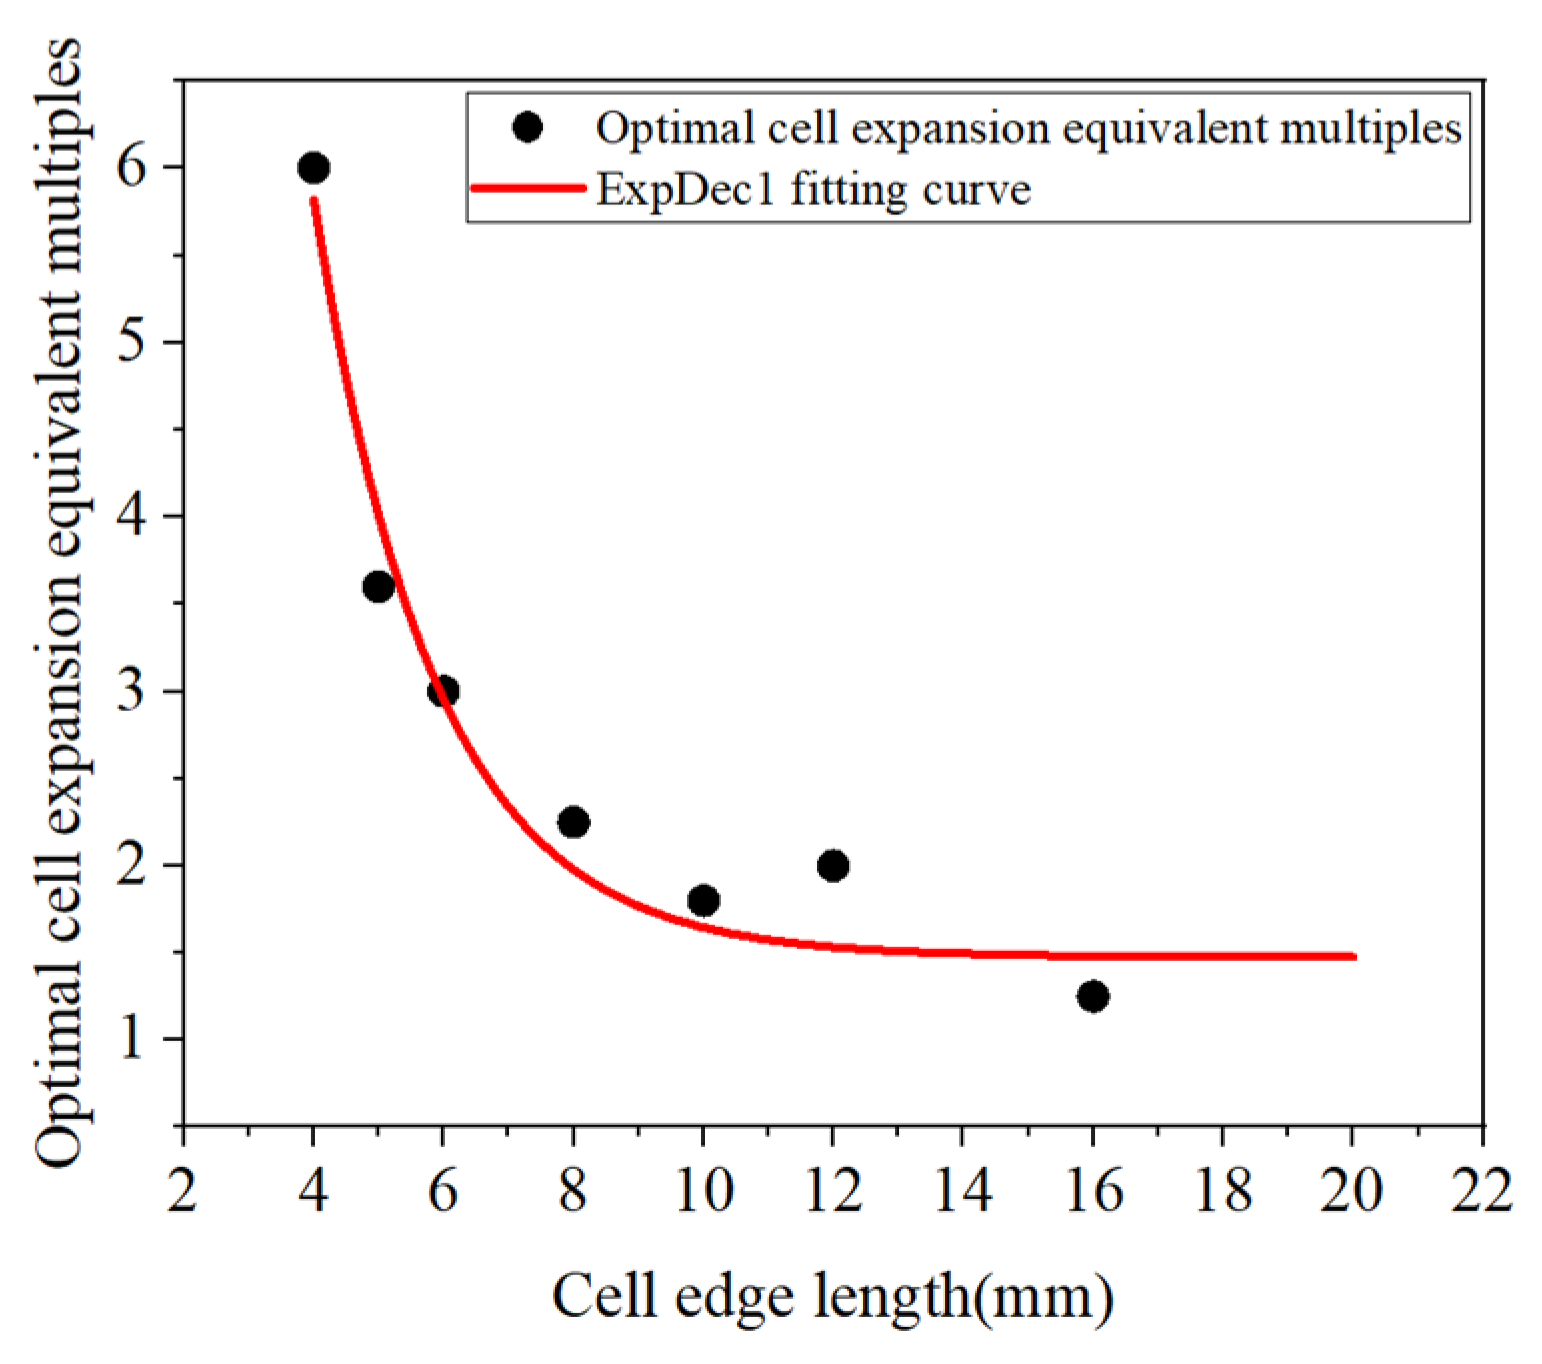
4.2. Establishment of Cell Magnification Time Prediction Function
4.2.1. Function Prediction
4.2.2. Predictive Effect Evaluation
5. Conclusions
Author Contributions
Funding
Institutional Review Board Statement
Informed Consent Statement
Data Availability Statement
Conflicts of Interest
Appendix A

| Cell wall length of the reference curve/mm | 4 | 4 | 4 | 4 | 4 | 4 | 4 | 4 | 4 |
| Cell wall length of the target curve/mm | 5 | 6 | 8 | 10 | 12 | 16 | 18 | 20 | 24 |
| Cell magnification times | 1.25 | 1.50 | 2 | 2.50 | 3 | 4 | 4.50 | 5 | 6 |
| Rating results/% | 76 | 73 | 65 | 90 | 95 | 60 | 87 | 64 | 96 |
| Cell wall length of the reference curve/mm | 5 | 5 | 5 | 5 | 5 | 5 | 5 | 5 | 6 |
| Cell wall length of the target curve/mm | 6 | 8 | 10 | 12 | 16 | 18 | 20 | 24 | 8 |
| Cell magnification times | 1.20 | 1.60 | 2 | 2.40 | 3.20 | 3.60 | 4 | 4.80 | 1.33 |
| Rating results/% | 99 | 94 | 95 | 67 | 49 | 91 | 50 | 66 | 95 |
| Cell wall length of the reference curve/mm | 6 | 6 | 6 | 6 | 6 | 6 | 8 | 8 | 8 |
| Cell wall length of the target curve/mm | 10 | 12 | 16 | 18 | 20 | 24 | 10 | 12 | 16 |
| Cell magnification times | 1.67 | 2 | 2.67 | 3 | 3.33 | 4 | 1.25 | 1.50 | 2 |
| Rating results/% | 92 | 65 | 49 | 91 | 49 | 65 | 91 | 61 | 46 |
| Cell wall length of the reference curve/mm | 8 | 8 | 8 | 10 | 10 | 10 | 10 | 10 | 12 |
| Cell wall length of the target curve/mm | 18 | 20 | 24 | 12 | 16 | 18 | 20 | 24 | 16 |
| Cell magnification times | 2.25 | 2.50 | 3 | 1.20 | 1.60 | 1.80 | 2 | 2.40 | 1.33 |
| Rating results/% | 92 | 47 | 59 | 77 | 54 | 93 | 56 | 75 | 73 |
| Cell wall length of the reference curve/mm | 12 | 12 | 12 | 16 | 16 | 16 | 18 | 18 | 20 |
| Cell wall length of the target curve/mm | 18 | 20 | 24 | 18 | 20 | 24 | 20 | 24 | 24 |
| Cell magnification times | 1.50 | 1.67 | 2 | 1.13 | 1.25 | 1.50 | 1.11 | 1.33 | 1.20 |
| Rating results/% | 72 | 78 | 95 | 50 | 95 | 70 | 61 | 78 | 76 |
References
- Slimane, S.; Kebdani, S.; Boudjemai, A.; Slimane, A. Effect of position of tension-loaded inserts on honeycomb panels used for space applications. Int. J. Interact. Des. Manuf. 2018, 12, 393–408. [Google Scholar] [CrossRef]
- Liu, Y.; Zhou, Q.; Wei, X.; Xia, Y. Testing and modeling tearing and air effect of aluminum honeycomb under out-of-plane impact loading. Int. J. Impact Eng. 2020, 135, 103402. [Google Scholar] [CrossRef]
- Gong, X.; Ren, C.; Liu, Y.; Sun, J.; Xie, F. Impact Response of the Honeycomb Sandwich Structure with Different Poisson’s Ratios. Materials 2022, 15, 6982. [Google Scholar] [CrossRef] [PubMed]
- Levent, A.; Alastair, F.J.; Bernd, H.K. Numerical modelling of honeycomb core crush behavior. Eng. Fract. Mech. 2008, 75, 2616–2630. [Google Scholar]
- Bai, Z.; Guo, H.; Jiang, B.; Zhu, F.; Cao, L. A study on the mean crushing strength of hexagonal multi-cell thin-walled structures. Thin-Walled Struct. 2014, 80, 38–45. [Google Scholar] [CrossRef]
- Wang, Z.; Li, Z.; Shi, C.; Zhou, W. Theoretical and numerical analysis of the folding mechanism of vertex-based hierarchical honeycomb structure. Mech. Adv. Mater. 2019, 27, 789–799. [Google Scholar] [CrossRef]
- Hassanpour Roudbeneh, F.; Liaghat, G.; Sabouri, H.; Hadavinia, H. Experimental investigation of quasistatic penetration tests on honeycomb sandwich panels filled with polymer foam. Mech. Adv. Mater. 2018, 27, 1803–1815. [Google Scholar] [CrossRef]
- Yamashita, M.; Gotoh, M. Impact behavior of honeycomb structures with various cell specifications—Numerical simulation and experiment. Int. J. Impact Eng. 2005, 32, 618–630. [Google Scholar] [CrossRef]
- Allen, H.G. Analysis Design of Structural Sandwich Panels; Pergamon Press: Oxford, UK, 1969. [Google Scholar]
- Mukhopadhyay, T.; Adhikari, S. Equivalent in-plane elastic properties of irregular honeycombs: An analytical approach. Int. J. Solids Struct. 2016, 91, 169–184. [Google Scholar] [CrossRef] [Green Version]
- Chen, D.; Yang, L. Analysis of equivalent elastic modulus of asymmetrical honeycomb. Compos. Struct. 2011, 93, 767–773. [Google Scholar] [CrossRef]
- Reis, F.; Ganghoffer, J.F. Equivalent mechanical properties of auxetic lattices from discrete homogenization. Comput. Mater. Sci. 2012, 51, 314–321. [Google Scholar] [CrossRef]
- Gibson, L.J.; Ashby, M.F. The mechanics of two-dimensional cellular materials. Proc. R. Soc. Lond. 1982, 382, 43–59. [Google Scholar]
- Pan, S.D.; Wu, L.Z.; Sun, Y.G.; Zhou, Z.G.; Qu, J.L. Longitudinal shear strength and failure process of honeycomb cores. Compos. Struct. 2006, 72, 42–46. [Google Scholar] [CrossRef]
- Wu, D.; Zhai, W.; Li, H. Equivalent theories and tension properties of semi-reentrant structures. Meccanica 2021, 56, 2053–2082. [Google Scholar] [CrossRef]
- Yasuki, T.; Kojima, S. Application of aluminum honeycomb model using shell elements to offset deformable barrier model. Int. J. Crashworthiness 2009, 14, 449–456. [Google Scholar] [CrossRef]
- Kojima, S.; Yasuki, T.; Kaneko, M.; Kawahara, K.; Takahashi, N. Improvement of Offset Deformable Barrier Model Using Shell Elements Aluminum Honeycomb Model. Rev. Automot. Eng. 2008, 29, 647–649. [Google Scholar]
- Asadi, M.; Huntingdon, U.K.; Walker, B.; Shirvani, H. An investigation to compare the application of shell and solid element honeycomb model in ODB. In Proceedings of the 7th European LS-DYNA Conference, Salzburg, Austria, 14–15 May 2009. [Google Scholar]
- Asadi, M.; Walker, B. Application of shell elements to create advanced finite element model for offset deformable barrier. Int. J. Veh. Struct. Syst. 2011, 3, 139. [Google Scholar] [CrossRef]
- Li, Q.; Shi, A.; Zhang, J. Establishment and Verification of AE-MDB Shell Element Model of Lateral Moving Barrier. In Proceedings of the 13th International Forum of Automotive Traffic Safety, Hangzhou, China, 24–26 November 2016. [Google Scholar]
- Tryland, T. Alternative Models of the Offset and Side Impact Deformable Barriers. In Proceedings of the 9th International LS-DYNA Users Conference, Dearborn, MI, USA, 4–6 June 2006. [Google Scholar]
- Wang, Z.; Yao, S. An equivalent method to cell magnification of aluminum honeycomb under out-of-plane compression. Explos. Shock. Waves 2013, 33, 269–274. [Google Scholar]
- Wang, J.; Cao, Y.; Sun, Y.; Ma, J. Finite element analysis of honeycomb aluminum out-of-plane compression deformation. Mod. Manuf. Eng. 2019, 10, 85–89. [Google Scholar]
- Tao, Y.; Duan, S.; Wen, W.; Pei, Y.; Fang, D. Enhanced out-of-plane crushing strength and energy absorption of in-plane graded honeycombs. Compos. Part B Eng. 2017, 118, 33–40. [Google Scholar] [CrossRef]
- Che, Q.; Yao, S.; Xiao, X. Study on honeycomb axial compression test and simulation analysis method. J. Railw. Sci. Eng. 2017, 14, 1049–1055. [Google Scholar]
- Cheng, P.; Peng, Y.; Wang, K.; Le Duigou, A.; Yao, S.; Chen, C. Quasi-static penetration property of 3D printed woven-like ramie fiber reinforced biocomposites. Compos. Struct. 2023, 303, 116313. [Google Scholar] [CrossRef]
- Slimane, S.A.; Slimane, A.; Guelailia, A.; Boudjemai, A.; Kebdani, S.; Smahat, A.; Mouloud, D. Hypervelocity impact on honeycomb structure reinforced with bi-layer ceramic/aluminum facesheets used for spacecraft shielding. Mech. Adv. Mater. Struc. 2021, 29, 4487–4505. [Google Scholar] [CrossRef]
- Wang, Z.; Tian, H.; Lu, Z.; Zhou, W. High-speed axial impact of aluminum honeycomb–Experiments and simulations. Compos. Part B Eng. 2014, 56, 1–8. [Google Scholar] [CrossRef]
- Wang, Z.; Liu, J. Numerical and theoretical analysis of honeycomb structure filled with circular aluminum tubes subjected to axial compression. Compos. Part B Eng. 2019, 165, 626–635. [Google Scholar] [CrossRef]
- Gibson, L.J.; Ashby, M.F. Cellular Solids: Structure and Properties; Cambridge University Press: Cambridge, UK, 1997. [Google Scholar]
- Wang, J.; Li, Z.; Liang, F.; Liu, W.; Liao, J.; Chen, F.; Li, M.; Shao, T. Design, simulation and theoretical study on novel cored octagon honeycomb for helicopter crashworthiness. Acta Aeronaut. Astronaut. Sin. 2022, 43, 299–312. [Google Scholar]
- Sun, D.; Zhang, W.; Wei, Y. Mean out-of-plane dynamic plateau stresses of hexagonal honeycomb cores under impact loadings. Compos. Struct. 2010, 92, 2609–2621. [Google Scholar]
- Wang, Z. Mechanics of Lightweight Honeycomb Structure; Science Press: Beijing, China, 2019. [Google Scholar]
- Yu, C.; Wang, F.; Wang, B.; Li, G.; Li, F. A computational biomechanics human body model coupling finite element and multibody segments for assessment of head/brain injuries in car-to-pedestrian collisions. Int. J. Environ. Res. Public Health 2020, 17, 492. [Google Scholar] [CrossRef]
- Deng, G.; Peng, Y.; Hou, L.; Li, Z.; Li, B.; Yu, C.; Simms, C. A Novel Simplified FE Rail Vehicle Model in Longitudinal and Lateral Collisions. Machines 2022, 10, 1214. [Google Scholar] [CrossRef]
- Li, Q.; Xia, X.; Pei, Z.; Cheng, X.; Zhang, D.; Xiao, K.; Wu, J.; Li, X. Long-term corrosion monitoring of carbon steels and environmental correlation analysis via the random forest method. NPJ Mater. Degrad. 2022, 6, 1. [Google Scholar] [CrossRef]

| Compression Displacement | 5 mm | 15 mm | 30 mm | 50 mm |
|---|---|---|---|---|
| Test |  |  |  |  |
| Simulation |  | 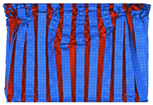 | 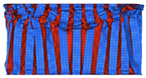 | 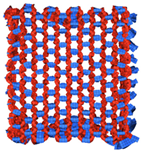 |
| l-t/mm | Fpeak/kN | Fmean/kN | EA/kJ | Calculation Time/s |
|---|---|---|---|---|
| 4–0.02 | 83.42 | 32.52 | 2.79 | 56,572 |
| 5–0.025 | 83.14 | 37.38 | 3.22 | 46,174 |
| 6–0.03 | 81.93 | 39.53 | 3.25 | 17,820 |
| 8–0.04 | 78.13 | 39.96 | 3.29 | 8201 |
| 10–0.05 | 76.36 | 37.33 | 3.05 | 7694 |
| 12–0.06 | 76.31 | 30.59 | 2.74 | 7272 |
| 16–0.08 | 76.72 | 24.24 | 2.26 | 6314 |
| 18–0.09 | 77.68 | 35.51 | 3.14 | 2622 |
| 20–0.1 | 77.63 | 24.60 | 2.28 | 2451 |
| 24–0.12 | 77.24 | 31.52 | 2.67 | 2144 |
| l-t/mm | Cell Magnification Times |
|---|---|
| 4–0.02 | 2.50, 3, 6 |
| 5–0.025 | 1.20, 1.60, 2, 3.60 |
| 6–0.03 | 1.33, 1.67, 3 |
| 8–0.04 | 1.25, 2.25 |
| 10–0.05 | 1.80 |
| 12–0.06 | 2 |
| 16–0.08 | 1.25 |
| Tested Specimens | Cell Wall Length of the Reference Curve/mm | Cell Wall Length of the Target Curve/mm | Rating Results |
|---|---|---|---|
| W*L*T = 100 × 100 × 100 mm | 6 | 10 | 90% |
| W*L*T = 150 × 150 × 100 mm | 6 | 10 | 93% |
| Source | Degrees of Freedom | Sum of Squares | Mean Square |
|---|---|---|---|
| regression | 3 | 72.03 | 24.01 |
| residual | 5 | 0.80 | 0.16 |
| total deviation | 7 | 18.22 |
Disclaimer/Publisher’s Note: The statements, opinions and data contained in all publications are solely those of the individual author(s) and contributor(s) and not of MDPI and/or the editor(s). MDPI and/or the editor(s) disclaim responsibility for any injury to people or property resulting from any ideas, methods, instructions or products referred to in the content. |
© 2023 by the authors. Licensee MDPI, Basel, Switzerland. This article is an open access article distributed under the terms and conditions of the Creative Commons Attribution (CC BY) license (https://creativecommons.org/licenses/by/4.0/).
Share and Cite
Qiao, Y.; Peng, Y.; Cheng, P.; Zhou, X.; Wang, F.; Li, F.; Wang, K.; Yu, C.; Wang, H. Study on the Cell Magnification Equivalent Method in Out-of-Plane Compression Simulations of Aluminum Honeycomb. Sustainability 2023, 15, 1882. https://doi.org/10.3390/su15031882
Qiao Y, Peng Y, Cheng P, Zhou X, Wang F, Li F, Wang K, Yu C, Wang H. Study on the Cell Magnification Equivalent Method in Out-of-Plane Compression Simulations of Aluminum Honeycomb. Sustainability. 2023; 15(3):1882. https://doi.org/10.3390/su15031882
Chicago/Turabian StyleQiao, Yuning, Yong Peng, Ping Cheng, Xuefei Zhou, Fang Wang, Fan Li, Kui Wang, Chao Yu, and Honggang Wang. 2023. "Study on the Cell Magnification Equivalent Method in Out-of-Plane Compression Simulations of Aluminum Honeycomb" Sustainability 15, no. 3: 1882. https://doi.org/10.3390/su15031882