Article

Optimizing the Sample Selection of Machine Learning Models for Landslide Susceptibility Prediction Using Information Value Models in the Dabie Mountain Area of Anhui, China

1
School of Resources and Environment, Anhui Agricultural University, Hefei 230036, China
2
School of Economics and Management, Beihang University, Beijing 100191, China
3
Key Laboratory of Virtual Geographic Environment, Nanjing Normal University, Ministry of Education, Nanjing 210023, China
4
Jiangsu Center for Collaborative Innovation in Geographical Information Resource Development and Application, Nanjing 210023, China
5
State Key Laboratory Cultivation Base of Geographical Environment Evolution (Jiangsu Province), Nanjing 210023, China
6
Anhui Province Key Lab of Farmland Ecological Conservation and Pollution Prevention, Hefei 230036, China
7
Engineering and Technology Research Center of Intelligent Manufacture and Efficient Utilization of Green Phosphorus Fertilizer of Anhui Province, College of Resources and Environment, Anhui Agricultural University, Hefei 230036, China
8
Key Laboratory of JiangHuai Arable Land Resources Protection and Eco-Restoration, Ministry of Natural Resources, College of Resources and Environment, Anhui Agricultural University, Hefei 230036, China
*
Author to whom correspondence should be addressed.
Sustainability 2023, 15(3), 1971; https://doi.org/10.3390/su15031971
Submission received: 3 January 2023 / Revised: 16 January 2023 / Accepted: 17 January 2023 / Published: 19 January 2023
(This article belongs to the Section Hazards and Sustainability)

Abstract

:
The evaluation of landslide susceptibility is of great significance in the prevention and management of geological hazards. The accuracy of the landslide susceptibility prediction model based on machine learning is significantly higher than that of traditional expert knowledge and the conventional mathematical statistics model. The correct and reasonable selection of non-landslide samples in the machine learning model greatly improves the prediction accuracy and reliability of the regional landslide susceptibility model. Focusing on the problem of selecting non-landslide samples in the machine learning model for landslide susceptibility evaluation, this paper proposes a landslide susceptibility evaluation method based on the combination of an information model and machine learning in traditional mathematical statistics. First, the influence factors for landslide susceptibility evaluation are screened by the correlation analysis method. Second, the information value model is used to delimit areas with low and relatively low landslide susceptibility, and non-landslide points are randomly selected. Third, a landslide susceptibility evaluation method combined with IV-ML, such as logistic regression (IV-LR), random forest (IV-RF), support vector machine (IV-SVM), and artificial neural network (IV-ANN), is established. Finally, the landslide susceptibility factors in the Dabie Mountain area of Anhui Province are analyzed, and the accuracy of the landslide susceptibility evaluation results using the IV-LR, IV-RF, IV-SVM, and IV-ANN and LR, RF, SVM, and ANN methods are compared. The accuracy is evaluated by examining the ACC, AUC, and kappa values of the model. The results indicate that the evaluation effect of the IV-ML models (IV-LR, IV-RF, IV-SVM, IV-ANN) on landslide susceptibility is significantly higher than that of the ML models (LR, RF, SVM, ANN).

1. Introduction

Landslide is the phenomenon whereby a portion of mountain rock, soil mass, and deposits slides down along a fractured surface [1,2,3]. Landslide disaster has the characteristics of wide distribution, high frequency, and serious losses [4,5]. Every year, it causes casualties and property losses in the mountainous area of China. There were 136,092 geological disasters in China between 2010 and 2021. Among them, 95,229 were landslide disasters, accounting for 69.97% of all geological disasters, seriously threatening human life and property. Therefore, it is of great significance to conduct research on landslide control. Landslide susceptibility can be used to predict “where landslides occur” and “the probability of their occurrence” [6,7]. Landslide susceptibility prediction plays an important role in evaluating landslide risk and accurately locating potential landslides, which are the bases for disaster prevention and mitigation [8,9].
The evaluation models of landslide susceptibility mainly include the heuristic model based on expert experience [3,8], the mathematical statistics model based on variable analysis [10,11,12,13], and the machine learning model based on learning training samples [14,15,16]. (1) The expert knowledge empirical model qualitatively analyzes landslide susceptibility based on prior knowledge and includes the geological and geomorphic analysis method [17,18], factor index analysis method [19], fuzzy comprehensive evaluation method [20,21], and analytic hierarchy process [8,22,23]. All these methods are subjective and must be scored with the help of expert knowledge, and different experts often give different evaluation results. (2) The mathematical statistics model assumes that there is no correlation among the influence factors, so a bivariate or multivariate algorithm is used to evaluate the landslide susceptibility. It mainly includes the information quantity method [24,25], evidence weight method [26,27,28], logistic regression method [24,29,30], deterministic factor method [31,32], entropy index method [33], and multiple linear regression method [34]. This method avoids the subjectivity of evaluation index weight. However, the complexity of landslide causes is ignored and the correlation among many factors is not well described. (3) The machine learning model estimates the relationship between landslide distribution and influence factors by learning training samples to obtain the landslide susceptibility evaluation results with high accuracy. Specific models include the neural network [35,36,37,38,39], decision tree [40,41,42,43], support vector machine [7,44,45,46], random forest [47,48,49,50], cluster analysis [51,52,53,54], and so on. However, the disadvantage is the error removal from training samples; that is, the effective selection of non-landslide samples is not realized.
The accuracy of the landslide susceptibility prediction model based on machine learning is significantly higher than that of traditional expert knowledge and the conventional mathematical statistics model [55,56,57]. The ability of the machine learning model to predict landslide susceptibility can be understood as a training and classification process with positive and non-landslide samples using “historical landslide” samples and “non-landslide” samples as the basis of landslide influence factors. The existence of non-landslide samples helps to overcome the overfitting phenomenon of the model and is a necessary data condition for landslide susceptibility prediction. It is important to select non-landslide samples correctly and reasonably to improve the prediction accuracy and reliability of the regional landslide susceptibility model [58,59,60]. When using the machine learning model to evaluate landslide susceptibility, non-landslide points are mostly selected through the following methods: (a) random points outside the landslide range are directly used as non-landslide sample points [41,61,62]; (b) the historical landslide boundary is used as the buffer zone, and non-landslide samples are randomly selected in the study area a certain distance away from the buffer zone [63]; (c) non-landslide samples are selected from low-slope areas such as river courses and gullies in the study area [59]; (d) the target space outgoing sampling method [6], etc. It is difficult to ensure that these random non-landslide samples come from real and effective non-landslide areas. In addition, the selection method for non-landslide samples under certain conditions will exaggerate the contribution of such conditions as landslide influencing factors.
To solve the problem of non-landslide sample selection in the landslide susceptibility evaluation machine learning model, a landslide susceptibility evaluation method based on the information value (IV) model and machine learning (ML) method is proposed in this paper. First, the influence factors of a landslide were drawn up and the correlation was analyzed with a Pearson matrix. The information value model was used to preliminarily calculate the landslide susceptibility of the region, delimit the low-susceptibility area, and randomly select negative samples. At the same time, a few non-landslide points were selected in the moderate-susceptibility and high-susceptibility areas to make the results much closer to nature. Second, the IV-ML landslide susceptibility evaluation model was constructed by combining the information value model and machine learning model. Finally, the landslide susceptibility evaluation results of the IV-LR, IV-RF, IV-SVM, and IV-ANN and LR, RF, SVM, and ANN models were compared to test the improvement effect of the model.

2. Methods

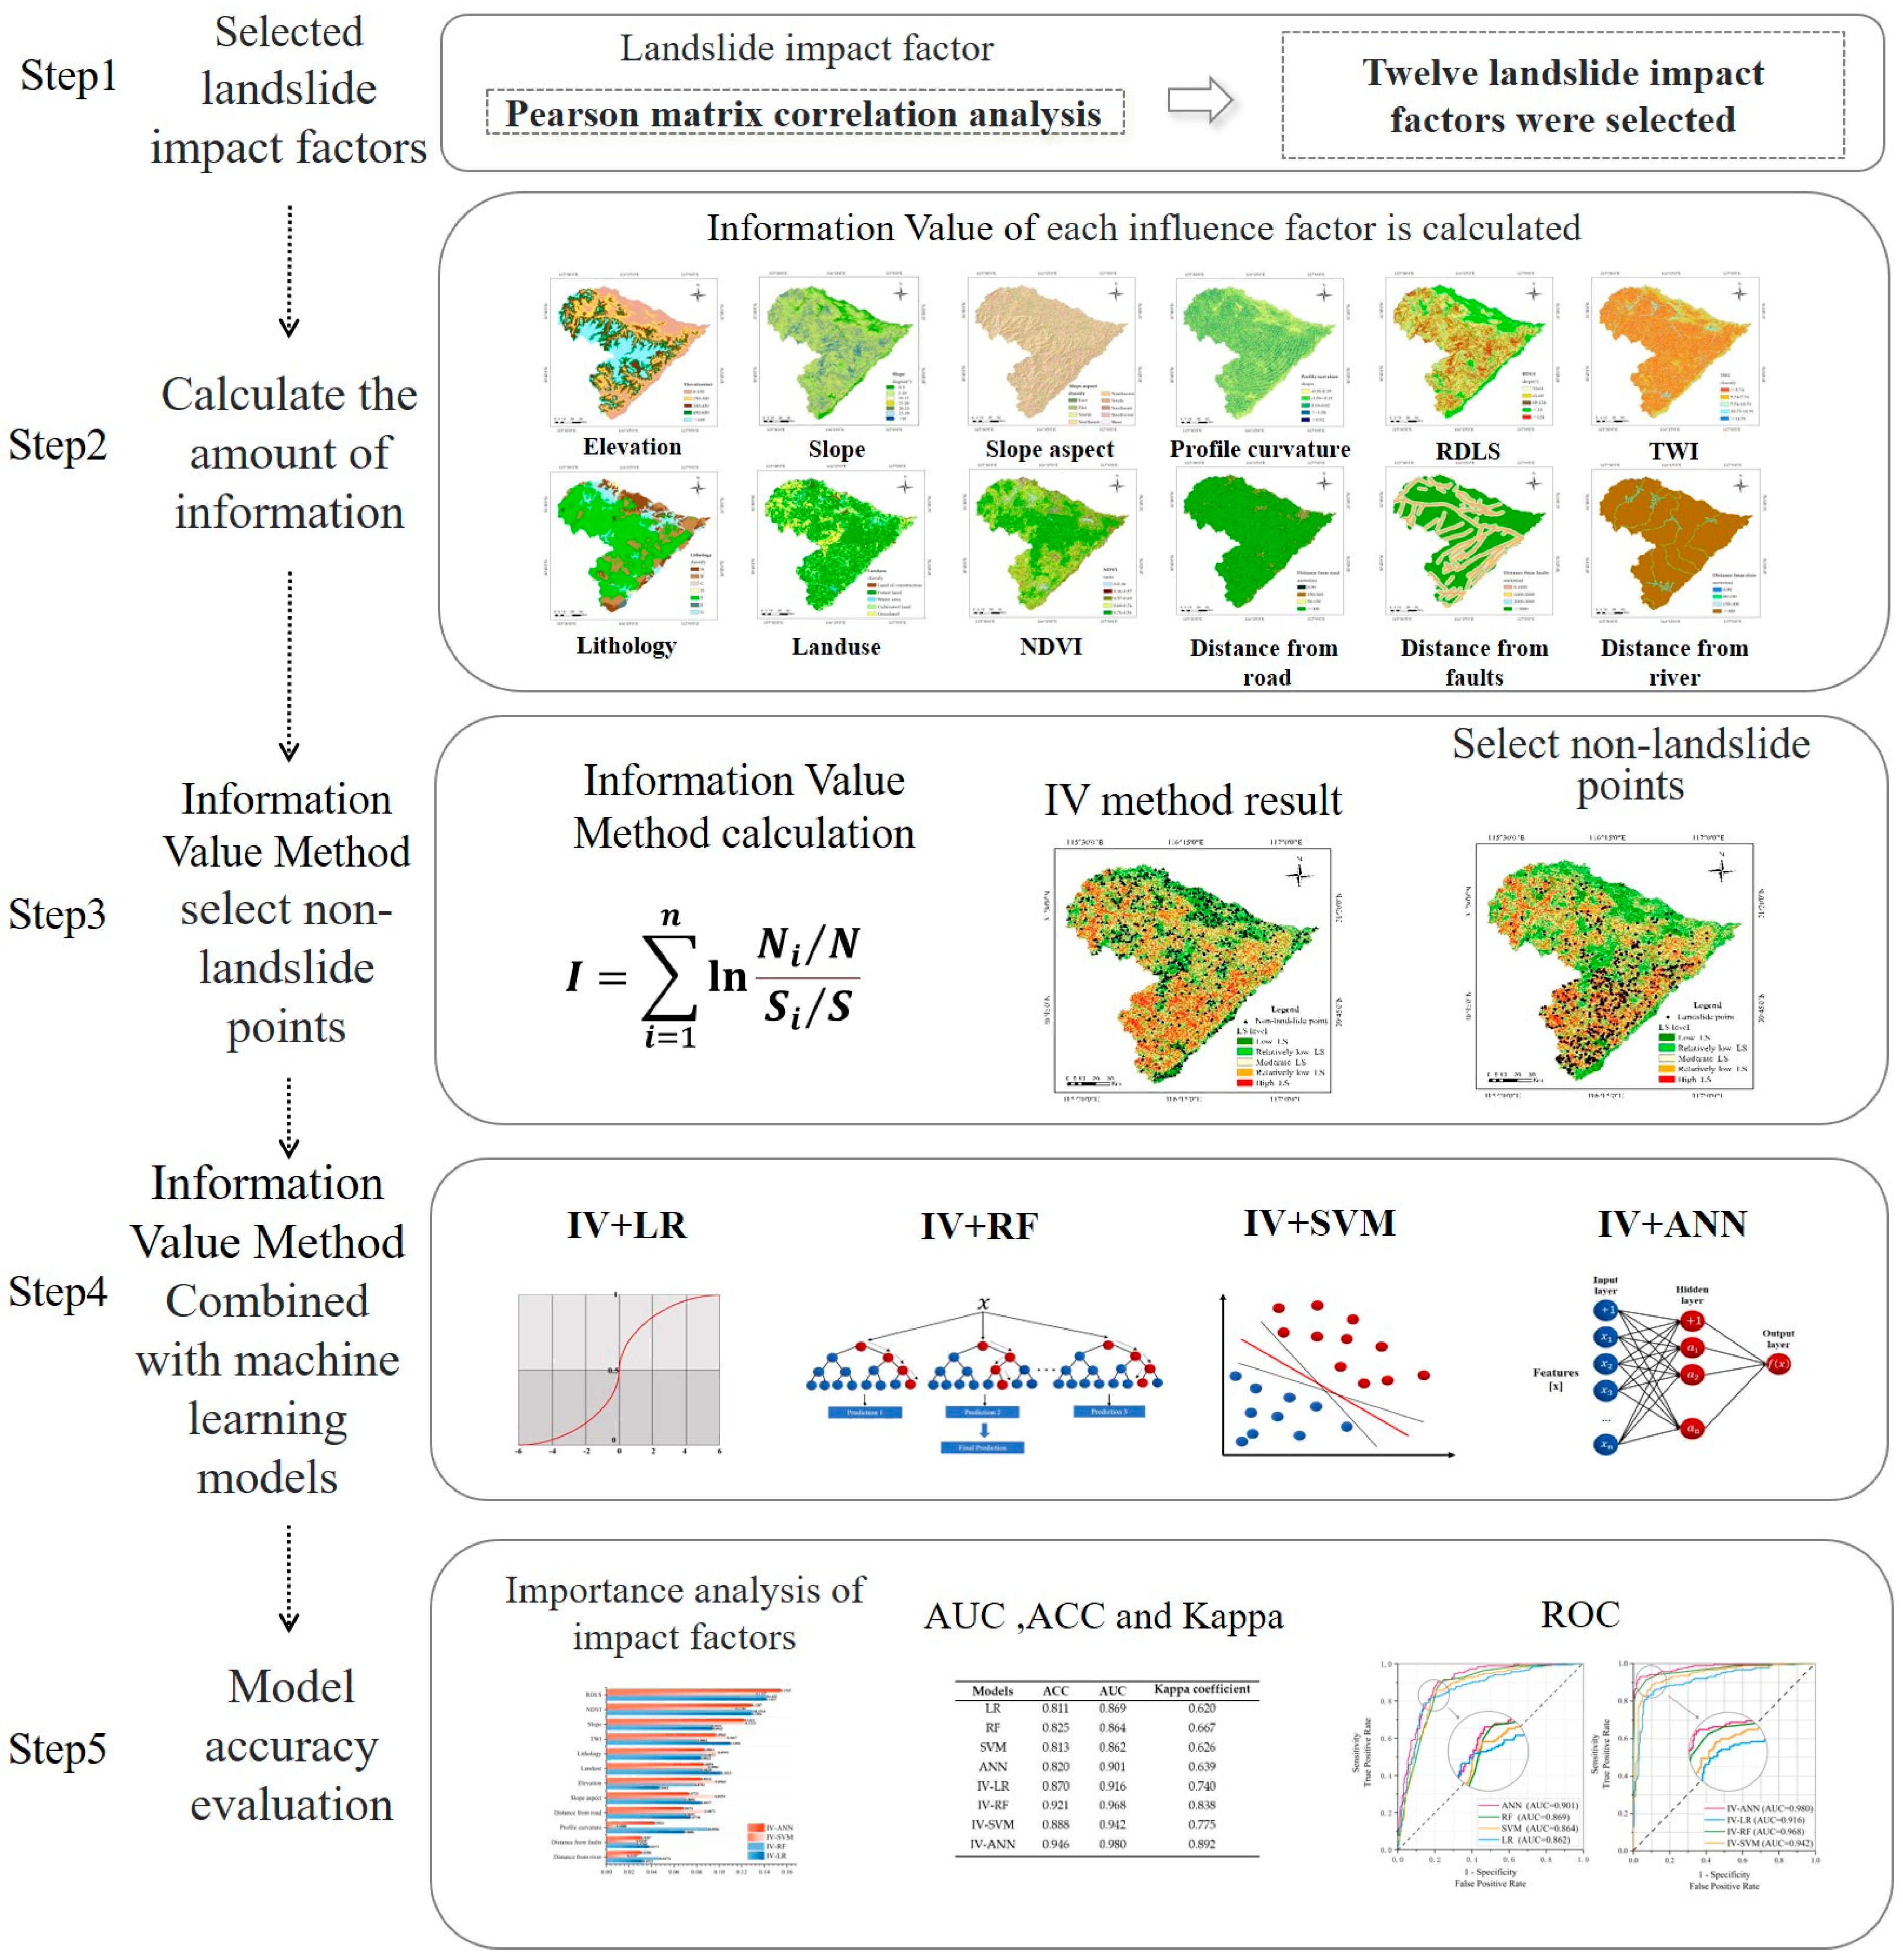
2.1. Workflow of Establishing IV-ML Landslide Susceptibility Maps

Some commonly used machine learning models in landslide susceptibility (LS) evaluation, such as random forest, support vector machine, logistic regression, artificial neural network, etc., show adequate evaluation accuracy. The results of the machine learning model are closely related to the data quality of landslide and non-landslide points when evaluating landslide susceptibility.
Therefore, this paper proposes a landslide susceptibility evaluation method combining the information value model with the machine learning model. The purpose is to provide more accurate non-landslide data prediction samples for the machine learning model through preprocessing with the information value model, improving the accuracy and effectiveness of the landslide susceptibility evaluation results. The work flow of this study was as follows.
Step 1. Collect the historical landslide point data of the study area, formulate 15 landslide influencing factors (elevation, slope, slope aspect, plan curvature, profile curvature, slope length, relief degree of land surface (RDLS), topographic wetness index (TWI), elevation variation coefficient, lithology, land use, normalized difference vegetation index (NDVI), distance from road, distance from river, and distance from faults) according to the geological and geomorphic environmental characteristics and landslide occurrence mechanism of the specific study area, conduct factor screening through a Pearson matrix analysis of correlation, and grade the above influencing factors.
Step 2. Calculate the Ni/N and Si/S data values in 64 grades of 12 impact factors in the study area and obtain the information value of each level of each impact factor.
Step 3. Use the information value model to evaluate the disaster susceptibility of the study area, obtain the disaster susceptibility zoning map, and select non-landslide units in the low-susceptibility area. In addition, a few non-landslide points are selected in the moderate-susceptibility and high-susceptibility areas to bring the results much closer to nature.
Step 4. Construct a machine learning training sample set with historical landslide point data and the abovementioned non-landslide units in the study area and establish the (IV-LR, IV-RF, IV-SVM, IV-ANN) model.
Step 5. Evaluate the accuracy of the above model and all independent ML models using performance evaluation methods such as area under the curve, accuracy, and Cohen’s kappa coefficient.
The data in this study were processed with IBM SPSS Modeler, and the flowchart can be replicated. The specific process is shown in Figure 1.

2.2. Information Value Model

According to the information value model, the occurrence of a landslide is related to the quantity and quality of data collected in the process of prediction. A landslide is affected by many factors. For a landslide, the information value model considers the quantity and quality of all information related to the landslide in a certain area. It is expressed by the amount of information, as shown in Equation (1):
I A j B = ln P A j B P B ( j = 1,2 , 3 n )
In Equation (1), P A j B represents the probability that A realizes event B in the state j . In the actual calculation process, for the convenience of calculation, the overall probability is converted to sample frequency for estimation, and the above equation is converted into Equation (2).
I A j B = ln N j / N S j / S ( j = 1,2 , 3 n )
In Equation (2), I A j B represents the amount of information that A shows for the occurrence of landslide B in state j ; N j is the number of units marked with landslide A j ; N is the total number of known landslide distribution units in the study area; S j is the number of units marked A j ; S is the total number of units in the research area. The total amount of information generated by the landslide under the condition of a combination of state factors can be determined by Equation (3), and the value of I directly indicates the possibility of a landslide generated by this unit.
I = i = 1 n ln N i / N S i / S

2.3. Machine Learning Model

2.3.1. Logistic Regression

The logistic regression model (LR) can solve the problem of dichotomous variables in landslide susceptibility evaluation by finding an optimal fitting function to quantitatively describe the relationship between the factors affecting landslide occurrence. There are two types of variables in the logistic regression model: X i is the independent variable and Y is the dependent variable. X i is the influence factor of the landslide. Y is a dichotomous variable, represented by 0 (representing a non-landslide event) and 1 (representing a landslide event).
In the logistic regression model, P is the probability of occurrence, and P ranges from 0 to 1. Take the natural logarithm of the ratio of the probability of landslide occurrence P to the probability of non-occurrence 1 P , ln P = P 1 P . By logical transformation, L o g i t P = Z ; then
P = exp z 1 + exp z
Z = α + β 1 x 1 + β 2 x 2 + + β n x n
P = exp α + β 1 x 1 + + β n x n 1 + exp α + β 1 x 1 + + β n x n = 1 1 + α + β 1 x 1 + + β n x n
where P is the probability of landslide occurrence in the study area; e is the natural constant used in the logistic regression equation; α is the intercept of the logistic regression equation (a constant term of logistic regression equation); β i ( i = 1,2 , 3 , , n ) is the logistic regression coefficient of the corresponding evaluation factor x i ( i = 1,2 , 3 , , n ) in the logistic regression model. In this study, I is the information value calculated based on each evaluation factor subset. Therefore, the i th factor ( i = 1,2 , 3 , , n ) and the j th subset ( j = 1,2 , 3 , , n ) are sorted into the following formula in practical application:
P = 1 1 + e α + β 11 x 11 + + β n k x n k
In the above equation, P is the calculated probability of landslide occurrence. β i j is the regression coefficient of variable x i j ( i = 1,2 , , n ) for each evaluation factor. ( j = 1,2 , , n ) is the subset of each evaluation factor; that is, i j is the j th subset of the i th evaluation factor based on the information quantity value attribute.

2.3.2. Random Forest

Random forest (RF) is a combinatorial classification model that consists of multiple decision trees t X , Θ i , i = 1 , ; parameter set Θ i is an independent, uniformly distributed random vector. In the case of a given independent variable X , the optimal classification results are voted by each decision tree model.
The random forest model can measure the importance of landslide impact factors, calculate the relative weight value of landslide impact factors based on the Gini index, and finally conduct a landslide susceptibility evaluation. In the model, the optimal segmentation is measured by the impurity of the random forest classification tree, and the impurity is calculated by the Gini index method. By calculating the reduction value D G i of the Gini index when the influence factor i is divided into nodes, the importance of landslide impact factor i is the sum of the D G i of all nodes in the forest and the average of all trees. The importance of landslide factors is measured by the percentage of the average Gini reduction value of landslide factors in the sum of the average Gini reduction value of all factors. This is shown in Formula (8):
P i = t = 1 b n = 1 c D G i t n i = 1 a t = 1 b n = 1 c D G i t n
where a , b , and c are the total number of landslide influencing factors, the number of classification trees, and the number of single tree nodes, respectively. D G i t n is the Gini index reduction value of the i th evaluation factor at the n th node of the t th tree. P i is the importance degree of the i th evaluation factor in all evaluation factors.

2.3.3. Support Vector Machine

Support vector machine (SVM) is a supervised learning method based on statistical learning theory. It is more effective and reasonable than other machine learning methods in solving small-sample, high-dimensional, and nonlinear problems. SVM can solve nonlinear and high-dimensional pattern recognition problems with fewer samples and has been widely used in landslide susceptibility evaluation. The application process of the support vector machine model for landslide susceptibility evaluation is as follows.
Given some linearly separable landslide or non-landslide data points x i i = 1 , 2 , , n , which belong to two different classes y i = ± 1 , the goal of the support vector machine is finding a hyperplane that separates the above two types of data based on the maximum interval in the n-dimensional data space, as shown in Equation (9).
1 2 h 2
The formula must meet the following conditions:
y i h · x i + a 1
where h is the norm of the hyperplane; a is a scalar basis; · is a scalar-based operation. Based on the Lagrange multiplier, the cost function can be expressed as
L = 1 2 h 2 i = 1 n λ i y i h · x i + a 1
where λ i is the Lagrange multiplier, which can be solved by Lagrange duality.
In the case of inseparability, relaxation variable ξ i can be introduced as its restrictive condition, as shown in Formula (12).
y i h · x i + a 1 ξ i
At this time, Equation (11) becomes
L = 1 2 h 2 1 v n i = 1 n ξ i
where v 0 , 1 is introduced to consider the case of misclassification.

2.3.4. Artificial Neural Network

The artificial neural network (ANN) model is a nonlinear statistical model that is usually applied to regression or classification problems. The BP neural network algorithm is the most common and representative in the ANN, which belongs to the supervised learning method and adopts a gradient descent algorithm to minimize the error function value. Its purpose is to reduce the gap between the target output value of the output unit and the inferred output value. Its full name is the artificial neural network based on the error backpropagation algorithm. The structure of the BP neural network is divided into three layers: input layer, hidden layer, and output layer. The input layer is the number of neurons, i.e., the number of input variables; the number of hidden layers depends on the complexity of the problem. The number of neurons in the output layer is the number of output variables. Common activation neuronal functions include logistic function, hyperbolic function, or S-shaped function.
In the evaluation of landslide susceptibility, (1) the classification data of each influencing factor are taken as the input data of the BP neural network algorithm; (2) the number of hidden layers, the number of hidden layer nodes, the maximum learning and training times, the minimum precision, and the minimum error values of the neural network system are set according to the quantified value of the landslide influence factor; (3) the landslide point data in the study area are divided into learning data and experimental data, and the data are imported into the BP neural network for learning and training. When the error of the output value meets the requirements, the output layer outputs the model to analyze and evaluate the regional landslide susceptibility results.

3. Study Area and Conditioning Factors of Landslide

3.1. Overview of the Study Area and Data Sources

The study area was located in the west of Anhui Province (30°22′~31°81′ N, 115°36′~117°24′ E), covering an area of 14,813.58 km2, with the highest altitude of 1756 m and the lowest altitude of 8 m. The Dabie Mountains in the area extend from northwest to southeast, showing a curved mountain system that protrudes to the south. The terrain in the study area is highly undulating, including high-undulating mountains, low-undulating mountains, high hills, middle and low hills, plains, etc. The area has obvious features of mountain, hill, and plain geomorphic units. The middle and low mountains in the area are mainly composed of late Archean deep metamorphic rock series, early Proterozoic and Foziling group shallow metamorphic rock series, intrusive rocks, and volcanic rocks. The hills are mainly distributed along the piedmont and composed of Cretaceous intrusive rocks, Jurassic volcanic rocks, and Cretaceous clastic rocks. The shallow hump plain is mainly spread in front of the mountains, and there are also small areas spread among the mountains. It is composed of Quaternary alluvium. The plain is mainly distributed along the two sides of the Changjiang River and Pi River system and is composed of Quaternary alluvial deposits. The main rivers in the study area are the Pi River, Shi River, Hangbu River, and Fengle River, etc. The water level in the basin changes rapidly, the runoff is large, and the flood season is long, which provides conditions for the development of landslides.
The landslide data came from the List of Small Geological Hazards in Anhui Province released by the Anhui Public Welfare Geological Survey Management Center (Anhui Geological Survey and Environmental Monitoring Center). There were 619 landslide points in the study area, as shown in Figure 2, and the field pictures of three landslides are shown in Figure 3. Data sources and descriptions of landslide impact factors are shown in Table 1.

3.2. Conditioning Factors

The formation mechanism of landslide is complicated and its susceptibility is influenced by both natural factors and human activities. Considering the geological environment characteristics and landslide mechanism of the study area, we considered 15 influencing factors, namely elevation, slope, slope aspect, plan curvature, profile curvature, slope length, RDLS, TWI, elevation variation coefficient, lithology, land use, NDVI, distance from road, distance from river, and distance from faults, as shown in Figure 4.
The 15 influencing factors were graded as follows:
(1)
Elevation: Elevation is highly correlated with the moisture content of the rock and soil mass, intensity of human activities, and vegetation coverage. The influence factor of elevation was divided into five levels: 0~150, 150~300, 300~450, 450~600, and >600 m.
(2)
Slope: The slope affects the internal stress distribution, the thickness of loose solid material on the slope, the vegetation coverage, and surface water runoff, thus affecting the stability of the slope. The influence factor of slope was divided into seven levels: 0°~5°, 5°~10°, 10°~15°, 15°~20°, 20°~25°, 25°~30°, and >30°.
(3)
Slope aspect: The solar radiation intensity of different slope directions is different, affecting the vegetation cover, water evaporation, and weathering degree of the slope, which in turn affect the stability of the slope. The influence factor of slope aspect was divided into nine levels: plane, north, northeast, east, southeast, south, southwest, west, and northwest.
(4)
Plan curvature: The influence factor of plan curvature was divided into five levels: less than −0.70, −0.70~−0.20, −0.20~0.19, 0.19~0.68, and greater than 0.68.
(5)
Profile curvature: Profile curvature has an important effect on the flow velocity of surface material, which can control the movement velocity and energy of landslide material and rainfall confluence. The influence factor of profile curvature was divided into five levels: less than −1.04, −1.04~−0.31, −0.31~0.19, 0.19~0.92, and greater than 0.92.
(6)
Slope length: The influence factor of slope length was divided into five levels: 0–10, 10–30, 30–60, 60–100, and more than 100 m.
(7)
RDLS: RDLS is mainly the result of tectonic movement and surface erosion, representing the degree of regional surface erosion and cutting. The flat terrain does not easily form landslides. The influence factor of RDLS was divided into five levels: less than 0.36, 0.36~0.57, 0.57~0.69, 0.69~0.76, and greater than 0.76.
(8)
TWI: TWI quantifies the control of terrain over basic hydrological processes. The influence factor of TWI was divided into five levels: less than 5.74, 5.74~7.74, 7.74~10.73, 10.73 to 14.91, and greater than 14.91.
(9)
Elevation variation coefficient: The influence factor of elevation variation coefficient was divided into five levels: 0~0.017, 0.017~0.036, 0.036~0.061, 0.061~0.099, and greater than 0.099.
(10)
Lithology: Different rock and soil bodies are developed in different lithologies; thus, the shear strength is different, and the instability degree and anti-stability of slope are different. The influence factor of lithology was divided into seven levels: (A) massive hard granite group; (B) massive hard–relatively hard tuff, tuff lava rock group; (C) medium–thick layer hard sandstone rock group; (D) thin layer soft mudstone, shale rock group; (E) medium–thick layer hard quartz and gneiss rock group; (F) medium–thick layer hard carbonate rock group; (G) loose sand and clay soil layer group.
(11)
Land use: Different land use types have different effects on the conservation of surface water and soil, resulting in different surface stability and different impacts on the landslide. The influence factor of land use was divided into five levels: construction land, cultivated land, forest land, grassland, and water area.
(12)
NDVI: NDVI indicates vegetation growth status and vegetation coverage. Vegetation development reduces surface runoff, and soil and water loss can be reduced and anti-landslide ability can be enhanced through root consolidation. The influence factor of NDVI was divided into five levels: less than 0.36, 0.36~0.57, 0.57~0.69, 0.69~0.76, and greater than 0.76.
(13)
Distance from road: The cutting slope of road construction and other engineering activities result in the formation of a free surface of the slope body, which destroys the integrity of the rock and soil body, causing it to lose its original stability. The closer to the cutting slope, the more unstable the slope body. The influence factor of distance from road was divided into four levels: 0~50, 50~150, 150~300, and more than 300 m.
(14)
Distance from faults: The area around the fault structure is an area with active geological activities. There are many cracks and broken rock masses nearby, which easily lead to the development of landslides. The closer the fault is, the more frequent the geological activities are, and the more likely a landslide is to occur. The influence factor of distance from faults was divided into four levels: 0~1000, 1000~2000, 2000~3000, and greater than 3000 m.
(15)
Distance from river: River erosion is an important factor affecting landslide and is mainly manifested as the weakening of resistance to the slope front and the increase in free surface during erosion to affect slope stability. Theoretically, the area closer to the water body is vulnerable to the influence of water, resulting in frequent landslide disasters. The influence factor of distance from river was divided into four levels: 0~50, 50~150, 150~300, and more than 300 m.

4. Results

4.1. Correlation Analysis of Influence Factors

There are various factors affecting landslides, and there may be some correlation between factors. The advantage of the information value model is that it can calculate the internal classification index of each impact factor, but the correlation between impact factors is not described effectively. In the machine learning model, the selected evaluation factors should be independent of each other. If the correlation between the influence factors is high, the running speed of the training model will be reduced and the model will be complicated, thus affecting the accuracy of the prediction results.
In this paper, the Pearson correlation coefficient [64,65] was used to carry out correlation analysis of the selected impact factors, which evaluated the multiple linear relationships of the 15 impact factors of the information value model. The impact factors with high correlation were eliminated, and the impact factors suitable for the machine learning model to calculate the landslide susceptibility assessment were determined. The Pearson correlation method was used to calculate the correlation coefficient between two variables, so as to reflect the degree and direction of correlation between variables.
The Pearson correlation coefficient was defined as the quotient of covariance and standard deviation between two variables. The definition formula is as follows:
r = σ x y σ x 2 σ y 2
In Formula (14), r is the correlation coefficient; σ x is the standard deviation of the variable X; σ y is the standard deviation of the variable Y; σ x y is the covariance of X and Y; r is between −1 and 1, which is | r | 1 . The closer | r | is to 1, the higher the correlation between the two variables X and Y. When | r | 0.8 , variables are highly correlated. When 0.5 | r | < 0.8 , there is a moderate correlation between variables. When 0.3 | r | < 0.5 , the correlation between variables is low. When | r | < 0.3 , it means that the correlation between the two variables is very weak and basically irrelevant.
As shown in Figure 5, among the 15 influence factors selected in this paper, the Pearson correlation coefficients between elevation variation coefficient and elevation, slope length and slope, and plane curvature and profile curvature were all greater than 0.5 or less than −0.5, showing great correlation. Therefore, the three influencing factors of elevation variation coefficient, slope length, and plane curvature were eliminated. The remaining 12 influencing factors were used to evaluate the vulnerability of landslide disaster.

4.2. Information Value Model and Selection of Non-Landslide Points

Certain sample data of landslide and non-landslide points should be selected when using the machine learning model to predict landslides. There were 619 landslide disaster points in the study area, i.e., 619 positive samples, as shown in Figure 6a. In order to improve the accuracy of non-landslide points, the information quantity values of the 12 influencing factors determined by factor correlation analysis were calculated using the information quantity model, and the landslide susceptibility partition map was obtained by the natural breakpoint method. A total of 743 non-landslide points (positive/negative ratio 1:1.2) were selected from low LS and relatively low LS areas, and a few non-landslide points were selected in the moderate-susceptibility and high-susceptibility areas to make the results much closer to nature. The distribution of the selected non-landslide points is shown in Figure 6b. Information values are shown in Table 2.

4.3. Landslide Susceptibility Evaluation Results

With 12 influencing factors as input variables of the machine learning model, landslide units and non-landslide units as output variables, 70% of the sample data were randomly selected as training samples and 30% as test samples. In this paper, the four machine learning models of IV-LR, IV-RF, IV-SVM, and IV-ANN were constructed. The landslide susceptibility index calculated with the four ML models and IV-ML models was graded by the natural breakpoint method, and the results are shown in Figure 7. In general, the landslide susceptibility zones obtained by these four models had high similarity. The areas with high and relatively high landslide susceptibility were mainly distributed in the south and southeast of the study area, which have large relief degrees, complex geological tectonic environments, abundant fault development, and frequent human engineering activities. The areas with low and relatively low landslide susceptibility were mainly distributed in the northeast and the border of the study area, where the slope is slow, the fault distribution is sparse, and the landslide disasters are less frequent.
As seen in Table 3, the areas predicted by IV-LR, IV-RF, IV-SVM, and IV-ANN were 5954.19, 5601.11, 5156.44, and 5621.62 km2, respectively. In only 40.19%, 37.81%, 34.81%, and 37.95% of the total area, the distribution of landslide disasters reached 449, 466, 422, and 475, accounting for 72.54%, 75.28%, 68.17%, and 76.74% of the total number of landslides, respectively. Landslide density reached 0.0754, 0.0832, 0.0818, and 0.0845 /km2. Compared with the single ML model, the IV-ML model predicted that the area of high and relatively high landslide susceptibility was small, the disaster density within the area was large, and the performance was better. In the IV-ANN model, the area of low and the relatively low landslide susceptibility was 6994.13 km2, accounting for 47.21% of the total area; only 74 landslide disasters were distributed, accounting for 11.95%, and the landslide density was only 0.0106 km2, indicating that the IV-ML model had the best performance.

5. Discussion

5.1. Accuracy Evaluation of the Model

The accuracy of the landslide susceptibility evaluation results is directly related to the reliability of the evaluation model. By checking the results of the evaluation models, their prediction performance can be accurately compared, so as to select the best landslide susceptibility evaluation model. Based on the confusion matrix, this paper used three indexes to evaluate the performance of different models, namely accuracy (ACC) [6,66], Cohen’s kappa coefficient (kappa coefficient) [66], and area under the receiver operating characteristic curve (ROC) [8,30,67].
The confusion matrix is a summary of the prediction results of classification problems. We used the count to aggregate the number of correct and incorrect predictions and break them down by category. In the model performance evaluation of landslide susceptibility prediction, true positive ( T P ) and false positive ( F P ) samples were correctly and incorrectly classified, respectively. False negative ( F N ) and true negative ( T N ) were the numbers of non-landslide samples correctly and incorrectly classified, respectively.
ACC refers to the ratio of the number of samples correctly classified by the model to the total number of samples. The formula is as follows:
A c c u r a c y = T P + T N T P + T N + F P + F N
The kappa coefficient is an index used to test consistency and can also be used to measure the effect of classification. When the kappa coefficient is larger than 0.6, the model has high reliability, and when it is larger than 0.8, the model has reached optimal reliability. The calculation formula is as follows:
K C = O A P e 1 P e
P e = ( T P + F N ) ( T P + F P ) + ( T N + F N ) ( T N + F P ) T P + T N + F P + F N 2
ROC takes the landslide susceptibility index as its threshold, and X-axis coordinates represent the true negative rate (TNR), that is, the probability of non-disaster points being incorrectly predicted; Y-axis coordinates represent the true positive rate (TPR), that is, the probability that the disaster point is correctly predicted.
T N R = T N T N + F N
T P R = T P T P + F N
The closer the ROC curve is to the upper left corner, the higher the prediction accuracy of the model. The area under the curve (AUC) value is usually used to represent the accuracy of the prediction results. The value of the AUC represents the area under the curve and is enclosed by the coordinate axis. Usually, the value range is [0.5, 1]. The closer the value is to 1, the more accurate the model prediction results will be.
As seen in Table 4, the ACC values of the IV-LR, IV-RF, IV-SVM, IV-ANN, LR, RF, SVM, and ANN models were 0.870, 0.921, 0.888, 0.946, 0.811, 0.825, 0.813, and 0.820, respectively. Among them, the IV-ANN model had the largest ACC value, followed by the IV-RF, IV-SVM, IV-LR, RF, ANN, SVM, and LR models. The accuracy of the IV-ML model was in the range [0.870, 0.946], which was significantly higher than that of machine learning alone [0.811, 0.820].
The ROC curve and AUC values can be seen from Figure 8 and Table 4. The AUC values of the IV-LR, IV-RF, IV-SVM, IV-ANN, LR, RF, SVM, and ANN models were 0.916, 0.968, 0.942, 0.980, 0.869, 0.864, 0.862, and 0.901, respectively. The AUC value of the IV-ANN model was the largest, followed by the IV-RF, IV-SVM, IV-LR, ANN, LR, RF, and SVM models. The AUC value of IV-ML model was in the range [0.980, 0.916], which was significantly higher than that of machine learning alone [0.862, 0.901].
As can be seen from Table 4, the kappa coefficients of IV-LR, IV-RF, IV-SVM, IV-ANN, LR, RF, SVM, and ANN models were 0.740, 0.838, 0.775, 0.892, 0.620, 0.667, 0.626, and 0.639, respectively. The IV-ANN model had the largest kappa coefficient and the best performance, followed by the IV-RF, IV-SVM, IV-LR, RF, ANN, SVM, LR, and IV-ML models with kappa coefficients in the range [0.740, 0.892], significantly higher than machine learning alone [0.620, 0.667].
Through the ACC, kappa coefficient, and ROC curve analysis, it was found that four IV-ML models and four independent ML models were effective and reasonable when analyzing the landslide susceptibility in the Dabie Mountain area of Anhui Province. By comparison, the ACC value, kappa coefficient, and AUC value of the four IV-ML models were higher than those of the four independent ML models, so the IV-ML models were significantly superior to the ML models, and the IV-ANN model applied to the Dabie Mountain area of Anhui was the best, followed by IV-RF, IV-RF, and IV-LR.

5.2. Analysis of Landslide Susceptibility and Influencing Factors

The evaluation results of several IV-ML landslide susceptibility prediction models proposed in this paper were similar. The high LS area in the study area was mainly distributed in the area with an elevation fluctuation of 33–61, vegetation coverage less than 0.57, and slope greater than 20°. The relatively high LS area was mainly distributed around the high LS area in the contact zone of hard granite, quartzite, and gneiss with the topographic wetness index of 5.74–7.74. The moderate LS area was obvious on both sides of the road, and the land use type was woodland area. The low and relatively low LS areas were less affected by human activities and rich in vegetation.
The importance of the influencing factors reflected the degrees of influence of the different factors on regional landslide susceptibility. Some index factors had more important effects on landslide development, while others had less impact. The calculation and analysis of the importance of each index factor can provide guidance for landslide management. The values of the 12 filtered impact factors were taken as the input data of the model, and the importance ranking of factors based on the IV-LR, IV-RF, IV-SVM, and IV-ANN models was obtained through the propensity score method calculation, as shown in Figure 9.
It was concluded that RDLS, NDVI, slope, and TWI were the most important index factors and the main controlling factors affecting slope disaster distribution in the Dabie Mountain area of Anhui Province. The results indicated that landslides in the Dabie Mountain area of Anhui Province mainly occurred in areas with an RDLS value of 33–61, indicating that the fluctuations in altitude values and cutting depth in mountainous areas had important effects on landslide development. Landslides mainly occurred in areas with an NDVI value less than 0.57. In 2021, the industrial added value above the designated size in the study area increased by 15.5% [68]. With the rapid development of human activities such as transportation and construction, slope cutting and foundation expansion are common in the construction process, which causes vegetation destruction and rock and soil instability along the road and exacerbates surface weathering and soil erosion. Landslides tend to occur in extreme weather such as heavy rainfall. Landslides in the Dabie Mountain area of Anhui Province mainly occurred in slope values greater than 20°, which indicated that slope affected the internal stress distribution, the thickness of loose solid material, vegetation coverage, and surface water runoff, and thus affected slope stability. Landslides in the Dabie Mountain area of Anhui Province mainly occurred in areas with TWI values of 5.74–7.74. The quantified hydrological process of TWI revealed that the slope was unstable under the action of rainfall flow and prone to landslides.

6. Conclusions

After the correlation analysis, 12 landslide influencing factors, namely elevation, slope, slope aspect, profile curvature, RDLS, TWI, lithology, land use, NDVI, distance from road, distance from river, and distance from faults, were selected for landslide susceptibility analysis. The information value model was used to delimit the low LS area, and the non-landslide points were randomly selected in the delimited area. The landslide susceptibility evaluation models combined with IV-LR, IV-RF, IV-SVM, and IV-ANN were constructed. Comparison and consideration of the separate LR, RF, SVM and ANN models were also carried out.
This study took the Dabie Mountain area of Anhui Province as an experimental area to evaluate the landslide susceptibility. The results indicated that (1) the evaluation results of several IV-ML landslide susceptibility prediction models proposed in this paper were similar. The high LS area was mainly distributed in the area with an elevation fluctuation of 33–61, vegetation coverage of less than 0.57, and slope greater than 20°. The relatively high LS area was mainly distributed around the high LS area in the contact zone of hard granite, quartzite, and gneiss with the topographic wetness index of 5.74–7.74. The moderate LS area mostly occurred in the woodland-type regions and within 300 m from roads. The low and relatively low LS areas were distributed in the regions with an NDVI greater than 0.69 and were less affected by human activities and rich in vegetation. (2) The accuracy evaluation results demonstrated that the IV-ML model (IV-LR, IV-RF, IV-SVM, IV-ANN) proposed in this paper performed significantly better than the independent machine learning models (LR, RF, SVM, ANN). The IV-ML model compensated for the non-landslide point selection problem existing in the independent ML model to create a more accurate pre-evaluation of landslide susceptibility.

Author Contributions

Y.L. designed the research flow and wrote the manuscript. Z.M., L.Z. and D.H. performed the data analysis. H.H. contributed significantly to the conception of the study and constructive discussion. All authors have read and agreed to the published version of the manuscript.

Funding

This work was supported by the National Natural Science Foundations of China (no. 42071365, 42271423), as well as by the National Undergraduate Innovation and Entrepreneurship Training Program (no. 201910364245).

Institutional Review Board Statement

No applicable.

Informed Consent Statement

No applicable.

Data Availability Statement

No applicable.

Acknowledgments

This work was supported by the National Natural Science Foundations of China. We would like to express our sincere thanks to the anonymous reviewers and editors for their valuable comments and suggestions for this paper.

Conflicts of Interest

The authors declare no conflict of interest.

References

  1. Li, H.; He, Y.; Xu, Q.; Deng, J.; Li, W.; Wei, Y. Detection and segmentation of loess landslides via satellite images: A two-phase framework. Landslides 2022, 19, 673–686. [Google Scholar] [CrossRef]
  2. Wang, H.; Zhang, L.; Yin, K.; Luo, H.; Li, J. Landslide identification using machine learning. Geosci. Front. 2021, 12, 351–364. [Google Scholar] [CrossRef]
  3. Panchal, S.; Shrivastava, A.K. Landslide hazard assessment using analytic hierarchy process (AHP): A case study of National Highway 5 in India. Ain Shams Eng. J. 2022, 13, 101626. [Google Scholar] [CrossRef]
  4. Gong, W.; Juang, C.H.; Wasowski, J. Geohazards and human settlements: Lessons learned from multiple relocation events in Badong, China—Engineering geologist’s perspective. Eng. Geol. 2021, 285, 106051. [Google Scholar] [CrossRef]
  5. Dikshit, A.; Pradhan, B.; Alamri, A.M. Pathways and challenges of the application of artificial intelligence to geohazards modelling. Gondwana Res. 2021, 100, 290–301. [Google Scholar] [CrossRef]
  6. Chen, W.; Li, Y. GIS-based evaluation of landslide susceptibility using hybrid computational intelligence models. Catena 2020, 195, 104777. [Google Scholar] [CrossRef]
  7. Youssef, A.M.; Pourghasemi, H.R. Landslide susceptibility mapping using machine learning algorithms and comparison of their performance at Abha Basin, Asir Region, Saudi Arabia. Geosci. Front. 2021, 12, 639–655. [Google Scholar] [CrossRef]
  8. Huang, F.; Cao, Z.; Guo, J.; Jiang, S.-H.; Li, S.; Guo, Z. Comparisons of heuristic, general statistical and machine learning models for landslide susceptibility prediction and mapping. Catena 2020, 191, 104580. [Google Scholar] [CrossRef]
  9. Zhou, X.; Wen, H.; Zhang, Y.; Xu, J.; Zhang, W. Landslide susceptibility mapping using hybrid random forest with GeoDetector and RFE for factor optimization. Geosci. Front. 2021, 12, 101211. [Google Scholar] [CrossRef]
  10. Wang, Q.; Li, W.; Wu, Y.; Pei, Y.; Xie, P. Application of statistical index and index of entropy methods to landslide susceptibility assessment in Gongliu (Xinjiang, China). Environ. Earth Sci. 2016, 75, 599. [Google Scholar] [CrossRef]
  11. Cao, C.; Xu, P.; Wang, Y.; Chen, J.; Zheng, L.; Niu, C. Flash Flood Hazard Susceptibility Mapping Using Frequency Ratio and Statistical Index Methods in Coalmine Subsidence Areas. Sustainability 2016, 8, 948. [Google Scholar] [CrossRef] [Green Version]
  12. Reichenbach, P.; Rossi, M.; Malamud, B.D.; Mihir, M.; Guzzetti, F. A review of statistically-based landslide susceptibility models. Earth Sci. Rev. 2018, 180, 60–91. [Google Scholar] [CrossRef]
  13. He, H.; Hu, D.; Sun, Q.; Zhu, L.; Liu, Y. A Landslide Susceptibility Assessment Method Based on GIS Technology and an AHP-Weighted Information Content Method: A Case Study of Southern Anhui, China. ISPRS Int. J. Geo-Inf. 2019, 8, 266. [Google Scholar] [CrossRef] [Green Version]
  14. Cheng, J.; Dai, X.; Wang, Z.; Li, J.; Qu, G.; Li, W.; She, J.; Wang, Y. Landslide Susceptibility Assessment Model Construction Using Typical Machine Learning for the Three Gorges Reservoir Area in China. Remote Sens. 2022, 14, 2257. [Google Scholar] [CrossRef]
  15. Pourghasemi, H.R.; Gayen, A.; Park, S.; Lee, C.-W.; Lee, S. Assessment of Landslide-Prone Areas and Their Zonation Using Logistic Regression, LogitBoost, and NaïveBayes Machine-Learning Algorithms. Sustainability 2018, 10, 3697. [Google Scholar] [CrossRef] [Green Version]
  16. Zhang, W.; Li, H.; Han, L.; Chen, L.; Wang, L. Slope stability prediction using ensemble learning techniques: A case study in Yunyang County, Chongqing, China. J. Rock Mech. Geotech. Eng. 2022, 14, 1089–1099. [Google Scholar] [CrossRef]
  17. Li, Y.; Chen, J.; Zhou, F.; Li, Z.; Mehmood, Q. Stability evaluation and potential damage of a giant paleo-landslide deposit at the East Himalayan Tectonic Junction on the Southeastern margin of the Qinghai-Tibet Plateau. Nat. Hazards 2022, 111, 2117–2140. [Google Scholar] [CrossRef]
  18. Migon, P.; Jancewicz, K.; Rozycka, M.; Duszynski, F.; Kasprzak, M. Large-scale slope remodelling by landslides—Geomorphic diversity and geological controls, Kamienne Mts., Central Europe. Geomorphology 2017, 289, 134–151. [Google Scholar] [CrossRef]
  19. Khosravi, K.; Pourghasemi, H.R.; Chapi, K.; Bahri, M. Flash flood susceptibility analysis and its mapping using different bivariate models in Iran: A comparison between Shannon’s entropy, statistical index, and weighting factor models. Environ. Monit. Assess. 2016, 188, 656. [Google Scholar] [CrossRef]
  20. Chen, W.; Han, H.X.; Huang, B.; Huang, Q.L.; Fu, X.D. A data-driven approach for landslide susceptibility mapping: A case study of Shennongjia Forestry District, China. Geomat. Nat. Hazards Risk 2018, 9, 720–736. [Google Scholar] [CrossRef]
  21. Liao, H.M.; Yang, X.G.; Xu, F.G.; Xu, H.; Zhou, J.W. A fuzzy comprehensive method for the risk assessment of a landslide-dammed lake. Environ. Earth Sci. 2018, 77, 750. [Google Scholar] [CrossRef]
  22. Basu, T.; Pal, S. A GIS-based factor clustering and landslide susceptibility analysis using AHP for Gish River Basin, India. Environ. Dev. Sustain. 2020, 22, 4787–4819. [Google Scholar] [CrossRef]
  23. Kayastha, P.; Dhital, M.R.; De Smedt, F. Application of the analytical hierarchy process (AHP) for landslide susceptibility mapping: A case study from the Tinau watershed, west Nepal. Comput. Geosci. 2013, 52, 398–408. [Google Scholar] [CrossRef]
  24. Tang, R.X.; Yan, E.C.; Wen, T.; Yin, X.M.; Tang, W. Comparison of Logistic Regression, Information Value, and Comprehensive Evaluating Model for Landslide Susceptibility Mapping. Sustainability 2021, 13, 3803. [Google Scholar] [CrossRef]
  25. Zhao, B.B.; Ge, Y.F.; Chen, H.Z. Landslide susceptibility assessment for a transmission line in Gansu Province, China by using a hybrid approach of fractal theory, information value, and random forest models. Environ. Earth Sci. 2021, 80, 441. [Google Scholar] [CrossRef]
  26. Chen, L.F.; Guo, H.X.; Gong, P.S.; Yang, Y.Y.; Zuo, Z.L.; Gu, M.Y. Landslide susceptibility assessment using weights-of-evidence model and cluster analysis along the highways in the Hubei section of the Three Gorges Reservoir Area. Comput. Geosci. 2021, 156, 104899. [Google Scholar] [CrossRef]
  27. Torizin, J. Elimination of informational redundancy in the weight of evidence method: An application to landslide susceptibility assessment. Stoch. Environ. Res. Risk Assess. 2016, 30, 635–651. [Google Scholar] [CrossRef]
  28. Wang, Q.Q.; Guo, Y.H.; Li, W.P.; He, J.H.; Wu, Z.Y. Predictive modeling of landslide hazards in Wen County, northwestern China based on information value, weights-of-evidence, and certainty factor. Geomat. Nat. Hazards Risk 2019, 10, 820–835. [Google Scholar] [CrossRef] [Green Version]
  29. Liu, Y.; Zhao, L.J.; Bao, A.M.; Li, J.L.; Yan, X.B. Chinese High Resolution Satellite Data and GIS-Based Assessment of Landslide Susceptibility along Highway G30 in Guozigou Valley Using Logistic Regression and MaxEnt Model. Remote Sens. 2022, 14, 3620. [Google Scholar] [CrossRef]
  30. Zhao, Y.; Wang, R.; Jiang, Y.J.; Liu, H.J.; Wei, Z.L. GIS-based logistic regression for rainfall-induced landslide susceptibility mapping under different grid sizes in Yueqing, Southeastern China. Eng. Geol. 2019, 259, 105147. [Google Scholar] [CrossRef]
  31. Chen, Z.; Liang, S.Y.; Ke, Y.T.; Yang, Z.K.; Zhao, H.L. Landslide susceptibility assessment using evidential belief function, certainty factor and frequency ratio model at Baxie River basin, NW China. Geocarto Int. 2019, 34, 348–367. [Google Scholar] [CrossRef]
  32. Kornejady, A.; Ownegh, M.; Rahmati, O.; Bahremand, A. Landslide susceptibility assessment using three bivariate models considering the new topo-hydrological factor: HAND. Geocarto Int. 2018, 33, 1155–1185. [Google Scholar] [CrossRef]
  33. Chen, W.; Pourghasemi, H.R.; Naghibi, S.A. A comparative study of landslide susceptibility maps produced using support vector machine with different kernel functions and entropy data mining models in China. Bull. Eng. Geol. Environ. 2018, 77, 647–664. [Google Scholar] [CrossRef]
  34. Krkač, M.; Gazibara, S.B.; Arbanas, Z.; Sečanj, M.; Arbanas, S.M. A comparative study of random forests and multiple linear regression in the prediction of landslide velocity. Landslides 2020, 17, 2515–2531. [Google Scholar] [CrossRef]
  35. Zhang, Y.G.; Tang, J.; Liao, R.P.; Zhang, M.F.; Zhang, Y.; Wang, X.M.; Su, Z.Y. Application of an enhanced BP neural network model with water cycle algorithm on landslide prediction. Stoch. Environ. Res. Risk Assess. 2021, 35, 1273–1291. [Google Scholar] [CrossRef]
  36. Van Dao, D.; Jaafari, A.; Bayat, M.; Mafi-Gholami, D.; Qi, C.; Moayedi, H.; Van Phong, T.; Ly, H.-B.; Le, T.-T.; Trinh, P.T.; et al. A spatially explicit deep learning neural network model for the prediction of landslide susceptibility. Catena 2020, 188, 104451. [Google Scholar] [CrossRef]
  37. Aditian, A.; Kubota, T.; Shinohara, Y. Comparison of GIS-based landslide susceptibility models using frequency ratio, logistic regression, and artificial neural network in a tertiary region of Ambon, Indonesia. Geomorphology 2018, 318, 101–111. [Google Scholar] [CrossRef]
  38. Tekin, S.; Çan, T. Slide type landslide susceptibility assessment of the Büyük Menderes watershed using artificial neural network method. Environ. Sci. Pollut. Res. 2022, 29, 47174–47188. [Google Scholar] [CrossRef]
  39. Yi, Y.N.; Zhang, W.C.; Xu, X.W.; Zhang, Z.J.; Wu, X. Evaluation of neural network models for landslide susceptibility assessment. Int. J. Digit. Earth 2022, 15, 934–953. [Google Scholar] [CrossRef]
  40. Chen, W.; Zhang, S.; Li, R.; Shahabi, H. Performance evaluation of the GIS-based data mining techniques of best-first decision tree, random forest, and naïve Bayes tree for landslide susceptibility modeling. Sci. Total Environ. 2018, 644, 1006–1018. [Google Scholar] [CrossRef]
  41. Wu, Y.L.; Ke, Y.T.; Chen, Z.; Liang, S.Y.; Zhao, H.L.; Hong, H.Y. Application of alternating decision tree with AdaBoost and bagging ensembles for landslide susceptibility mapping. Catena 2020, 187, 104396. [Google Scholar] [CrossRef]
  42. Guo, Z.Z.; Shi, Y.; Huang, F.M.; Fan, X.M.; Huang, J.S. Landslide susceptibility zonation method based on C5.0 decision tree and K-means cluster algorithms to improve the efficiency of risk management. Geosci. Front. 2021, 12, 101249. [Google Scholar] [CrossRef]
  43. Wei, A.H.; Yu, K.N.; Dai, F.G.; Gu, F.J.; Zhang, W.X.; Liu, Y. Application of Tree-Based Ensemble Models to Landslide Susceptibility Mapping: A Comparative Study. Sustainability 2022, 14, 6330. [Google Scholar] [CrossRef]
  44. Han, H.M.; Shi, B.; Zhang, L. Prediction of landslide sharp increase displacement by SVM with considering hysteresis of groundwater change. Eng. Geol. 2021, 280, 105876. [Google Scholar] [CrossRef]
  45. Huang, Y.; Zhao, L. Review on landslide susceptibility mapping using support vector machines. Catena 2018, 165, 520–529. [Google Scholar] [CrossRef]
  46. Singh, A.K.; Kumar, P.; Ali, R.; Al-Ansari, N.; Vishwakarma, D.K.; Kushwaha, K.S.; Panda, K.C.; Sagar, A.; Mirzania, E.; Elbeltagi, A.; et al. An Integrated Statistical-Machine Learning Approach for Runoff Prediction. Sustainability 2022, 14, 8209. [Google Scholar] [CrossRef]
  47. Nhu, V.-H.; Shirzadi, A.; Shahabi, H.; Chen, W.; Clague, J.J.; Geertsema, M.; Jaafari, A.; Avand, M.; Miraki, S.; Asl, D.T.; et al. Shallow Landslide Susceptibility Mapping by Random Forest Base Classifier and Its Ensembles in a Semi-Arid Region of Iran. Forests 2020, 11, 421. [Google Scholar] [CrossRef] [Green Version]
  48. Qi, T.J.; Zhao, Y.; Meng, X.M.; Shi, W.; Qing, F.; Chen, G.; Zhang, Y.; Yue, D.X.; Guo, F.Y. Distribution Modeling and Factor Correlation Analysis of Landslides in the Large Fault Zone of the Western Qinling Mountains: A Machine Learning Algorithm. Remote Sens. 2021, 13, 4990. [Google Scholar] [CrossRef]
  49. Sun, D.L.; Wen, H.J.; Wang, D.Z.; Xu, J.H. A random forest model of landslide susceptibility mapping based on hyperparameter optimization using Bayes algorithm. Geomorphology 2020, 362, 107201. [Google Scholar] [CrossRef]
  50. Nnanwuba, U.E.; Qin, S.; Adeyeye, O.A.; Cosmas, N.C.; Yao, J.; Qiao, S.; Jingbo, S.; Egwuonwu, E.M. Prediction of Spatial Likelihood of Shallow Landslide Using GIS-Based Machine Learning in Awgu, Southeast/Nigeria. Sustainability 2022, 14, 12000. [Google Scholar] [CrossRef]
  51. Pokharel, B.; Althuwaynee, O.F.; Aydda, A.; Kim, S.-W.; Lim, S.; Park, H.-J. Spatial clustering and modelling for landslide susceptibility mapping in the north of the Kathmandu Valley, Nepal. Landslides 2021, 18, 1403–1419. [Google Scholar] [CrossRef]
  52. Tang, R.-X.; Kulatilake, P.H.S.W.; Yan, E.-C.; Cai, J.-S. Evaluating landslide susceptibility based on cluster analysis, probabilistic methods, and artificial neural networks. Bull. Eng. Geol. Environ. 2020, 79, 2235–2254. [Google Scholar] [CrossRef]
  53. Tonini, M.; Pecoraro, G.; Romailler, K.; Calvello, M. Spatio-temporal cluster analysis of recent Italian landslides. Georisk Assess. Manag. Risk Eng. Syst. Geohazards 2022, 16, 536–554. [Google Scholar] [CrossRef]
  54. Dai, H.Y.; Zhang, H.; Dai, H.Y.; Wang, C.; Tang, W.; Zou, L.C.; Tang, Y.X. Landslide Identification and Gradation Method Based on Statistical Analysis and Spatial Cluster Analysis. Remote Sens. 2022, 14, 4504. [Google Scholar] [CrossRef]
  55. Arabameri, A.; Pal, S.C.; Rezaie, F.; Chakrabortty, R.; Saha, A.; Blaschke, T.; Di Napoli, M.; Ghorbanzadeh, O.; Ngo, P.T.T. Decision tree based ensemble machine learning approaches for landslide susceptibility mapping. Geocarto Int. 2022, 37, 4594–4627. [Google Scholar] [CrossRef]
  56. Di Napoli, M.; Carotenuto, F.; Cevasco, A.; Confuorto, P.; Di Martire, D.; Firpo, M.; Pepe, G.; Raso, E.; Calcaterra, D. Machine learning ensemble modelling as a tool to improve landslide susceptibility mapping reliability. Landslides 2020, 17, 1897–1914. [Google Scholar] [CrossRef]
  57. Goetz, J.N.; Brenning, A.; Petschko, H.; Leopold, P. Evaluating machine learning and statistical prediction techniques for landslide susceptibility modeling. Comput. Geosci. 2015, 81, 1–11. [Google Scholar] [CrossRef]
  58. Su, C.X.; Wang, B.J.; Lv, Y.H.; Zhang, M.P.; Peng, D.L.; Bate, B.; Zhang, S. Improved landslide susceptibility mapping using unsupervised and supervised collaborative machine learning models. Georisk Assess. Manag. Risk Eng. Syst. Geohazards 2022. [Google Scholar] [CrossRef]
  59. Wang, C.H.; Lin, Q.G.; Wang, L.B.; Jiang, T.; Su, B.D.; Wang, Y.J.; Mondal, S.K.; Huang, J.L.; Wang, Y. The influences of the spatial extent selection for non-landslide samples on statistical-based landslide susceptibility modelling: A case study of Anhui Province in China. Nat. Hazards 2022, 112, 1967–1988. [Google Scholar] [CrossRef]
  60. Zhang, Y.Z.; Yan, Q.S. Landslide Susceptibility Prediction Based on High-Trust Non-Landslide Point Selection. Int. J. Geo-Inf. 2022, 11, 398. [Google Scholar] [CrossRef]
  61. Wang, Y.; Fang, Z.; Wang, M.; Peng, L.; Hong, H. Comparative study of landslide susceptibility mapping with different recurrent neural networks. Comput. Geosci. 2020, 138, 104445. [Google Scholar] [CrossRef]
  62. Huang, F.; Ye, Z.; Jiang, S.-H.; Huang, J.; Chang, Z.; Chen, J. Uncertainty study of landslide susceptibility prediction considering the different attribute interval numbers of environmental factors and different data-based models. Catena 2021, 202, 105250. [Google Scholar] [CrossRef]
  63. Xi, C.J.; Han, M.; Hu, X.W.; Liu, B.; He, K.; Luo, G.; Cao, X.C. Effectiveness of Newmark-based sampling strategy for coseismic landslide susceptibility mapping using deep learning, support vector machine, and logistic regression. Bull. Eng. Geol. Environ. 2022, 81, 174. [Google Scholar] [CrossRef]
  64. Dou, J.; Yunus, A.P.; Merghadi, A.; Shirzadi, A.; Nguyen, H.; Hussain, Y.; Avtar, R.; Chen, Y.; Pham, B.T.; Yamagishi, H. Different sampling strategies for predicting landslide susceptibilities are deemed less consequential with deep learning. Sci. Total Environ. 2020, 720, 137320. [Google Scholar] [CrossRef]
  65. Wang, Y.M.; Feng, L.W.; Li, S.J.; Ren, F.; Du, Q.Y. A hybrid model considering spatial heterogeneity for landslide susceptibility mapping in Zhejiang Province, China. Catena 2020, 188, 104425. [Google Scholar] [CrossRef]
  66. Ali, S.A.; Parvin, F.; Vojteková, J.; Costache, R.; Linh, N.T.T.; Pham, Q.B.; Vojtek, M.; Gigović, L.; Ahmad, A.; Ghorbani, M.A. GIS-based landslide susceptibility modeling: A comparison between fuzzy multi-criteria and machine learning algorithms. Geosci. Front. 2021, 12, 857–876. [Google Scholar] [CrossRef]
  67. Zhao, X.; Chen, W. Optimization of Computational Intelligence Models for Landslide Susceptibility Evaluation. Remote Sens. 2020, 12, 2180. [Google Scholar] [CrossRef]
  68. Lu ‘an Municipal Bureau of Statistics Home Page. Available online: https://tjj.luan.gov.cn (accessed on 13 January 2023).
Figure 1. Flowchart of the procedures followed in this study.
Sustainability 15 01971 g001
Figure 2. Location of the study area and landslide disaster catalog map.
Sustainability 15 01971 g002
Figure 3. Examples of landslides in the study area. (a) Landslide in Huoshan county; (b) landslide in Tongcheng county; (c) landslide in Yuexi county.
Sustainability 15 01971 g003
Figure 4. Landslide affecting factors. (a) Elevation, (b) slope, (c) slope aspect, (d) plan curvature, (e) profile curvature, (f) slope length, (g) RDLS, (h) TWI, (i) elevation variation coefficient, (j) lithology, (k) land use, (l) NDVI, (m) distance from road, (n) distance from faults, (o) distance from river.
Sustainability 15 01971 g004aSustainability 15 01971 g004b
Figure 5. The output results of the Pearson correlation matrix.
Sustainability 15 01971 g005
Figure 6. Information value model and selection of non-landslide points. (a) Landslide susceptibility map for the study area derived from the information value model; (b) selection of non-landslide points in low and relatively low-landslide-susceptibility areas of the information value model result.
Sustainability 15 01971 g006
Figure 7. Landslide susceptibility maps of the Dabie Mountain area of Anhui using (a) LR method; (b) RF method; (c) SVM method; (d) ANN method; (e) IV-LR method; (f) IV-RF method; (g) IV-SVM method; (h) IV-ANN method.
Sustainability 15 01971 g007aSustainability 15 01971 g007b
Figure 8. ROC curves for different models. (a) ML models; (b) IV-ML models.
Sustainability 15 01971 g008
Figure 9. The importance of each model factor as calculated by the propensity score method.
Sustainability 15 01971 g009
Table 1. Research data introduction.
Landslide-Affecting FactorOrigin WebsiteDescription
Elevationhttps://www.usgs.gov (1 August 2022)30 m digital elevation model ASTERGDEM30M
Slope; slope aspect;
plan curvature;
profile curvature;
slope length; RDLS; TWI;
elevation variation coefficient
https://www.usgs.gov (1 August 2022)Extracted from digital elevation model (DEM)
lithology;
distance from faults
http://geocloudsso.cgs-govcn (1 August 2022)Type of lithology;
buffer range of faults
Land use; NDVI;
distance from river
http://www.resdc.cn (1 August 2022)Land use type; normalized difference vegetation index; buffer range of river
Distance from roadhttp://www.openstreetmap.ong (1 August 2022)Buffer range of road
Table 2. Calculation results of the information quantity values.
Landslide-Affecting FactorEvaluation
Factors
ClassificationNi/NSi/SI
ElevationElevation
(m)
0~150 m0.16320.2588−0.4614
150~300 m0.28270.20830.3054
300~450 m0.23260.18160.2477
450~600 m0.13570.1398−0.0294
>600 m0.18580.2115−0.1297
SlopeSlope
(°)
0~5°0.06620.1565−0.8599
5~10°0.19710.17980.0920
10~15°0.26660.17750.4067
15~20°0.18900.16650.1267
20~25°0.1438 0.1368 0.0501
25~30°0.07750.0943 −0.1957
>30°0.0598 0.0887 −0.3942
Slope aspectDegree
(°)
Flat (−1°)0.00160.0118−1.9881
North (0~22.5°)0.03880.0645−0.5082
Northeast (22.5~67.5°)0.11310.1212−0.0694
East (67.5~112.5°)0.14700.12790.1393
Southeast (112.5~157.5°)0.16960.14160.1803
South (157.5~202.5°)0.18580.12680.3818
Southwest (202.5~247.5°)0.12760.10860.1617
West (247.5~292.5°)0.10020.1097−0.0913
Northwest (292.5~337.5°)0.08890.1258−0.3478
North (337.5~360°)0.02750.0621−0.8155
Profile
curvature
Curvature
values
<−1.040.03070.0353−0.1389
−1.04~−0.310.14220.1808−0.2407
−0.31~0.190.47170.44800.0516
0.19~0.920.29890.28770.0382
>0.920.05650.04820.1592
RDLSSlope
(°)
>33°0.16160.2497−0.4354
33~61°0.42650.27300.4460
61~69°0.28590.25580.1116
69~124°0.10990.1641−0.4015
>124°0.01620.0574−1.2676
TWITWI
values
<5.740.42650.4547−0.0639
5.74~7.740.39740.35390.1159
7.74~10.730.11630.10810.0729
10.73~14.910.04680.0690−0.3869
>14.910.01290.0143−0.1019
LithologyLithologyA: Massive hard granite group0.67530.59680.1236
B: Massive hard–relatively hard tuff, tuff lava rock group0.00650.0100−0.4340
C: Medium–thick layer hard sandstone rock group0.05650.0928−0.4950
D: Thin layer soft mudstone, shale rock group0.04850.1094−0.8140
E: Medium–thick layer hard quartz and gneiss rock group0.20520.17910.1360
F: Medium–thick layer hard carbonate rock group0.00650.00390.5082
G: Loose sand and clay soil layer group0.00160.0081−1.6168
Land useUse typeCultivated land0.22130.18500.1794
Forest land0.68980.61600.1132
Grassland0.07270.1668−0.8307
Water area0.00810.0179−0.7979
Land of construction0.00810.0143−0.5698
NDVINDVI
values
<0.360.02260.0320−0.3465
0.36~0.570.08400.04630.5962
0.57~0.690.24390.13050.6252
0.69~0.760.40390.37440.0757
>0.760.24560.4168−0.5290
Distance from RoadsDistance
from
road
(m)
0~50 m0.10180.04240.8755
50~150 m0.11630.06900.5228
150~300 m0.08240.08210.0039
>300 m0.69950.8066−0.1424
Distance from RiversDistance
from
river
(m)
0~50 m0.00810.0085−0.0454
50~150 m0.01940.01670.1487
150~300 m0.03230.02400.2974
>300 m0.94020.9508−0.0112
Distance from FaultsDistance
from
fault
(m)
0~1000 m0.20840.18060.1431
1000~2000 m0.19550.17710.0989
2000~3000 m
>3000 m
0.1551
0.4410
0.1567
0.4856
−0.0104
−0.0963
Table 3. Comparison of the landslide susceptibility results using the ML and IV-ML methods.
MethodLandslide SusceptibilityArea
(km2)
Proportion of Area Covered (%)Number of LandslidesLandslides
Covered (%)
Landslide
Density
LRLow and relatively low6172.6141.67%11017.77%0.0178
High and relatively high6043.3140.80%43770.60%0.0723
RFLow and relatively low6282.8142.41%6911.15%0.0110
High and relatively high5618.3537.93%45573.51%0.0810
SVMLow and relatively low6208.7041.91%7311.79%0.0118
High and relatively high5661.3638.22%44672.05%0.0788
ANNLow and relatively low5820.8939.29%6310.18%0.0108
High and relatively high6730.3245.43%49880.45%0.0740
IV-LRLow and relatively low5933.77 40.06%9315.02%0.0157
High and relatively high5954.19 40.19%44972.54%0.0754
IV-RFLow and relatively low7011.21 47.33%7712.44%0.0110
High and relatively high5601.11 37.81%46675.28%0.0832
IV-SVMLow and relatively low7371.33 49.76%9114.70%0.0123
High and relatively high5156.44 34.81%42268.17%0.0818
IV-ANNLow and relatively low6994.13 47.21%7411.95%0.0106
High and relatively high5621.62 37.95%47576.74%0.0845
Table 4. Evaluation matrix (AUC, ACC, and kappa coefficient) for the performance of ML models and IV-ML models.
ModelsACCAUCKappa Coefficient
LR0.8110.8690.620
RF0.8250.8640.667
SVM0.8130.8620.626
ANN0.8200.9010.639
IV-LR0.8700.9160.740
IV-RF0.9210.9680.838
IV-SVM0.8880.9420.775
IV-ANN0.9460.9800.892
Disclaimer/Publisher’s Note: The statements, opinions and data contained in all publications are solely those of the individual author(s) and contributor(s) and not of MDPI and/or the editor(s). MDPI and/or the editor(s) disclaim responsibility for any injury to people or property resulting from any ideas, methods, instructions or products referred to in the content.

