
A Multi-Analytical Approach for the Characterisation of Pigments from an Egyptian Sarcophagus Cover of the Late Dynastic Period: A Case Study

 ,
,  ,
,  ,
,  ,
,  and
and 
Abstract
:1. Introduction
2. Materials and Methods
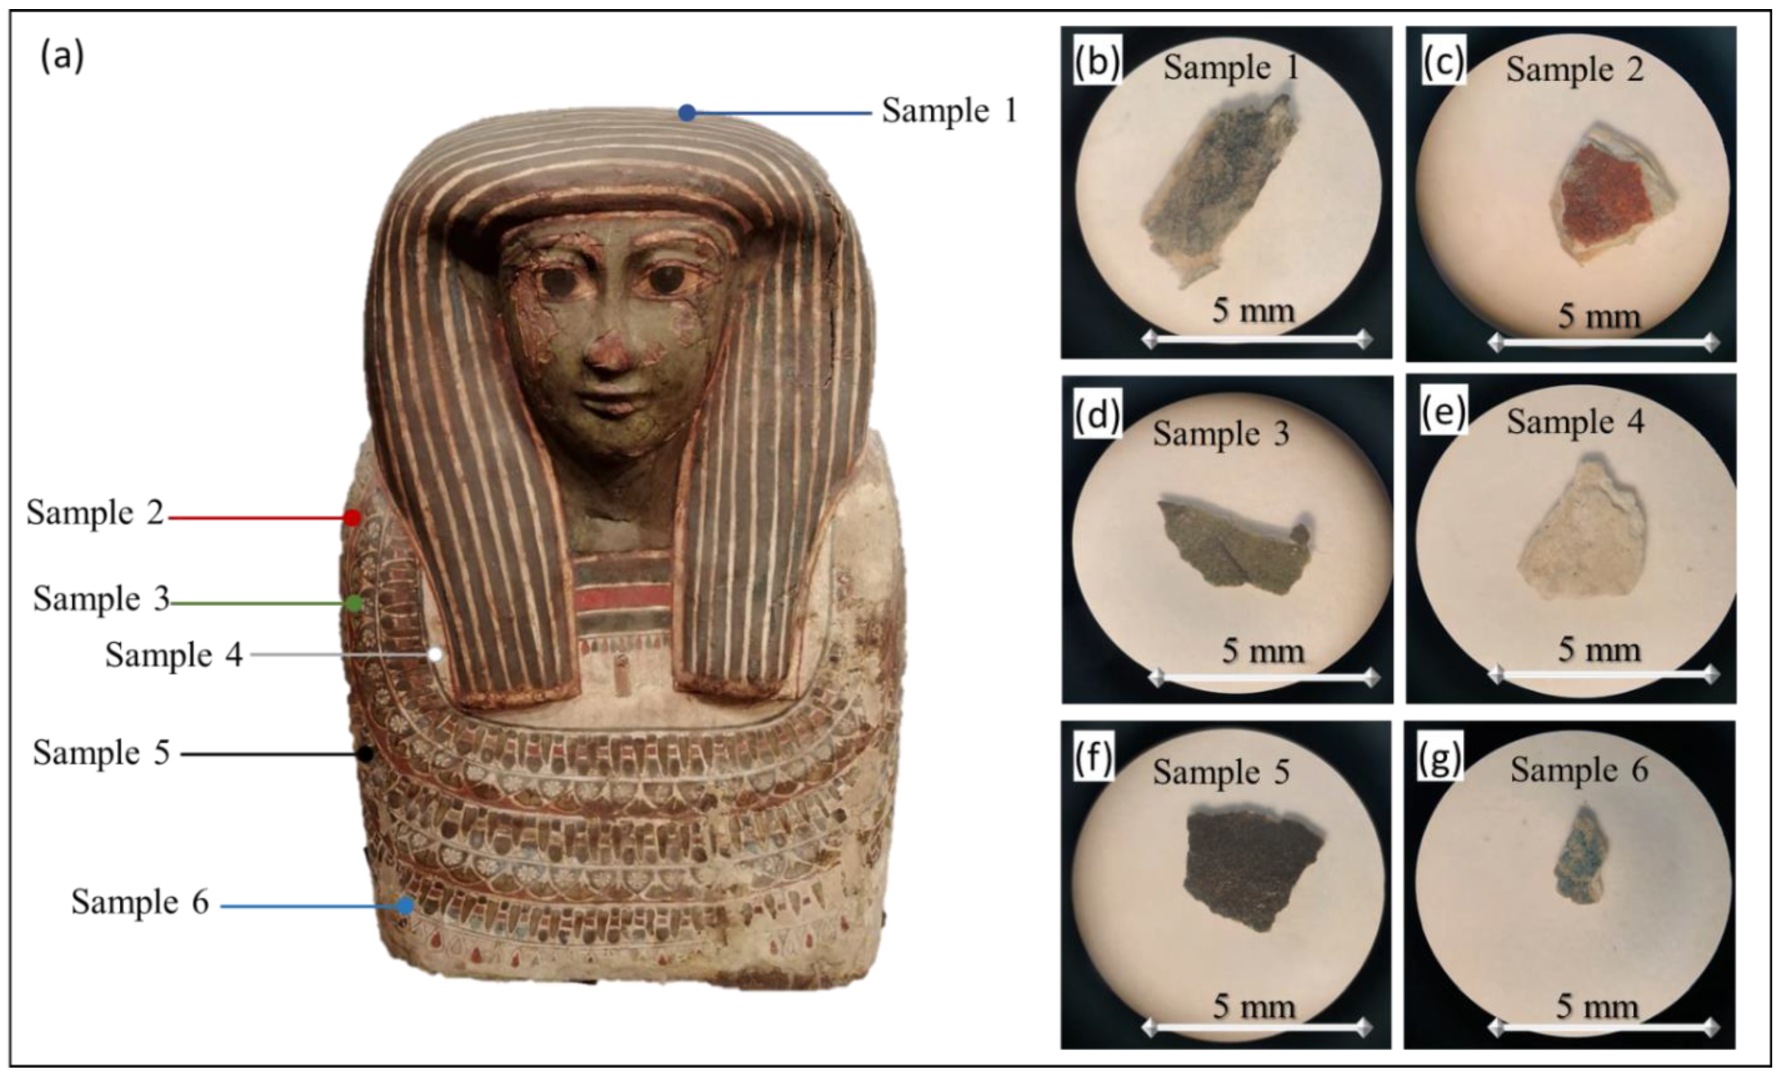
2.1. Samples
2.2. Instrumental Techniques
3. Results
3.1. In situ Analyses
3.2. Laboratory Analyses
4. Discussion
5. Conclusions
Author Contributions
Funding
Institutional Review Board Statement
Informed Consent Statement
Data Availability Statement
Acknowledgments
Conflicts of Interest
References
- Fermo, P.; Piazzalunga, A.; de Vos, M.; Andreoli, M. A Multi-Analytical Approach for the Study of the Pigments Used in the Wall Paintings from a Building Complex on the Caelian Hill (Rome). Appl. Phys. A Mater. Sci. Process. 2013, 113, 1109–1119. [Google Scholar] [CrossRef]
- Bonizzoni, L.; Bruni, S.; Guglielmi, V.; Milazzo, M.; Neri, O. Field and Laboratory Multi-Technique Analysis of Pigments and Organic Painting Media from an Egyptian Coffin (26th Dynasty). Archaeometry 2011, 53, 1212–1230. [Google Scholar] [CrossRef]
- Bonizzoni, L.; Bruni, S.; Gargano, M.; Guglielmi, V.; Zaffino, C.; Pezzotta, A.; Pilato, A.; Auricchio, T.; Delvaux, L.; Ludwig, N. Use of Integrated Non-Invasive Analyses for Pigment Characterization and Indirect Dating of Old Restorations on One Egyptian Coffin of the XXI Dynasty. Microchem. J. 2018, 138, 122–131. [Google Scholar] [CrossRef]
- David, A.R.; Edwards, H.G.M.; Farwell, D.W.; de Faria, D.L.A. Raman Spectroscopic Analysis of Ancient Egyptian Pigments. Archaeometry 2001, 43, 461–473. [Google Scholar] [CrossRef]
- Hallmann, A.; Rickerby, S.; Shekede, L. Blue and Green in the Decoration of a Kushite Chapel in Karnak, Egypt: Technical Evaluation Using Low-Tech, Non-Invasive Procedures. J. Archaeol. Sci. Rep. 2021, 39, 103190. [Google Scholar] [CrossRef]
- Pagès-Camagna, S.; Raue, D. Coloured Materials Used in Elephantine: Evolution and Continuity from the Old Kingdom to the Roman Period. J. Archaeol. Sci. Rep. 2016, 7, 662–667. [Google Scholar] [CrossRef]
- Pozza, G.; Ajò, D.; Chiari, G.; de Zuane, F.; Favaro, M. Photoluminescence of the Inorganic Pigments Egyptian Blue, Han Blue and Han Purple. J. Cult. Herit. 2000, 1, 393–398. [Google Scholar] [CrossRef]
- Sakr, A.; Tawab, N.A.; Mahmoud, A.; Ghaly, M.F.; Edwards, H.G.M.; Elbashar, Y.H. New Insights on Plasters, Pigments and Binder in Mural Paintings of the Setka Tomb (QH 110), Elephantine, Aswan, Upper Egypt. Spectrochim. Acta A Mol. Biomol. Spectrosc. 2021, 263, 120153. [Google Scholar] [CrossRef]
- Luzzatto, L.; Pompas, R. Il Significato Dei Colori Nelle Civiltà Antiche, 3rd ed.; Bompiani: Milano, Italy, 2010. [Google Scholar]
- Aliatis, I.; Bersani, D.; Campani, E.; Casoli, A.; Lottici, P.P.; Mantovan, S.; Marino, I.G. Pigments Used in Roman Wall Paintings in the Vesuvian Area. J. Raman Spectrosc. 2010, 41, 1537–1542. [Google Scholar] [CrossRef]
- Marzoni Fecia Di Cossato, Y.; Ronca, F. Pigmenti e legante organico nei frammenti di terracotta provenienti dal tempio di Tutmosi IV (Tebe ovest, Egitto). Egitto E Vicino Oriente 1993, 16, 73–85. [Google Scholar]
- FitzHugh, E.W. Artists’ Pigments, A Handbook of Their History and Characteristics; National Gallery of Art: Washington, DC, USA, 2012; Volume 3. [Google Scholar]
- Liu, M.; Peng, Z.; Wang, X.; He, Y.; Huang, S.; Wan, J.; Wang, B.; Zhou, Y.; Yang, H.; Zheng, H. The Effect of High Energy Ball Milling on the Structure and Properties of Two Greenish Mineral Pigments. Dye. Pigment. 2021, 193, 109494. [Google Scholar] [CrossRef]
- Rinaldi, S.; Quartullo, G.; Milaneschi, A.; Pietropaoli, R.; Occorsio, S.; Costantini Scala, F.; Minunno, G.; Virno, C. La Fabbrica Dei Colori: Pigmenti e Coloranti Nella Pittura e Nella Tintoria; Il bagatto: Roma, Italy, 1995. [Google Scholar]
- Guglielmi, V.; Andreoli, M.; Comite, V.; Baroni, A.; Fermo, P. The Combined Use of SEM-EDX, Raman, ATR-FTIR and Visible Reflectance Techniques for the Characterisation of Roman Wall Painting Pigments from Monte d’Oro Area (Rome): An Insight into Red, Yellow and Pink Shades. Environ. Sci. Pollut. Res. 2022, 29, 29419–29437. [Google Scholar] [CrossRef] [PubMed]
- Dodd, L.S.; Scott, D.A.; Nikias, G.A.; Au, J.; Ramos, A. The ritual significance of colour specialised pigments in a wooden Egyptian funerary statuette from the New Kingdom. J. Egypt. Archaeol. 2009, 95, 83–104. [Google Scholar] [CrossRef]
- Edwards, H.G.M.; Jorge Villar, S.E.; Eremin, K.A. Raman Spectroscopic Analysis of Pigments from Dynastic Egyptian Fu-nerary Artefacts. J. Raman Spectrosc 2004, 35, 786–795. [Google Scholar] [CrossRef]
- Gargano, M.; Bonizzoni, L.; Grifoni, E.; Melada, J.; Guglielmi, V.; Bruni, S.; Ludwig, N. Multi-Analytical Investigation of Panel, Pigments and Varnish of The Martyirdom of St. Catherine by Gaudenzio Ferrari (16th Century). J. Cult. Herit. 2020, 46, 289–297. [Google Scholar] [CrossRef]
- Moussa, A.; Badawy, M.; Saber, N. Chromatic Alteration of Egyptian Blue and Egyptian Green Pigments in Pharaonic Late Period Tempera Murals. Sci. Cult. 2021, 7, 1–15. [Google Scholar] [CrossRef]
- Elkhial, M.M.; el Hadidi, N.M.N. Multi-instrumental investigation and analysis of a unique ancient Egyptian wooden obelisk (New Kingdom) at the Grand Egyptian Museum. Sci. Cult. 2022, 8, 1–14. [Google Scholar] [CrossRef]
- Abdallah, M.; Abdrabou, A.; Kamal, H.M. Multiscientific Analytical Approach of Polychrome Greco-Roman Palette Applied on a Wooden Model Naos: Case Study. Mediterr. Archaeol. Archaeom. 2020, 20, 45–65. [Google Scholar] [CrossRef]
- Bruni, S.; Guglielmi, V.; della Foglia, E.; Castoldi, M.; Bagnasco Gianni, G. A Non-Destructive Spectroscopic Study of the Decoration of Archaeological Pottery: From Matt-Painted Bichrome Ceramic Sherds (Southern Italy, VIII-VII B.C.) to an Intact Etruscan Cinerary Urn. Spectrochim. Acta A Mol. Biomol. Spectrosc. 2018, 191, 88–97. [Google Scholar] [CrossRef] [Green Version]
- D’amico, S.; Comite, V.; Paladini, G.; Ricca, M.; Colica, E.; Galone, L.; Guido, S.; Mantella, G.; Crupi, V.; Majolino, D.; et al. Multitechnique Diagnostic Analysis and 3D Surveying Prior to the Restoration of St. Michael Defeating Evil Painting by Mattia Preti. Environ. Sci. Pollut. Res. 2021, 29, 29478–29497. [Google Scholar] [CrossRef]
- Fermo, P.; Mearini, A.; Bonomi, R.; Arrighetti, E.; Comite, V. An Integrated Analytical Approach for the Characterization of Repainted Wooden Statues Dated to the Fifteenth Century. Microchem. J. 2020, 157, 105072. [Google Scholar] [CrossRef]
- Guglielmi, V.; Comite, V.; Andreoli, M.; Demartin, F.; Lombardi, C.A.; Fermo, P. Pigments on Roman Wall Painting and Stucco Fragments from the Monte d’Oro Area (Rome): A Multi-Technique Approach. Appl. Sci. 2020, 10, 7121. [Google Scholar] [CrossRef]
- Abdelmoniem, A.M.; Mahmoud, N.; Mohamed, W.S.; Ewais, A.Y.; Abdrabou, A. Archaeometric Study of a Polychrome Wooden Coffin from 26th Dynasty-Egypt. Mediterr. Archaeol. Archaeom. 2020, 20, 7–17. [Google Scholar] [CrossRef]
- Shams, A.H.; Alkaradawi, A.S.; Eloriby, R.A. Chemical characterization and manufacturing technology of some lustre ceramic dishes of the Abbasid Period, Northen Egypt. Mediterr. Archaeol. Archaeom. 2022, 22, 50–66. [Google Scholar] [CrossRef]
- Ali, M.F.; Abd Elkawy, M.H. Physical Analysis and Treatment of Disintegrated Islamic Mural Paintings from the 15th Century Taqi Aldin Albistami Hospice. Sci. Cult. 2021, 7, 45–56. [Google Scholar]
- Hornung, E.; Krauss, R.; Warburton, D. Ancient Egyptian Chronology; Brill: Leiden, The Netherlands, 2006; ISBN 9789004113855. [Google Scholar]
- Dyer, J.; Sotiropoulou, S. A Technical Step Forward in the Integration of Visible-Induced Luminescence Imaging Methods for the Study of Ancient Polychromy. Herit Sci 2017, 5, 24. [Google Scholar] [CrossRef] [Green Version]
- Accorsi, G.; Verri, G.; Bolognesi, M.; Armaroli, N.; Clementi, C.; Miliani, C.; Romani, A. The Exceptional Near-Infrared Luminescence Properties of Cuprorivaite (Egyptian Blue). Chem. Commun. 2009, 23, 3392–3394. [Google Scholar] [CrossRef]
- Triolo, P.A.M.; Spingardi, M.; Costa, G.A.; Locardi, F. Practical Application of Visible-Induced Luminescence and Use of Parasitic IR Reflectance as Relative Spatial Reference in Egyptian Artifacts. Archaeol Anthr. Sci. 2019, 11, 5001–5008. [Google Scholar] [CrossRef]
- Burgio, L.; Clark, R.J.H. Library of FT-Raman Spectra of Pigments, Minerals, Pigment Media and Varnishes, and Supplement to Existing Library of Raman Spectra of Pigments with Visible Excitation. Spectrochim. Acta Part A 2001, 57, 1491–1521. [Google Scholar] [CrossRef]
- Chukanov, N.V. Infrared Spectra of Mineral Species, 3rd ed.; Springer: Berlin, Germany, 2014; pp. 14–1726. [Google Scholar]
- Chukanov, N.V.; Chervonnyi, A.D. Infrared Spectroscopy of Minerals and Related Compounds; Springer: Berlin, Germany, 2016. [Google Scholar]
- Ambers, J. Raman Analysis of Pigments from the Egyptian Old Kingdom. J. Raman Spectrosc. 2004, 35, 768–773. [Google Scholar] [CrossRef]
- Edreira, M.C.; Feliu, M.J.; Fernández-Lorenzo, C.; Martín, J. Spectroscopic Study of Egyptian Blue Mixed with Other Pigments. Helv. Chim. Acta 2003, 86, 29–49. [Google Scholar] [CrossRef]
- Darwish, S.S. Scientific investigation of the materials and techniques used in a 19th Century Egyptian cementery wall painting (Hawsh Al-Basha). Int. J. Conserv. Sci. 2013, 4, 145–152. [Google Scholar]
- Marey Mahmoud, H.H. Identification of Green Earth Pigments in Coptic Wall Paintings Using ESEM-EDX, FTIR Imaging and Visible Reflectance Spectroscopy. Estud. De Conserv. E Restauro 2014, 5, 68–76. [Google Scholar] [CrossRef]
- Cerrato, E.J.; Cosano, D.; Esquivel, D.; Jiménez-Sanchidrián, C.; Ruiz, J.R. Spectroscopic Analysis of Pigments in a Wall Painting from a High Roman Empire Building in Córdoba (Spain) and Identification of the Application Technique. Microchem. J. 2021, 168, 106444. [Google Scholar] [CrossRef]
- Andersen, F.A.; Brecevic, L. Infrared Spectra of Amorphous and Crystalline Calcium Carbonate. Acta Chem. Scand. 1991, 45, 1018–1024. [Google Scholar] [CrossRef]
- Genestar, C.; Pons, C. Earth Pigments in Painting: Characterisation and Differentiation by Means of FTIR Spectroscopy and SEM-EDS Microanalysis. Anal. Bioanal. Chem. 2005, 382, 269–274. [Google Scholar] [CrossRef] [PubMed]
- Helwig, K. The Characterisation of Iron Earth Pigments Using Infrared Spectroscopy, in Postprints of IRUG2; Pretzel, B., Ed.; Victoria & Albert Museum (V&A): London, UK, 1998; pp. 83–91. [Google Scholar]
- Mortimore, J.L.; Marshall, L.J.R.; Almond, M.J.; Hollins, P.; Matthews, W. Analysis of Red and Yellow Ochre Samples from Clearwell Caves and Çatalhöyük by Vibrational Spectroscopy and Other Techniques. Spectrochim. Acta A Mol. Biomol. Spectrosc. 2004, 60, 1179–1188. [Google Scholar] [CrossRef]
- Bikiaris, D.; Daniilia, S.; Sotiropoulou, S.; Katsimbiri, O.; Pavlidou, E.; Moutsatsou, A.; Chryssoulakis, Y. Ochre-Differentiation through Micro-Raman and Micro-FTIR Spectroscopies: Application on Wall Paintings at Meteora and Mount Athos, Greece. Spectrochim. Acta Part A 1999, 56, 3–18. [Google Scholar] [CrossRef]
- Feller, R.L. Artists’ Pigments, A Handbook of their History and Characteristics; National Gallery of Art: Washington, DC, USA, 2012; Volume 1. [Google Scholar]
- Ospitali, F.; Bersani, D.; di Lonardo, G.; Lottici, P.P. “Green Earths”: Vibrational and Elemental Characterization of Glauconites, Celadonites and Historical Pigments. J. Raman Spectrosc. 2008, 39, 1066–1073. [Google Scholar] [CrossRef]
- Vahur, S.; Teearu, A.; Peets, P.; Joosu, L.; Leito, I. ATR-FT-IR Spectral Collection of Conservation Materials in the Extended Region of 4000-80 Cm–1. Anal. Bioanal. Chem. 2016, 408, 3373–3379. [Google Scholar] [CrossRef]
- IRUG-Infrared Raman Users Group. Available online: http://www.irug.org (accessed on 12 January 2023).
- Vahur, S.; Teearu, A.; Leito, I. ATR-FT-IR Spectroscopy in the Region of 550-230 Cm-1 for Identification of Inorganic Pigments. Spectrochim. Acta A Mol. Biomol. Spectrosc. 2010, 75, 1061–1072. [Google Scholar] [CrossRef] [PubMed]
- Manfredda, N.; Buscaglia, P.; Gallo, P.; Borla, M.; Aicardi, S.; Poggi, G.; Baglioni, P.; Nervo, M.; Scalarone, D.; Borghi, A.; et al. An Ancient Egyptian Multilayered Polychrome Wooden Sculpture Belonging to the Museo Egizio of Torino: Characterization of Painting Materials and Design of Cleaning Processes by Means of Highly Retentive Hydrogels. Coatings 2021, 11, 1335. [Google Scholar] [CrossRef]
- Ramadan, S.; Mahgoub, G.; ElHagrassy, A.F.; Abdel-Aziz, M.S.; Mertah, E. Investigation and Characterization of Two Painted Limestone Stelae, Egyptian Museum, Cairo, Egypt. Egypt J. Chem. 2022, 65, 89–102. [Google Scholar] [CrossRef]
- Susanna, B.; Cantisani, E.; Conti, C.; Magrini, D.; Silvia, V.; Tomassini, P.; Marano, M. Enriching the Knowledge of Ostia Antica Painted Fragments: A Multi-Methodological Approach. Spectrochim. Acta A Mol. Biomol. Spectrosc. 2022, 265, 120260. [Google Scholar] [CrossRef]
- Verri, G. The Spatially Resolved Characterisation of Egyptian Blue, Han Blue and Han Purple by Photo-Induced Luminescence Digital Imaging. Anal. Bioanal. Chem. 2009, 394, 1011–1021. [Google Scholar] [CrossRef]
- Nodari, L.; Ricciardi, P. Non-Invasive Identification of Paint Binders in Illuminated Manuscripts by ER-FTIR Spectroscopy: A Systematic Study of the Influence of Different Pigments on the Binders’ Characteristic Spectral Features. Herit. Sci. 2019, 7, 7. [Google Scholar] [CrossRef]
- Bruni, S.; Guglielmi, V. Identification of Archaeological Triterpenic Resins by the Non-Separative Techniques FTIR and 13C NMR: The Case of Pistacia Resin (Mastic) in Comparison with Frankincense. Spectrochim. Acta A Mol. Biomol. Spectrosc. 2014, 121, 613–622. [Google Scholar] [CrossRef] [PubMed]
- Invernizzi, C.; Rovetta, T.; Licchelli, M.; Malagodi, M. Mid and Near-Infrared Reflection Spectral Database of Natural Organic Materials in the Cultural Heritage Field. Int. J. Anal. Chem. 2018, 2018, 7823248. [Google Scholar] [CrossRef]
- Scott, D.A.; Warmlander, S.; Mazurek, J.; Quirke, S. Examination of Some Pigments, Grounds and Media from Egyptian Cartonnage Fragments in the Petrie Museum, University College London. J. Archaeol. Sci. 2009, 36, 923–932. [Google Scholar] [CrossRef]
- Scott, D.A.; Dodd, L.S.; Furihata, J.; Tanimoto, S.; Keeney, J.; Schilling, M.R.; Cowan, E. An Ancient Egyptian Cartonnage Broad Collar: Technical Examination of Pigments and Binding Media. Stud. Conserv. 2004, 49, 177. [Google Scholar] [CrossRef]
- Nicola, M.; Seymour, L.M.; Aceto, M.; Priola, E.; Gobetto, R.; Masic, A. Late Production of Egyptian Blue: Synthesis from Brass and Its Characteristics. Archaeol. Anthr. Sci. 2019, 11, 5377–5392. [Google Scholar] [CrossRef]
- Orna, M.V.; Low, M.J.D.; Baer, N.S. Synthetic Blue Pigments: Ninth to Sixteenth Centuries. I. Literature. Stud. Conserv. 1980, 25, 53–63. [Google Scholar]


| Sample | Colour | Length | Description |
|---|---|---|---|
| 1 | blue | 0.5 cm | white layer underneath the paint layer; inhomogeneous pigment colour. |
| 2 | red | 0.3 cm | white layer underneath the paint layer; homogeneous pigment colour. |
| 3 | green | 0.4 cm | inhomogeneous pigment colour. |
| 4 | white | 0.4 cm | unique white fragment with homogeneous colour. |
| 5 | black | 0.4 cm | white layer underneath the paint layer; slight dark blue hues. |
| 6 | light blue | 0.2 cm | white layer underneath the paint layer; distinct single grains. |
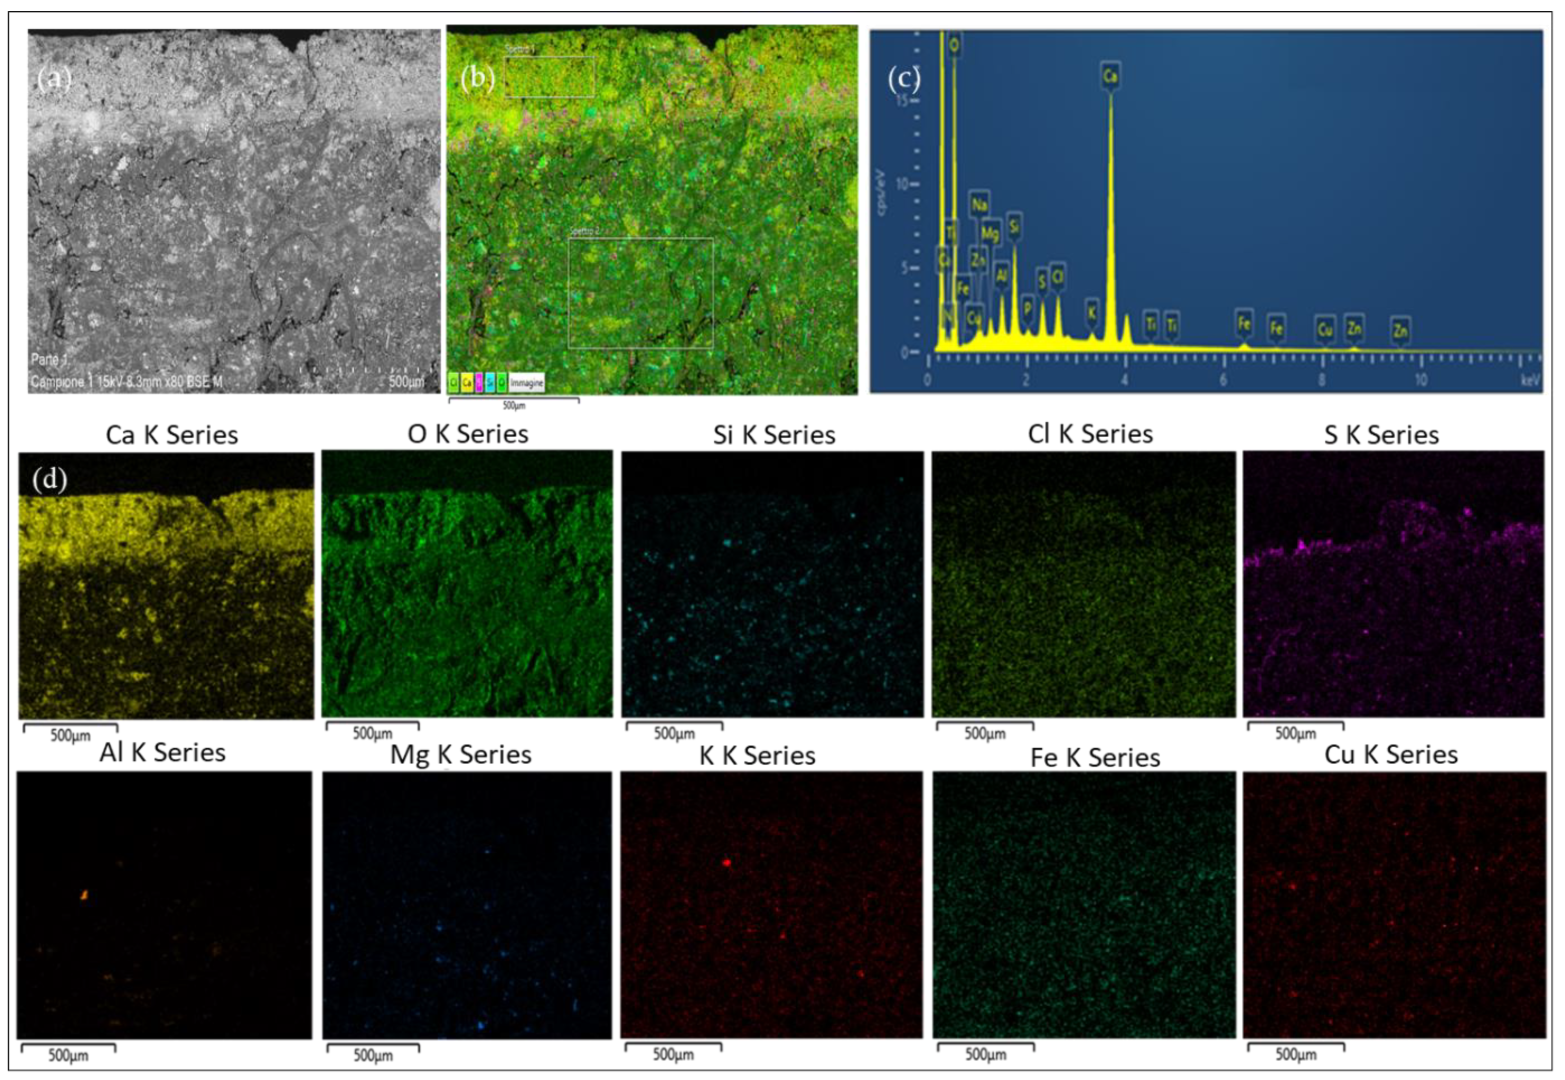
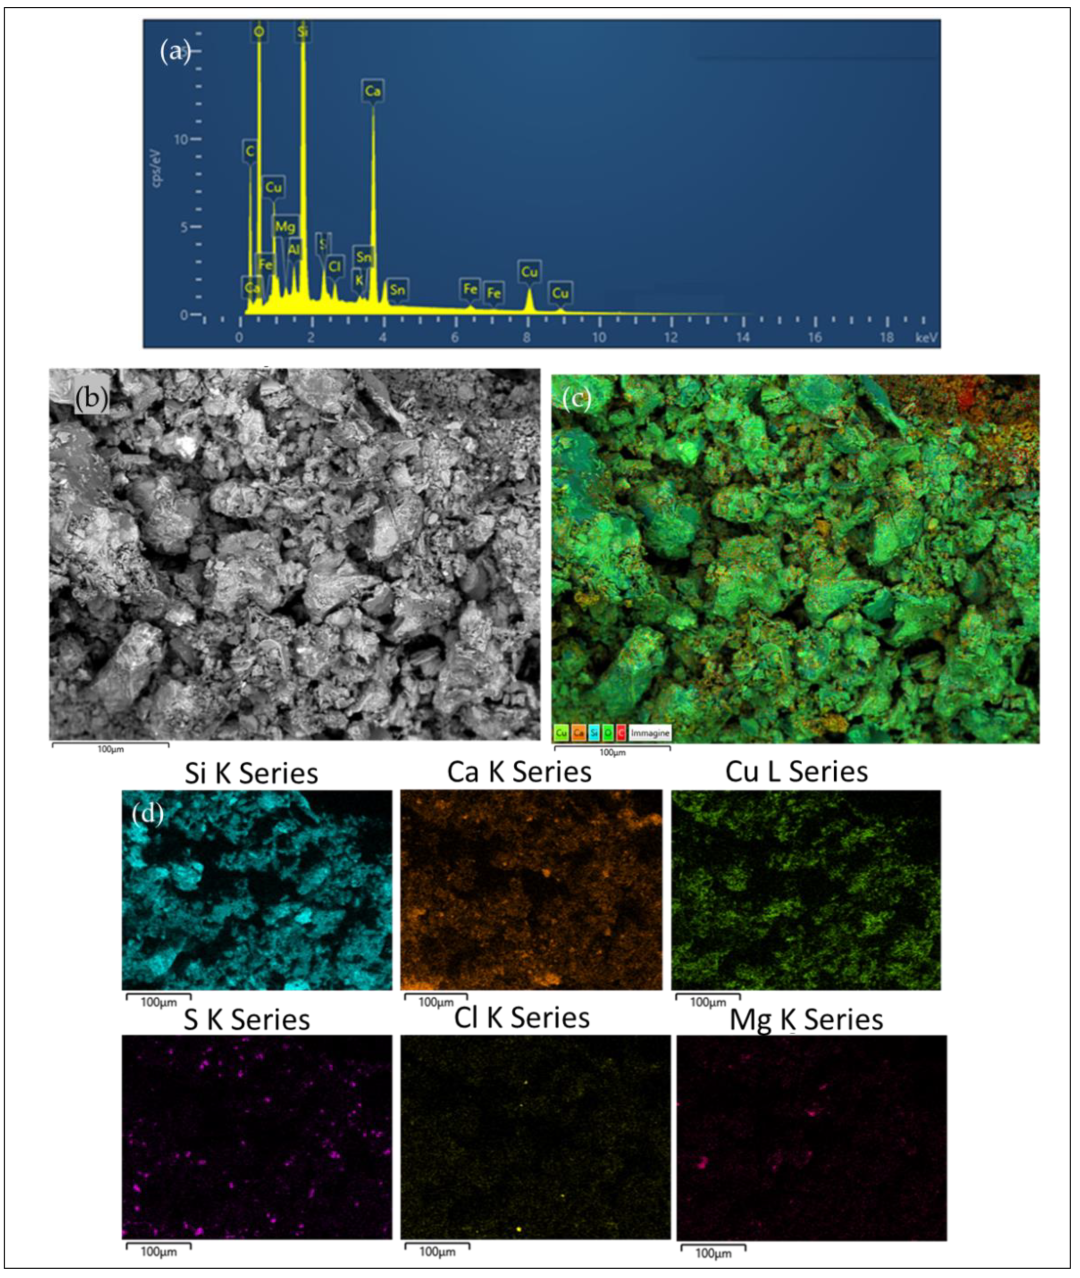
| Sample | Colour | Al | Ca | Cl | Cu | Fe | K | Mg | Na | S | Si |
|---|---|---|---|---|---|---|---|---|---|---|---|
| 1 | blue | 1.61 | 62.62 | 9.54 | 4.15 | 4.67 | 1.9 | 1.01 | 3.75 | 4.67 | 6.28 |
| 2 | red | 1.23 | 82.68 | 1.58 | - | 5.78 | 1.14 | 0.65 | - | 2.17 | 4.76 |
| 3 | green | 1.46 | 64.26 | 9.25 | 0.57 | 10.30 | 1.86 | 1.06 | - | 5.75 | 5.48 |
| 4 | white | 0.62 | 89.30 | 4.78 | - | - | 1.32 | 0.55 | - | 0.82 | 2.61 |
| 5 | black | 4.58 | 43.48 | 4.20 | 6.50 | 6.81 | 3.92 | 1.04 | 2.37 | 6.22 | 20.89 |
| 6 | light blue | 0.59 | 66.89 | 4.76 | 3.48 | 2.80 | 0.67 | - | 0.71 | 4.49 | 15.62 |
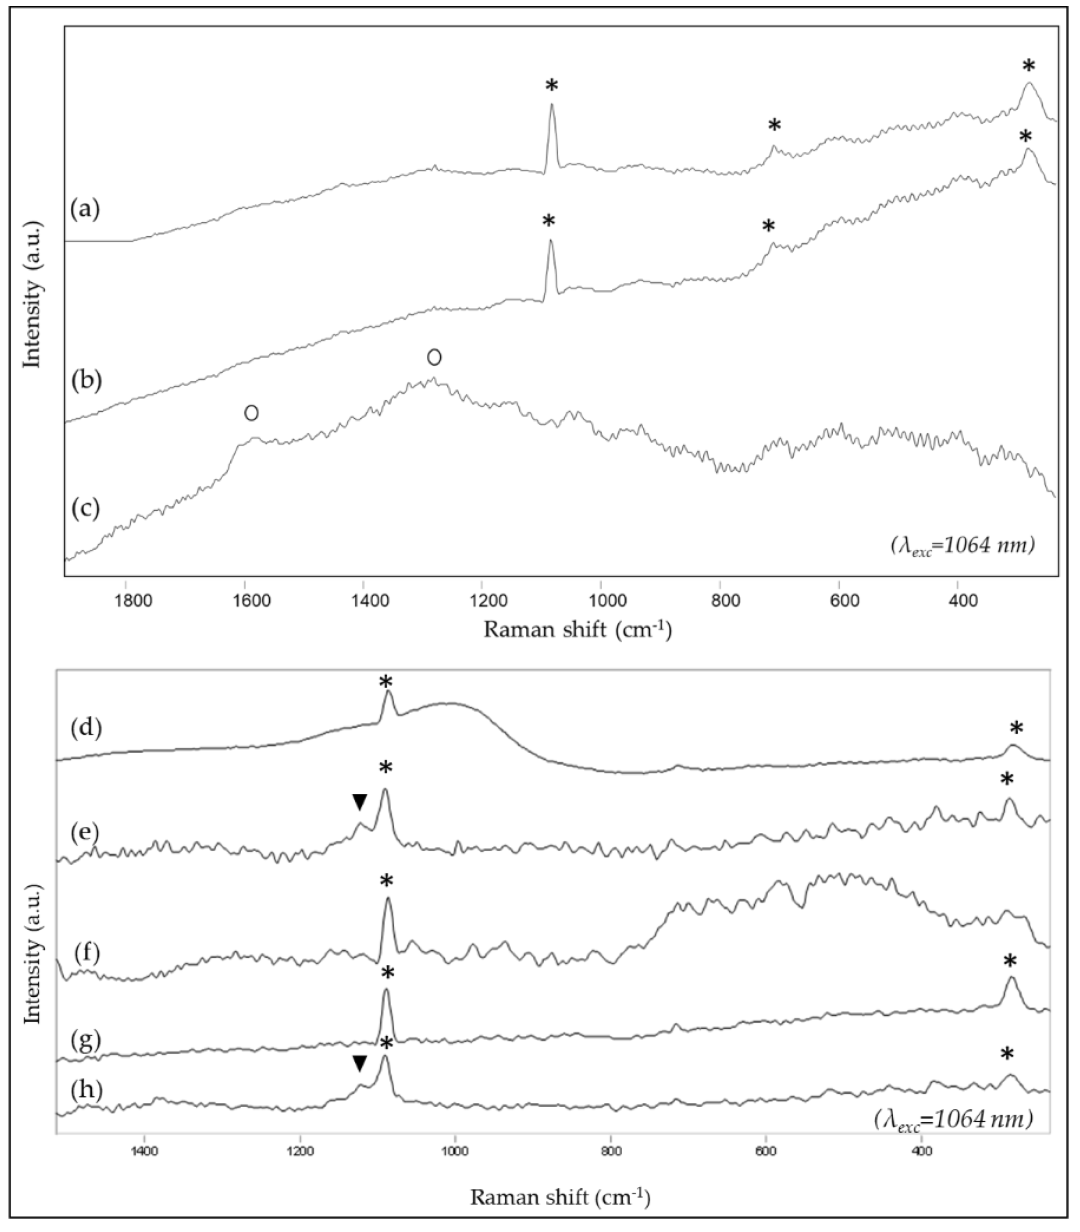
| Sample | Colour | SEM-EDXS (Elements) | ATR-FTIR Peaks (cm−1) | Raman Peaks (cm−1) | VIL |
|---|---|---|---|---|---|
| 1 | blue | Ca, Si, Cl, S, Fe, Cu, Na, Al, K, Mg | organic material 3295, 2920, 2849, 1627, 1538, 1242 | calcite 1085, 288 |  |
| calcite 1410, 872, 711 | huntite 1120 | ||||
| silicate 1032 | |||||
| 2 | red | Ca, Fe, Si, S, Mg, Cl, Al, K | organic material 2923, 2851, 1798 | calcite 1085, 711, 288 | |
| calcite 1395, 871, 712 | |||||
| silicate 1089, 1033 | |||||
| red ochre 530, 470 | |||||
| 3 | green | Ca, Fe, Si, S, Cl, Al, K, Mg, Cu | organic material 2917 | calcite 1087, 282 | |
| calcite 1410, 872, 713 | |||||
| green earth 3538, 1645, 1107, 1027, 792, 469 | |||||
| 4 | white | Ca, Si, Cl, S, K, Al, Mg | organic material 2932, 1727 | calcite 1087, 714, 284 | |
| calcite 1404, 871, 712 | |||||
| silicate 1035 | |||||
| 5 | black | Ca, Si, S, Fe, Al, Cu, K, Cl, Na, Mg | calcite 1427, 874, 712 | carbon black 1580, 1300 | |
| 6 | light blue | Ca, Si, S, Fe, Cl, Cu, Na, K, Al | calcite 1406, 872, 712, | calcite 1088, 282 | |
| Egyptian blue 1159, 1049, 1004, 754, 662, 595, 563, 519 | huntite 1119 |
| Sample | Colour | SEM-EDXS | ATR-FTIR | Raman | VIL | Composition |
|---|---|---|---|---|---|---|
| 1 | blue | Cu-based pigment | calcite, silicates, organic | calcite, huntite | Egyptian bue | Egyptian blue + organic binder |
| 2 | red | Fe-based pigment | calcite, silicates, red ochre, organic | calcite | - | red ochre + organic binder |
| 3 | green | Fe-based pigment | calcite, green earth, organic | calcite | - | green earth + organic binder |
| 4 | white | Ca-based pigment | calcite, silicates, organic | calcite | - | calcite + organic binder |
| 5 | black | - | calcite | carbon black | Egyptian bue | carbon black+ Egyptian blue + organic binder |
| 6 | light blue | Cu-based pigment | calcite, Egyptian blue | calcite, huntite | Egyptian bue | Egyptian blue + organic binder |
Disclaimer/Publisher’s Note: The statements, opinions and data contained in all publications are solely those of the individual author(s) and contributor(s) and not of MDPI and/or the editor(s). MDPI and/or the editor(s) disclaim responsibility for any injury to people or property resulting from any ideas, methods, instructions or products referred to in the content. |
© 2023 by the authors. Licensee MDPI, Basel, Switzerland. This article is an open access article distributed under the terms and conditions of the Creative Commons Attribution (CC BY) license (https://creativecommons.org/licenses/by/4.0/).
Share and Cite
Lombardi, C.A.; Comite, V.; Fermo, P.; Bergomi, A.; Trombino, L.; Guglielmi, V. A Multi-Analytical Approach for the Characterisation of Pigments from an Egyptian Sarcophagus Cover of the Late Dynastic Period: A Case Study. Sustainability 2023, 15, 2002. https://doi.org/10.3390/su15032002
Lombardi CA, Comite V, Fermo P, Bergomi A, Trombino L, Guglielmi V. A Multi-Analytical Approach for the Characterisation of Pigments from an Egyptian Sarcophagus Cover of the Late Dynastic Period: A Case Study. Sustainability. 2023; 15(3):2002. https://doi.org/10.3390/su15032002
Chicago/Turabian StyleLombardi, Chiara Andrea, Valeria Comite, Paola Fermo, Andrea Bergomi, Luca Trombino, and Vittoria Guglielmi. 2023. "A Multi-Analytical Approach for the Characterisation of Pigments from an Egyptian Sarcophagus Cover of the Late Dynastic Period: A Case Study" Sustainability 15, no. 3: 2002. https://doi.org/10.3390/su15032002
APA StyleLombardi, C. A., Comite, V., Fermo, P., Bergomi, A., Trombino, L., & Guglielmi, V. (2023). A Multi-Analytical Approach for the Characterisation of Pigments from an Egyptian Sarcophagus Cover of the Late Dynastic Period: A Case Study. Sustainability, 15(3), 2002. https://doi.org/10.3390/su15032002