Article

Spatial–Temporal Evolution of Socio-Ecological System Vulnerability on the Loess Plateau under Rapid Urbanization

1
College of Geography and Environmental Science, Northwest Normal University, Lanzhou 730070, China
2
College of Economics, Northwest Normal University, Lanzhou 730070, China
*
Author to whom correspondence should be addressed.
Sustainability 2023, 15(3), 2059; https://doi.org/10.3390/su15032059
Submission received: 17 November 2022 / Revised: 6 January 2023 / Accepted: 18 January 2023 / Published: 21 January 2023

Abstract

:
Rapid urbanization, as a powerful engine supporting sustainable and healthy economic development, is an important force influencing the transformation of the socio–ecological system (SES). Assessing the spatial–temporal evolution of the SES’s vulnerability under rapid urbanization is an important contribution to promoting regional sustainable development. Therefore, this study took the Loess Plateau as a case area, and, on the basis of constructing the SES’s vulnerability evaluation index system, applied the integrated index method to analyze the spatial–temporal evolution of the SES’s vulnerability of the Loess Plateau from 2000 to 2020 with the help of ArcGIS and Origin software and used the dominant factor method to identify the dominant factors affecting high-vulnerability areas. The results show that: (1) the SES’s vulnerability of the Loess Plateau fluctuated and decreased. The overall distribution pattern was “high in the north/south, low in the middle”. (2) The SES’s exposure, sensitivity, and adaptability were all on the rise. Exposure and adaptability showed a distribution pattern of “high in the northwest and southeast, low in the southwest”, while sensitivity was “high in the north/south, low in the east”. (3) The dominant factors affecting high-vulnerability areas included exposure-dominant, sensitivity-dominant, exposure-sensitive-dominant, exposure-adaptation-dominant, sensitivity-adaptation-dominant, and strong-vulnerable-dominant types. Except for strong-vulnerable-dominant and exposure-dominant, the number of all other types of counties fluctuated upward. Finally, It was proposed policy recommendations to reduce vulnerability in high-vulnerability areas.

1. Introduction

Urbanization, as a powerful engine for sustainable and healthy economic development and an important force for structural change in the economy [1,2], is one of the most powerful human activities affecting socio-ecological system (SES) [3,4,5]. While urbanization has facilitated global material exchange, energy flow, and information transfer, it has also brought about problems such as excessive spatial expansion, irrational spatial structure, and uneven resource distribution [6,7], which have severely challenged the self-development capacity and adaptability of the SES and exacerbated the instability and vulnerability of regional development. How to reduce regional SES vulnerability and promote regional sustainable development is not only a core topic of Future Earth (2014–2023) but also an important concern of sustainability science [8,9]. Currently, developing countries have become an important engine to promote global urbanization [10]. China, as one of the fastest urbanizing developing countries, has particularly undergone rapid economic and social development and achieved improvement in urban and rural residents’ lives with the support of policies such as population migration, industrial agglomeration, and land expansion [11]. However, under the long-term orientation of pursuing a high growth rate of urbanization, problems such as weak agricultural competitiveness, a widening urban–rural development gap, lagging citizenship process, sloppy and inefficient construction land, and negative effects on resources and environment have emerged [12,13]. At the same time, the massive influx of the rural population into cities has generated higher demands on infrastructure, public services, and ecological space, which significantly impacts the original socio-ecological structure and functions. Therefore, studying the vulnerability of the SES in the context of rapid urbanization is not only an urgent need for high-quality regional development, ecological environmental protection, and enhancement of human well-being but also an objective requirement for sustainable regional development.
The SES is a dynamic, open, and complex mega-system consisting of two interlocking subsystems, the geographic environment and human activities [9,14], and understanding the complex dynamics of their internal interactions is essential to support human well-being and sustainable management of resources. Vulnerability, as a key attribute of the interaction between a system and its environment [15,16], refers to the degree to which an exposed unit is susceptible to damage from disturbances or stresses due to its own sensitivity and the ability of the exposed unit to handle, cope with, and adapt to these disturbances or stresses [16] and has now become a topical issue of interest and an important analytical tool in the field of sustainability science [16,17,18]. Early vulnerability studies originated from natural hazards [17], which emphasized natural attributes such as frequency and intensity of natural hazards or environmental shocks and disaster losses but neglected the impact of social structures and human activities on vulnerability [19]. Since the 1990s, scholars have gradually found that social factors play a key role in the vulnerability generated by natural hazards and their causes, and, based on this, they have further integrated the study of risk, the political economy of resources, disaster management, and government intervention, covering different disciplinary fields, such as disaster science, geography, economics, political science, and sociology [17]. The object of study has also gradually shifted from a single system to an SES with human–land relations at its core [16,20]. The research focuses on the conceptual framework of the SES’s vulnerability [21,22,23], scenario analysis [24], SES’s vulnerability assessment and spatial–temporal evolution [23,25,26,27,28,29,30,31], SES’s vulnerability impact mechanisms, and governance policies [28,30,32], and the study area includes typical areas, such as poor tourist areas, semi-arid regions, and resource-based cities [30,32,33]. For example, Grigorescu et al. studied the socio-environmental vulnerability to heat-related phenomena in the Bucharest metropolitan area [34]; Gupta et al. assessed the socio-environmental vulnerability to climate change in different elevations of the Indian Himalayas [26]. In general, most studies have focused on disturbance of a SES by natural factors, such as natural disasters, ecological problems, and climate change, but fewer studies have been conducted on vulnerability of a SES disturbed by man-made hazards, especially regarding the impact of rapid urbanization on the SES’s vulnerability, and optimal management measures are lacking to promote healthy development of the SES from the perspective of urbanization.
Loess Plateau, as one of the four major plateaus in China, is not only a typical ecologically sensitive and fragile area and one of the most serious areas of soil erosion but also a major grain-producing area and an important economic zone in China, undertaking the main task of implementing the ecological protection and high-quality development strategy of the Yellow River Basin, shouldering the special mission of guarding the national ecological security barrier and an important channel of the Silk Road Economic Belt. Under coercion of rapid urbanization, the spatial pattern and functional elements of the Loess Plateau have changed dramatically, and various resource and environmental problems and unbalanced and insufficient development are particularly prominent, which not only threaten the ecological security of the region but also cause the sustainable development of the entire Loess Plateau to suffer severe challenges. There is an urgent need to assess the vulnerability of the SES on the Loess Plateau under rapid urbanization and to reveal its dominant factors. Current studies on the vulnerability of the SES on the Loess Plateau have focused more on disturbance of natural factors, such as natural disasters and climate change, and few studies have analyzed the vulnerability of the SES regarding human factors, such as urbanization. Because of this, this study constructed a framework for assessing the vulnerability of the SES under rapid urbanization, analyzed the spatial–temporal evolution of the vulnerability of the SES on the Loess Plateau from 2000 to 2020, revealed its dominant factors, and proposed differentiated coping strategies, aiming to provide a reference for effectively formulating SES regulation policies on the Loess Plateau, as well as serving as a case reference and providing practical insights for regional sustainable development in the context of global urbanization.

2. Study Area and Data Sources

2.1. Study Area

The Loess Plateau is located in the central north of China, including Shanxi, Shaanxi, Henan, Inner Mongolia, Ningxia, Gansu, and Qinghai, a total of 7 provinces, 45 cities, and 341 counties (Figure 1), and total land area of 650,000 km2 [35]. The topography is high in the northwest and low in the southeast, with an elevation of 19–5206 m [35]. The area has a semi-humid and semi-arid climate [36], with an average annual temperature of 4–12 °C [35] and an average annual evaporation of 1400–2000 mm [37]. Precipitation decreases from southeast to northwest, with an average annual precipitation of 300–800 mm [38], with concentrated heavy rainfall and severe soil erosion, making it a key area for comprehensive soil and water conservation management in China [35,36,37,38].
Since implementation of the development of the western region in China in 2000, the spatial scale and the number of towns on the Loess Plateau have expanded rapidly, and the radiation-driving capacity of the central towns has gradually increased, effectively supporting the sustained growth of the regional economy and initially forming the Lanzhou–Xining urban agglomeration, the Ningxia urban agglomeration along the Yellow River, the Guanzhong Plain urban agglomeration, the Hohhot–Baotou–Ordos–Yulin urban agglomeration, the Jinzhong urban agglomeration, and the Zhongyuan urban agglomeration. From 2000 to 2020, the area of urban construction land on the Loess Plateau increased from 16,000 km2 to 28,000 km2, with an average annual growth rate of 2.96%, slightly higher than the national average growth rate during the same period; 48% of the construction land comes from arable land and grassland (http://www.resdc.cn/ accessed on 15 August 2022). High-intensity urban construction land expansion and sprawl have led to a series of land-use cover changes and human–land conflict problems, resulting in a significant increase in non-agricultural vegetation cover and building land and a dramatic decrease in surrounding ecological land [39,40], with profound impacts on the SES.

2.2. Data Sources

For vulnerability assessment at larger scales, unified use of administrative areas as spatial study units has the advantage of combining research results with management systems. In contrast, counties are the smallest administrative units in China, with more complete statistical data and information of all kinds, and taking counties as the study unit is conducive to collection of more informative data. Therefore, this paper takes the Loess Plateau as the study area and 341 counties as the study units. The study data include two parts: spatial data and attribute data. Among them, the spatial data include land use data (2000–2020) and normalized vegetation index data (NDVI) (2000–2020) from the Resource and Environment Science and Data Center of the Chinese Academy of Sciences (http://www.resdc.cn). The attribute data include socio-economic data and ecological environment data, mainly from the Chinese County Construction Statistical Yearbook (2000–2020), Chinese County Statistical Yearbook (2000–2020), Chinese City Construction Statistical Yearbook (2000-2020), as well as the statistical bureaus and statistical bulletins (2000–2020) of each district and county. Among them, the minimal missing data, such as the net income per urban resident in some counties of Qinghai Province and Ningxia Hui Autonomous Region in 2000 and 2005, and the gross output value of primary industry in counties of Qinghai Province in 2000, were completed by interpolation.

3. Methods

3.1. Evaluation Index System of the SES’s Vulnerability

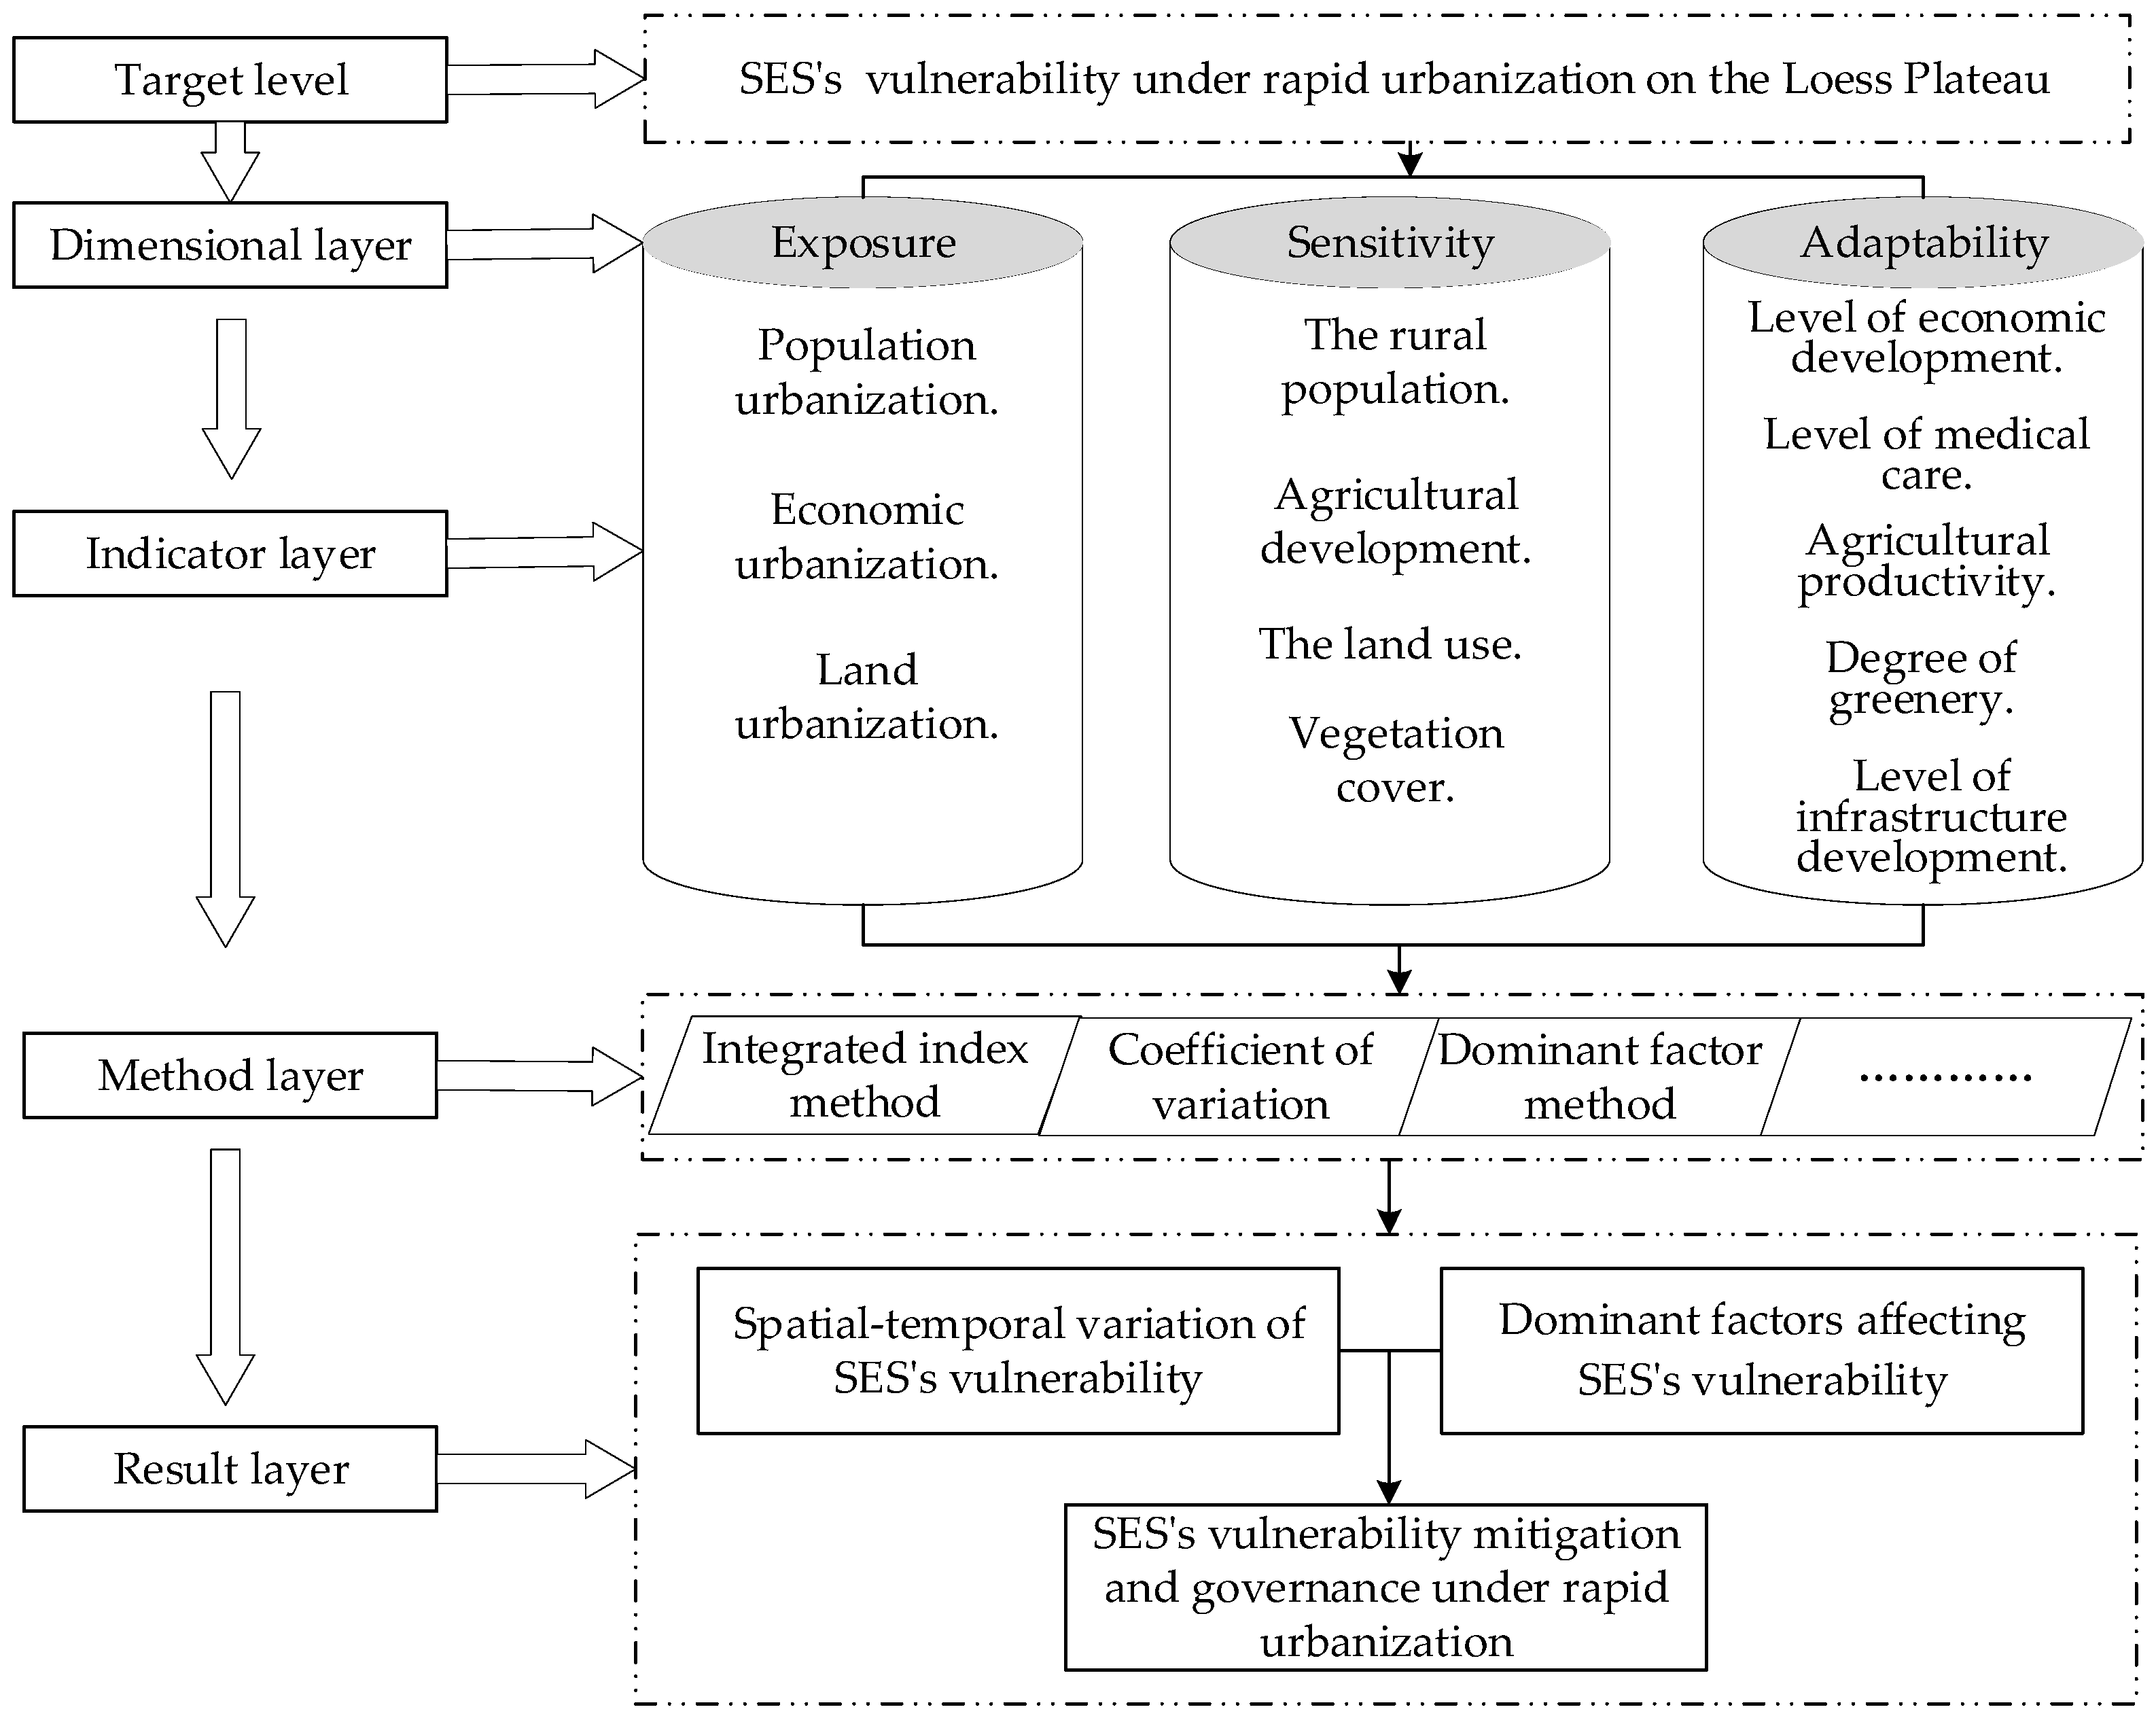
The vulnerability of the SES in the context of rapid urbanization refers to the state of negative impact or damage to urban SES exposed to continuous urban expansion due to sensitivity characteristics and lack of adaptive capacity to the rapidly urbanizing environment, and it is a function of exposure, sensitivity, and adaptive capacity. This study followed the principles of scientificity, dominance, systematicity, and operability, combined the connotation of the SES’s vulnerability with the actual situation of the SES on the Loess Plateau, and constructed a framework for assessing SES’s vulnerability on the Loess Plateau based on exposure–sensitivity–adaptability (Figure 2) and an evaluation index system (Table 1). The framework for analyzing SES’s vulnerability on the Loess Plateau under rapid urbanization adopts a layer-by-layer progression and refinement of target layer–dimensional layer–indicator layer–method layer–result layer [41,42]. Helps to systematically guide the entire process from selection of indicators to application of results. The framework explicitly defines system vulnerability as three dimensions of exposure, sensitivity, and adaptive capacity. Among them, exposure and sensitivity have a positive effect on SES’s vulnerability, while adaptive capacity has an offsetting effect on SES’s vulnerability. The composition and meaning of each dimensional indicator are as follows:
Exposure refers to the degree of disturbance or stress of the SES by rapid urbanization, which can be represented by the level of urbanization development. Rapid urbanization is manifested by the increase in urban population size, transformation of non-agricultural economic structure, and the outward expansion of urban land, including population urbanization, economic urbanization, and land urbanization [43]. Therefore, the urban population number, industrial output per capita, and share of construction land area were selected, respectively, to represent population urbanization, economic urbanization, and land urbanization [44,45,46,47] so as to reflect the SES’s exposure to rapid urbanization. In general, the larger the urban population, industrial output per capita, and share of construction land area, the stronger the stress of rapid urbanization on the Loess Plateau’s SES.
Sensitivity refers to the degree of positive or negative changes in the SES under the stress of rapid urbanization, which can be represented by the factors that have the strongest response to rapid urbanization. Regions with significant rurality characteristics respond more strongly to urbanization intervention and have a higher degree of sensitivity, while regions with relatively prominent urban characteristics have a certain absorption capacity to urbanization interference, and the corresponding sensitivity is weak [48,49]. Therefore, the proportion of rural population, gross output value of primary industry, and arable land per capita are selected to characterize rurality characteristics to reflect socioeconomic sensitivity [48,49]. In addition, rapid urbanization will lead to changes in the regional ecological environment and landscape patterns, especially areas with low vegetation cover are more sensitive to rapid urbanization, so the normalized difference vegetation index (NDVI) is used to characterize its ecological sensitivity [50].
Adaptive capacity is the SES’s ability to cope with and adapt to the adverse effects of rapid urbanization. In general, the more adaptive the SES is, the easier it is to adjust and adapt quickly from risky perturbations. This paper quantifies the SES’s adaptive capacity from the perspective of socioeconomic and ecological dimensions. Among them, in terms of social economy, gross regional product per capita, net income per urban resident, number of medical beds per 10,000 people, road area per capita, and food production per capita are quantified [21,23,29,51]. The ecological aspect is represented by the share of environmental expenditures in regional GDP and the area of green space per capita [5,52]. Usually, the higher level of regional economic development, the increase in food production, public services, and the improvement of infrastructure will enhance the adaptive capacity of the SES to a certain extent, thus increasing the sustainability of the system’s future development.
The multiple covariance test revealed that the tolerance was greater than 0.1 and the VIF was less than 10, and passed the significance test, indicating that there was no strong correlation between the indicators.

3.2. Evaluation Methods for SES’s Vulnerability

(1)
Data standardization. First, in order to eliminate the influence caused by the different magnitudes of indicators, the indicators are standardized by using the extreme difference standardization. The standardization formula of positive term indicators is:
X i j = x i j x min x max x min
The formula for normalizing the negative term indicators is:
X i j = x max x i j x max x min
where: Xij is the standardized value of index j of year i; xij is the original value of index j of year i; xmin and xmax are the minimum and maximum values of the original value of index j of year i, respectively.
(2)
Evaluation index assignment. The entropy weight method can overcome the problem of randomness and speculation that cannot be avoided by the subjective assignment method, can also effectively solve the problem of overlapping information among multiple indicator variables, and can deeply reflect the utility value of the entropy value of indicator information, which has strong objectivity and is widely used in social economy and other research fields [51]. Therefore, this study adopted entropy weight method for index assignment, and its evaluation idea is that, the greater the difference between the values of evaluation objects in a certain index, the more important the object is, and the greater the weight value. The specific formula is as follows:
Proportion of indicator j of year i:
Y i j = X i j / i = 1 m X i j
Indicator information entropy:
e j = k i = 1 m ( Y i j × ln Y i j ) , k = 1 ln m , 0 e 1
Information entropy redundancy:
d j = 1 e j
Indicator weights:
w j = d j / j = 1 n d j
where: m is the number of evaluation years; n is the number of indicators.
(3)
Integrated index method. Combining the index weights and standardized values, the exposure, sensitivity, and adaptive capacity of the SES of each study unit were calculated separately using the weighted summation method, and then the vulnerability index was calculated. The specific formula is as follows:
E i = j n w j × X i j , B i = j n w j × X i j , A i = j n w j × X i j
where: n is the number of indicators. Ei, Bi, Ai are the combined SES’s exposure, sensitivity, and adaptive capacity indices for year i, respectively.
V i = E i + B i - A i
where: Vi denotes the SES’s vulnerability index of year i; Ei, Bi, and Ai are the exposure, sensitivity, and adaptive capacity indices of the SES of year i, respectively.

3.3. Classification of the SES’s Vulnerability

The magnitude of the SES’s exposure index Ei, SES’s sensitivity index Bi, and SES’s adaptive capacity index Ai were classified into 3 levels: low-value areas, medium-value areas, and high-value areas using the quantile method. Moreover, the SES’s vulnerability index Vi was classified into 3 levels using the quantile method: low-vulnerability areas, medium-vulnerability areas, and high-vulnerability areas.

3.4. Dominant Factor Method

With the continuous evolution of human–Earth relations, the interaction between the components of the SES has become more complex and variable, resulting in different intensities of the three vulnerability factors of SES exposure, sensitivity, and adaptive capacity. The dominant factor method can determine the main factors influencing the changes in vulnerability based on the differences in the strengths of SES exposure, sensitivity, and adaptive capacity [50]. Therefore, in this paper, the dominant factor method is used to identify the dominant factors in the high-vulnerability areas. To eliminate the influence of extreme values, the median was used as a judgment basis to identify the dominant elements of the SES’s vulnerability. The specific formula is as follows:
M E i = E i M E e
M B i = B i M B e
M A i = A i M A e
where: Ei, Bi, Ai denote the values of the SES’s exposure, sensitivity, and adaptive capacity of year i, respectively; MEe, MBe, MAe denote the median of the SES’s exposure, sensitivity, and adaptive capacity of year i, respectively.
The specific judgment methods are as follows: (i) If MEi > 0, exposure is the dominant element of its vulnerability; if MEi ≤ 0, exposure is the auxiliary element of its vulnerability. (ii) If MBi > 0, then sensitivity is the dominant element of its vulnerability; if MBi ≤ 0, then sensitivity is the auxiliary element of its vulnerability. (iii) If MAi < 0, adaptability is the dominant element of its vulnerability; if MAi ≥ 0, adaptability is the auxiliary element of its vulnerability.
If the number of dominant elements is 0, it is defined as weak-vulnerability-dominant; if the number of dominant elements is 1, it is defined as exposure-dominant, sensitivity-dominant, and adaptability-dominant, respectively, according to the type of dominant elements; if the number of dominant elements is 2, it is defined as exposure-sensitive-dominant, exposure-adaptation-dominant, and sensitivity-adaptation-dominant, respectively, according to the type of dominant elements; if the number of dominant elements is 3, then it is defined as strong-vulnerable-dominant type.

4. Results

4.1. Spatial–Temporal Variation in the SES’s Vulnerability

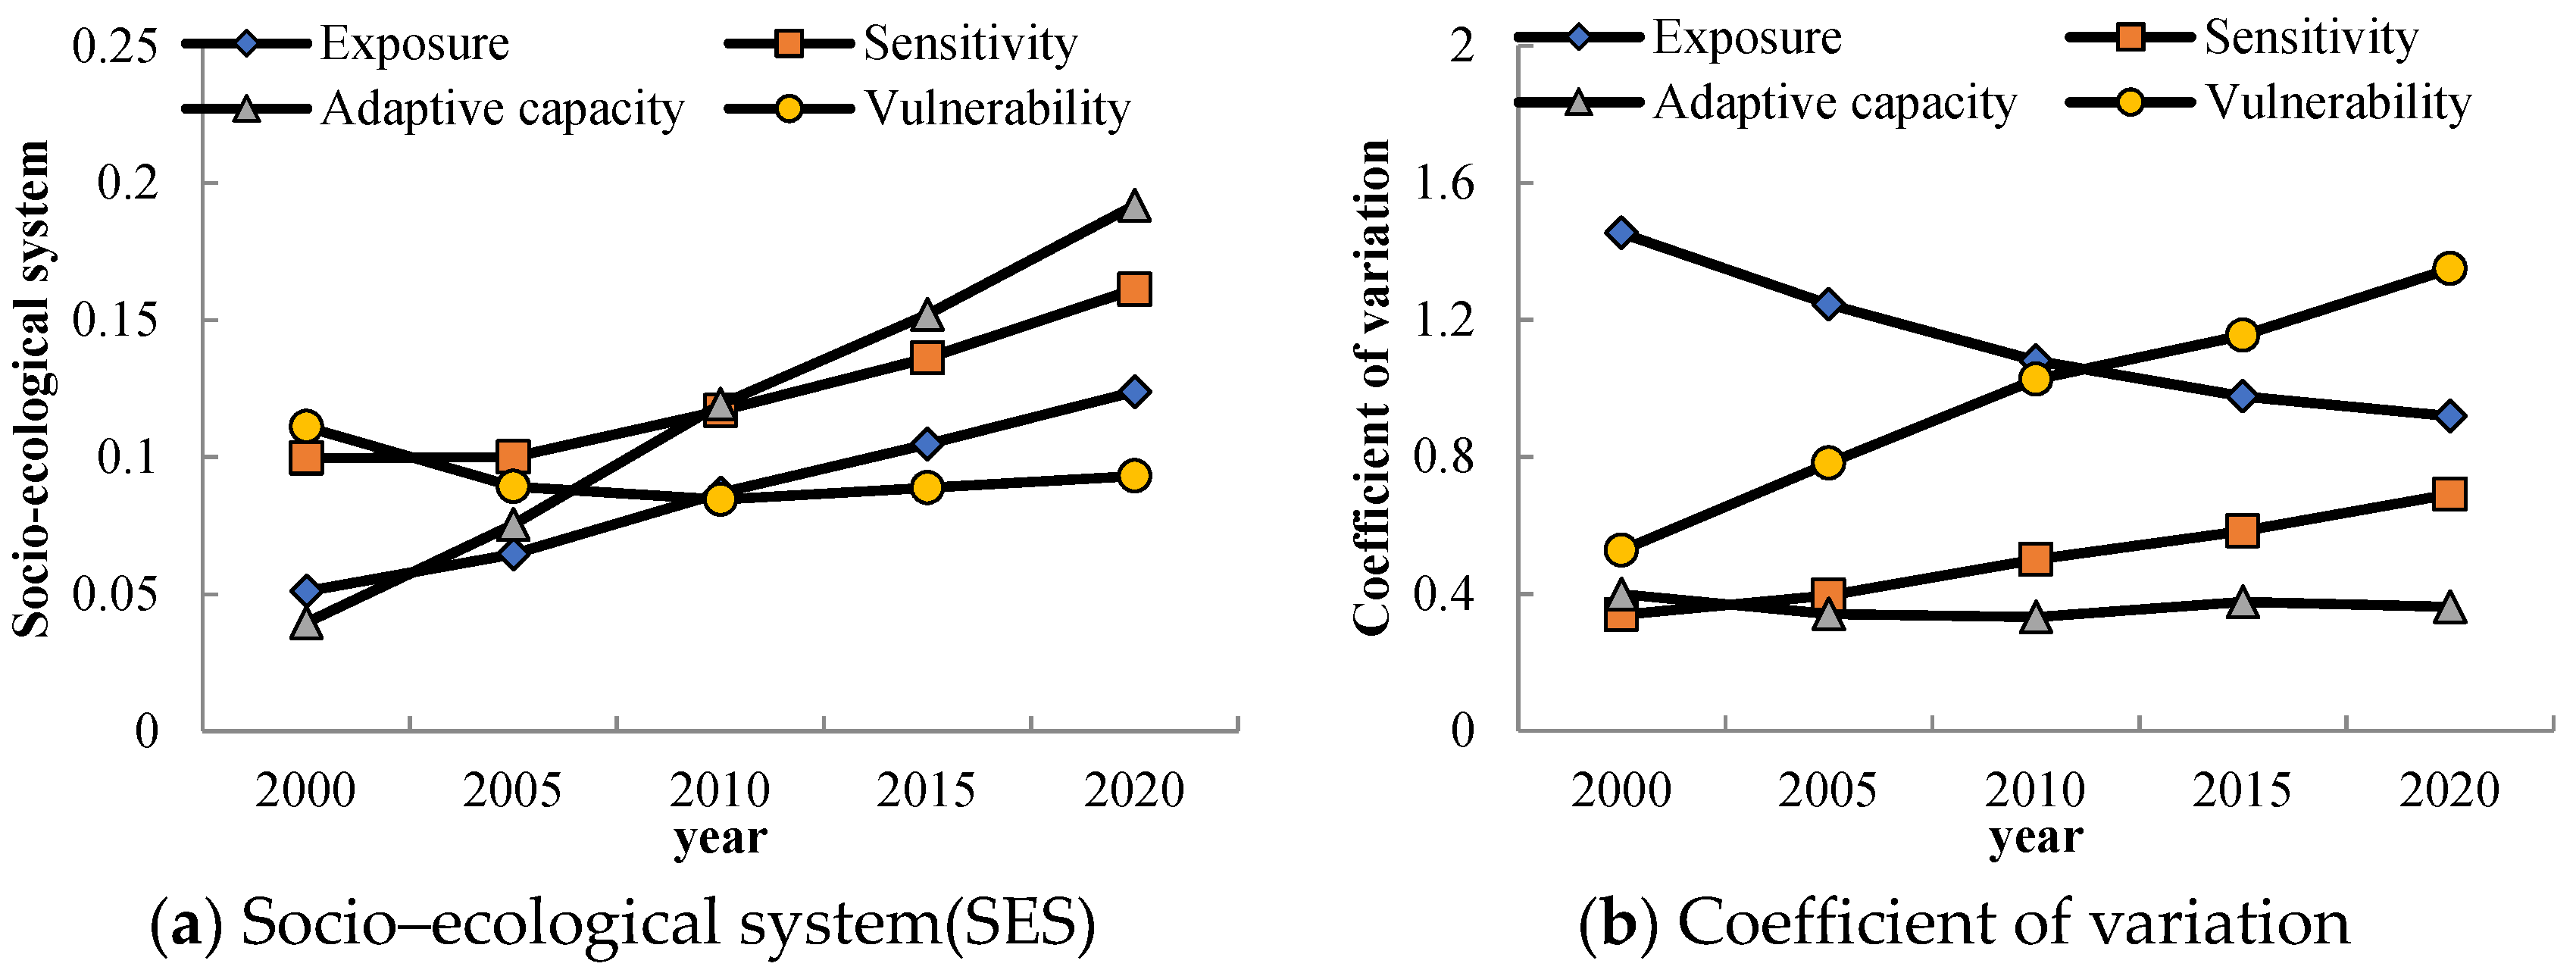
From 2000 to 2020, the SES’s vulnerability of the Loess Plateau showed a fluctuating decreasing trend of “decline followed by growth” (Figure 3a), from 0.11 to 0.09, a decrease of 18.18%. Indeed, the SES’s vulnerability showed a slow decreasing trend from 2000 to 2010, from 0.11 to 0.08, a decrease of 27.27%, while it showed an increasing trend from 2010 to 2020, from 0.08 to 0.09, an increase of 12.5%. From the coefficient of variation (Figure 3b), regional differences in SES’s vulnerability on the Loess Plateau increased significantly, from 0.53 to 1.35, an increase of up to 155%.
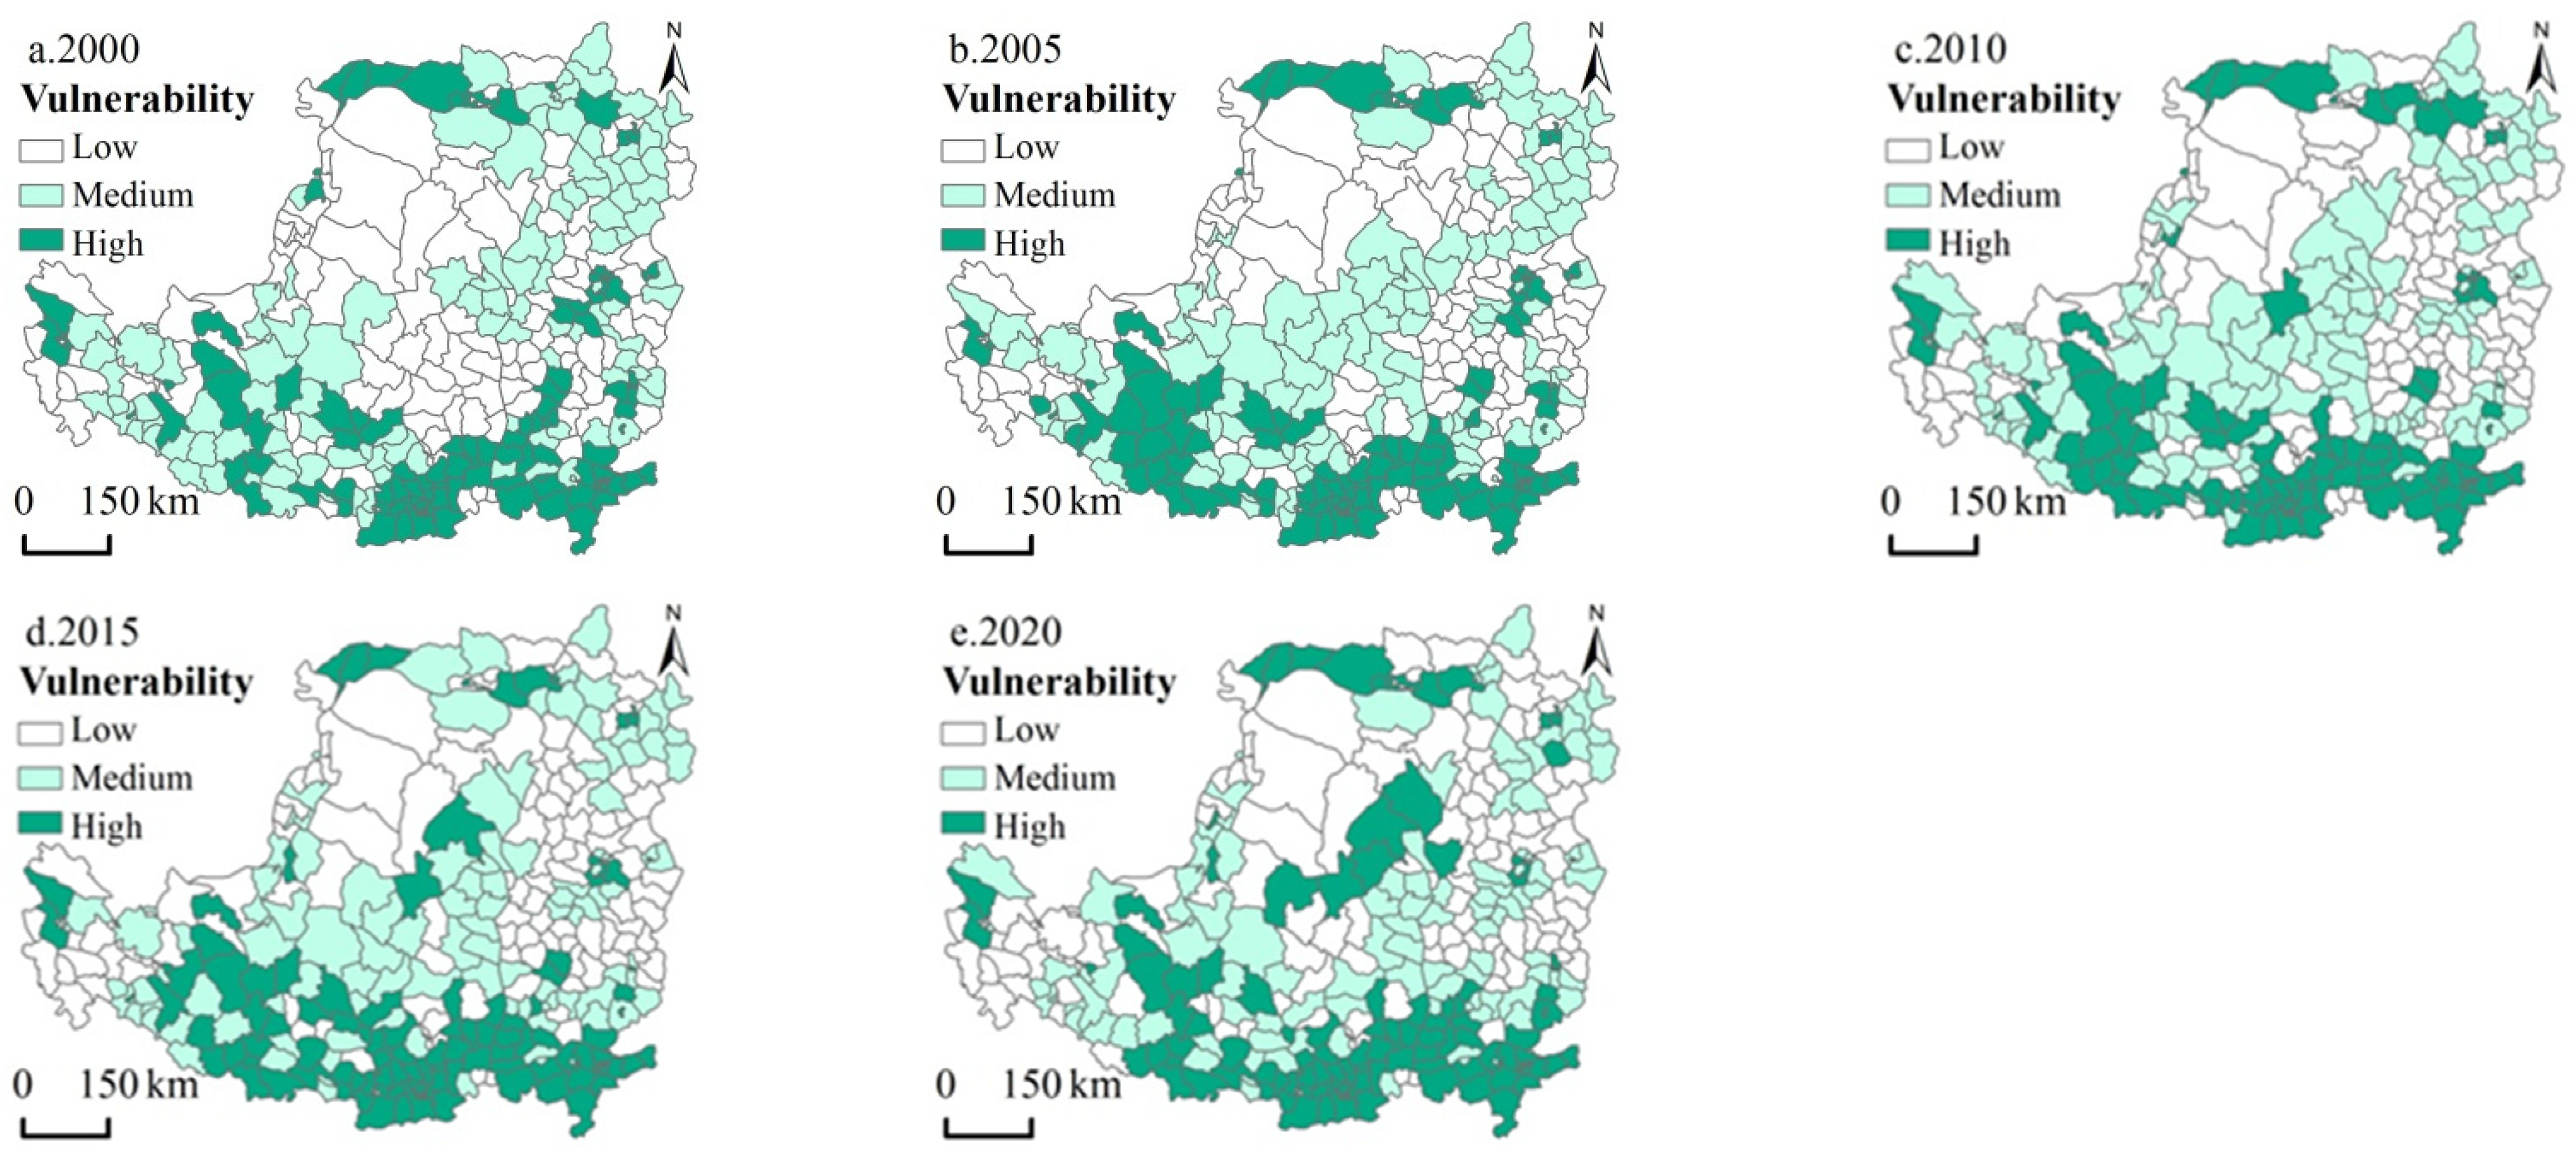
In terms of spatial distribution, the overall distribution pattern of the SES’s vulnerability on the Loess Plateau from 2000 to 2020 was “high in the north/south, low in the medium” (Figure 4). Specifically, from 2000 to 2010, the high-vulnerability areas of the SES shifted from Bayannur City and some counties in Baotou City to the east, and from the southern part of Loess Plateau to the west, and 2% and 13% of the counties were transformed from low-vulnerability areas and medium-vulnerability areas, respectively (Figure 5a); the low-vulnerability areas were mainly distributed in Erdos City and some counties in Shanxi Province, and 27% and 3% of the counties were transformed from medium-vulnerability areas and high-vulnerability areas, respectively. The medium-vulnerability areas were mainly embedded between the high- and low-value spatial units, and 27% and 12% of the counties were transformed from low-vulnerability areas and high-vulnerability areas, respectively. From 2010 to 2020, the high-vulnerability areas of the SES receded westward from Bayannur City, Baotou City, and some counties of Hohhot City on the Loess Plateau and expanded northward from the southern part of the Loess Plateau, and 2% and 16% of the counties were transformed from low- and medium-vulnerability areas, respectively; the low-vulnerability areas were still mainly distributed in Erdos City and some counties of Shanxi Province, and 25% and 2% of the counties were transformed from medium- and high-vulnerability areas, respectively; the medium-vulnerability areas were still mainly embedded between the high- and low-value spatial units, and 25% and 16% of the counties were transformed from high- and low-vulnerability areas, respectively.

4.2. Spatial–Temporal Variation in the Dimensions of the SES’s Vulnerability

4.2.1. Spatial–Temporal Variation in the SES’s Exposure

From 2000 to 2020, the SES’s exposure of the Loess Plateau showed a slow and then significant increase (Figure 3a), from 0.05 to 0.12, an increase of 140%. Indeed, the exposure showed a slow increasing trend from 2000 to 2005, from 0.05 to 0.06, an increase of 20%, and a rapid increasing trend from 2005 to 2020, from 0.06 to 0.12, an increase of 100%. From the coefficient of variation (Figure 3b), regional differences in the SES’s exposure on the Loess Plateau tended to decrease, from 1.45 to 0.92, a decrease of 36.55%.
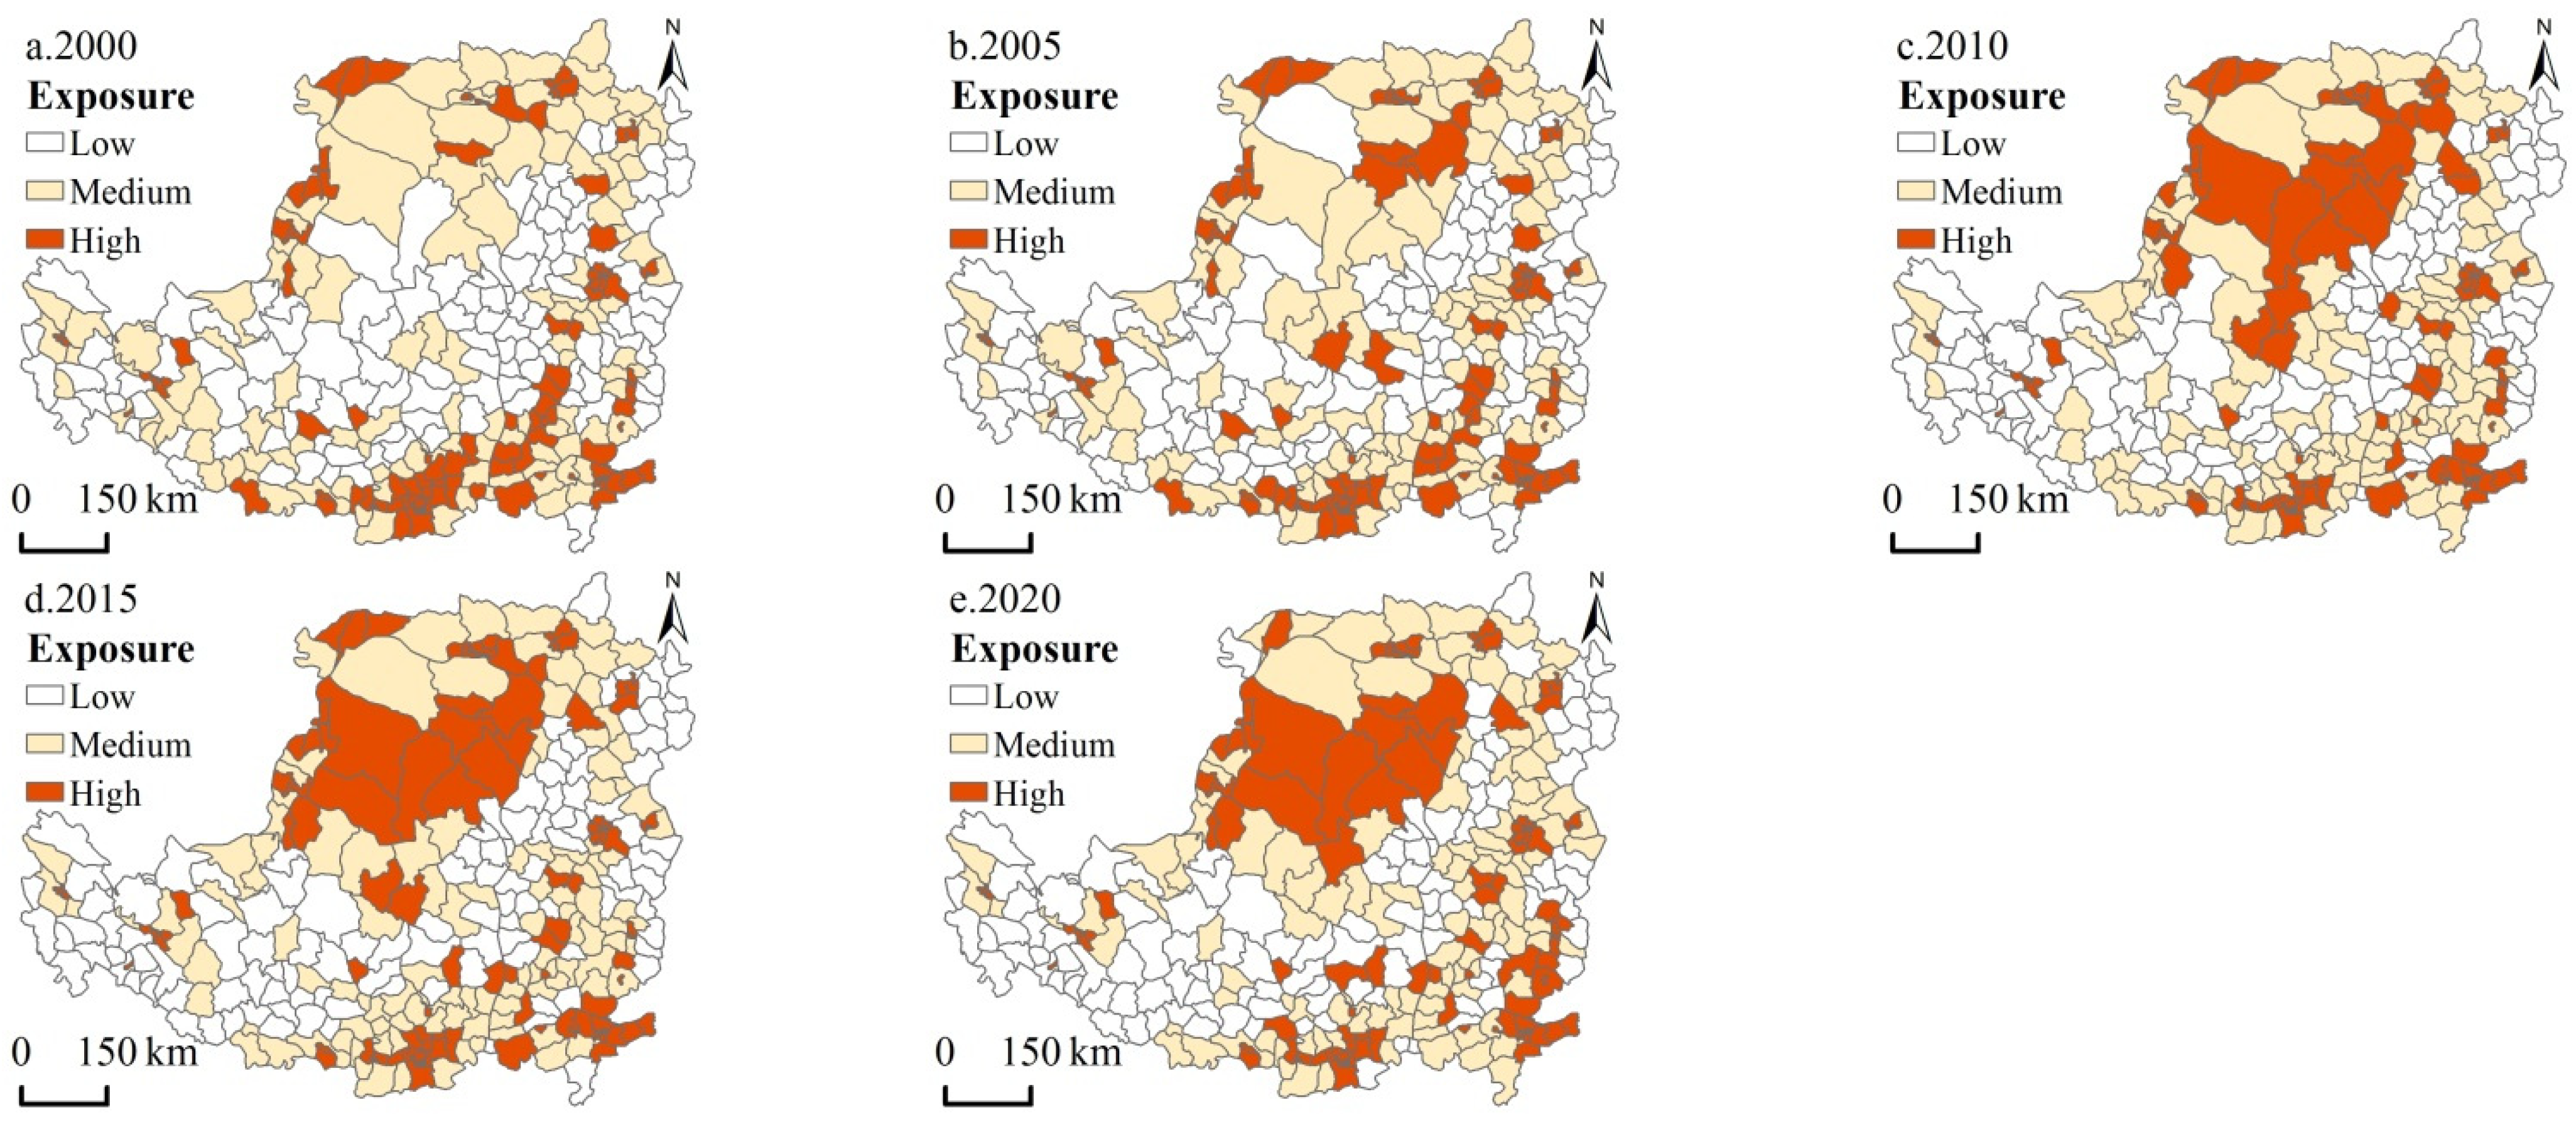
In terms of spatial distribution, the SES’s exposure to the Loess Plateau from 2000 to 2020 showed a general distribution pattern of “high in the northwest and southeast, low in the southwest” (Figure 6). Specifically, from 2000 to 2010, the high-value areas of the SES’s exposure shifted from point distribution in the counties of provincial capital cities to face distribution in some counties of Ordos City and Yulin City, and 4% and 12% of the counties were transformed from low- and medium-value areas, respectively (Figure 5b); the low-value areas shifted from the central counties of Loess Plateau to the southwestern counties of Loess Plateau and Shanxi Province, and 22% of the counties were transformed from medium-value areas. The medium-value areas were mainly distributed in the counties around the high-value areas, and 18% and 17% of the counties were transformed from low- and high-value areas, respectively. From 2010 to 2020, the high-value areas of the SES’s exposure remained unchanged, forming a double pattern with the surface distribution centered on Erdos City and Yulin City and the point distribution in the capital city counties of Loess Plateau, and 1% and 10% of the counties were transformed from low- and medium-value areas, respectively; the low level counties were still mainly distributed in the southwestern part of Loess Plateau and some counties in Shanxi Province, and 15% of the counties were transformed from medium-value areas; the medium-value areas were still mainly distributed in the counties around the high-value areas, and 14% and 11% of the counties were transformed from low- and high-value areas, respectively.

4.2.2. Spatial–Temporal Variation in the SES’s Sensitivity

From 2000 to 2020, the SES’s sensitivity of the Loess Plateau showed a slow and then significant increase (Figure 3a), from 0.099 to 0.16, an increase of 61.62%. Indeed, the sensitivity showed a slowly increasing trend from 2000 to 2005, from 0.099 to 0.100, an increase of only 1.01%, while it showed a rapidly increasing trend from 2005 to 2020, from 0.10 to 0.16, an increase of 60%. From the coefficient of variation (Figure 3b), the regional differences in SES’s sensitivity on the Loess Plateau gradually increased from 0.34 to 0.69, an increase of 103%.
In terms of spatial distribution, the SES’s sensitivity of the Loess Plateau from 2000 to 2020 generally showed a distribution pattern of “high in the north/south and low in the east” (Figure 7). Specifically, from 2000 to 2010, the high-value areas of the SES’s sensitivity expanded eastward from Bayannur City, Baotou City, and Hohhot City on the Loess Plateau and gradually shifted westward from the eastern part of Gansu Province, Shaanxi Province, and some counties in Henan Province to Ningxia, and 1% and 16% of the counties were transformed from low-value areas and medium-value areas, respectively (Figure 5c); the low-value areas were transformed from Erdos City and some counties in Yulin City have been gradually shifted to some counties in Shanxi Province, and 22% and 1% of the counties were transformed from medium-value areas and high-value areas, respectively; the medium-value areas were shifted from the counties in the south of Shanxi Province and Shaanxi Province to the counties in Yulin City, and 19% and 18% of the counties were transformed from low-value areas and high-value areas, respectively. From 2010 to 2020, the high-value areas of the SES’s sensitivity shifted to the middle of the Loess Plateau, and 1% and 16% of the counties were transformed from low- and medium-value areas, respectively; the low-value areas also gradually shifted to the eastern part of the Loess Plateau in a facial distribution, and 12% of the counties were transformed from medium-value areas; the medium-value areas shifted to the western part of the Loess Plateau, and 11% and 17% of the counties were transformed from low- and high-value areas, respectively.

4.2.3. Spatial–Temporal Variation in the SES’s Adaptive Capacity

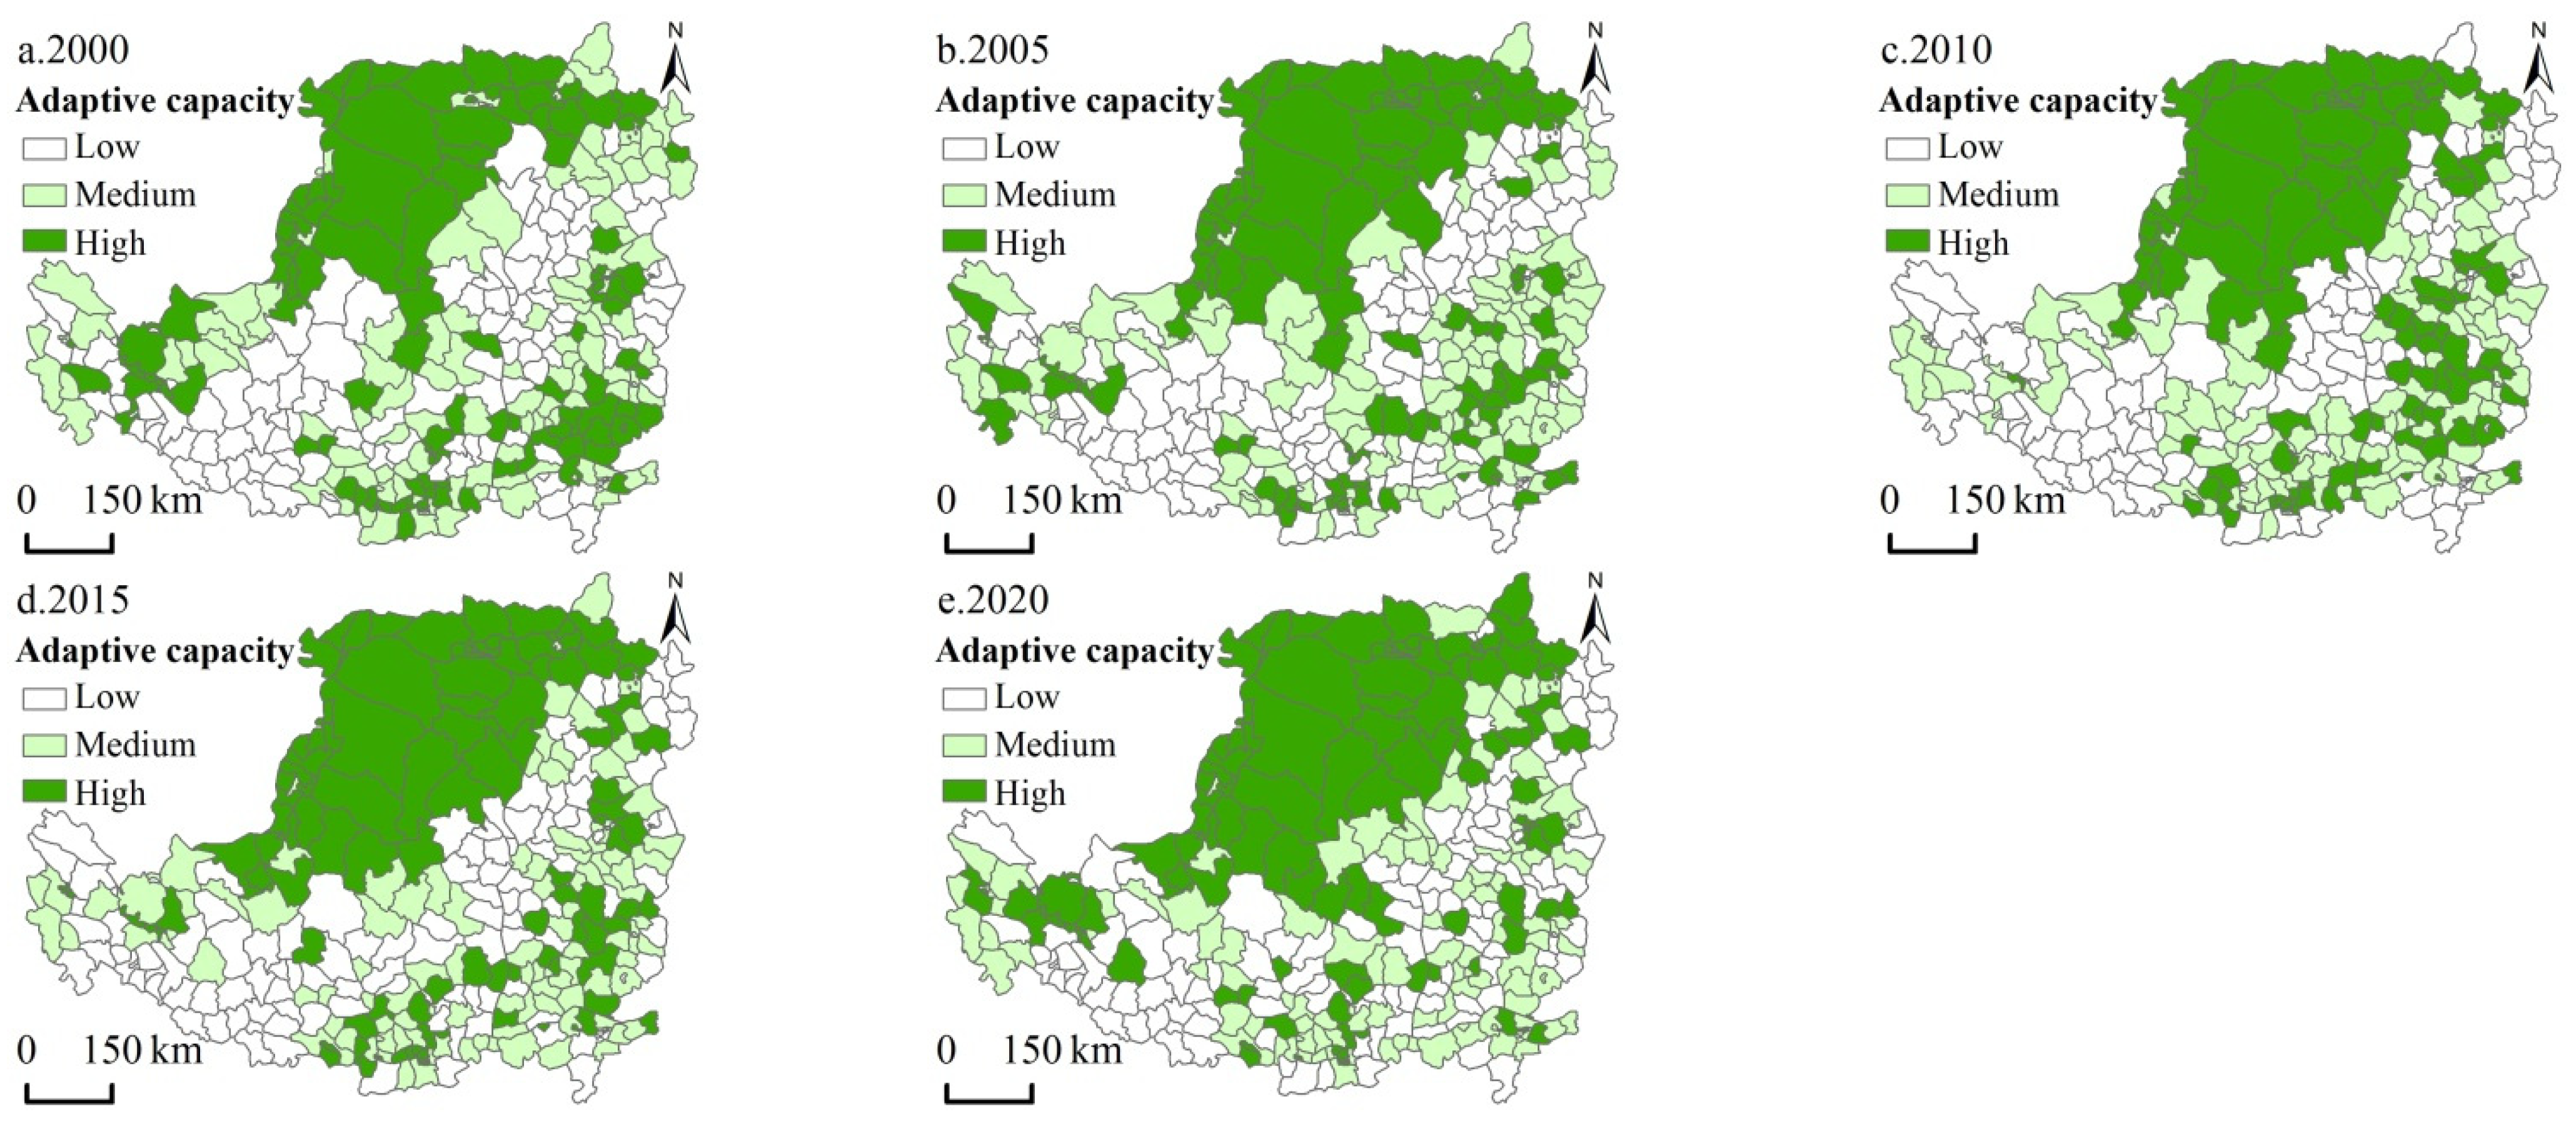
From 2000 to 2020, the SES’s adaptive capacity of the Loess Plateau showed a significant increasing trend (Figure 3a), from 0.04 to 0.19, an increase of 375%. From the coefficient of variation (Figure 3b), the regional differences in the adaptive capacity of the SES on the Loess Plateau gradually decreased from 0.40 to 0.36, a decrease of 10%. Specifically, from 2000 to 2010, the coefficient of variation of the SES’s adaptive capacity decreased from 0.40 to 0.33, a decrease of 17.5%, while, from 2010 to 2020, the coefficient of variation of SES adaptive capacity increased from 0.33 to 0.36, an increase of 9.09%.
In terms of spatial distribution, the adaptive capacity of the SES on the Loess Plateau from 2000 to 2020 showed a general pattern of “high in the northwest and southeast, low in the southwest” (Figure 8). Specifically, from 2000 to 2010, the high-value areas of SES adaptive capacity mainly shifted from the facial distribution of some counties in Inner Mongolia and Gansu Province to the east to some counties in Yulin City, from the point distribution of large and medium counties in the southeastern part of the Loess Plateau to the east, and 10% and 31% of the counties were transformed from low- and medium-value areas, respectively (Figure 5d); the low-value areas were mainly distributed in some counties of Gansu Province, Ningxia, and Shanxi Province, and 28% and 9% of the counties were transformed from medium- and high-value areas, respectively; the medium-value areas were mainly distributed around the high-value areas, and 27% and 32% of the counties were transformed from high- and low-value areas, respectively. From 2010 to 2020, the high-value areas of the SES’s adaptive capacity expanded southward in the northwestern part of Loess Plateau and contracted in the southeastern part of Loess Plateau in a dotted distribution, forming a double pattern with the northwestern part as the main surface distribution and the southeastern part as the main dotted distribution, and 14% and 23% of the counties were transformed from low-value areas and medium-value areas, respectively; the low-value areas were mainly concentrated in the southern and eastern parts of the Loess Plateau, and 34% and 10% of the counties were transformed from medium-value areas and high-value areas, respectively; the medium-value areas were still mainly distributed in the counties around the high-value areas, and 30% and 27% of the counties were transformed from low-value areas and high-value areas, respectively.

4.3. Identification of Dominant Factors of the SES’s Vulnerability

Based on the dominant factor method, from 2000 to 2020, the SES of the Loess Plateau with high vulnerability could be classified into six categories, including exposure-dominant, sensitivity-dominant, exposure-sensitive-dominant, exposure-adaptation-dominant, sensitivity- adaptation-dominant, and strong-vulnerable-dominant. Specifically:
From 2000 to 2020, a number of dominant elements in the high-value areas of the SES’s vulnerability of the Loess Plateau were dominated by two or three, especially the highest percentage of exposure-sensitive-dominant counties, and changed spatially (Figure 9). Indeed, the exposure-dominant counties were mainly distributed in Taiyuan City and Xi’an City, the range shrank significantly, and the proportion of the number of counties decreased from 25.44% to 9.65%; the number of sensitivity-dominant counties was at the lowest level, and the proportion of the number of counties increased from 0% to 4.39%. Exposure-sensitive-dominant counties gradually shifted from Bayannur City, Baotou City, Hohhot City, Changzhi City, Zhengzhou City, and some counties in Shaanxi Province to Yulin City and the southern region of the Loess Plateau, and the number of counties increased from 27.19% to 34.21%. Exposure-adaptation-dominant counties were shifted from Luoyang City in Henan Province to some regions in Datong City of Shanxi Province, and the number of counties decreased from 10.53% to 9.65%. Sensitivity-adaptation-dominant counties expanded from some counties in Gansu Province to some counties in Shaanxi Province and Shanxi Province, and the number of counties increased from 12.28% to 26.32%. Strong-vulnerable-dominant counties were mainly scattered in the southern part of Loess Plateau, the range gradually contracted, and the number of counties decreased from 24.56% to 15.79%. Overall, the number of exposure-sensitive-dominant, sensitivity-adaptation-dominant, exposure-adaptation-dominant, and sensitivity-dominant counties showed a fluctuating upward trend, while the number of strong-vulnerable-dominant and exposure-dominant counties showed a fluctuating downward trend.

5. Discussion

In the analysis of the spatial–temporal evolution of the SES’s vulnerability on the Loess Plateau, It was found that the SES’s vulnerability on the Loess Plateau showed a fluctuating downward trend of “decline followed by growth” due to rapid urbanization; i.e., the early urbanization has a positive effect on reducing the SES’s vulnerability, but, after reaching a certain level, it will lead to a gradual increase in the SES’s vulnerability. This is similar to the results of the impact of infrastructure inputs on SES’s vulnerability conducted by Xiong Changsheng et al. [52]. The reason for this was that, at the early stage of urbanization, more and more factors were concentrated in urban areas and the level of economic development and urban infrastructure was improved to a certain extent, which enhanced promotion of urbanization. Although the crude economic development model put pressure on the ecological environment and the influx of large numbers of people into cities put higher demands on urban construction, the SES itself has a certain absorption and resistance capacity, and, therefore, the SES’s vulnerability was on the decline. However, with continuous expansion of regional urban construction land, population gathering, and industrialization, the urban SES was in a continuous process of “fragmentation” and “turbulence”, and the role between economic development and ecological pressure was increasing; once the critical point was reached, ecological pressure and a level of urban construction that do not match the population began to appear, resulting in increased SES vulnerability. It was found that the high-vulnerability areas of the SES were mainly distributed in Bayannur City, Baotou City, and the southern counties of Loess Plateau, while the low-vulnerability areas were mainly distributed in Erdos City and some counties in Shanxi Province. The reasons for this were that the SES’s vulnerability of Bayannur, Baotou, and the southern counties of the Loess Plateau was high due not only to the strong disturbance of rapid urbanization but also the large influx of people into the cities without access to basic urban public services and infrastructure to meet their needs. Meanwhile, Erdos City and some counties in Shanxi Province, despite the faster urbanization and lower vegetation coverage, have small urban population density and better urban public service facilities and infrastructure, which basically meet the local demand. Xing Zuge et al. [53] also pointed out that the social integration of the migrant population in Erdos City and some counties in Shanxi Province was higher than other regions on the Loess Plateau, so their SES’s vulnerability is lower. The study found that the SES’s high-vulnerability areas shrink from Bayannur City and some counties of Baotou City to the west and expand from the southern part of Loess Plateau to the north. This is because the rural character of Bayannur City and some counties in Baotou City gradually diminished, the population density of the counties was small, and the level of counties construction basically met the needs of the residents. However, the counties’ population density in the southern counties of the Loess Plateau was high, and the level of counties construction was increasingly unable to meet the needs of the residents, so the high-vulnerability areas in the southern counties of the Loess Plateau gradually expanded.
It was found that the high-exposure-value areas shifted from a point distribution in the provincial capital city counties to a dual pattern with a face distribution centered on Erdos and Yulin and a point distribution in the provincial capital city counties. The reason is that, at the early stage of urbanization, the urbanization level of provincial capital cities and counties was higher but the development speed was slower; however, along with the rapid development of urbanization, the areas with lower urbanization levels developed rapidly; particularly, the urbanization speed of Erdos and Yulin counties was fastest because the industrial development level was faster and gradually caught up with the provincial capital cities and counties in Loess Plateau. The study also found that the SES’s sensitivity in the southwestern part of the Loess Plateau shifted from a high-value area to a medium-value area, while the southern part of Shaanxi Province shifted from a medium-value area to a high-value area. This is because the rusticity characteristics of the southwestern part of Loess Plateau were more obvious than those of the southern part of Shaanxi Province in 2000 and more sensitive to the influence of rapid urbanization. However, with the increase in urbanization level and vegetation cover, the rusticity characteristic of the area gradually decreased. The study also found that the low-value area of the SES’s adaptive capacity shifted from Gansu Province, Ningxia, and some counties in Shanxi Province to some counties in the southern and eastern parts of the Loess Plateau. This is because, in 2000, the economic development level of some counties in Gansu, Ningxia, and Shanxi was low and the ability to cope with external risk disturbances was weak, but, with the rapid development of urbanization, the economic strength, infrastructure, and public services of these regions have been advancing, so the adaptive capacity is improving. While some counties in the southern and eastern parts of the Loess Plateau were economically strong, the urban population was dense and the level of urban construction was not up to meeting the needs of the residents; thus, the adaptive capacity was low.
Comparing Figure 6 and Figure 7, the spatial patterns of high (low) levels of exposure and low (high) levels of sensitivity roughly correspond to each other. Comparing Figure 6 and Figure 8, the spatial pattern of high (low) levels of exposure and the spatial pattern of high (low) levels of adaptive capacity roughly correspond to each other. The reason for this is that the highly exposed counties and districts were strongly influenced by rapid urbanization, with stronger economies, better infrastructure, and more robust public services, thus increasing their ability to adapt while being the first to complete the transition from a rural to an urban system. However, they were also less sensitive to the impact of urbanization exerted in the area due to their insignificant rural population and agricultural economic activities and high vegetation cover; on the contrary, the urbanization process in the low-exposure counties was slow and the transition from rural to urban institutions had not yet been realized, and the adaptive capacity to mitigate the impact of urbanization had not yet been developed. At the same time, the impact of urbanization on rural areas with distinct geographical features and low vegetation cover was easily reinforced or even amplified, resulting in a “dose-response” and thus higher sensitivity, which was consistent with the findings of He Yanbing et al. [19].

6. Conclusions and Policy Recommendations

The following conclusions have been obtained:
(1) The vulnerability of the Loess Plateau SES showed a fluctuating downward trend of “decline followed by growth” from 2000 to 2020, and the regional differences increased significantly; the overall distribution pattern was “low in the middle and high in the north/south”, and the high-value areas were mainly distributed in Bayannur City, Baotou City, and the southern counties of the Loess Plateau.
(2) The SES’s exposure, sensitivity, and adaptability all showed an increasing trend, and the regional differences in exposure and adaptability decreased significantly except for sensitivity. In terms of spatial distribution, except for the sensitivity, which was high in the north/south and low in the east, the exposure and adaptability were all distributed in a pattern of high in the northwest and southeast and low in the southwest.
(3) High-vulnerability areas were classified into six types: exposure-dominant, sensitivity-dominant, exposure-sensitive-dominant, exposure-adaptation-dominant, sensitivity-adaptation-dominant, and strong-vulnerable-dominant. Among them, exposure-sensitive-dominant counties accounted for the highest proportion.
Based on the results of analysis of the dominant factors affecting the high-vulnerability areas on the Loess Plateau, differentiated coping strategies were proposed for each of the six types of high-vulnerability areas to promote the sustainable development of the region [50,54]:
(1) Exposure-dominant. The breakthrough is to “control the number of population and intensify the development of construction land” to continuously reduce the pressure on regional resources and space. On the one hand, the population of such counties should be reasonably controlled, and policies should be used to encourage some of the population to move to the surrounding small towns to relieve the pressure on their resource needs. On the other hand, an appropriate amount of unused land will be developed to relieve the land tension in the central area, and, at the same time, the "production-living-ecological" spatial layout will be reasonably planned to regulate the negative impact of growth of construction land on the environment to relieve the pressure of space demand.
(2) Sensitivity-dominant. To “promote the transformation of industrial structure and protect ecological space” as a breakthrough to create a low-sensitivity space. On the one hand, explore its own resource advantages, actively promote transformation of industrial structure, and improve the level of regional economic development; on the other hand, protect the existing ecological space, strictly prohibit development, and actively plant trees and forests to promote ecological restoration.
(3) Exposure-sensitive-dominant type. Take “green development of industrial industry and strict control of ecological environment” as a breakthrough to build a low-exposure and low-sensitivity space. Eliminate high-polluting industries by category, strictly control the ecological environment, and create a beautiful city with blue sky, green land, and clean water.
(4) Exposure-adaptation-dominant. To “optimize the layout of urban and rural areas, enhance the well-being of the masses” as a breakthrough to create a low exposure–high adaptation space. On the one hand, to accelerate the development of urban–rural integration, it is important to increase the attractiveness of grass-roots medical staff positions and improve the capacity of primary care institutions. On the other hand, actively promote the shortcomings of key infrastructure construction, drive the regional economic vitality, strengthen social security, and enhance the happiness of the masses.
(5) Sensitivity-adaptation-dominant. The breakthrough is to “broaden the channels for increasing income of special economy and develop agricultural mechanization” and steadily improve the regional production and living environment. On the one hand, implement the crop rotation fallow system according to local conditions, promote sustainable use of arable land resources, stabilize food production, highlight the development of the characteristic economy, and broaden the channels for improving the total output value of the characteristic economy; on the other hand, cultivate large vegetable bases based on regional characteristics, exploit climatic advantages, and promote modernization and scale of vegetables.
(6) Strong-vulnerable-dominant. Taking the “integrated development of three industries and prevention of ecological deterioration” as a breakthrough, promote construction of a new type of urbanization with people at its core. On the one hand, continue to promote citizenship of the rural population, actively promote construction of key infrastructure, and promote diversified development of modern service industries and upgrading of consumption capacity. On the other hand, strengthen ecological and environmental governance and management capabilities and establish a green and productive economic system to meet the growing needs of the people for a better life.
This study is limited by the availability of data and the difficulty of quantifying institutional policies, resulting in the lack of comprehensive for the SES’s vulnerability assessment. How to select indicators scientifically and completely to reflect the SES’s vulnerability comprehensively and accurately will be the focus of future research. In addition, this study focuses on evaluation and comparative analysis of the spatial and temporal changes of the SES’s vulnerability on the Loess Plateau from 2000 to 2020, but how to accurately identify or measure the critical threshold of the system being damaged by sensitivity indicators is still a difficult point in the current vulnerability study, which requires further breakthroughs in a follow-up study to strengthen the accumulation of multivariate data and methods.

Author Contributions

Conceptualization, X.Z.; methodology, P.M.; software, P.M.; validation, P.M.; formal analysis, P.M.; investigation, P.M.; resources, H.L.; data curation, P.M.; writing—original draft preparation, X.Z.; writing—review and editing, X.Z.; visualization, P.M.; supervision, X.Z.; project administration, X.Z.; funding acquisition, X.Z. and H.L. All authors have read and agreed to the published version of the manuscript.

Funding

Ministry of Science and Technology (2022YFC3800705); National Natural Science Foundation of China (41971268, 42201326).

Institutional Review Board Statement

Not applicable.

Informed Consent Statement

Not applicable.

Data Availability Statement

Not applicable.

Conflicts of Interest

The authors declare no conflict of interest.

References

  1. Zou, C.; Zhu, J.; Lou, K.; Yang, L. Coupling coordination and spatiotemporal heterogeneity between urbanization and ecological environment in Shaanxi Province, China. Ecol. Indic. 2022, 141, 109152. [Google Scholar] [CrossRef]
  2. Wang, X.; Long, W.; Sang, M.; Yang, Y. Towards Sustainable Urbanization: Exploring the Influence Paths of the Urban Environment on Bidders’ Collusive Willingness. Land 2022, 11, 280. [Google Scholar] [CrossRef]
  3. Fang, C.; Cui, X.; Liang, L. Theoretical analysis of urbanization and eco-environment coupling coil and coupler control. Acta Geogr. Sin. 2019, 74, 2529–2546. (In Chinese) [Google Scholar]
  4. Earth, F. Future Earth Initial Design: Report of the Transition Team; International Council for Science (ICSU): Paris, France, 2013. [Google Scholar]
  5. Fang, C.; Wang, Y.; Fang, J. A comprehensive assessment of urban vulnerability and its spatial differentiation in China. Acta Geogr. Sin. 2015, 70, 234–247. (In Chinese) [Google Scholar] [CrossRef]
  6. Kriewald, S.; Pradhan, P.; Costa, L.; Ros, A.G.C.; Kropp, J.P. Hungry cities: How local food self-sufficiency relates to climate change, diets, and urbanisation. Environ. Res. Lett. 2019, 14, 094007. [Google Scholar] [CrossRef]
  7. Sun, X.; Crittenden, J.C.; Li, F.; Lu, Z.; Dou, X. Urban expansion simulation and the spatio-temporal changes of ecosystem services, a case study in Atlanta Metropolitan area, USA. Sci. Total Environ. 2018, 622, 974–987. [Google Scholar] [CrossRef]
  8. Kates, R.W. Environment and development-Sustainability science. Science 2001, 292, 641. [Google Scholar] [CrossRef]
  9. Wu, C. On the Core of Geography: Human-Earth Relations in Geographical Systems. Econ. Geogr. 1991, 3, 1–6. (In Chinese) [Google Scholar]
  10. Grimm, N.B.; Faeth, S.H.; Golubiewski, N.E.; Redman, C.L.; Wu, J.; Bai, X.; Briggs, J.M. Global change and the ecology of cities. Science 2008, 319, 756–760. [Google Scholar] [CrossRef] [Green Version]
  11. Siciliano, G. Urbanization strategies, rural development and land use changes in China: A multiple-level integrated assessment. Land Use Policy 2012, 29, 165–178. [Google Scholar] [CrossRef]
  12. Zeng, L.; Zhao, Y.; Wang, X. How to develop the new urbanization in mineral resources abundant regions in China? A VIKOR-based path matching model. Resour. Policy 2022, 79, 103095. [Google Scholar] [CrossRef]
  13. He, W.; Li, X.; Yang, J.; Ni, H.; Sang, X. How land use functions evolve in the process of rapid urbanization: Evidence from Jiangsu Province, China. J. Clean. Prod. 2022, 380, 134877. [Google Scholar] [CrossRef]
  14. Cumming, G.S.; Barnes, G.; Perz, S.; Schmink, M.; Sieving, K.E.; Southworth, J.; Binford, M.; Holt, R.D.; Stickler, C.; Van Holt, T. An exploratory framework for the empirical measurement of resilience. Ecosystems 2005, 8, 975–987. [Google Scholar] [CrossRef]
  15. Adger, W.N. Vulnerability. Glob. Environ. Chang. 2006, 16, 268–281. [Google Scholar] [CrossRef]
  16. Turner, B.L.; Kasperson, R.E.; Matson, P.A.; McCarthy, J.J.; Corell, R.W.; Christensen, L.; Eckley, N.; Kasperson, J.X.; Luers, A.; Martello, M.L. A framework for vulnerability analysis in sustainability science. Proc. Natl. Acad. Sci. USA 2003, 100, 8074–8079. [Google Scholar] [CrossRef] [PubMed] [Green Version]
  17. Li, H.; Zhang, P.; Cheng, Y. Concepts and assessment methods of vulnerability. Prog. Geogr. 2008, 27, 18–25. (In Chinese) [Google Scholar]
  18. Li, H.; Zhang, P. Research progress and prospective applications of vulnerability approach under global change. Prog. Geogr. 2011, 30, 920–929. (In Chinese) [Google Scholar]
  19. He, Y.; Huang, X.; Yang, X. Social Vulnerability Assessment of Land-Lost Households in Urban Fringe of Xi’an. Econ. Geogr. 2017, 37, 149–157. [Google Scholar]
  20. Turner, B.L.; Matson, P.A.; McCarthy, J.J.; Corell, R.W.; Christensen, L.; Eckley, N.; Hovelsrud-Broda, G.K.; Kasperson, J.X.; Kasperson, R.E.; Luers, A. Illustrating the coupled human–environment system for vulnerability analysis: Three case studies. Proc. Natl. Acad. Sci. USA 2003, 100, 8080–8085. [Google Scholar] [CrossRef] [Green Version]
  21. Yu, R.; Liang, L.; Su, X.; Cheng, J. A driver based framework for vulnerability assessment of the poverty stricken areas of Funiu Mountain, China. Ecol. Indic. 2020, 113, 106209. [Google Scholar] [CrossRef]
  22. Peng, Y.; Welden, N.; Renaud, F.G. A framework for integrating ecosystem services indicators into vulnerability and risk assessments of deltaic social-ecological systems. J. Environ. Manag. 2023, 326, 116682. [Google Scholar] [CrossRef] [PubMed]
  23. Yang, Z.; Li, B.; Nan, B.; Dai, X.; Peng, C.; Bi, X. A methodological framework for assessing pastoral socio-ecological system vulnerability: A case study of Altay Prefecture in Central Asia. Sci. Total Environ. 2023, 862, 160828. [Google Scholar] [CrossRef] [PubMed]
  24. Yang, X.; Dai, X.; Li, W.; Lu, H.; Liu, C.; Li, N.; Yang, Z.; He, Y.; Li, W.; Fu, X.; et al. Socio-Ecological Vulnerability in Aba Prefecture, Western Sichuan Plateau: Evaluation, Driving Forces and Scenario Simulation. ISPRS Int. J. Geo-Inf. 2022, 11, 524. [Google Scholar] [CrossRef]
  25. Li, Z.; Deng, X.; Zhang, Y. Evaluation and convergence analysis of socio-economic vulnerability to natural hazards of Belt and Road Initiative countries. J. Clean. Prod. 2021, 282, 125406. [Google Scholar] [CrossRef]
  26. Gupta, A.K.; Negi, M.; Nandy, S.; Kumar, M.; Singh, V.; Valente, D.; Petrosillo, I.; Pandey, R. Mapping socio-environmental vulnerability to climate change in different altitude zones in the Indian Himalayas. Ecol. Indic. 2020, 109, 105787. [Google Scholar] [CrossRef]
  27. Snyder, B.F.; Parks, V. Spatial variation in socio-ecological vulnerability to Covid-19 in the contiguous United States. Health Place 2020, 66, 102471. [Google Scholar] [CrossRef] [PubMed]
  28. Dasgupta, S.; Badola, R.; Ali, S.Z.; Jiju, J.S.; Tariyal, P. Adaptive capacity and vulnerability of the socio-ecological system of Indian Himalayan villages under present and predicted future scenarios. J. Environ. Manag. 2022, 302, 113946. [Google Scholar] [CrossRef]
  29. Liu, C.; He, Q.; Li, Y. Spatiotemporal Evaluation of Socio-Ecological-Economic System Vulnerability: A County-Level Analysis of Chongqing, China. Sustainability 2020, 12, 3912. [Google Scholar] [CrossRef]
  30. Zhang, J.; Li, J.; Yang, X.; Yin, S.; Chen, J. Rural social-ecological systems vulnerability evolution and spatial-temporal heterogeneity in arid environmental change region: A case study of Minqin Oasis, northwestern China. Appl. Geogr. 2022, 145, 102747. [Google Scholar] [CrossRef]
  31. Damian, N.; Mitrică, B.; Mocanu, I.; Grigorescu, I.; Dumitraşcu, M. An index-based approach to assess the vulnerability of socio-ecological systems to aridity and drought in the Danube Delta, Romania. Environ. Dev. 2022, 45, 100799. [Google Scholar] [CrossRef]
  32. Han, X.; Wang, P.; Wang, J.; Qiao, M.; Zhao, X. Evaluation of human-environment system vulnerability for sustainable development in the Liupan mountainous region of Ningxia, China. Environ. Dev. 2020, 34, 100525. [Google Scholar] [CrossRef]
  33. Jha, S.K.; Negi, A.K.; Alatalo, J.M.; Negi, R.S. Socio-ecological vulnerability and resilience of mountain communities residing in capital-constrained environments. Mitig. Adapt. Strateg. Glob. Chang. 2021, 26, 38. [Google Scholar] [CrossRef] [PubMed]
  34. Grigorescu, I.; Mocanu, I.; Mitrică, B.; Dumitraşcu, M.; Dumitrică, C.; Dragotă, C.S. Socio-economic and environmental vulnerability to heat-related phenomena in Bucharest metropolitan area. Environ. Res. 2021, 192, 110268. [Google Scholar] [CrossRef] [PubMed]
  35. Zhao, X.; Ma, P.; Li, W.; Du, Y. Spatiotemporal changes of supply and demand relationships of ecosystem services in the Loess Plateau. Acta Geogr. Sin. 2021, 76, 2780–2796. (In Chinese) [Google Scholar]
  36. Sun, Y.; Liu, X.; Ren, Z.; Li, S. Spatiotemporal variations of multi-scale drought and its influencing factors across the Loess Plateau from 1960 to 2016. Geogr. Res. 2019, 38, 1820–1832. (In Chinese) [Google Scholar]
  37. Zhang, J.; Li, C.; Wang, T. Spatial and temporal variation of vegetation cover on the Loess Plateau and its causes. Res. Soil Water Conserv. 2022, 29, 224–230+241. (In Chinese) [Google Scholar]
  38. Zhang, L.; Fan, J.; Zhang, H.; Zhou, D. Spatial-temporal Variations and Their Driving Forces of the Ecological Vulnerability in the Loess Plateau. Environ. Sci. 2022, 43, 4902–4910. (In Chinese) [Google Scholar]
  39. Jiang, S.; Zhou, J.; Qiu, S. Digital Agriculture and Urbanization: Mechanism and Empirical Research. Technol. Forecast. Soc. Chang. 2022, 180, 121724. [Google Scholar] [CrossRef]
  40. Wei, L.; Zhou, L.; Sun, D.; Tang, X. The evolution of spatio-temporal pattern and scenario simulation of urban agglomeration expansion in the Yellow River Basin: A case study in the Hohhot-Baotou-Ordos-Yulin Urban Agglomeration. Geogr. Res.-Aust. 2022, 41, 1610–1622. [Google Scholar]
  41. Polsky, C.; Neff, R.; Yarnal, B. Building comparable global change vulnerability assessments: The vulnerability scoping diagram. Glob. Environ. Chang. 2007, 17, 472–485. [Google Scholar] [CrossRef]
  42. Chen, J.; Yang, X.; Yin, S.; Wu, K. The vulnerability evolution and simulation of the social-ecological systems in the semi-arid area based on the VSD framework. Acta Geogr. Sin. 2016, 71, 1172–1188. (In Chinese) [Google Scholar]
  43. Yang, Y.; Li, J.; Wang, L.; Wang, Z.; Yao, C.; Wang, Y. Impact of urbanization on supply and demand of typical ecosystem services in Yangtze River Delta. J. Nat. Resour. 2022, 37, 1555–1571. [Google Scholar] [CrossRef]
  44. Zhao, Y.; Shi, Y.; Feng, C.-C.; Guo, L. Exploring coordinated development between urbanization and ecosystem services value of sustainable demonstration area in China- take Guizhou Province as an example. Ecol. Indic. 2022, 144, 109444. [Google Scholar] [CrossRef]
  45. Chen, M.; Lu, D.; Zhang, H. Comprehensive evaluation and the driving factors of China’s urbanization. Acta Geogr. Sin. 2009, 64, 387–398. (In Chinese) [Google Scholar]
  46. Zhang, X.; Song, W.; Wang, J.; Wen, B.; Yang, D.; Jiang, S.; Wu, Y. Analysis on Decoupling between Urbanization Level and Urbanization Quality in China. Sustainability 2020, 12, 6835. [Google Scholar] [CrossRef]
  47. Hu, Y.; Liu, Y.; Yan, Z. Research Regarding the Coupling and Coordination Relationship between New Urbanization and Ecosystem Services in Nanchang. Sustainability 2022, 14, 15041. [Google Scholar] [CrossRef]
  48. He, Y.; Huang, X.; Zhai, L.; Yan, Q.; Yang, X. Assessment and influencing factors of social vulnerability to rapid urbanization in urban fringe: A case study of Xi’an. Acta Geogr. Sin. 2016, 71, 1315–1328. (In Chinese) [Google Scholar]
  49. Huang, X.; Wang, C.; Hu, K. Multi-scale assessment of social vulnerability to rapid urban expansion in urban fringe: A case study of Xi’an. Acta Geogr. Sin. 2018, 73, 1002–1017. (In Chinese) [Google Scholar]
  50. Li, Z.; Shi, L.; Zhang, C. Vulnerability Assessment and Differentiated Response Strategies of Rural Territorial Systems at the County Level from the Socio-ecological Perspective. Econ. Geogr. 2022, 42, 175–184. (In Chinese) [Google Scholar]
  51. Tai, X.; Xiao, W.; Tang, Y. A quantitative assessment of vulnerability using social-economic-natural compound ecosystem framework in coal mining cities. J. Clean. Prod. 2020, 258, 120969. [Google Scholar] [CrossRef]
  52. Xiong, C.; Hu, Y.; Zhou, T.; Tan, R.; Zhang, Y. Impact of provincial infrastructure investment on the vulnerability of social-ecological system in China. Chin. J. Appl. Ecol. 2022, 33, 1395–1404. (In Chinese) [Google Scholar]
  53. Xing, Z.; Huang, G.; Xue, D. Spatial pattern and influencing mechanism of social integration of migrants in Chinese cities. Acta Geogr. Sin. 2022, 77, 2474–2493. [Google Scholar]
  54. Wang, C.; He, Y. Spatio-temporal differentiation and differentiated regulation of the vulnerability of rural production space system in Chongqing. Acta Geogr. Sin. 2020, 75, 1680–1698. (In Chinese) [Google Scholar]
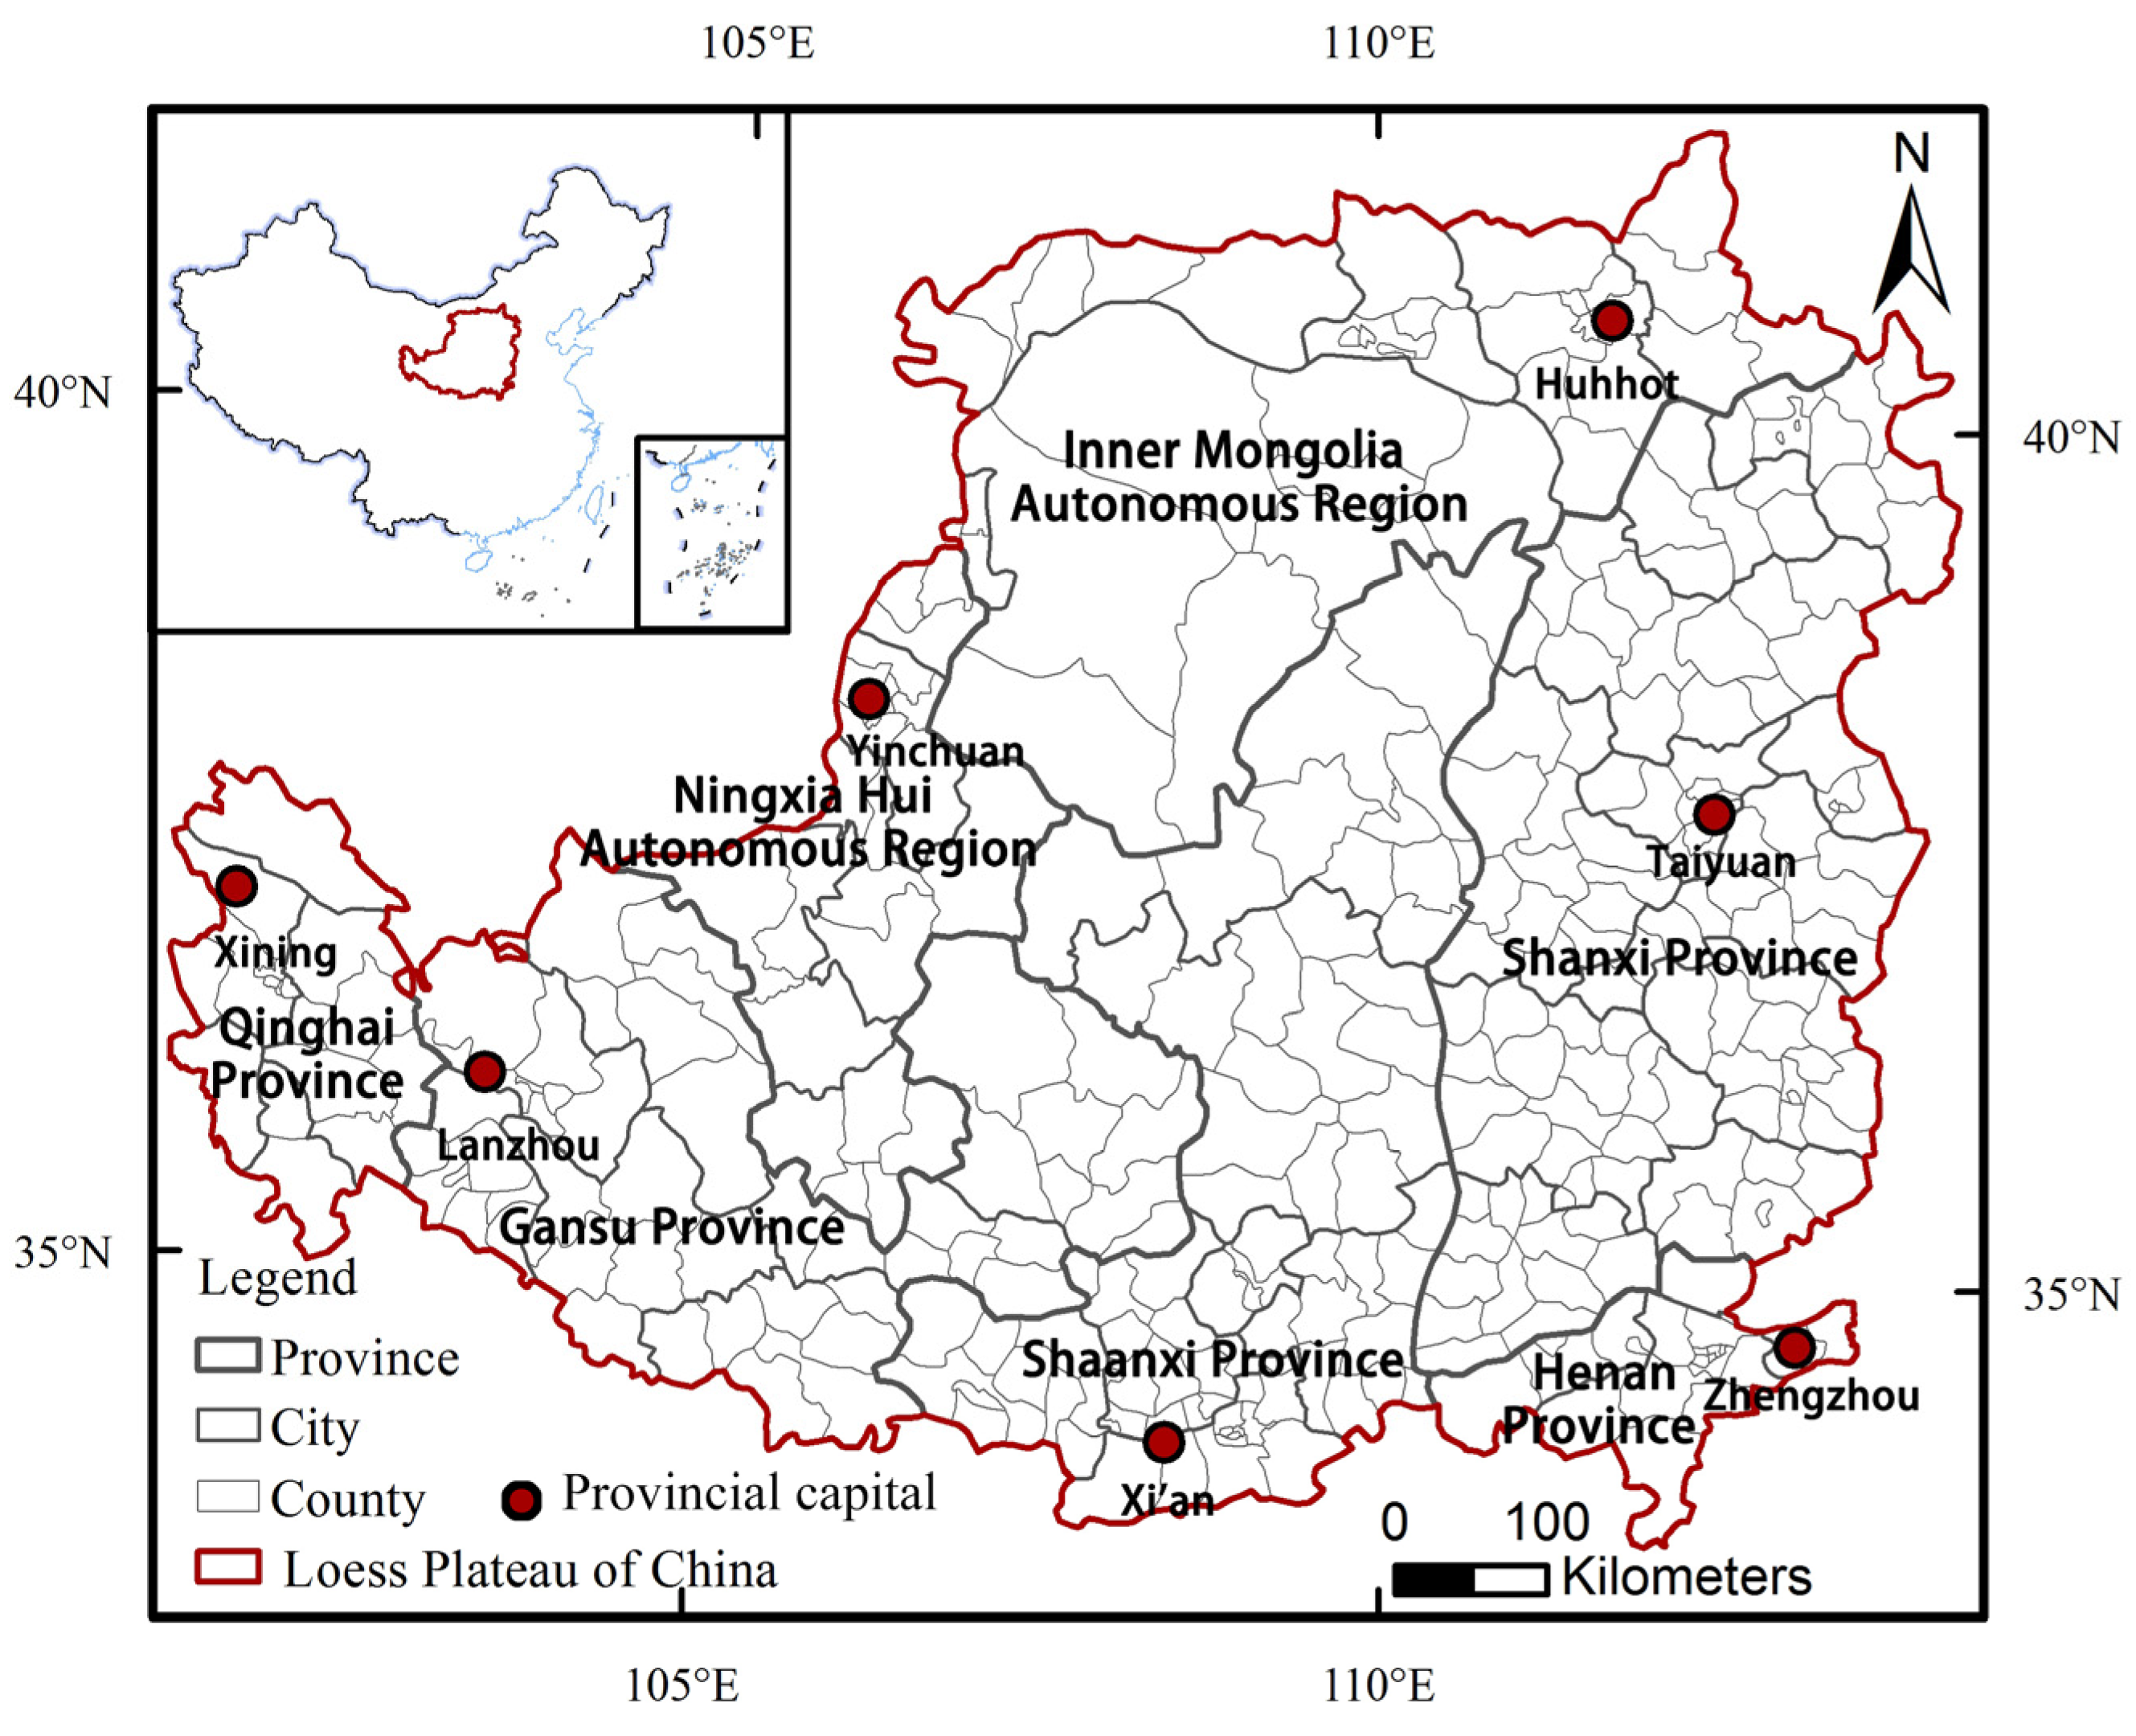
Figure 1. The study area.
Sustainability 15 02059 g001
Figure 2. An analytical framework for the socio-ecological system(SES) vulnerability under rapid urbanization.
Sustainability 15 02059 g002
Figure 3. Changing trends in the vulnerability of the SES of the Loess Plateau and coefficient of variation from 2000 to 2020.
Sustainability 15 02059 g003
Figure 4. Spatial distribution of vulnerability to SES on the Loess Plateau from 2000 to 2020.
Sustainability 15 02059 g004
Figure 5. Trajectories of the number of counties with different levels of vulnerability, exposure, sensitivity, and adaptive capacity of the SES of the Loess Plateau from 2000 to 2020.
Sustainability 15 02059 g005
Figure 6. Spatial distribution of exposure to SES on the Loess Plateau from 2000 to 2020.
Sustainability 15 02059 g006
Figure 7. Spatial distribution of sensitivity to SES on the Loess Plateau from 2000 to 2020.
Sustainability 15 02059 g007
Figure 8. Spatial distribution of adaptive capacity to SES on the Loess Plateau from 2000 to 2020.
Sustainability 15 02059 g008
Figure 9. Spatial distribution of the dominant factors in the high-vulnerability areas of the SES on the Loess Plateau from 2000 to 2020.
Sustainability 15 02059 g009
Table 1. The evaluation index system of the SES’s vulnerability assessment on the Loess Plateau.
Dimensional LayersIndicator LayersParameter LayersIndicator Meaning and PropertiesWeight
Exposure (+)Population urbanizationThe urban population numberIt reflects the degree of disturbance of population urbanization (+)0.22
Economic urbanizationIndustrial output per capitaIt reflects the degree of disturbance of economic urbanization (+)0.38
Land urbanizationThe share of construction land areaIt reflects the degree of disturbance of land urbanization (+)0.40
Sensitivity (+)Rural populationThe proportion of rural populationReflecting the sensitive state of the demographic structure (+)0.11
Agricultural developmentGross output value of primary industryReflecting the sensitive state of industrial structure (+)0.47
Land useArable land per capitaIt characterizes the sensitive state of the land space (+)0.29
Vegetation coverNormalized difference vegetation index (NDVI)It reflects the sensitive state of the ecological environment (−)0.13
Adaptive capacity (−)Regional economic developmentGross regional product per capitaIt reflects the regional economic strength and financial accumulation capacity (+)0.23
Resident incomeNet income per urban residentIt reflects the income level of urban residents (+)0.11
Medical CoverageNumber of medical beds per 10,000 peopleIt reflects the level of regional medical services (+)0.14
Convenience of travelRoad area per capitaIt reflects the accessibility of the region (+)0.09
Agricultural productivityFood production per capitaIt reflects the level of productivity (+)0.13
Environmental InvestmentThe share of environmental expenditures in regional GDPIt reflects the strength of regional ecological protection(+)0.17
Degree of greeneryThe area of green space per capitaIt reflects the degree of ecological improvement(+)0.13
Disclaimer/Publisher’s Note: The statements, opinions and data contained in all publications are solely those of the individual author(s) and contributor(s) and not of MDPI and/or the editor(s). MDPI and/or the editor(s) disclaim responsibility for any injury to people or property resulting from any ideas, methods, instructions or products referred to in the content.