Article

Taxonomic Diversity and Selection of Functional Traits in Novel Ecosystems Developing on Coal-Mine Sedimentation Pools

by
Agnieszka Kompała-Bąba
1,*,
Wojciech Bąba
2,
Karolina Ryś
1,
Robert Hanczaruk
1,
Łukasz Radosz
1,
Dariusz Prostański
3 and
Gabriela Woźniak
1,*
1
Institute of Biology, Biotechnology and Environmental Protection, Faculty of Natural Sciences, University of Silesia in Katowice, 40-032 Katowice, Poland
2
Independent Researcher, 41-106 Siemianowice Śl., Poland
3
KOMAG Institute of Mining Technology, 44-101 Gliwice, Poland
*
Authors to whom correspondence should be addressed.
Sustainability 2023, 15(3), 2094; https://doi.org/10.3390/su15032094
Submission received: 14 November 2022 / Revised: 13 January 2023 / Accepted: 20 January 2023 / Published: 22 January 2023

Abstract

:
Coal-mine sedimentation pools are extrazonal habitats in which the anthropogenic changes of all historic, abiotic, and biotic components, followed by conditions of extreme environmental stress, lead to the formation of novel ecosystems. Our study aims to (i) classify the vegetation on the basis of floristic and ecological criteria, (ii) detect the main environmental gradients responsible for the diversity of vegetation, and (iii) present the selection of species’ functional traits along environmental gradients. A cluster analysis of the floristic data revealed 14 distinct combinations of species. Short- and long-lived ruderals, meadow, xerothermic, and psammophilous species make up the floristic composition of vegetation. A canonical correspondence analysis on the floristic data and average Ellenberg’s indicator values confirmed moisture, soil reaction, and salinity as the main gradients, while fertility and insolation were secondary gradients shaping the diversity of vegetation. A RLQ with a subsequent cluster analysis revealed four groups of species traits selected along environmental gradients. These differed with reference to morphological (canopy height) and physiological traits (specific leaf area, or SLA), as well as persistence (life span), regeneration (reproduction by seeds or vegetative reproduction), and dispersal functional traits. This knowledge can be crucial when planning the restoration of these sites by using spontaneous succession and learning how the various environmental resources can be used to restore or provide new ecosystem services.

1. Introduction

The mining and processing industry significantly contributes to severe and often-irreversible environmental changes. These changes are complex and include water, soil, land relief, flora, fauna, and landscape transformation [1,2]. Deep mining tends to result in subsidence troughs and generates huge amounts of waste stored as spoil heaps. On the other hand, open-cast mining leads to the creation of deep and large-scale excavations (quarries, sandpits). Moreover, the abiotic conditions prevailing at these sites (the granulometric composition of the substrate, the soil pH, conductivity, water capacity, the content of organic matter and nutrients, salinity, the presence of thermal activity, and the increased content of heavy metals) often differ from those prevailing in natural habitats [3,4].
These sites are frequently subjected to technical reclamation and further management into water, forest, agricultural, or other directions [5,6]. Often, alien species or species not adapted to the local abiotic conditions of postindustrial sites are planted or seeded in these sites, but this does not lead to a successful reclamation [7,8]. Moreover, these sites are often characterised by a mosaic of habitat patches, heterogeneous in space and time [2]. This has a significant influence on their colonisation by species and on the changes that take place in the course of succession both above and below ground, which is reflected in the emergence of novel combinations of species [9,10,11]. As many previous studies have shown, these are not random species assemblages and can persist without human intervention for several years. The vegetation on postindustrial wastelands is formed by species of both native and alien origin, representing different ecological groups, life-forms, life spans, and modes of dispersal [12,13,14,15]. The resulting species assemblages are often dominated at particular stages of succession by single herbaceous (graminoids, legumes) or shrub/tree plant species with functional traits best fitted to the prevailing habitat conditions and complex environmental stresses [1,16,17,18,19]. Species assemblages can significantly influence ecosystem functions, processes, patterns, and species interactions [3]. These patches provide differing sets of services and management challenges, and accounting for these complex dynamics and attributes is essential for effective conservation and restoration planning [20].
Coal-mine sedimentation pools are unique, and they are diverse in terms of size and type of substrate, as well as in processes (high temperature, high salinity, etc.) and habitats that are available for colonisation by species from the local flora, which is constituted mostly by species with an elevated tolerance to environmental stresses. They are a kind of “extra zonal habitat” found in post-coal-mining areas worldwide. Hence, they can be treated as model objects to test whether the observed frequency distribution of species colonising coal-mine sedimentation pools is not random and whether the species and trait composition is independent of environmental factors. In this context, the theory of novel ecosystems and the natural capital concept offer a novel framework for approaching environmental management through the analysis of the ecological functioning of these sites. The application of this new approach requires knowledge about the links between the novel ecosystem operating in postindustrial urban environments and the provision of ecosystem services [20].
The aims of our study were (1) to describe the floristic diversity of the main plant types that occur sedimentation pools, (2) to identify the main environmental gradients responsible for the diversity of vegetation found in sedimentation pools, and (3) to characterise the selection of species’ functional traits along environmental gradients.

2. Materials and Methods

2.1. Site Description

In total, 137 coal-mine sedimentation pools, belonging to 64 coal mines, were the subject of this research, and they are located in the Silesian Uplands (Southern Poland) in the region of the towns of Katowice, Rybnik, Jastrzębie Zdrój, Piekary Śląskie, and Zabrze (Figure 1) [21]. These are earth, or concrete, structures occupying an area of several hectares, located mainly on the wastelands of coal mines. They receive mine drainage water, even from depths down to 1000 m, before being discharged into rivers. Their waters contain considerable quantities of coal dust and mineral compounds. A coal mine has from 1 to 11 sedimentation pools (on average, they have three pools).
The operation cycle of a sedimentation pool comprises several stages: filling the tank with water, clarifying the water, and releasing the treated water into the river. The construction of an earth sedimentation pool involves digging a pit and surrounding it with a dyke. Once the earth sedimentation pool has filled with sludge, it is taken out of operation and left to settle. On the other hand, a concrete sedimentation pool can be cleaned after being filled with sludge, and the sludge is extracted and collected in a place called a sludge pit [1,21]. The composition of groundwater is influenced by the geological structure and extraction depth, and usually, the water is not contaminated by heavy metals. The waste material is fine-grained, hardly permeable, and tends to dry out intensely during dry periods and to become saturated during periods of intense rainfall. On the surface of the coal-mine sedimentation pools, the temperature can sometimes exceed 50 °C [22].

2.2. Collection of the Vegetation Data

The field studies on the vegetation that developed spontaneously in the coal-mine sedimentation pools were carried out between 1998 and 2007 (additional detailed sampling and the analysis took place in subsequent years) [21]. We covered the broadest possible spectrum of variation within the habitat conditions (data on vegetation in space) and time (data on vegetation change over time). For the research on the vegetation studies, we applied the Braun-Blanquet method. The research plot (relevé) had to be large enough to take a representative sample of vegetation. This varied according to the life-form and physiognomy of the dominant vegetation type and according to the number of species which are found in the relevé as the size of the plot increases [23]. For our research on herbaceous vegetation, 147 4 × 4 m2 study plots were established. All vascular plant species were recorded in each plot, and their percentage cover abundances were estimated according to the Braun-Blanquet cover abundance scale [24]. It is based on seven scores: r, +, 1, 2, 3, 4, and 5, where r corresponds to the single individuals of a species; + to few individuals of a species, cover <5%; 1 to numerous individuals of a species that collectively cover less than 5% of the relevé plot; 2 to−5–25% cover; 3 to 25–50% cover; 4 to 50–75% cover; and 5 to 76–100% cover. To perform the analyses, these scores were transformed into average percentage cover abundances (r—0.1, +—0.5; 1—3, 2—18, 3—38, 4—63, and 5—88).

2.3. Determining Plant Species’ Functional Trait Data and Establishing Ecological Groups of Species

We took into account both the quantitative and qualitative functional traits that are connected with persistence, regeneration, and dispersal and that enable species to colonise harsh habitats and persist in them as well as to occupy new open spaces [25]. Data on selected functional traits (canopy height, seed weight, specific leaf area, and life span) were taken from the LEDA Traitbase [26], while reproduction types were gathered from the BiolFlor database [27], and those on life strategies and dispersal mode were collected from Pladias (Database of the Czech Flora and Vegetation, “www.pladias.cz (accessed on 1 August 2022)”. Dispersal strategies were named by the genus names of the typical representatives, including Allium type—mainly autochory, less frequently anemochory, endozoochory, and epizoochory; Bidens type—mainly autochory and epizoochory, less frequently endozoochory; Epilobium type —mainly anemochory and autochory, less frequently endozoochory and epizoochory; Phragmites type—mainly anemochory and hydrochory, less frequently endozoochory and epizoochory. The origin of species in the Polish flora (native vs. alien—kenophyte) was determined by reference to Mirek et al. [28]. Species were attributed to habitats (e.g., ruderal, segetal, meadow, and xerothermic grasslands) according to Oberdorfer et. al. [29] and Matuszkiewicz [30]. Moreover, species were divided into classes: Artemisietea (perennial ruderal species), Molinio-Arrhenatheretea (meadow species), Stellarietea mediae (short-lived ruderal species), Stellarietea mediae (segetal species), Polygono-Poetea (short-lived species of trampled places), Artemisietea vulgaris (species of nitrophilous fringe communities), Festuco-Brometea (xerothermic calcareous species), and Koelerio-Corynephoretea (psammophilous grasslands). Ellenberg’s indicator values (EIVs) of the species occurring in sedimentation pools (L—light, M—moisture, SR—soil reaction, N—productivity, and T—temperature) were taken from the BiolFlor and/or Pladias databases [31,32], and the salinity index was taken from Zarzycki et al. [33].

2.4. Data Analyses

The floristic data collected from the plots were imported into the software package JUICE 7.1 for the editing and analysing of the phytosociological data [34]. The Braun-Blanquet cover abundance scale was transformed into abundance classes according to the rules <1%, 1—3%, 2—18%, 3—38%, 4—63%, and 5—88% [34]. In order to find some repeated combinations of species on the basis of floristic and ecological criteria, the data were subjected to a cluster analysis by using PC-ORD 5 software [35]. We classified the data set using Ward’s group linkage method and the Euclidean distance measure. Ward’s method requires distances between objects to be measured (i.e., they can be projected into Euclidean space, in which the Ward algorithm is operating). Because the percentage cover abundances of species are often skewed, they were log-transformed before analysis. On the basis of the classification, we prepared a synoptic table. Each resulting cluster was described by diagnostic, constant, and dominant species. In European phytosociology, the concept of diagnostic species has been associated with fidelity, which is a measure of species concentration in vegetation units. Several statistical measures are used to calculate fidelity, including the phi coefficient of associations. Unlike the other measures, it is independent of the number of relevés in the data set, and like the hypergeometric form of U and chi-square, it is little affected by the relative size of the vegetation unit. It is therefore particularly useful when comparing species fidelity values among differently sized data sets and vegetation units. The fidelity coefficient of association ranges from −1 to 1 (multiplied by 100 in the synoptic table). The higher the values of the phi coefficient, the more the species occurrences are concentrated in the target site group [36]. Constant species were distinguished on the basis of their frequency in a given cluster (as a threshold, we chose the occurrence of a species in at least 40% of plots in a given cluster), and dominant species were distinguished by taking into account their cover abundance. The ecological interpretation of the classification was conducted by using average Ellenberg’s indicator values (EIVs) for L—light, T—temperature, F—moisture, SR—soil reaction, and N—nutrients, calculated for each of the relevés [31,34]. The differences in the environmental variables between the two clusters at each level of clustering were tested using the Mann–Whitney U test in Statistica 13 [37]. Differences significant at p < 0.05 were displayed. Moreover, we calculated the Shannon–Wiener’s diversity index (H’), dominance (D), species richness (S), and evenness (E) for each sample plot [34] in order to compare vegetation types that developed in coal-mine sedimentation pools and to relate them to environmental gradients. Richness (S) is the simplest metric of diversity and means the number of species. The Shannon–Wiener diversity index (H’) combines both the number of species and their abundance, has its foundations in information theory, and represents the uncertainty about the identity of an unknown individual. Evenness represents the degree to which individuals are split among species, with low values indicating that one or a few species dominate and high values indicating that relatively equal numbers of individuals belong to each species. It is not calculated independently, but rather is derived from compound diversity measures such as H’. A dominance index (D) quantifies the dominance of one, or a few, species in a community, and higher values indicate higher dominance (see calculations in [38,39]). The nomenclature for vascular plants followed that of Mirek et al. [28].
The relationships between environmental variables and species data were examined using canonical correspondence analysis (CCA) in CANOCO 5.0 for Windows [40]. Because we did not perform physicochemical analyses on the substrate, we calculated (for each sample plot) the mean of the EIVs for species occurring in a given plot [31]. Mean EIVs, which are often used as surrogate of measured environmental variables, inherit two types of information, one derived from external information about species ecological behaviour (i.e., tabulated species indicator values) and another derived from species composition data themselves. EIVs are estimates of species ecological optima along ecological gradients [41]. We took into account light, continentality, moisture, nutrients, soil reaction, and salinity. In comparison to the measured environmental factors, mean EIVs were calculated from the species-plot vegetation matrix.
In order to examine the selection of species traits along environmental gradients, we conducted the RLQ analysis using the ade4 package in R software [42,43]. We included three tables (L—species × plots), (Q—species × functional traits), and (R—plots × environmental variables). The R- and Q-tables first underwent principal component analysis (PCA) (the Q-table using the Hill and Smith method for the analysis of mixed quantitative and qualitative data), and the L-table underwent correspondence analysis (CA). The clusters within RLQ component space were identified on the basis of Euclidean distances between species along the first two RLQ axes and clustered via Ward’s hierarchical clustering. Moreover, the Calinski–Harabasz stopping criterion was used to determine the optimal number of clusters. Well-defined clusters have a large between-cluster variance and a small within-cluster variance. The optimal number of clusters corresponds to the solution with the highest Calinski–Harabasz index value. The degree of correlation between the chosen functional traits and response groups was expressed as correlation ratios [44].

3. Results

3.1. The Floristic Differentiation of Plant Communities Occurring on Coal-Mine Sedimentation Pools

A species pool of 170 vascular plants resulted from the species which were identified in the vegetation patches of plant communities developing in the studied coal-mine sedimentation pools. Among the species that were recorded in more than 60% of our sample plots were Tussilago farfara, Puccinellia distans, Calamagrostis epigejos, Daucus carota, Taraxacum officinale, Artemisia vulgaris, and Achillea millefolium. Most other species occurred at low frequencies (i.e., in less than 6% of sample plots).
As a result of the cluster analysis of 144 relevés, 14 interpretable clusters were identified (Figure 2, Table 1). First, the classification at the top level of the tree results in two separate groups of communities, which can represent different stages of succession in sedimentation pools. They differ also in reference to most EIVs. The first group (hereafter, group A) includes mostly those species where the initial communities develop in open sites, with a simple, often-single-layer structure, and often develop in saline places. The species constituents prefer wet sites, with neutral soil pH and lower productivity N. The second group (hereafter, group B), on the other hand, comprises communities developing in the later stages of succession. These are dominated by taller plants, biennial and perennial species with a two- or three-layer community structure. Species which belong to this group prefer drier sites, with higher soil reaction, lower productivity, and lower values of light intensity. The communities in the first group (A) have a simple structure and are either species-poor and dominated by one or two herbaceous species (e.g., Atriplex prostata spp. prostata, Puccinellia distans) or are characterised by a greater number of species, with varied cover abundances, and are distributed more evenly in the community (e.g., Chenopodium rubrum, Chenopodium glaucum). In turn, with succession, the structure of the communities becomes more complex, and the number of species in the communities, the diversity of the communities, and the uniformity of their distribution in the community increase (the Daucus carota community (com.), the Artemisia vulgaris-Tanacetum vulgare com., the Medicago lupulina com.) (Table 1). In turn, by going down the classification tree, four other clusters were distinguished. The third group (hereafter, group C) includes species-poor communities, with a loose structure, whose physiognomy is created by species of the Chenopodium genus (Ch. album, Ch. glaucum, Ch. rubrum). The fourth group (hereafter, group D) comprises low-turf communities, dominated by Plantago intermedia, and Atriplex prostrata spp. prostrata. The low clump-forming grass Puccinellia distans is present at a high frequency within this cluster, which has different cover abundance in the vegetation patches. Conversely, the fifth group (hereafter, group E) includes communities of trampled places formed in areas exposed to various mechanical damage (Chamomilla suaveolens, Polygonum aviculare) and ruderal communities consisting of tall herbaceous plants (Melilotus alba, Tanacetum vulgare, Calamagrostis epigejos, Solidago canadensis). These are formed mainly by the expansive species Calamagrostis epigejos and Tanacetum vulgare, as well as by the invasive Solidago canadensis. Finally, the sixth group (hereafter, group F) includes only one community, dominated by the pioneer species Tussilago farfara.
The number of diagnostic species recorded in the communities ranged from 0 (the Tussilago farfara community, the Puccinellia distans community) to 10. Brief descriptions of the communities are given below.
The number of species in patches of the Chenopodium glaucum-Chenopodium rubrum community (Table S1 in Supplementary Materials, col. 1, Chg-Chr) ranged from 4 to 14 species (7.43 on average) with 4 diagnostic species. The dominant species in these patches were those belonging to the genus Chenopodium (Ch. glaucum, Ch. rubrum). Chenopodium glaucum is a creeping plant growing up to 20 cm in height, whereas Chenopodium rubrum is a species growing up to 40 cm. In addition to the diagnostic and dominant species, these patches were composed of Atriplex prostrata spp. prostrata, Calamagrostis epigejos, and Festuca rubra. The Shannon–Wiener diversity index for this community was 0.88 and the dominance index 0.60.
The Deschampsia caespitosa-Cirsium arvense community (Table S1, col. 2, Dc-Ca) consisted of six to seven species (6.33 on average). It was distinguished on the basis of five diagnostic species. The floristic composition of these patches included Bromus hordeaceus, Equisetum arvense, and Rumex acetosa, in addition to the dominant ones, Cirsium arvense, and Deschampsia caespitosa. The common species present in the community were Cirsium arvense, Deschampsia caespitosa, Chenopodium glaucum, and Puccinellia distans. The Shannon–Wiener diversity index was 1.43 and the dominance index 0.45.
The short-lived ruderal species Chenopodium album was the diagnostic and dominant species of the Chenopodium album community (Table S1, col. 3, Cha), which included 2 to 16 species (7.88 on average). Chenopodium album had a cover abundance above 30% in at least 15% of the relevés. This species grows up to 1 m high. It was accompanied by Tussilago farfara, Puccinellia distans, Chenopodium glaucum, Ch. rubrum, and Sonchus asper. The mean value for the Shannon–Wiener diversity index was 1.25 and the dominance index 0.44.
The overwhelming dominant, as well as diagnostic, species in patches of the Plantago intermedia community (Table S1, col. 4, Pi) was Plantago intermedia. This small species reaches up to 20 cm in height. Another dominant species in the patches was Puccinellia distans. Plantago intermedia forms mostly large-scale patches (100 to 300 ha). This species-poor community had from four to nine species (5.7 on average). The Shannon–Wiener diversity index was 0.98 and the dominance index 0.43.
The Atriplex prostrata spp. prostrata community (Table S1, col. 5, Ap) consisted of 2 to 11 species (mean 6.13). The diagnostic and dominant species in the patches was Atriplex prostrata spp. prostrata, and it showed considerable morphological variability. Individuals of Atriplex prostrata are fleshy and showy, and their decumbent stems create ovals of 35 to 40 cm in diameter. Some of these vegetation patches are codominated by Puccinellia distans. Atriplex prostrata spp. prostrata co-occurred in patches with Tussilago farfara, Calamagrostis epigejos, Chenopodium glaucum, and Polygonum aviculare. The Shannon–Wiener diversity index was 1.20 and the dominance index 0.42.
Patches of the Puccinellia distans community (Table S1, col. 6, Pd) occurred with 2 to 13 species (mean 5.94). These patches had no diagnostic species. The low growing grass Puccinellia distans dominated in the patches. It co-occurred with Tussilago farfara, Calamagrostis epigejos, Chenopodium glaucum, and Daucus carota. Puccinellia distans forms clumps growing up to 0.5 m. The individuals of these grass species were up to 70 cm in height. The Shannon–Wiener diversity index was 0.88 and the dominance index 0.61.
The Chamomilla suaveolens-Polygonum aviculare community (Table S1, col. 7, Chs-Pa) is a low growing mat-forming community with four diagnostic species. The patches consisted of 7 to 16 species (11.0 on average). The Shannon–Wiener diversity index was 1.49 and the dominance index 0.35. The floristic composition of patches comprised Tussilago farfara, Tanacetum vulgare, Calamagrostis epigejos, Taraxacum officinale, Puccinellia distans, Cerastium arvense, and Cirsium vulgare.
The Medicago lupulina community (Table S1, col. 8, Ml) is a low growing sward created by the small legume Medicago lupulina and, in some patches, also by Echium vulgare. Medicago lupulina is an annual short-lived perennial plant. It measures from 15 to 80 cm in height, and its delicate stems often lie flat at the beginning of growth and become erect later. In these patches, 11 to 35 species occurred (16.62 on average). The Shannon–Wiener diversity index was 1.96 and the dominance index 0.27. It had six diagnostic species. The floristic composition of patches comprised ruderal species (Artemisia vulgaris, Calamagrostis epigejos, Echium vulgare, Melilotus alba), meadow species (Daucus carota, Taraxacum officinale), and Puccinellia distans.
The Melilotus albus community (Table S1, col. 9, Ma) is a relatively species-poor community, and it was dominated by the leguminous species Melilotus alba. It grows up to 60 cm. These particular patches consisted of five to nine species (7.0 on average). The Shannon–Wiener diversity index was 1.08 and the dominance index 0.53. Calamagrostis epigejos, Echium vulgare, and Medicago lupulina occurred in these patches along with the dominant.
Daucus carota community (Table S1, col. 10, Dc) had five diagnostic species. Daucus carota is a biennial species that can grow up to 40 cm and gives the patches a specific physiognomy. These patches consisted of 7 to 43 species (14.45 on average). The Shannon–Wiener diversity index was 1.99 and dominance index 0.23. The floristic composition of patches is made of meadow (Achillea millefolium, Poa pratensis, Taraxacum officinale) and ruderal species (Artemisia vulgaris, Calamagrostis epigejos, Solidago candensis, and Tussilago farfara).
The Artemisia vulgaris-Tanacetum vulgare community (Table S1, col. 11, Av-Tv) had six diagnostic species. The patches consisted of 6 to 34 species (12.83 on average). The tall herbs Artemisia vulgaris and Tanacetum vulgare occurred with a cover abundance of at least 30% in these patches. These perennial plants grow up to 1 m in height. The Shannon–Wiener diversity index was 1.57 and the dominance index 0.37. The floristic composition of these patches comprised biennial and perennial ruderals (Calamagrostis epigejos, Echium vulgare, and Tussilago farfara) and meadow species (Taraxacum officinale).
The Calamagrostis epigejos community (Table S1, col. 12, Ce) consisted of two to nine species (6.25 on average). The community had two diagnostic species: Hieracium pilosella, and Crepis biennis. Calamagrostis epigejos, Cirsium arvense, Solidago gigantea, Tanacetum vulgare, and Taraxacum officinale were among the common species co-creating the community. The Shannon–Wiener diversity index was 0.95. Thanks to the high abundance of Calamagrostis epigejos, in these patches the mean value of the dominance index was 0.56, and they had an evenness of 0.48.
The Phragmites australis-Solidago canadensis community (Table S1, col. 13, Pha-Sc) comprised seven to nine species with eight diagnostic species. The constant species were Calamagrostis epigejos and Tussilago farfara. The average Shannon–Wiener diversity index was 1.64 and the dominance index 0.28.
In patches of the Tussilago farfara community (Table S1, col. 14, Tf), between 2 and 11 species occurred (mean 5.17). Tussilago farfara was the dominant and diagnostic species in these patches. This pioneer species formed small patches in the initial stages of succession on sites that undergo frequent disturbances (e.g., landslides). Individuals of Tussilago farfara are scarlet and twisted and had wrinkled leaves in these places. In addition to Tussilago farfara, the constant species in patches were Calamagrostis epigejos and Daucus carota. The Shannon–Wiener index was 0.89 and the dominance index 0.58.

3.2. The Relationships between Vegetation That Developed in Coal-Mine Sedimentation Pools and Environmental Data

The CCA analysis (Figure 3) showed a relationship between the floristic composition of vegetation patches and the mean Ellenberg’s indicators values. All explanatory variables used in the analysis accounted for 17.85% of the total variation. The first CCA axis explains 6.16% of the variation and determines the main environmental gradient, associated with the moisture content, substrate reaction, and salinity. On the right side of the diagram (Figure 3) occur communities dominated by low growing plants such as Puccinellia distans, Plantago intermedia, and Atriplex prostrata spp. prostrata. Agrostis stolonifera and Phragmites australis are also distributed along here. In saline sites, there are species such as Chenopodium glaucum, Ch. rubrum, Atriplex prostrata spp. prostrata, and Puccinellia distans. Five species (Bulboschoenus maritimus, Spergularia salina, Juncus ranarius, Scirpus lacustris, and Puccinellia distans) were recorded growing in habitats with elevated soil salt content in the substrate. On the left side of the figure are distributed communities in the floristic composition, where species confined to drier habitats occur with elevated pH values, such as the Medicago lupulina com., the Daucus carota com., the Tussilago farfara com., and the perennial herb community of Artemisia vulgaris-Tanacetum vulgare (Figure 3).
In turn, species related to the gradient of fertility and insolation are located along the second axis of the CCA (which explains 3.79% of the variation, Figure 3). In the more fertile, open areas, the Chenopodium album com., the Medicago lupulina com., Chamomilla suaveolens-Polygonum aviculare, Atriplex prostrata spp. prostrata, and the Melilotus alba com. occur. In contrast, on the opposite side occur communities dominated by perennials Phragmites australis, Tanacetum vulgare, and Dacucus carota.

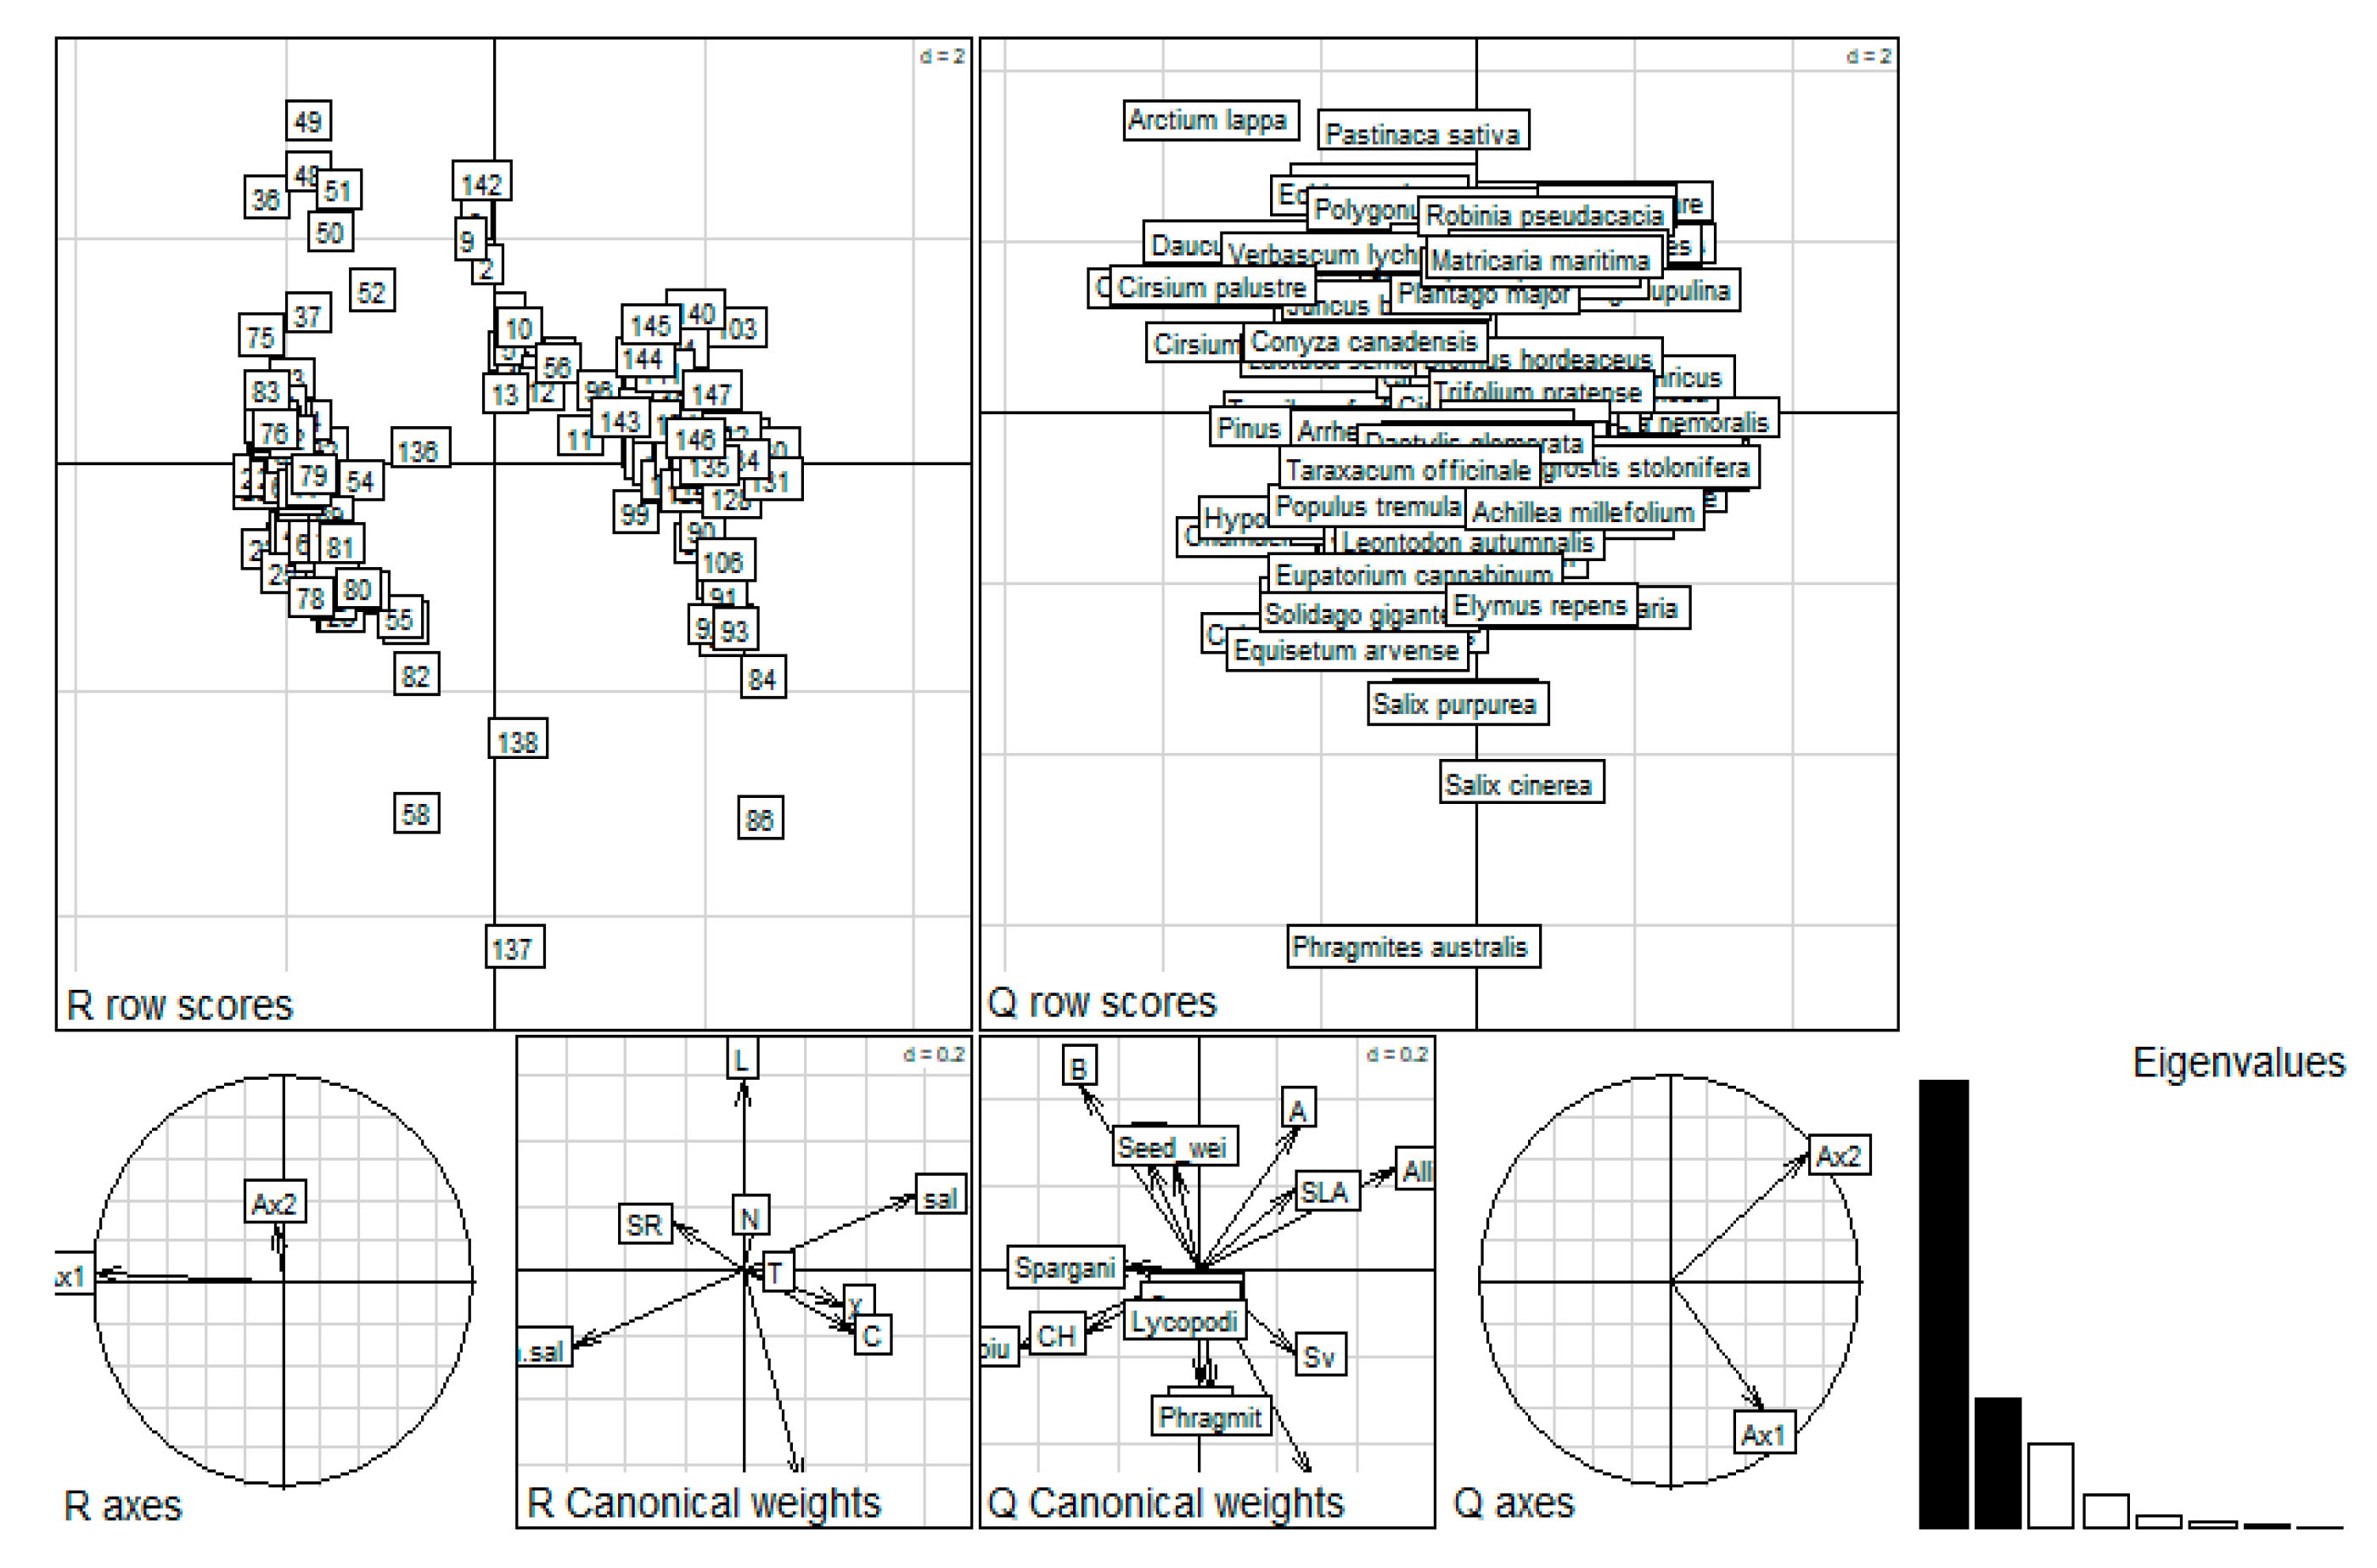
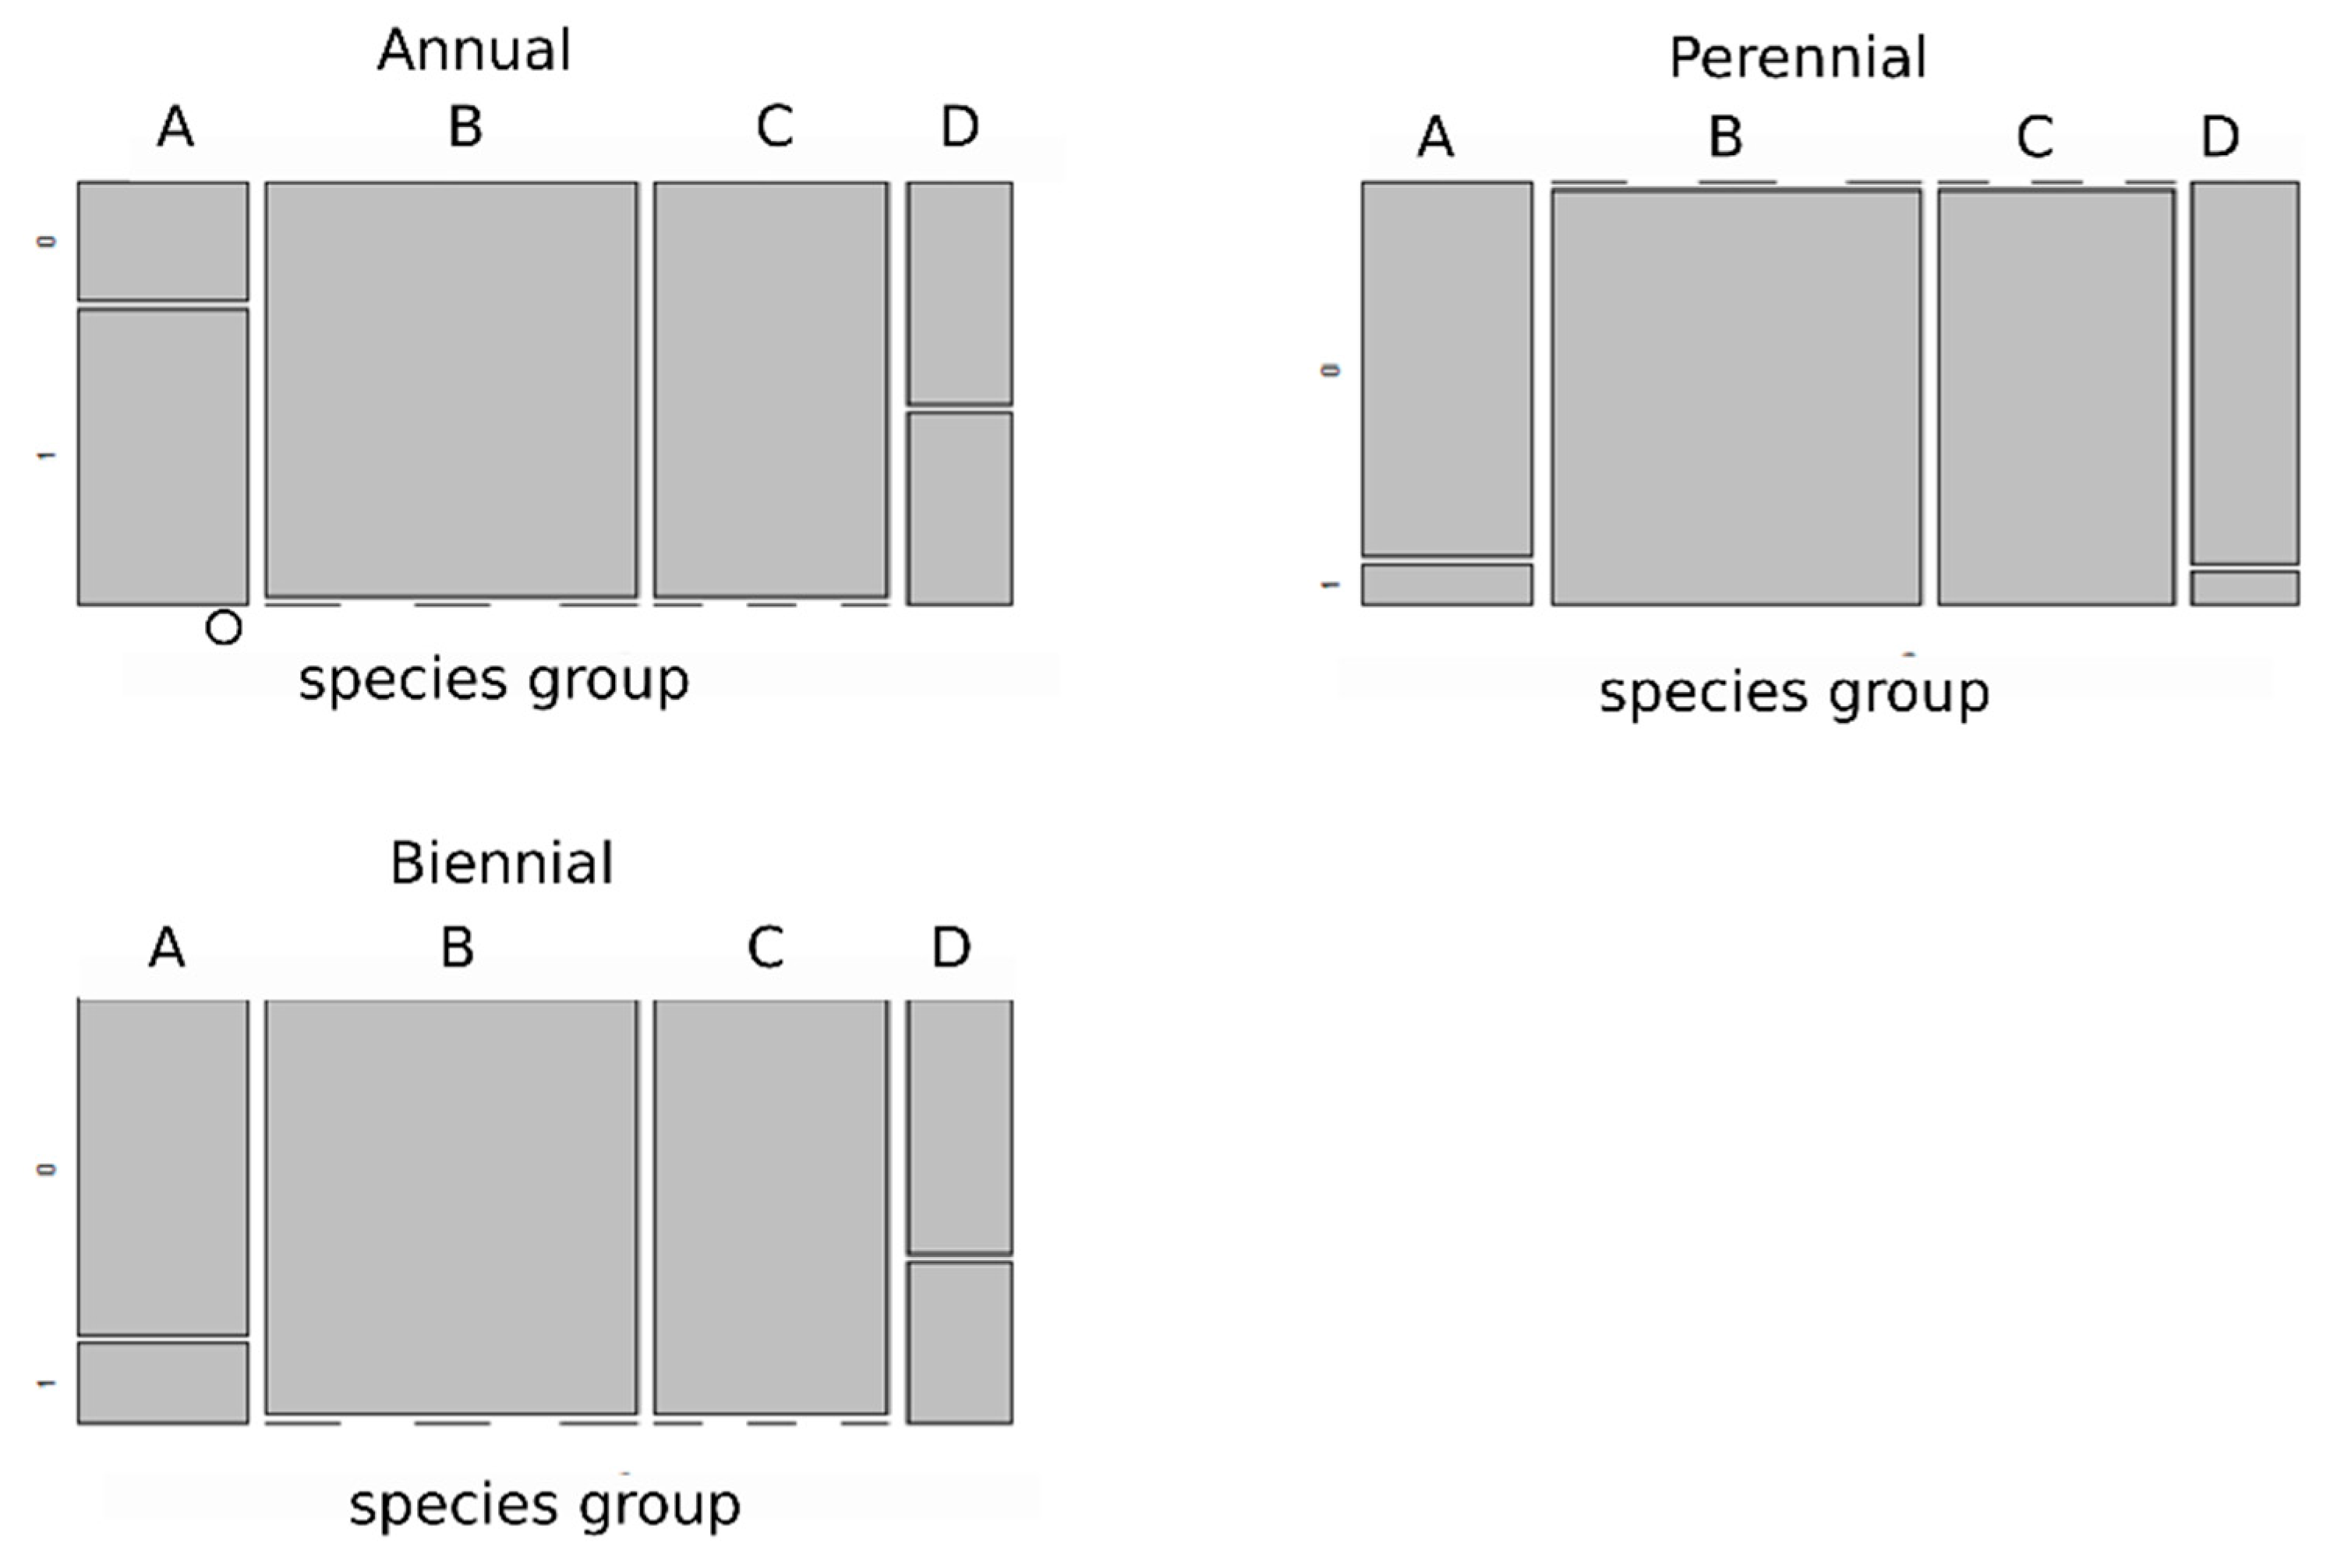
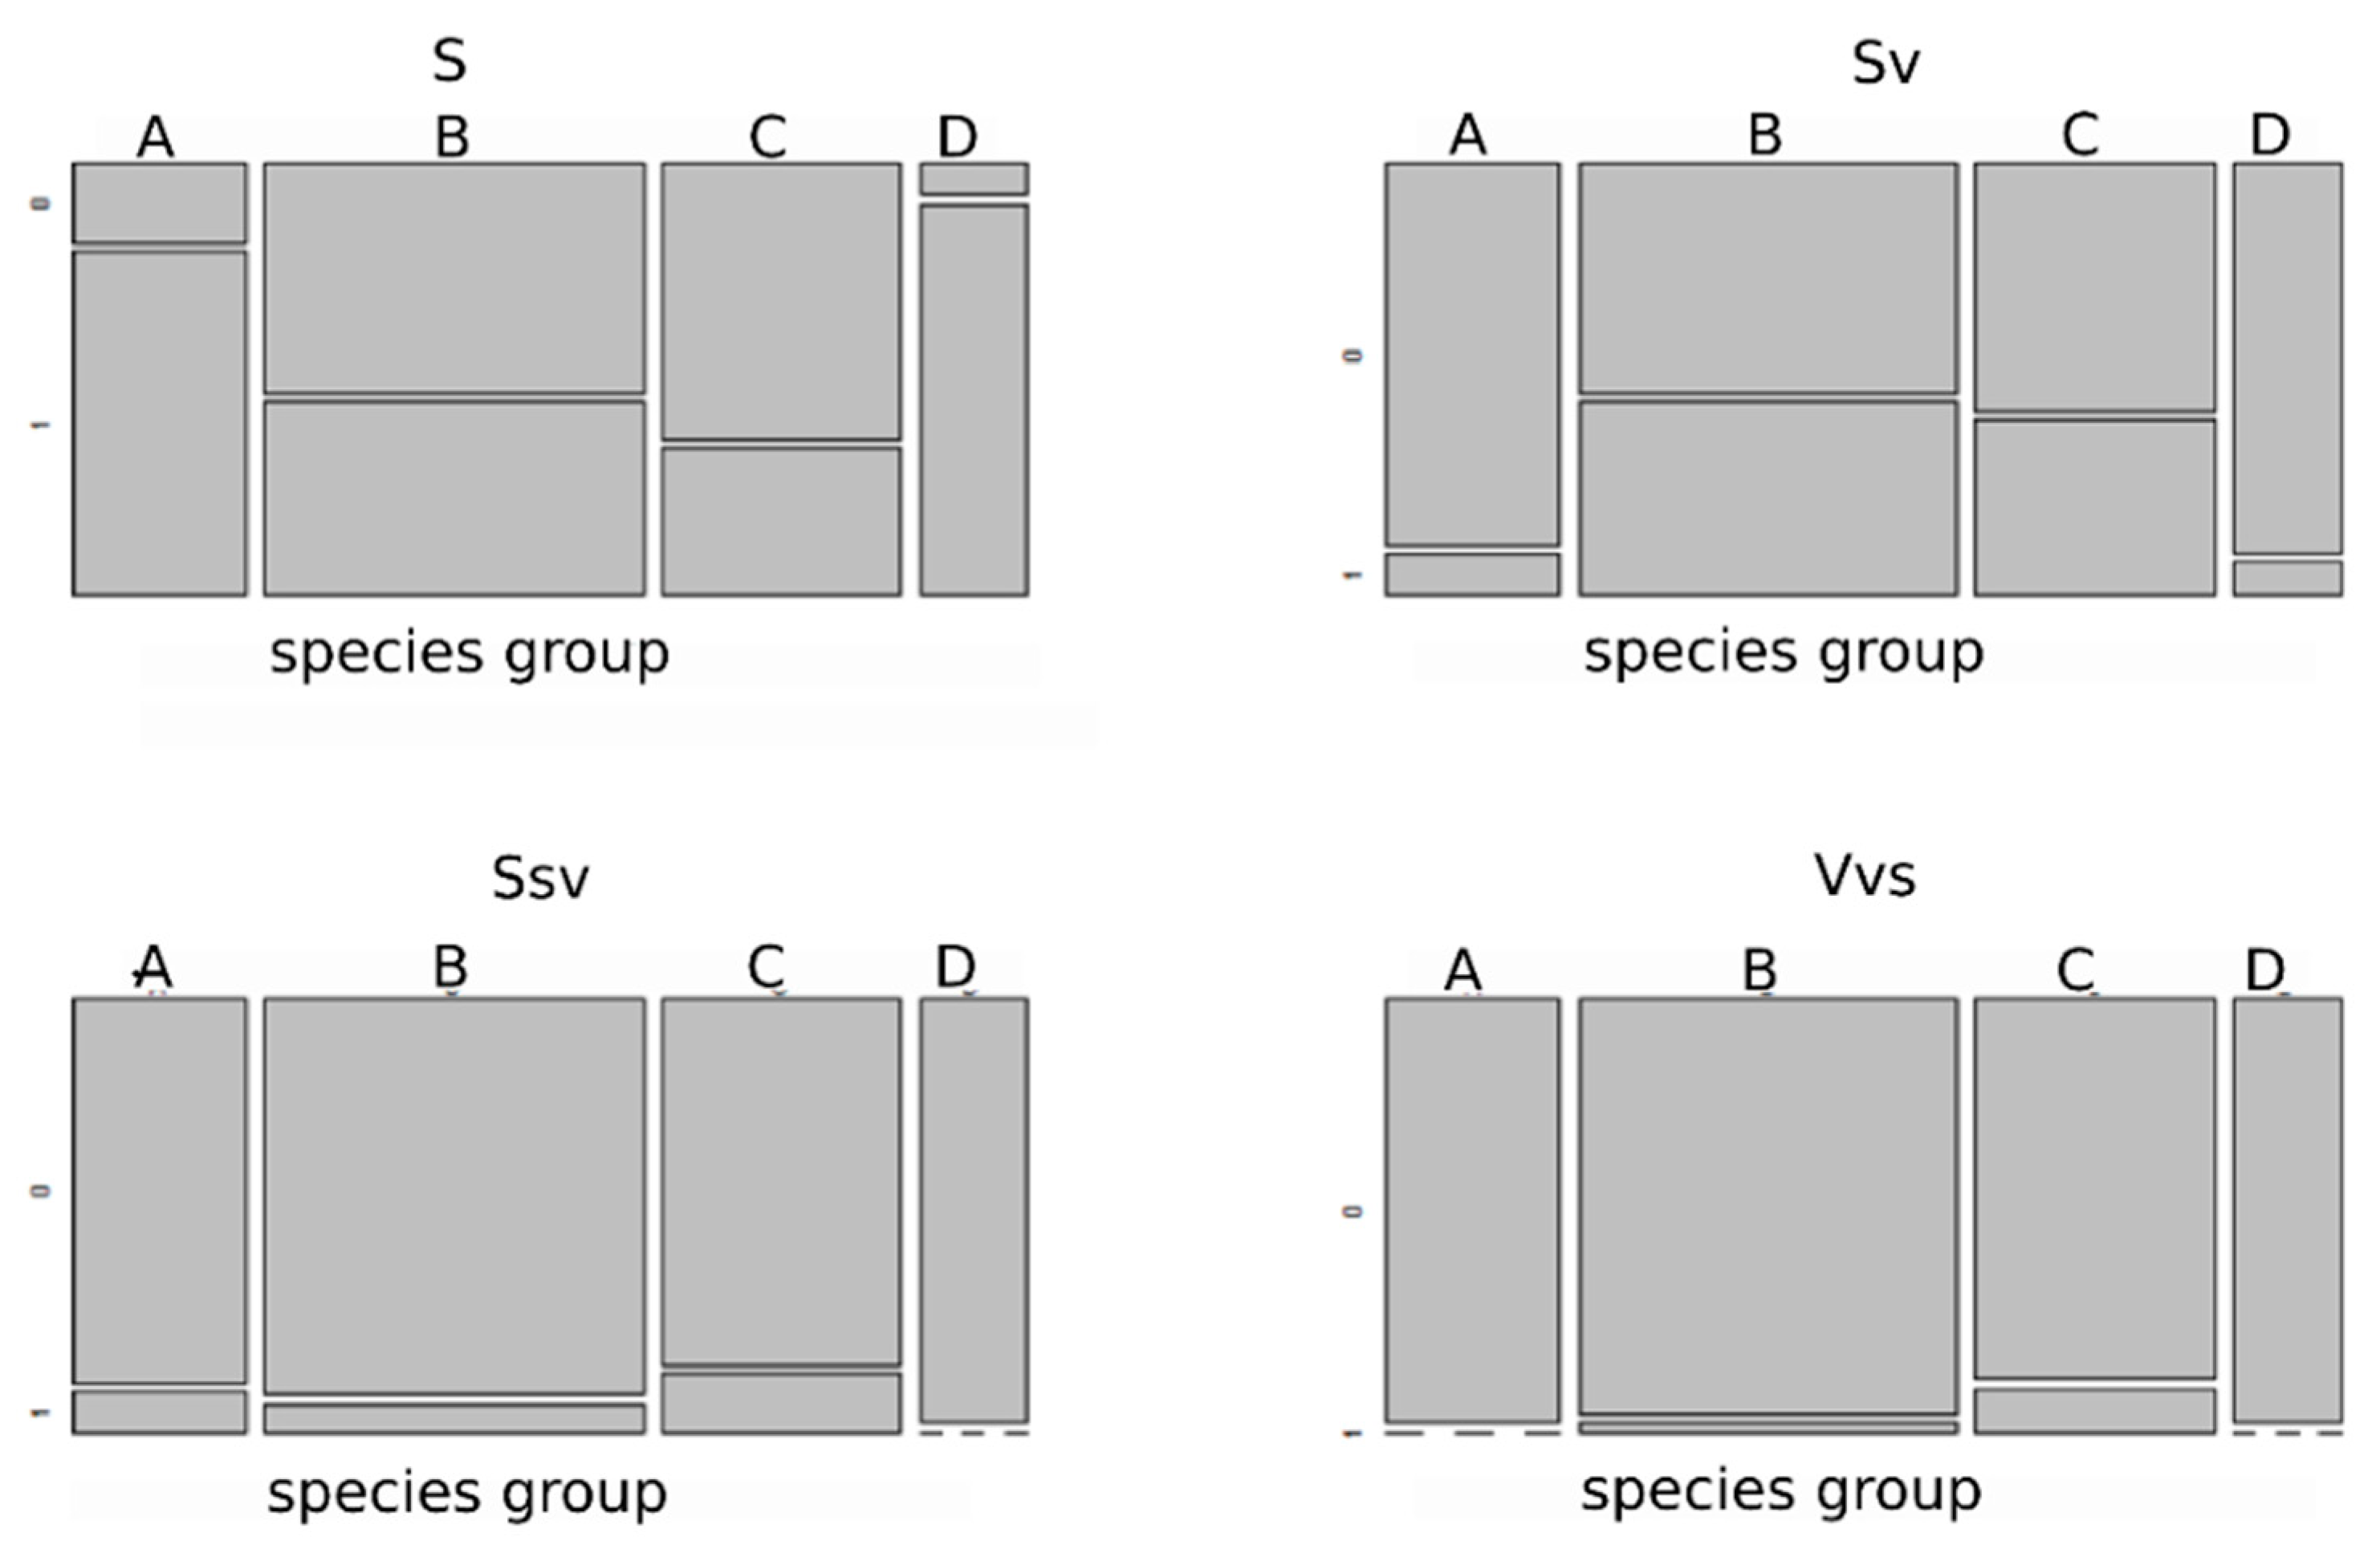
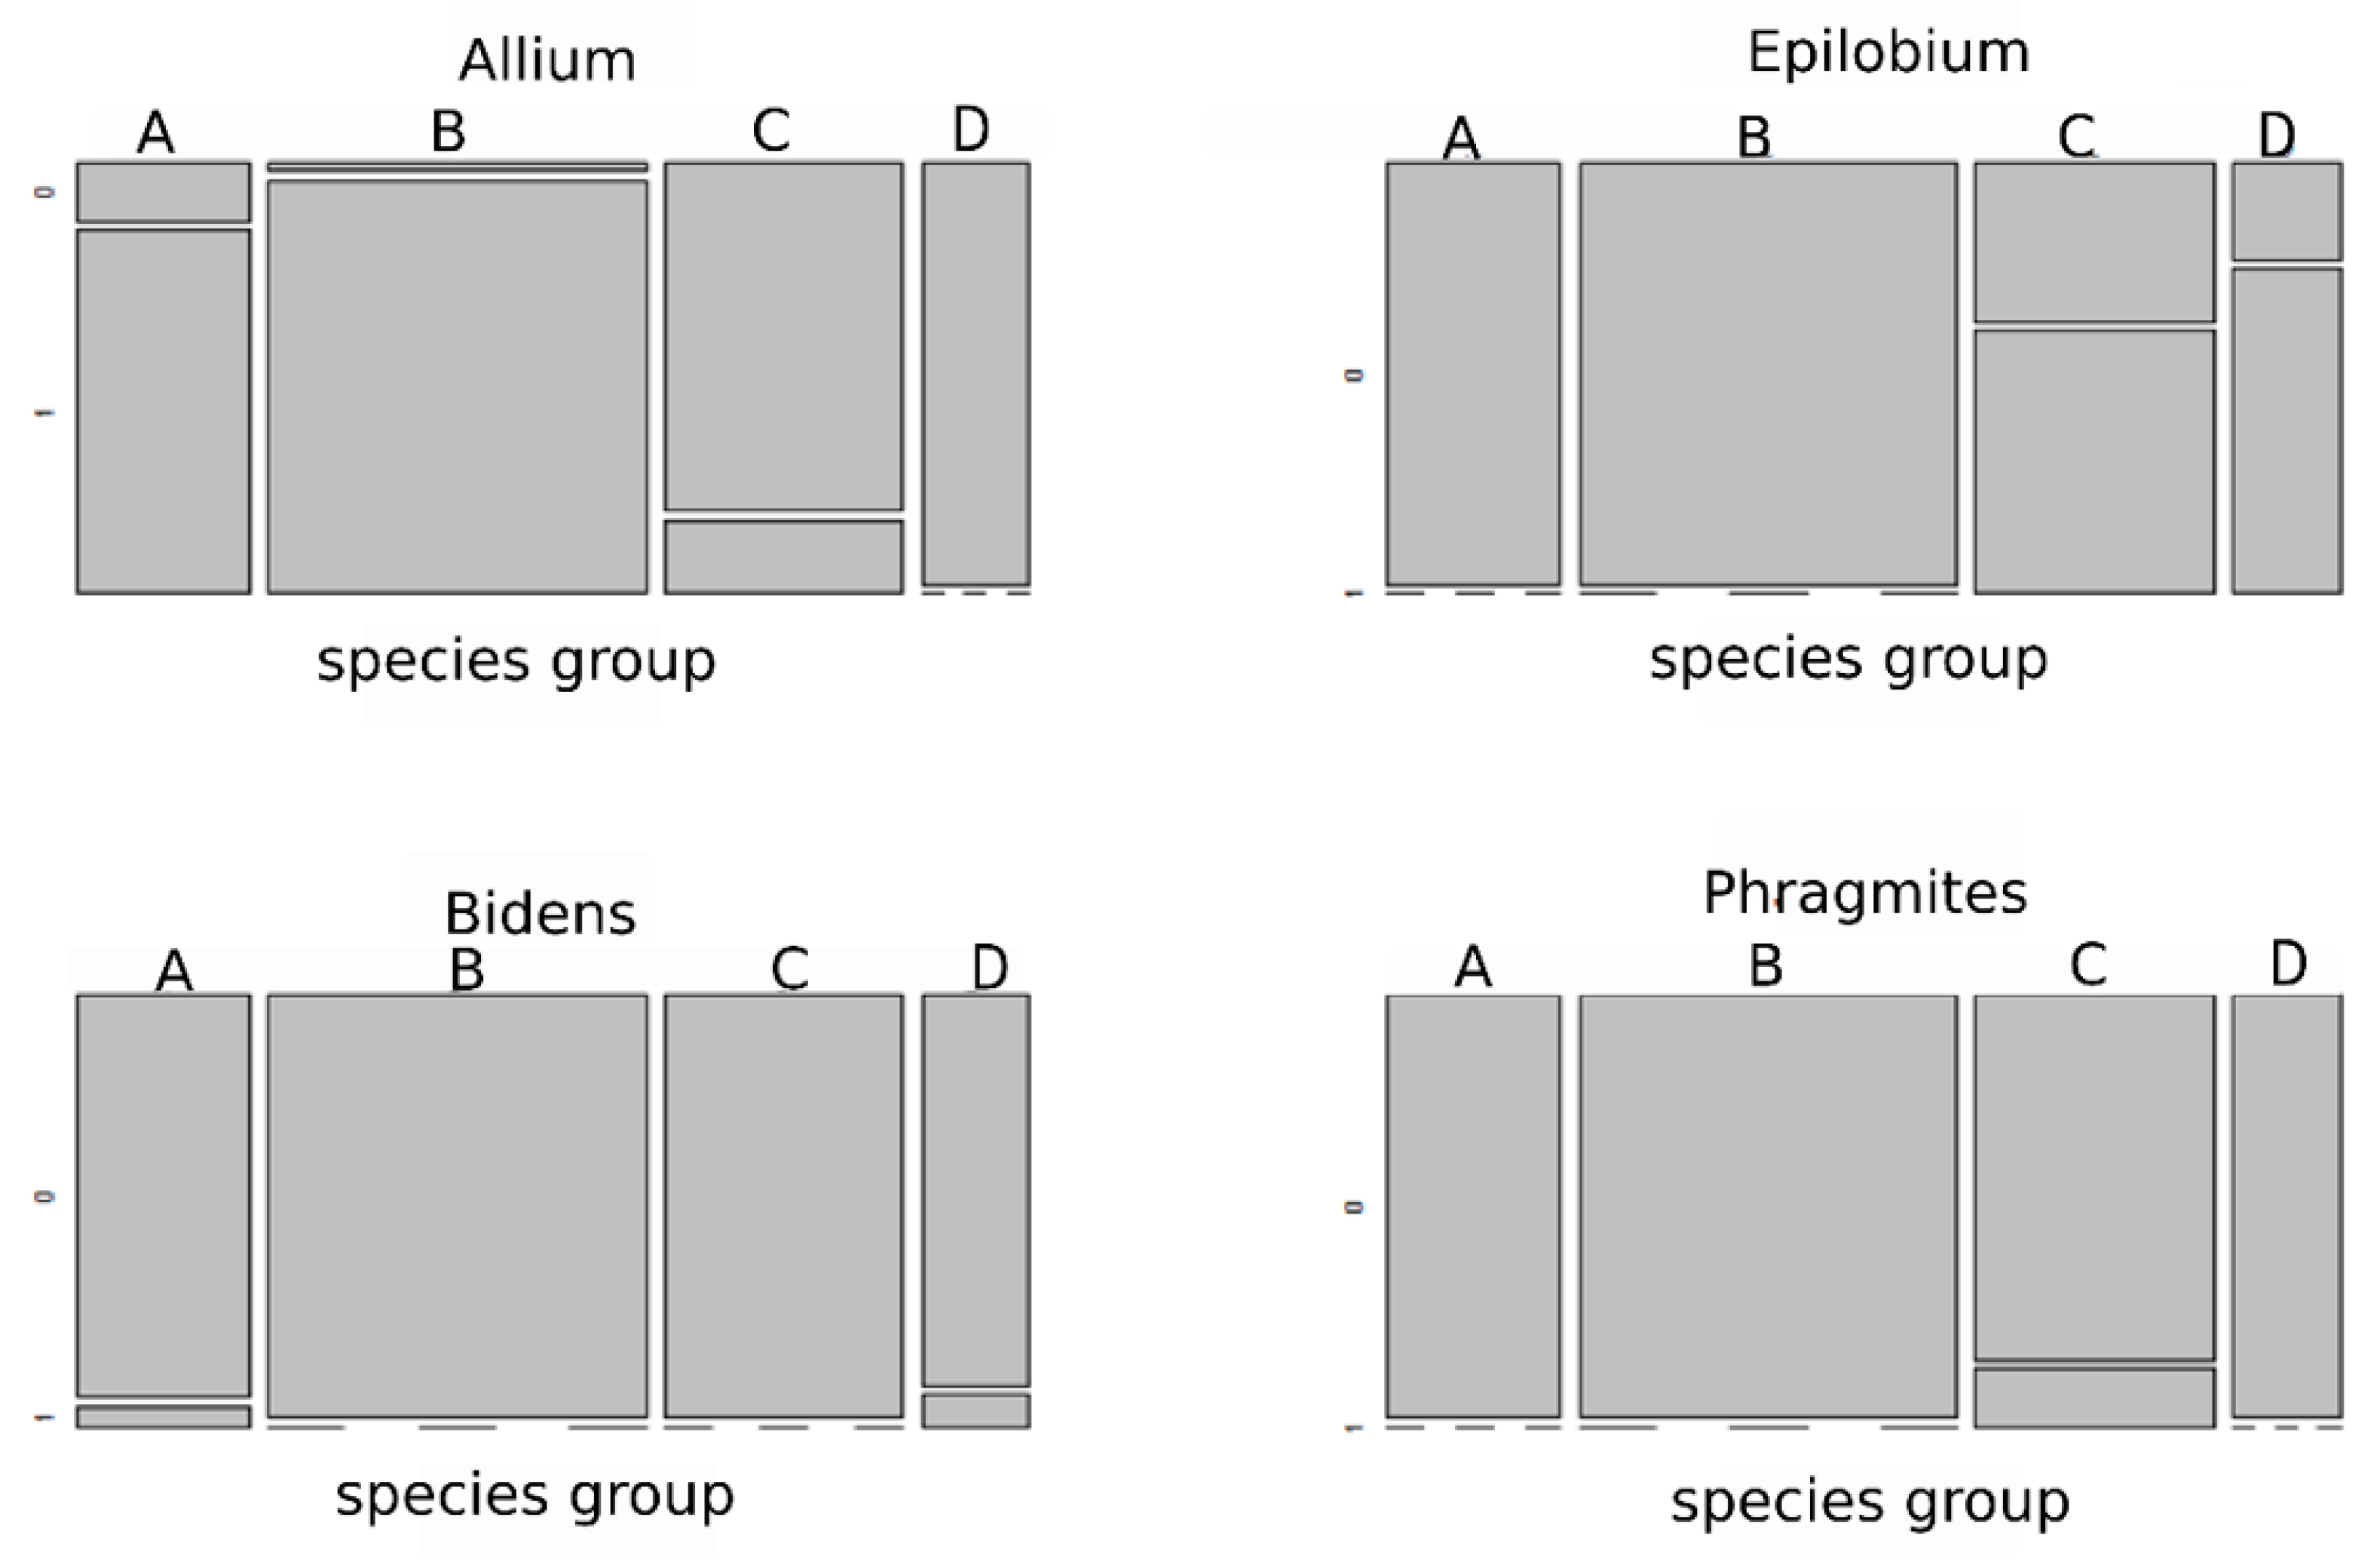
3.3. Selection of Species Traits along an Environmental Gradient

The bar plot of the eigenvalues (Figure 4, bottom right) highlights the importance of the first two axes in the interpretation of the main structure traits–environment relationships. The first axis explains 65% of the variance in the data, whereas the second axis accounts for 15% and can also be used to interpret the main structures of the traits–environment relationships.
Habitat diversity is reflected in the set of species functional traits forming the plant communities that developed in the coal-mine sedimentation pools. These species also reflected the complex environmental stresses which occurred in these locations, such as periodic water shortage, excessive elevated temperature, or salinity. Two groups of plant communities consisting of annuals and biennials or perennial species are distinguishable. Species occurring on the left side of the diagram are annuals, with higher specific leaf area index values (SLA), which reproduce by seeds and vegetatively and are adapted to different kinds of disturbances (Poa annua, Matricaria maritima spp. maritima, Polygonum aviculare). In contrast, species on the right-hand side of the diagram are taller perennial plants, which reproduce mainly by seed and vegetatively and which form stable communities in the later stages of succession. Some species co-occurring in patches in this group are biennial species (Melilotus alba, Echium vulgare). On the other hand, along the second axis of the RLQ are distributed perennial, clonal species, which reproduce mainly vegetatively (Calamagrostis epigejos, Elymus repens, Solidago gigantea, Phragmites australis).
Four groups of species (response groups) were distinguished as a result of the species classification using the Calinski–Harabasz criterion. These groups differ regarding traits connected with species persistence, regeneration, and dispersal (Figure 5). The first group (group A) consists of 16 species, mainly annuals and biennials, of low stature, larger SLA index, reproducing by seed and vegetatively, and dispersed mainly by wind (Figure 6, Figure 7 and Figure 8). Additionally, species in trampled places (Chamomilla suaveolens, Polygonum aviculare, Poa annua), short-lived ruderal plants (Sisymbrium altissimum, Chenopodium album), and mudflat plants (Bidens tripartita, Polygonum hydropiper, Ranunculus sceleratus) were assigned to this group. The second group (group B) has 46 species and comprises mainly perennial species, reproducing by seeds and vegetatively. The third group (group C) has 29 species. These are mainly tall perennial species that produce lighter seeds, reproduce mainly vegetatively (with an average SLA), and have diverse propagation strategies, species such as Allium, Epilobium, and Phragmites (Figure 6, Figure 7, Figure 8 and Figure 9). This group includes Phragmites australis, Solidago gigantea, Tanacetum vulgare. The fourth group (group D) includes 13 species. These are mainly annual or biennial plants (Conyza canadensis, Arctium lappa, Daucus carota, Cirsium vulgare) with an average height of 0.4 m. These plants are characterised by a lower SLA index, produce heavier seeds, and are dispersed mainly via anemochory and autochory and less frequently by endozoochory and epizoochory in comparison to other groups (Figure 6, Figure 7, Figure 8 and Figure 9).

4. Discussion

4.1. Floristic Composition of Communities Occurring in Coal-Mine Sedimentation Pools

The vegetation of postindustrial sites comprises a mosaic of anthropogenic communities representing different stages of succession. These communities are formed thanks to the interaction of abiotic factors (physicochemical parameters of the substrate) [4,45,46,47], topographic factors (exposure, slope, altitude) [48,49,50,51], and biotic factors (inter- and intraspecies competition) and under microclimatic conditions [52,53]. Similar to the vegetation of urban ruderal habitats, stochastic factors also play essential roles in their formation, such as disturbances of varying intensity and time duration associated with the dumping of waste material on the site, destroying the existing vegetation cover, re-exposing the substrate, the landslides of dumped material, and the construction of access roads or railway tracks [12]. The research carried out on brownfield sites has repeatedly shown that the floristic composition of plant communities in these places differs from the communities that develop on natural or seminatural sites [1,16,54]. Frequently, it is impossible to distinguish the so-called characteristic combinations of species that would allow us to assign them to associations described in the Braun-Blanquet phytosociological system [30]. This prompted us to detect repeated combinations of species on the basis of floristic and ecological criteria. In this article, we applied a method for classifying vegetation types which had previously been used in the classification of vegetation of ruderal habitats [12].
In coal-mine sedimentation pools, we distinguished 14 repeated combinations of species on the basis of floristic criteria and ecological indicator values (L, T, C, F, R, and N). Depending on their successional stage, they were dominated by annual or perennial grasses (e.g., Puccinellia distans, Calamagrostis epigejos, Phragmites australis), legumes (e.g., Medicago lupulina, Melilotus alba), or other herbaceous plants (e.g., Chenopodium album, Chenopodium glaucum, Daucus carota, Tussilago farfara). In the early stages of succession on the carboniferous gauge, the vegetation was dominated by Daucus carota, Melilotus alba, Medicago lupulina and the grasses Festuca spp., Arrhenantherum elatius, while Calamagrostis epigejos, Solidago gigantea and/or tree species (Robinia pseudoacacia, Populus tremula, Pinus sylvestris) prevailed in the later stages of succession.
Depending on the abundance of a dominant species, the diversity of communities varied from 0.86 to 1.96 and was highest in the Medicago lupulina community. These communities are often poor in species, and most of them, apart from the dominant, occur only sporadically in vegetation patches. The value of the dominance index was the highest (D > 0.5) in the case of the Puccinellia distans community, Melilotus alba community, Calamagrostis epigejos-Solidago gigantea community, and Tussilago farfara community. Comparing the communities of sedimentation pools with the vegetation of ruderal habitats, dominated by similar species, we can conclude that communities of ruderal habitats were definitely richer in species, and they were also characterised by higher values of the Shannon–Wiener diversity index ([12], Table S2). In our previous studies conducted on hard coal-mine spoil heaps, the mean values of the Shannon–Wiener and dominance indices from T. farfara plots were lower in comparison to those plots dominated by other plant species (H’ = 1.11; D = 0.53). In contrast, the highest values of the Shannon–Wiener diversity index, as well species richness, were recorded in the plots dominated by Poa compressa (H’ = 1.92, S = 13.87) and Daucus carota (H’ = 1.82, S = 12.80). These plots were also characterised by the lowest values for evenness [39]. The Simpson index and the Shannon–Wiener index of vegetation in an abandoned gold mining area (Altai Mountain, Northwest China) showed a significant downward trend and demonstrated significant differences from the original grassland. The plant diversity in the abandoned gold mining area was reduced by 86.67%, indicating that the grassland was damaged after mining, the plant species were seriously affected, and the number of plant species was greatly reduced [55].
The floristic composition of the communities, which developed in coal-mine sedimentation pools, included species representing different ecological groups. In addition to short and perennial ruderal species, there were meadow or grassland plants, forest, aquatic, and rush species that occupy local depressions or ditches filled with water. Moreover, salt marsh species can occur on the substrate of sedimentation pools where underground saline waters are stored. On the other hand, on coal-mine spoil heaps, the number of patches dominated by species representing various socioecological groups was uneven and depended on the particle size of the substrate [4]. A significant proportion of the vegetation patches, in which the dominant species were representatives of ruderal (946), forests (259 patches), segetal (83), meadows (68), grasslands (51), salt marshes (30) and karst (53) communities, was recorded on gravelly substrates on coal-mine spoil heaps [1,16].

4.2. Abiotic Factors That Determine the Floristic Composition of Vegetation Patches

Studies conducted on brownfield sites have repeatedly highlighted the relationships between abiotic factors and the floristic diversity of brownfield vegetation [4,48,56,57]. The influence of physicochemical parameters on the formation and activity of soil microbial or fungal communities has also been demonstrated [39,58,59]. In our previous research conducted on coal-mine spoil heaps, we detected that soil variables such as the available potassium content, total carbon content, soil reaction, available magnesium content, water holding capacity, Na+, EC, and percentage of the finer fraction made a significant contribution to the floristic composition of vegetation patches [4]. According to Burghard et al. [46] soil formation and the development of soil properties can be very diverse in mining spoils. They found differences in the weathering process connected with pH, TOC, pore volume, and sulphur content during the study period [46]. Mining spoil can have very different effects on vegetation growth. Moreover, we detected that soil parameters have a higher impact on enzymatic diversity than the plant cover abundance of dominant species [38]. In coal-mine sedimentation pools, we found that substrate salinity, moisture, and productivity significantly influence the floristic composition of plant communities. Salinity may play a role in the course of succession on the surface of mine water sediments, especially in the initial stages. On coal-mine spoil heaps, correlations have been detected between the granulometric composition of the substrate and species representing different ecological groups. These relationships have been shown between the share of stone, gravel, sand, or fine fraction and the presence of species representing different ecological groups, life strategies, or life-forms [4]. In contrast to the carboniferous spoil heaps, the substrate of sedimentation pools is fine-grained and can be highly compacted, dried out during summer periods, and also watered down during periods of intense rainfall. Further, the use of Ellenberg’s indicator values for determining environmental gradients related to the diversity of the vegetation of coal-mine sedimentation pools can be helpful when choosing a set of physicochemical variables to find direct relationships between the vegetation and the substrate.

4.3. Selection of Functional Traits of Species along Environmental Gradients Occurring in Coal-Mine Sedimentation Pools

Previous research conducted on brownfield sites has repeatedly highlighted the diverse life history strategies of the species that colonise them [4]. The vegetation patterns observed there often differ from those observed in natural and seminatural habitats. Under the unfavourable habitat conditions found in coal-mine sedimentation pools, the only species that colonise these sites are those that possess a specific set of functional traits which enable them to cope with environmental stresses, acquire resources, and effectively compete with other species that can survive in the later stages of succession [60]. Abiotic conditions determine the selection of a suitable combination of functional traits that enable species to survive in a given location and exhibit their response to environmental factors. These are known as response traits. In the present study, four groups of species traits were determined on the basis of gradients related to humidity, salinity, soil reaction, and nutrient contents, which took into account life span, the SLA, the type of reproduction, seed weight, and the dispersal mode. Woźniak et al. [61] found that sets of these traits can change throughout succession, and we cannot recommend a single set of species traits to provide the best explanation for spatiotemporal changes in the vegetation on humanmade habitats during all developmental stages. The significance of a different plant trait varies depending on the subsequent phases of vegetation development. The results of previous studies revealed that the most explanatory variables were plant height, leaf shape and area, root system, seed weight, and photosynthetic pathway. Kompała-Bąba [12] examined the selection of traits along an environmental gradient connected with fertility and disturbance in urban-industrial habitats and detected five response groups of species on the basis of traits connected with persistence (life span), dispersal (dispersal mode), and regeneration (seed bank, number and weight of seeds, type of reproduction, clonality). The greatest variation in the occurrence of species representing different life-forms and life strategies was found on the gravelly substrates of coal-mine spoil heaps. The vegetation diversity (in terms of both species and their functional traits) was not highest in habitats with a high composition of fine-size particles [16]. Prach and Hobbs [5] expected that low-productivity sites, such as those of postmining areas, could be colonised by low-competitive, stress-tolerant species, which retreat from the surrounding eutrophicated landscape, but our results do not confirm these expectations.

5. Conclusions

Industrial activities can contribute to significant changes in the abiotic and biotic parameters of a given site (e.g., salinity, strong insolation, unfavourable granulometry, and substrate structure). During the course of succession, these sites are colonised by species with different habitat preferences, which often have different sets of functional traits that enable them to respond to the various environmental stresses present there, resulting in the creation of entirely new combinations of species. Understanding the species’ responses to these different combinations of environmental stresses can be crucial when planning the restoration of such sites using spontaneous succession and, thus, learning how the various environmental resources (C, N, water) can be used to restore existing ecosystems or provide new ecosystem services.

Supplementary Materials

The following supporting information can be downloaded at: https://www.mdpi.com/article/10.3390/su15032094/s1, Table S1: Percentage synoptic table with fidelity of plant communities that occur in coal-mine sedimentation pools; Table S2: Diversity indices in vegetation patches that develop in ruderal habitats of the Silesian Upland.

Author Contributions

Conceptualisation, A.K.-B., G.W. and W.B.; methodology, A.K.-B., G.W. and W.B.; software, A.K.-B., W.B. and G.W.; validation, W.B.; formal analysis, A.K.-B. and W.B.; investigation, G.W., K.R., R.H. and Ł.R.; resources, G.W., W.B., R.H. and Ł.R.; data curation, A.K.-B., W.B., K.R., R.H. and G.W.; writing—original draft preparation, A.K.-B.; writing—review and editing, A.K.-B., W.B., G.W., R.H., K.R., Ł.R. and D.P.; visualisation, A.K.-B. and W.B.; supervision, G.W. and D.P.; project administration, G.W.; funding acquisition, G.W. and D.P. All authors have read and agreed to the published version of the manuscript.

Funding

This research was funded by the National Centre for Research and Development, grant number TANGO1/268600/NCBR/2015 (INFOREVITA—System wspomagania rewitalizacji zwałowisk odpadów pogórniczych przy użyciu narzędzi geoinformatycznych/Geoinformatics tools a supporting the reclamation of coal-mine spoil heaps); the National Science Centre Poland, grant number OPUS 2019/35/B/ST10/04141 (Linking soil substrate biogeochemical properties and spontaneous succession on postmining areas: novel ecosystems in a human-transformed landscape); and RFCS (Fundusz Badawczy Węgla I Stali), grant number: 847227 (SUMAD—Sustainable use of mining waste heaps). Publication co-financed from the state budget under the program of the Minister of Education and Science under the name "Excellent Science" project number DNK/SN/551023/2022 co-financing amount PLN 213655.50 total project value PLN 238246.87. Poland.

Institutional Review Board Statement

Not applicable.

Informed Consent Statement

Not applicable.

Data Availability Statement

Not applicable.

Acknowledgments

We are grateful to the technicians of the Geobotany and Nature Protection Department at the University of Silesia in Katowice for their administrative and technical support. We thank Lynn Besenyei for editing the English of our manuscript and providing many valuable comments. We thank the reviewers for their detailed comments and suggestions towards improving our manuscript.

Conflicts of Interest

The authors declare no conflict of interest.

References

  1. Woźniak, G. Zróżnicowanie roślinności na zwałach pogórniczych Górnego Śląska; Instytut Botaniki im. W. Szafera, PAN: Kraków, Poland, 2010. [Google Scholar]
  2. Erskine, P.D.; Fletcher, A.T. Novel ecosystems created by coal mines in Central Queensland’s Bowen Basin. Ecol. Process. 2013, 2, 33. [Google Scholar] [CrossRef] [Green Version]
  3. Teixeira, C.P.; Fernandes, C.O. Novel Ecosystems: A review of the concept in non-urban and urban contexts. Landsc. Ecol. 2020, 35, 23–39. [Google Scholar] [CrossRef]
  4. Kompała-Bąba, A.; Bierza, W.; Błońska, A.; Sierka, E.; Magurno, F.; Chmura, D.; Besenyei, L.; Radosz, Ł.; Woźniak, G. Vegetation diversity on coal mine spoil heaps—How important is the texture of the soil substrate? Biologia 2019, 74, 419–436. [Google Scholar] [CrossRef] [Green Version]
  5. Prach, K.; Hobbs, R.J. Spontaneous succession versus technical reclamation in the restoration of disturbed sites. Restor. Ecol. 2008, 16, 363–366. [Google Scholar] [CrossRef]
  6. Hodacova, D.; Prach, K. Spoil heaps from brown coal mining: Technical reclamation versus spontaneous revegetation. Restor. Ecol. 2003, 11, 385–391. [Google Scholar] [CrossRef]
  7. Bastl, M.; Kocar, P.; Prach, K.; Pysek, P. The effect of successional age and disturbance on the establishment of alien plants in man-made sites: An experimental approach. In Plant Invasions: Studies from North America and Europe; Brook, J.H., Wade, M., Pyšek, P., Green, D., Eds.; Backhuys Publishers: Leiden, The Netherlands, 1997; pp. 191–201. [Google Scholar]
  8. Navarro-Ramos, S.E.; Sparacino, J.; Rodríguez, J.M.; Filippini, E.; Marsal-Castillo, B.E.; García-Cannata, L.; Renison, D.; Torres, R.C. Active revegetation after mining: What is the contribution of peer-reviewed studies? Heliyon 2022, 8, e09179. [Google Scholar] [CrossRef]
  9. Prach, K.; Lencová, K.; Řehounková, K.; Dvořáková, H.; Jírová, A.; Konvalinková, P.; Mudrák, O.; Novák, J.; Trnková, R. Spontaneous vegetation succession at different Central European mining sites: A comparison across seres. Environ. Sci. Pollut. Res. 2013, 20, 7680–7685. [Google Scholar] [CrossRef]
  10. Chmura, D.; Jagodziński, A.M.; Hutniczak, A.; Dyczko, A.; Woźniak, G. Novel ecosystems in the urban-industrial landscape–interesting aspects of environmental knowledge requiring broadening: A Review. Sustainability 2022, 14, 10829. [Google Scholar] [CrossRef]
  11. Korjus, H.; Laarmann, D.; Sims, A.; Paluots, T.; Kangur, A. Assessment of novel forest ecosystems on post-mining restoration site in Aidu, Estonia. In Local and Regional Challenges of Climate Change Adaptation and Green Technologies; University of West Hungary Press: Sopron, Hungary, 2014; pp. 35–44. [Google Scholar]
  12. Kompała-Bąba, A. Abiotic and Biotic Factors Affecting the Diversity of Ruderal Vegetation (Silesian Uplands Poland); Sorus: Poznań, Poland, 2013; ISBN 978-83-63768-08-9. [Google Scholar]
  13. Higgs, E. Novel and designed ecosystems. Restor. Ecol. 2017, 25, 8–13. [Google Scholar] [CrossRef]
  14. Rostański, A. Spontaniczne kształtowanie się pokrywy roślinnej na zwałowiskach po górnictwie węgla kamiennego na Górnym Śląsku; Wydawnictwo Uniwersytetu Śląskiego: Katowice, Poland, 2006; ISBN 83-226-1536-1. [Google Scholar]
  15. Zhao, B.Q.; Gao, R.Z.; Xia, D.; Xia, L.; Zhu, W.Q.; Xu, W.N. Vegetation community characteristics under different vegetation eco-restoration techniques at Xiangjiaba Hydropower Station. Nat. Environ. Pollut. Technol. 2021, 20, 1381–1392. [Google Scholar] [CrossRef]
  16. Kompała-Bąba, A.; Sierka, E.; Dyderski, M.K.; Bierza, W.; Magurno, F.; Besenyei, L.; Błońska, A.; Ryś, K.; Jagodziński, A.M.; Woźniak, G. Do the dominant plant species impact the substrate and vegetation composition of post-coal mining spoil heaps? Ecol. Eng. 2020, 143, 105685. [Google Scholar] [CrossRef]
  17. Woźniak, G.; Chmura, D.; Błońska, A.; Sierka, E.; Tokarska-Guzik, B. Applicability of functional groups concept in analysis of spatiotemporal vegetation changes on manmade habitats. Polish J. Environ. Stud. 2011, 20, 623–631. [Google Scholar]
  18. Řehounková, K.; Prach, K. Life-history traits and habitat preferences of colonizing plant species in long-term spontaneous succession in abandoned gravel–sand pits. Basic Appl. Ecol. 2010, 11, 45–53. [Google Scholar] [CrossRef]
  19. Piekarska-Stachowiak, A.; Szary, M.; Ziemer, B.; Besenyei, L.; Woźniak, G. An application of the plant functional group concept to restoration practice on coal mine spoil heaps. Ecol. Res. 2014, 29, 843–853. [Google Scholar] [CrossRef] [Green Version]
  20. Hobbs, R.J.; Higgs, E.; Hall, C.M.; Bridgewater, P.; Chapin, F.S.; Ellis, E.C.; Ewel, J.J.; Hallett, L.M.; Harris, J.; Hulvey, K.B.; et al. Managing the whole landscape: Historical, hybrid, and novel ecosystems. Front. Ecol. Environ. 2014, 12, 557–564. [Google Scholar] [CrossRef] [Green Version]
  21. Kompała-Bąba, A.; Woźniak, G. Returning coal mine sedimentation pools to nature: Technical versus natural processes in population, vegetation and landscape contexts. In Green Scenarios: Mining Industry Responses to Environmental Challenges of the Anthropocene Epoch; CRC Press: Boca Raton, FL, USA, 2022; pp. 103–113. [Google Scholar]
  22. Patrzałek, A. Właściwości gleby inicjalnej powstającej na zwałowisku odpadów karbońskich. Zesz. Nauk. Politech. Śląskiej. Ser. Górnictwo 2001, 248, 151–156. [Google Scholar]
  23. Kent, M. Vegetation Description and Data Analysis. A Practical Approach, 2nd ed.; Wiley-Blackwell: Chichester, UK, 2012. [Google Scholar]
  24. Dzwonko, Z. Przewodnik do badań fitosocjologicznych; Vademecum Geobotanicum; Sorus: Poznań, Poland, 2007. [Google Scholar]
  25. Latzel, V.; Klimešová, J.; Doležal, J.; Pyšek, P.; Tackenberg, O.; Prach, K. The association of dispersal and persistence traits of plants with different stages of succession in Central European man-made habitats. Folia Geobot. 2011, 46, 289–302. [Google Scholar] [CrossRef]
  26. Kleyer, M.; Bekker, R.M.; Knevel, I.C.; Bakker, J.P.; Thompson, K.; Sonnenschein, M.; Poschlod, P.; Van Groenendael, J.M.; Klime, L.; Klimešová, J.; et al. The LEDA traitbase: A database of life-history traits of the Northwest European Flora. J. Ecol. 2008, 96, 1266–1274. [Google Scholar] [CrossRef]
  27. Klotz, S.; Durka, W. BIOLFLOR—Eine Datenbank mit Biologisch-Ökologischen Merkmalen zur Flora von Deutschland; Bundesamt für Naturschutz: Bonn, Germany, 2002; Volume 38, pp. 1–334. [Google Scholar]
  28. Mirek, Z.; Piękoś-Mirkowa, H.; Zając, A.; Zając, M. Flowering Plants and Pteridophytes of Poland. A Checklist. Biodiversity of Poland 1; Mirek, Z., Ed.; W. Szafer: Kraków, Poland, 2022. [Google Scholar]
  29. Oberdorfer, E. Pflanzensoziologische Exkursionsflora; Verlag Eug: Stuttgart, Germany, 1990. [Google Scholar]
  30. Matuszkiewicz, W. Przewodnik do oznaczania zbiorowisk roślinnych Polski; Wydawnictw: Warszawa, Poland, 2001. [Google Scholar]
  31. Ellenberg, H.; Weber, H.E.; Dull, R.; Wirth, V.; Werner, W.; Paullisen, W. Zeigerwerte von Pflanzen in Mitteleuropa. Scr. Geobot. 1991, 38, 248. [Google Scholar]
  32. Chytrý, M.; Danihelka, J.; Kaplan, Z.; Wild, J.; Holubová, D.; Novotný, P.; Reznícková, M.; Rohn, M.; Drevojan, P.; Grulich, V.; et al. Pladias database of the Czech Flora and Vegetation. Preslia 2021, 93, 1–87. [Google Scholar] [CrossRef]
  33. Zarzycki, K.; Trzcińska-Tacik, H.; Różańska, W.; Szeląg, W.; Wołek, J.; Korzeniak, U. Ecological Indicator Values of Vascular Plant of Poland. Biodiversity of Poland 2; W. Szafer Institute of Botany, Polish Academy of Sciences: Kraków, Poland, 2002. [Google Scholar]
  34. Tichý, L.; Holt, J.; Nejezchlebová, M. JUICE Program for Management, Analysis and Classification of Ecological Data; Vegetation: Brno, Czech Republic, 2011. [Google Scholar]
  35. McCune, B.; Mefford, M. PC-ORD. Multivariate Analysis of Ecological Data; MjM Software: Gleneden Beach, OR, USA, 2011. [Google Scholar]
  36. Chytrý, M.; Tichý, L.; Holt, J.; Botta-Dukát, Z. Determination of diagnostic species with statistical fidelity measures. J. Veg. Sci. 2002, 13, 79–90. [Google Scholar] [CrossRef]
  37. TIBCO Software Inc. Statistica (Data Analysis Software System), version 13; TIBCO Software Inc.: Palo Alto, CA, USA, 2017. [Google Scholar]
  38. Magurran, A.E. Measuring Biological Diversity; Blackwell Publishing: Oxford, UK, 2004. [Google Scholar]
  39. Kompała-Bąba, A.; Bierza, W.; Sierka, E.; Błońska, A.; Besenyei, L.; Woźniak, G. The role of plants and soil properties in the enzyme activities of substrates on hard coal mine spoil heaps. Sci. Rep. 2021, 11, 5155. [Google Scholar] [CrossRef] [PubMed]
  40. Ter Braak, C.J.F.; Šmilauer, P. Canoco Reference Manual and User’s Guide: Software for Ordination, Version 5.0; Microcomputer Power: Ithaca, NY, USA, 2012. [Google Scholar]
  41. Zelený, D.; Schaffers, A.P. Too Good to Be True: Pitfalls of Using Mean Ellenberg Indicator Values in Vegetation Analyses. J. Veg. Sci. 2012, 23, 419–431. [Google Scholar] [CrossRef]
  42. Bernhardt-Römermann, M.; Römermann, C.; Nuske, R.; Parth, A.; Klotz, S.; Schmidt, W.; Stadler, J. On the identification of the most suitable traits for plant functional trait analyses. Oikos 2008, 117, 1533–1541. [Google Scholar] [CrossRef]
  43. Thioulouse, J.; Dray, S.; Dufour, A.; Siberchicot, A.; Jombart, T.; Pavoine, S. Multivariate Analysis of Ecological Data with Ade4; Springer: New York, NY, USA, 2018; pp. 1–284. [Google Scholar] [CrossRef]
  44. Kleyer, M.; Dray, S.; Bello, F.; Lepš, J.; Pakeman, R.J.; Strauss, B.; Thuiller, W.; Lavorel, S. Assessing species and community functional responses to environmental gradients: Which multivariate methods? J. Veg. Sci. 2012, 23, 805–821. [Google Scholar] [CrossRef]
  45. Wang, L.; Han, Y.; Zhang, C.; Pei, Z. Reclaimed soil properties and weathered gangue change characteristics under various vegetation types on gangue pile. Acta Ecol Sin. 2011, 31, 6429–6441. [Google Scholar]
  46. Burghardt, W.; Niggemeyer, M.; Braunersreuther, M. Ways of soil development on stony substrate from hard coal mining spoil. Soil Sci. Annu. 2020, 71, 382–394. [Google Scholar] [CrossRef]
  47. Kang, B.; Liu, S.R.; Cai, D.X.; Lu, L.H.; He, R.M.; Gao, Y.X.; Di, W.Z. Soil physical and chemical characteristics under different vegetation restoration patterns in China south subtropical area. J. Appl. Ecol. 2010, 21, 2479–2486. [Google Scholar]
  48. Alday, J.G.; Marrs, R.H.; Martínez Ruiz, C. Vegetation succession on reclaimed coal wastes in Spain: The influence of soil and environmental factors. Appl. Veg. Sci. 2011, 14, 84–94. [Google Scholar] [CrossRef]
  49. Nyssen, J.; Vermeersch, D. Slope aspect affects geomorphic dynamics of coal mining spoil heaps in Belgium. Geomorphology 2010, 123, 109–121. [Google Scholar] [CrossRef] [Green Version]
  50. López-Marcos, D.; Turrión, M.B.; Martínez-Ruiz, C. Linking soil variability with plant community composition along a mine-slope topographic gradient: Implications for restoration. Ambio 2020, 49, 337–349. [Google Scholar] [CrossRef] [PubMed]
  51. Wyszkowska, J.; Kucharski, J.; Lajszner, W. Enzymatic activities in different soils contaminated with copper. Polish J. Environ. Stud. 2005, 14, 659–664. [Google Scholar]
  52. Rahmonov, O.; Czajka, A.; Nádudvari, Á.; Fajer, M.; Spórna, T.; Szypuła, B. Soil and vegetation development on coal-waste dump in southern Poland. Int. J. Environ. Res. Public Health 2022, 19, 9167. [Google Scholar] [CrossRef]
  53. Godefroid, S.; Monbaliu, D.; Koedam, N. The role of soil and microclimatic variables in the distribution patterns of urban wasteland Flora in Brussels, Belgium. Landsc. Urban Plan. 2007, 80, 45–55. [Google Scholar] [CrossRef]
  54. Yuan, Y.; Zhao, Z.; Niu, S.; Bai, Z. The reclaimed coal mine ecosystem diverges from the surrounding ecosystem and reaches a new self-sustaining state after 20–23 years of succession in the Loess Plateau Area, China. Sci. Total Environ. 2020, 727, 138739. [Google Scholar] [CrossRef] [PubMed]
  55. Xu, Q.; Xia, G.; Wei, Y.; Aili, A.; Yuan, K. Responses of Vegetation and Soil to Artificial Restoration Measures in Abandoned Gold Mining Areas in Altai Mountain, Northwest China. Diversity 2022, 14, 427. [Google Scholar] [CrossRef]
  56. Feng, T.; Wei, W.; Chen, L.; Cerdà, A.; Yang, L.; Yu, Y. Combining land preparation and vegetation restoration for optimal soil eco-hydrological services in the Loess Plateau, China. Sci. Total Environ. 2019, 657, 535–547. [Google Scholar] [CrossRef]
  57. Alday, J.G.; Marrs, R.H.; Martínez-Ruiz, C. Soil and vegetation development during early succession on restored coal wastes: A six-year permanent plot study. Plant Soil 2012, 353, 305–320. [Google Scholar] [CrossRef]
  58. Markowicz, A.; Woźniak, G.; Borymski, S.; Piotrowska-Seget, Z.; Chmura, D. Links in the functional diversity between soil microorganisms and plant communities during natural succession in coal mine spoil heaps. Ecol. Res. 2015, 30, 1005–1014. [Google Scholar] [CrossRef] [Green Version]
  59. Zhu, S.C.; Zheng, H.X.; Liu, W.S.; Liu, C.; Guo, M.N.; Huot, H.; Morel, J.L.; Qiu, R.L.; Chao, Y.; Tang, Y.T. Plant-soil feedbacks for the restoration of degraded mine lands: A Review. Front. Microbiol. 2022, 12, 751794. [Google Scholar] [CrossRef]
  60. Mudrák, O.; Řehounková, K.; Vítovcová, K.; Tichý, L.; Prach, K. Ability of plant species to colonise human-disturbed habitats: Role of phylogeny and functional traits. Appl. Veg. Sci. 2021, 24, e12528. [Google Scholar] [CrossRef]
  61. Woźniak, G.; Markowicz, A.; Borymski, S.; Piotrowska-Seget, Z.; Chmura, D.; Besenyei, L. The relationship between successional vascular plant assemblages and associated microbial communities on coal mine spoil heaps. Community Ecol. 2015, 16, 23–32. [Google Scholar] [CrossRef]
Figure 1. The distribution of coal mines in the Silesian Uplands (1—border of the Silesian Uplands, 2—border of the mesoregion, 3—coal mines, 4—towns, 5—water bodies, including rivers).
Sustainability 15 02094 g001
Figure 2. Classification dendrogram, obtained from cluster analysis, down to the level of 14 final clusters. Ecological differences between clusters at a particular level of clustering were tested for their Ellenberg’s indicator values by using the Mann–Whitney U test. Differences significant at p < 0.05 are displayed (Chg-Chr—Chenopodium glaucum-Chenopodium rubrum community (com.), Dc-Ca—Deschampsia caespitosa-Cirsium arvense com., Cha—Chenopodium album com., Pi—Plantago intermedia com., Ap—Atriplex prostrata spp. prostrata com., Pd—Puccinellia distans com., Chs-Pa—Chamomilla suaveolens-Polygonum aviculare com., Ml—Medicago lupulina com., Ma—Melilotus alba com., Dc—Daucus carota com., Av-Tv—Artemisia vulgaris-Tanacetum vulgare com., Ce—Calamagrostis epigejos com., Pha-Sc—Phragmites australis-Solidago canadensis com., Tf—Tussilago farfara com.).
Sustainability 15 02094 g002
Figure 3. Distribution of sample plots along an environmental gradient.
Sustainability 15 02094 g003
Figure 4. The RLQ analysis of species functional traits and habitats. This plot consists of seven graphs. RLQ analysis computed coefficients for the traits and the environmental variables (“R canonical weights” and “Q canonical weights”). These loadings were used to compute two sets of scores, allowing the positioning of sites by their environmental conditions (top-left graph) and species by their traits (Q, top-right graph). RLQ analysis maximised the squared cross-covariances, weighted by the abundances, between these two sets of scores.
Sustainability 15 02094 g004
Figure 5. The position of the derived functional groups (A–D) in the functional traits–environment relationship space (Sv—reproducing mainly by seeds and vegetatively, S—reproducing by seeds, Sv—reproducing by seeds and vegetatively, Vvs—reproducing mainly vegetatively and by seeds).
Sustainability 15 02094 g005
Figure 6. The differences between response groups distinguished in coal-mine sedimentation pools in terms of life span.
Sustainability 15 02094 g006
Figure 7. The differences between response groups distinguished in coal-mine sedimentation pools in terms of canopy height, specific leaf area (SLA), and seed weight.
Sustainability 15 02094 g007
Figure 8. The spectrum of reproduction types in response groups distinguished in coal-mine sedimentation pools (S—species that reproduce mainly by seeds; Sv—species that reproduce by seeds and vegetatively; Ssv—species that reproduce mainly by seeds and rarely vegetatively; Vvs—species that reproduce mainly vegetatively and rarely by seeds). In the case of quantitative variables, 0 means absent and 1 means present of a trait.
Sustainability 15 02094 g008
Figure 9. The spectrum of main dispersal strategies of species in response groups distinguished in coal-mine sedimentation pools (Allium type—mainly autochory, less frequently anemochory, endozoochory, and epizoochory; Bidens type—mainly autochory and epizoochory, less frequently endozoochory; Epilobium—mainly anemochory and autochory, less frequently endozoochory and epizoochory; Phragmites—mainly anemochory and hydrochory, less frequently endozoochory and epizoochory).
Sustainability 15 02094 g009
Table 1. Diversity indices in vegetation patches that developed in coal-mine sedimentation pools (mean ± SE).
CommunityNumber
of Species
DominanceShannon–Wiener Diversity IndexEvenness
Chenopodium glaucum-Chenopodium rubrum com.7.43 ± 0.360.35 ± 0.111.39 ± 0.420.59 ± 0.11
Deschampsia caespitosa-Cirsium arvense com.6.33 ± 0.580.45 ± 0.091.16 ± 0.100.51 ± 0.09
Chenopodium album com.7.40 ± 3.920.44 ± 0.241.24 ± 0.610.58 ± 0.15
Plantago intermedia com.4.50 ± 0.320.43 ± 0.111.02 ± 0.320.70 ± 0.16
Atriplex prostrata spp. prostrata com.6.13 ± 2.680.42 ± 0.181.20 ± 0.440.63 ± 0.16
Puccinellia distans com.5.88 ± 3.280.61 ± 0.260.87 ± 0.590.49 ± 0.13
Chamomilla suaveolens-Polygonum aviculare com.11.00 ± 3.670.39 ± 0.181.49 ± 0.440.45 ± 0.19
Medicago lupulina com.16.63 ± 7.800.27 ± 0.101.96 ± 0.460.47 ± 0.13
Melilotus alba com.7.00 ± 1.410.53 ± 0.161.04 ± 0.290.44 ± 0.15
Daucus carota com.12.67 ± 3.860.27 ± 0.161.91 ± 0.520.58 ± 0.19
Artemisia vulgaris-Tanacetum vulgare com.11.73 ± 9.080.37 ± 0.151.51 ± 0.550.4 ± 0.11
Calamagrostis epigejos com. 6.25 ± 3.100.56 ± 0.260.95 ± 0.560.48 ± 0.09
Phragmites australis-Solidago canadensis com.8.25 ± 0.960.28 ± 0.131.64 ± 0.290.65 ± 0.18
Tussilago farfara com.5.17 ± 2.210.58 ± 0.180.89 ± 0.400.5 ± 0.15
Disclaimer/Publisher’s Note: The statements, opinions and data contained in all publications are solely those of the individual author(s) and contributor(s) and not of MDPI and/or the editor(s). MDPI and/or the editor(s) disclaim responsibility for any injury to people or property resulting from any ideas, methods, instructions or products referred to in the content.

