Abstract
In the context of rapid urbanization development, exploring the driving forces and characteristics of urban agglomerations’ spatial expansion not only enriches the depth and breadth of research on urban agglomerations’ expansion in China, but also has great significance for future urban development planning, rational utilization of land resources, and protection of ecological environment. This study selects nighttime light data to extract the built-up areas of the Chengdu–Chongqing urban agglomeration from 2012 to 2020, and uses urban expansion speed, urban expansion intensity, urban center of gravity migration, compactness, and fractal dimension index, combined with driving force analysis, to explore its development. The results show the following: (1) From 2012 to 2020, the Chengdu–Chongqing urban agglomeration expanded around Chengdu and Chongqing, and the expansion scale of each city first increased and then decreased. (The expansion scale is a comprehensive result obtained by using the formula of urban expansion speed and expansion intensity, indicating the extent of urban expansion.) (2) The expansion direction of the Chengdu–Chongqing urban agglomeration keeps close to Chengdu and Chongqing. The urban spatial form is not stable and begins to focus on urban interior filling. (Urban interior filling refers to the infrastructure construction and content enrichment and renewal within an urban built-up area.) (3) The spatio-temporal expansion of the Chengdu–Chongqing urban agglomeration from 2012 to 2020 is most affected by the levels of economic development and regional investment.
1. Introduction
The UN Habitat World Cities Report 2022 points out that urban development will transition to a more sustainable, just, green, resilient, and healthy future [1]. Under the background of economic globalization and global urbanization, large cities, as economic, social, and cultural centers, are gradually becoming “super city clusters” (the “super city clusters” refers to urban agglomerations with stronger economic radiation than other urban agglomerations, which is reflected in the close economic connection, industrial division and cooperation between them, and the interaction between transportation and social life, urban planning and infrastructure construction) [2], and city clusters have become one of the most important carriers of global eco-nomic development [3]. Developed countries have reached mature urban development earlier and have achieved high-level urbanization [4]. In 2030, the size of the world’s urban population will increase to ~8.6 billion [5], with most of the growth coming from developing countries. The focus of urbanization has gradually shifted to developing countries [4]. China is the most populous country in the world. After 40 years of reform and opening up, China has been experiencing rapid urbanization with an annual growth rate of 1% [6]. By 2050, the level of urbanization will reach ~80−90% [7]. Rapid urbanization has led to uncontrolled urban expansion [8], rapid population growth [4], unbalanced regional development [6], worsening air pollution [9] and many other problems. Scholars have studied the expansion of urban agglomerations globally [10], including in Europe [11], the United States [12], India [13], and China [14], and have curbed urban sprawl through effective planning and management.
The study of urban agglomeration expansion has always been an important area of urban research. The development of modern remote sensing technology provides support for revealing the internal and external driving mechanisms of urban land formation and evolution. Since the United States launched Landsat satellite in the 1970s, a large number of studies have been conducted using different remote sensing data sources, such as the Landsat and Système Probatoire d’Observation de la Terre (SPOT), and various methods; for example, the Normalized Difference Built-up Index (NDBI), supervised classification, and neural network classification have been used to extract urban land information [15] and analyze and simulate the direction, trend, intensity, driving forces, etc., of urban expansion [16]. However, the geographical coverage of medium- and high-resolution remote sensing data is limited. At the same time, the acquisition, pre-processing, and interpretation of images that can correctly and accurately interpret remote sensing data require a lot of manpower and material resources [17], bringing more challenges to data acquisition. The emergence and application of night light data can better reflect the level of urban expansion and the degree of human activities, providing a new perspective for urban expansion research. Stable night light imagery obtained by the Operational Linescan System (OLS) sensor carried by the Defense Meteorological Satellite Program (DMSP) and the Suomi National Polarizing Partnership Visible Imaging Radiometer Suite (NPP-VIIRS) provides monthly synthetic night light remote sensing image data that are the most widely used night light data at present [18]. The DMSP-OLS data have the disadvantages of having a low spatial resolution and easy light overflow, whereas the NPP-VIIRS luminous data have a high resolution and are less affected by light overflow. These data can clearly distinguish urban and rural areas, have a wider radiation range, and are mostly used for large-scale urban built-up area extraction [19]. The DMSP-OLS night light data are only available from 1992 to 2013, whereas the NPP-VIIRS night light data have been updated after 2013. There is incomparability between the two, which limits the time series study of night light data [6]. Although many studies have integrated the DMSP-OLS and NPP-VIIRS night light data to obtain a continuous time series dataset, they cannot overcome the errors caused by the different data sensors [20]. Zhang et al. used the NPP-VIIRS night light data to quantitatively evaluate the urban expansion of Guangdong, Hong Kong, and Macao [17], and Duque et al. used the DMSP-OLS data to study the shape and area changes of 919 cities in Latin America and the Caribbean from 1996 to 2010 [21]. Chen et al. used the DMSP-OLS, MODIS, and Landsat data to analyze global urban agglomeration change from 2000 to 2012 [22]. Chen et al. used the NPP-VIIRS data and various auxiliary data to monitor the evolution of the Yangtze River Delta urban agglomeration from 2012 to 2018 and compared it with five major urban agglomerations in Europe, North America, and Asia [23]. Zhao et al. analyzed urban system structure and spatio-temporal evolution of cities in southeast Asia using the DMSP-OLS night light data [24]. Liu et al. extracted the expansion dynamics of 12 cities in China based on the NPP-VIIRS and DMSP-OLS night light data from 1992 to 2008. They found that the spatial accuracy of built-up areas extracted using the NPP-VIIRS data was higher than that of the DMSP-OLS data [25]. A large number of studies have demonstrated the feasibility of using night light data to study the evolution and expansion of urban agglomeration structure.
The Chengdu–Chongqing urban agglomeration is the region with the highest development level and the greatest development potential in Western China. It is poised to lead the Western region in accelerating development, improving the level of inland opening up, and enhancing national comprehensive strength. It plays an important strategic role in promoting regional coordinated development and international cooperation. The Chengdu–Chongqing urban agglomeration is also the most likely urban agglomeration to become the “fourth pole” of China’s economy after the Yangtze River Delta, the Guangdong–Hong Kong–Macao, and the Beijing–Tianjin–Hebei urban agglomerations. Previous studies have used the night light index to describe the degree of urban expansion activity in the Chengdu–Chongqing Economic Zone. For example, Zhou Yin and others analyzed the spatio-temporal pattern of urbanization in the Chengdu Plain urban agglomeration based on the average light intensity value of the DMSP-OLS night light data [26]. Liu Yuan et al. extracted the city center through the NPP-VIIRS night light data combined with a local contour tree algorithm [27]. Liu Qingyun and others extracted the Chengdu–Chongqing urban agglomeration area based on the small area town elimination method and applying a night light remote sensing data consistency correction to analyze urban expansion [28]. Yang Renfei and others studied the transformation of the center of gravity and the formation of urban space in the Chengdu–Chongqing urban agglomeration built-up areas from 1997 to 2013 based on the DMSP-OLS data [29]. However, the night light index only reflects the scope of a city to a certain extent and cannot directly determine the outline of an urban built-up area.
This study extracts urban built-up areas year-by-year for the Chengdu–Chongqing urban agglomeration over the past 10 years using the NPP-VIIRS night light data and a statistical yearbook reference comparison method. The key to this method is to determine the optimal threshold value. The area where the extracted pixel value (i.e., light value) is greater than the threshold value is the built-up area. Based on the extracted results, an urban gravity center model is constructed to analyze the space–time evolution of the Chengdu-Chongqing urban agglomeration from 2012 to 2020 and to explore the internal driving forces behind urban expansion.
The research results not only enrich the depth and breadth of urban agglomeration expansion research in China, but also have great significance for future urban development planning, rational use of land resources, and protection of the environment.
2. Materials and Methods
2.1. Research Area
The Chengdu–Chongqing urban agglomeration (27°39′ N−33°03′ N, 101°56′ E−110°11′ E) is located in southwest China in the upper reaches of the Yangtze River and the hinterland of Sichuan Basin. Centered on Chengdu and Chongqing, it covers 15 cities in Sichuan Province, including Chengdu, Zigong, Luzhou, Deyang, Mianyang, Suining, Neijiang, Leshan, Dazhou, Nanchong, Meishan, Yibin, Guang’an, Ya’an, and Ziyang, and 27 districts (counties) in Chongqing (Figure 1). The total area of the region is 185,000 km2, accounting for 7.1% of the total area of the country. In 2020, the GDP of the region with 103 million permanent residents was 6.8 trillion yuan, accounting for 6.7% of the national GDP.
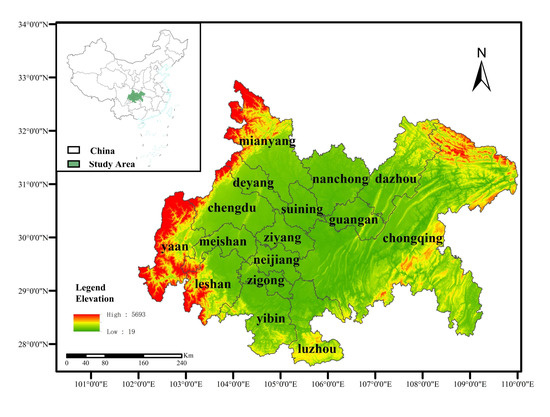
Figure 1.
The schematic diagram of the Chengdu–Chongqing urban agglomeration.
The Chengdu–Chongqing Urban Agglomeration has prominent regional advantages, superior resource endowment, a solid industrial foundation, and rich human resources. It is an important platform for China’s western development, a strategic support for the Yangtze River Economic Belt, and an important demonstration area for promoting new urbanization.
2.2. Data Sources and Processing
2.2.1. Data Sources
The NPP/VIIRS night light data used in this study are from the National Oceanic and Atmospheric Administration, formerly known as the National Geophysical Data Center (NOAA/NGDC). It is a monthly VCMCFG composite product with a spatial resolution of ~500 m and a spectral resolution of 10 bit [30]. Five years of night light data for 2012, 2014, 2016, 2018, and 2020 are selected as the research object. The administrative boundary used in this study is 1:1,000,000 administrative boundary data from prefecture-level cities in China, which comes from the National Basic Geographic Information Center (http://www.ngcc.cn, accessed on 1 July 2021) [31]. The urban built-up areas for the Chengdu–Chongqing urban agglomeration are from the Statistical Yearbook of Chinese Cities (2012, 2014, 2016, 2018, and 2020) and the statistical yearbooks of provinces and cities.
2.2.2. Data Preprocessing
Firstly, the downloaded vector data and grid data are projected from the WGS84 geographic coordinate system to the Mercator UTM projection that conforms to the Chengdu–Chongqing urban agglomeration terrain. Then, we use the mask extraction function in the ArcGIS software toolbox and the administrative boundary vector data of the Chengdu–Chongqing urban agglomeration to obtain the night light map within the scope of the Chengdu–Chongqing urban agglomeration, and we carry out the negative value removal and rounding processing (Figure 2) to obtain the corrected night light data. Then, the light grid data are converted into vector data and the light threshold and built-up area range of each city in the Chengdu–Chongqing urban agglomeration are calculated by combining the relevant economic and social statistics.
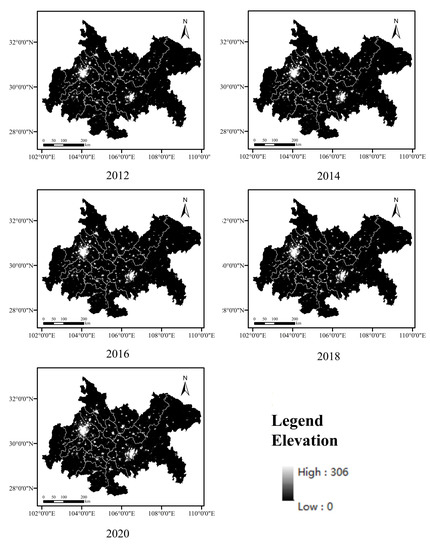
Figure 2.
Nighttime Lighting Processing Map of the Chengdu–Chongqing Urban Agglomeration. (Note: The light value refers to the light detected by the remote sensing satellite at nighttime in the city. The more active the area, the greater the light value).
2.3. Research Methods
2.3.1. Measurement of Urban Built-up Area Expansion
The built-up area extraction method in this study uses the threshold method, which has high efficiency, convenience, strong operability, and high extraction accuracy [32]. According to the night light data of the Chengdu–Chongqing urban agglomeration for 2012, 2014, 2016, 2018, and 2020, the light threshold of each administrative unit is determined, the built-up area is extracted, and it is compared with the statistical yearbook data until the two data are close within a certain threshold condition.
2.3.2. Expansion Speed Index
The expansion speed index and the expansion intensity index are important methods for studying urban spatial expansion [33,34]. The urban expansion speed index is the expansion rate of an urban land area over a certain period of time, which can directly reflect the change speed of the land area. Its formula is as follows:
where is the urban expansion rate index from the base period to the end of the urban study, and and represent the urban built-up area at the base period and at the end of the study, respectively.
2.3.3. Expansion Intensity Index
The expansion intensity index of urban land refers to the phased change percentage of an urban land area within a certain period of time, which can be used to study the spatio-temporal expansion speed and range of urban agglomeration cities [35,36]. Its formula is as follows:
where is expansion intensity; is urban expansion area in the ith spatial unit j period; is the time span; and is the total land area of the ith spatial unit.
2.3.4. The Center of Gravity Offset
Using the mean center tool of ArcGIS, the light threshold is selected as the weight field to obtain the distance and angle of the center of gravity offset [37]. The formula is as follows:
where and are the plane coordinates of the city center at time t; is block I graphic area; and and are the geometric barycentric (the intersection of the diagonal lines) coordinates of block I figure.
where is distance from the change of the city at time t to the shift of the city’s center of gravity at time t + n, and and are the barycentric plane coordinates of the city at time t.
where and are the increments of the city barycentric coordinates from time t to time t + n, and is bearing.
2.3.5. The Compact Degree
The concept of compactness C comes from the “compact city” concept in Europe, which believes that a circular city has the highest compactness and is an excellent urban development model [38,39]. Its value ranges from 0 to 1, and the closer it is to 0, the more irregular the urban space is. On the contrary, urban space development is more efficient. The compactness calculation formula is follows:
where is the compact degree, is the area of the built-up area, and is the perimeter of the built-up area.
2.3.6. Fractal Dimension
The fractal dimension D reflects the filling capacity of a built-up area and the complexity of the boundary shape [40,41]. Its theoretical values from 1 to 2, and the closer it is to 1, the simpler the urban form is. The closer it is to 2, the more uniform the urban land is. An increase in its value indicates that the urban construction is dominated by external expansion, whereas the urban construction is dominated by internal filling. The calculation formula for the fractal dimension is follows:
where is the fractal dimension, is the area of the built-up area, and is the perimeter of the built-up area.
2.3.7. Driving Force Study
Geographic detectors are usually used to detect the influence of various factors on the spatial differentiation of a research object and factor interactions. This study mainly uses a factor and interaction detector to detect seven factors affecting urban expansion, including the ratio of the secondary industry to the tertiary industry; the total output value of agriculture, forestry, animal husbandry, and fishery; the number of permanent residents at the end of the year; the total annual passenger transport; the total investment in fixed assets of the whole society; and the road mileage. (Table 1) and [42,43] reveal their impacts and interactions on carbon emissions from the perspective of regional geographic differentiation. Factor detection is usually measured by a q value, and the expression is as follows:
where L is the stratification of variables; N and Nh are the number of units in the whole area and layer h, respectively; and are the variance of the whole area and layer h, respectively; and q is the degree of interpretation of the detection factor to urban expansion, with a range of [0, 1]. The larger the q value, the stronger the explanatory power of the factor to urban expansion, and vice versa.

Table 1.
Indicators of factors influencing land-use carbon emissions.
3. Results
3.1. Analysis of the General Characteristics of Urban Agglomeration Expansion
Based on the night light data for the Chengdu–Chongqing urban agglomeration in 2012, 2014, 2016, 2018, and 2020, combined with the statistical yearbook data, the range of urban built-up areas is extracted. From the extraction results (Table 2, Figure 3), the average errors for the five-time nodes are −0.23%, 0.57%, 0.36%, 2.12%, and 1.28%. The fact that the average errors are less than 1% indicates that the extraction of the built-up areas of the Chengdu–Chongqing urban agglomeration is reasonable and reliable.
Table 2.
Comparison of the precision of extraction results of urban built-up areas.
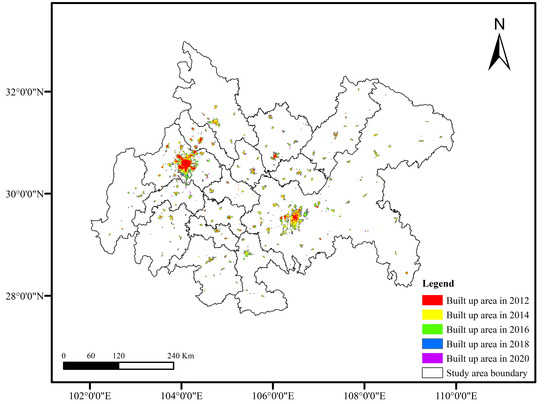
Figure 3.
Schematic Diagram of the Built-up Area of the Chengdu–Chongqing Urban Agglomeration.
Overall, the built-up area of the Chengdu–Chongqing Urban Agglomeration exhibits a circle-like expansion with the central city as the core (Figure 4 and Figure 5). Chengdu exhibits the “single center circle” expansion feature that slows down gradually after high-speed expansion. Areas with high light density are gathered in the center of the old city. The farther away from the center, the lower the density is. The expansion pattern is to make the old city the center and develop evenly outward. Chongqing shows the characteristics of “multi center circle + filling” urban expansion, which is slowly expanding with a fluctuating speed. Due to the limitation of mountainous terrain and rugged traffic, the scope of Chongqing’s outward expansion is small. The expansion area is mostly distributed around the original construction land and centered on several original built-up areas. The expansion form is distributed in a circle.
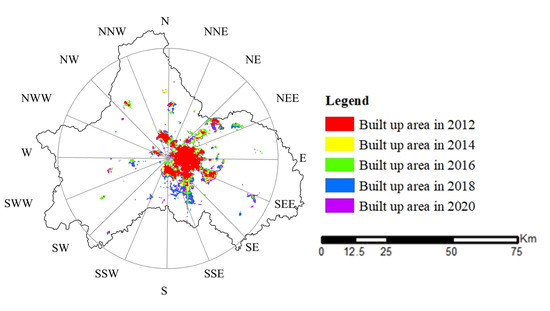
Figure 4.
Schematic Diagram of the Chengdu Built-up Area.
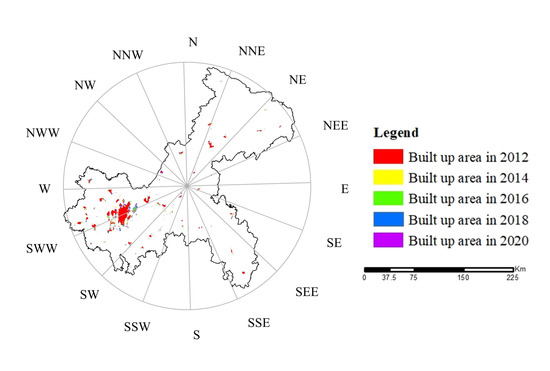
Figure 5.
Schematic Diagram of the Chongqing Built-up Area.
3.2. Analysis of the Characteristics of Urban Agglomeration Expansion Scale
The urban expansion speed and intensity (Figure 6) results from 2012 to 2020 show that the Chengdu–Chongqing urban agglomeration continues to advance, economic development steadily moves forward, and the level of urbanization continues to improve, but the speed and intensity of urban expansion slow year by year.
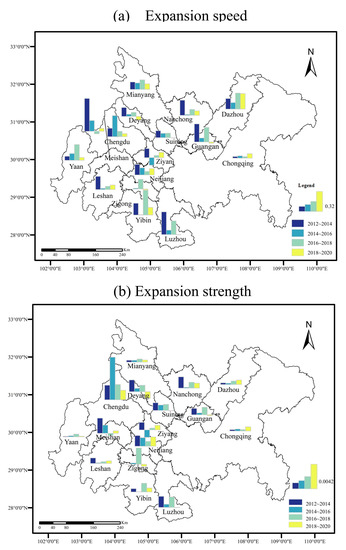
Figure 6.
Urban Expansion Speed (a) and Expansion strength (b)of the Chengdu-Chongqing Urban Agglomeration.
From 2012 to 2014, the expansion speed and intensity of the Chengdu–Chongqing urban agglomeration are 13.63% and 0.10%, respectively, showing a rapid growth trend. At this stage, Meishan City has the fastest urban expansion speed, up to 64.75%, and the highest expansion intensity, up to 0.30%. With the continuous construction of the Meishan Tianfu New Area, it gradually becomes a new area with the most vitality and investment value in the Chengdu Economic Zone.
From 2014 to 2016, the expansion speed and intensity of the Chengdu–Chongqing urban agglomeration are 10.88% and 0.09%, respectively, and the expansion speed of the city begins to slow. At this stage, Chengdu has the fastest urban expansion speed of 41.60% and the largest expansion intensity of 0.85%, which is related to the construction of Chengdu as a national central city and the breaking of the development mode of single core agglomeration (it is a unified urban planning structure, that is, there is only one central area in the city, and the planning layout is carried out around the central area).
From 2016 to 2018, the expansion speed and expansion intensity of the Chengdu–Chongqing urban agglomeration are 9.90% and 0.09%, respectively, but the expansion speed and intensity of most cities decline. In this stage, Yibin has the fastest urban expansion speed, at 48.79%, and Zigong has the largest urban expansion intensity, at 0.32%. As important representatives of the southern Sichuan urban agglomeration, Yibin and Zigong are accelerating their integrated development, actively undertaking the important task of opening up to the south of Sichuan Province, and striving to build the second economic growth pole of Sichuan Province
From 2018 to 2020, the expansion speed and intensity of the Chengdu–Chongqing urban agglomeration are 6.81% and 0.07%, respectively, and the expansion trend of most cities further slows. At this stage, Dazhou City has the fastest urban expansion rate of 30.65%, which is in line with Dazhou’s plan of “extending from the south to the west to the east, and developing to the north moderately”. Chengdu has the largest urban expansion intensity, which is 0.19%. At the 13th Party Congress of Chengdu, the development strategy of moving eastward and expanding southward, which brings about a major adjustment to the urban development pattern of Chengdu, promotes the shift in the focus of advanced manufacturing and productive services to the east, and opens up a “second main position” for economic and social development. In addition, the Master Plan of Chongqing Territorial Space points out that the construction of the Chengdu–Chongqing twin-city economic circle should be promoted, creating conditions for the coordinated development of the Chengdu–Chongqing urban agglomeration.
3.3. Analysis of the Morphological Characteristics of Urban Agglomeration Expansion
3.3.1. Change to the Center of Gravity of Urban Agglomeration
According to the position and results of the center of gravity in the built-up areas of the Chengdu–Chongqing urban agglomeration from 2012 to 2020 (Table 3), the center of gravity’s moving distance first increases and then decreases. From 2012 to 2014, the average deviation distance of the center of gravity of the Chengdu–Chongqing urban agglomeration is 14.517 km, of which the maximum deviation distance of Luzhou City is 47.276 km (the maximum deviation distance means that Luzhou has the largest deviation distance of urban light center of gravity and the largest change in urban expansion center of gravity). This is closely related to the completion of a new urban master plan in Luzhou in 2012 and the establishment of the “double hundred” and “double two hundred” regional central city development goals.
Table 3.
Distance and Angle of Urban Center Shift of the Chengdu–Chongqing Urban Agglomeration from 2012 to 2020. (Each time period is listed as distance on the left and angle on the right).
From 2014 to 2016, the average deviation distance of the center of gravity of the Chengdu–Chongqing urban agglomeration is 13.296 km, of which the maximum deviation distance of Ziyang City is 45.441 km. This is closely related to the planning direction of Ziyang City’s in-depth implementation of the western development strategy and the construction of an advantageous development of the Chengdu–Chongqing Economic Zone during the “Twelfth Five Year Plan” (2011–2015).
From 2016 to 2018, the average deviation distance of the center of gravity of the Chengdu–Chongqing urban agglomeration is 9.193 km, of which the maximum deviation distance of Ya’an City is 34.783 km.
From 2018 to 2020, the average deviation distance of the center of gravity of the Chengdu–Chongqing urban agglomeration is 8.697 km, of which the maximum deviation distance of Ya’an City is 26.013 km, which is related to the regional central city construction policy of Ya’an to promote the leading development of the eastern region during the “13th Five Year Plan” (2016–2020).
From the perspective of the migration direction of the center of gravity (Figure 7), the overall center of gravity of the Chengdu–Chongqing urban agglomeration shifts to the southeast, with the centers of gravity for Chengdu, Zigong, Mianyang, Neijiang, Leshan, Meishan, Guang’an, and other cities shifting to the southeast. The centers of gravity for Deyang, Suining, Ya’an, and other cities shift to the northeast, while Chongqing, Luzhou, Dazhou, Nanchong, Yibin, Ziyang, and other cities shift to the southwest. In general, the construction of the Chengdu–Chongqing urban agglomeration is roughly centered around the development trends of Chengdu and Chongqing. Chengdu gradually develops to the east and Chongqing gradually develops to the west until the two cities are integrated, which drives the economic development of Chengdu and the surrounding areas of Chongqing.
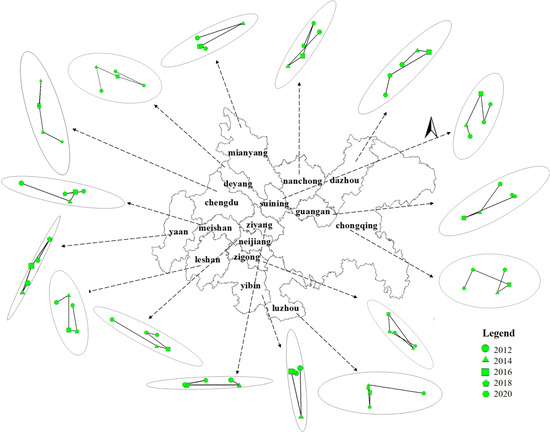
Figure 7.
Gravity Migration Map of the Chengdu–Chongqing Urban Agglomeration from 2012 to 2020. (The arrow points to the picture showing the standard deviation ellipse and the direction of the center of gravity migration for each city from 2012 to 2020).
3.3.2. Analysis of the Results of Urban Spatial Form Characteristics
The space–time change characteristics of the Chengdu–Chongqing urban agglomeration are calculated according to the formulas for compactness index and fractal dimension index (Figure 8). From 2012 to 2020, the compactness of the Chengdu–Chongqing urban agglomeration is 0.058, 0.054, 0.068, 0.072, and 0.072, showing a strong-weak-strong trend. This indicates that the compactness of most cities in the Chengdu–Chongqing urban agglomeration first increases and then decreases, which may be because the expansion of the city extension type will lead to the filling type, which will increase compactness. On the contrary, when the internal development of the city reaches saturation, it will continue the extension expansion, which will weaken the city or regional compactness. The compactness results for smaller cities, such as Dazhou, Suining, and Guang’an, are 0.3−0.6. However, the compactness of the built-up areas in the cities with larger urban scales are lower with values in the range of 0−0.3. For example, Chongqing, as a mountainous city, is suitable for construction with relatively fragmented space. The city mainly focuses on cluster construction, and its compactness is relatively low. (Due to natural conditions and other factors, urban land is divided into several blocks. In urban planning, departments with similar functions and properties should be concentrated in combination with the terrain and arranged in blocks, each of which has residential areas and living service facilities. Each block is called a cluster.)
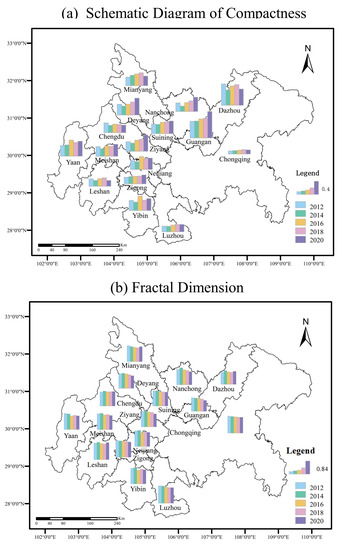
Figure 8.
Schematic Diagram of Compactness (a) and Fractal Dimension (b) of the Chengdu–Chongqing Urban Agglomeration from 2012 to 2020.
From 2012 to 2020, the fractal dimension of the Chengdu–Chongqing urban agglomeration decreases from 1.671 to 1.592. On the whole, although the fractal dimension (it reflects the filling capacity of built-up area and the complexity of boundary shape) of the Chengdu–Chongqing urban agglomeration declines, it is still greater than 1.5, which indicates that the development of urban space in the Chengdu–Chongqing region is dominated by internal culvert filling, the irregularity of urban space shape is strong, the corresponding stability is weakening, and the urban space shape is becoming increasingly complex. (The theoretical value of the fractal dimension is between one and two, and the closer it is to one, the simpler the urban form is. The closer it is to two, the more uniform the urban land is. An increase in its value indicates that the urban construction is dominated by external expansion, whereas the urban construction is dominated by internal filling.) There are obvious differences in the development of built-up areas in different cities. The fractal dimensions of Chengdu, Leshan, Mianyang, and other cities fluctuate from 2012 to 2020, indicating that the growth mode of the built-up areas in these cities is mainly extensional development. The fractal dimensions for Chongqing, Zigong, Luzhou, and other cities fluctuate and decline from 2012 to 2020, indicating that these urban spaces are dominated by conformal filling development.
3.4. Analysis of Urban Expansion Driving Force
3.4.1. Analysis of Single Factor Detection Results
As shown in Figure 9, the leading factors for urban expansion in the Chengdu–Chongqing urban agglomeration are roughly the same over different periods. The total output value of agriculture, forestry, animal husbandry, and fisheries, the number of permanent residents at the end of the year, and the total annual passenger transport have the strongest influence on the spatial differentiation of urban expansion, and fixed assets and highway traffic mileage also have a significant influence. The proportion of the secondary and tertiary industries has a relatively weak influence on the spatial expansion of the Chengdu–Chongqing urban agglomeration, while the total retail sales of consumer goods have a stable influence on the urban expansion.
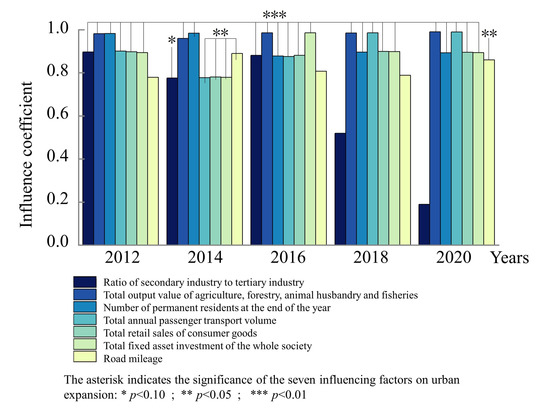
Figure 9.
Schematic diagram of driver influence and significance.
Three industries. The output value of the primary industry has a strong and stable explanatory power over the spatial expansion of the Chengdu–Chongqing urban agglomeration. The q value (q value is the degree of interpretation of the detection factor to urban expansion, with a range of [0, 1]. The larger the q value, the stronger the explanatory power of the factor on urban expansion, and vice versa.) reaches its highest value in 2020 (0.990) and its lowest value in 2014 (0.960), which shows that it always maintains a high value. The primary industry mainly involves production and ecological land with relatively low economic benefits, such as cultivated land and forest land. The opportunity cost of land conversion is relatively small, and it is more prone to rapid urban expansion. The influence of the output of the secondary and tertiary industries on urban expansion decreases year by year, and the q value drops to its lowest value of 0.190 in 2020.
Population size. The explanatory power of urban population size and annual tourist volume on the spatial expansion of the Chengdu–Chongqing urban agglomeration first decreases and then increases. The q value of urban population size is the lowest in 2016, at 0.878, and increases to 0.896 in 2018. The q value for annual tourist volume is the lowest in 2014, at 0.777, and increases to its highest in 2020, at 0.990. The population scale effect caused by population growth leads to the expansion of built-up areas, as well as industrial agglomeration and development, and further promotes the urban agglomeration expansion.
Total retail sales of consumer goods and total investment in fixed assets. The q values for social consumer goods and fixed asset investments fluctuate, ranging from 0.781 to 0.898 and from 0.779 to 0.986, respectively. Government investment is related to the overall economic and social development. It is not only an important means for the country to implement macro-control and national development strategy, but also a powerful means to guide and drive social capital to expand effective investment. The promulgation of policies, such as the Chengdu–Chongqing Urban Agglomeration Development Plan and the Chengdu–Chongqing Double-City Economic Circle Construction Plan, reflects the government’s high attention to the development of the Chengdu–Chongqing urban agglomeration, which has brought a large amount of government investment, guided the expansion of social capital, produced a compound effect on market consumption growth, activated regional economic development, and provided basic support for urban expansion.
Highway traffic length. The q value for highway mileage is stable, ranging from 0.779 to 0.890. The increase in highway mileage is not only the result of urban agglomeration spatial expansion, but it also accelerates urban communication and industrial development, and is one of the important causes of urban spatial expansion.
3.4.2. Interaction Detection Results
Based on the single factor detection, an interaction detection of the seven factors is conducted. The analytical results are shown in Figure 10. The influence of each factor on urban expansion is significantly enhanced under the interaction, and the q values range from 0.793 to 1.000, which are manifested as double-factor enhancement and nonlinear enhancement. In 2012, the X3∩X6 interaction value is the highest, reaching 0.993. In 2014, the X2∩X4 interaction value is the highest, reaching 1.000. In 2016, the X5∩X7 interaction value is the highest, reaching 0.997. In 2018, the X5∩X7 interaction value is the highest, reaching 0.997. In 2020, the interaction values for X1∩X2, X1∩X3, X1∩X4, and X1∩X6 are the highest, reaching 0.999.
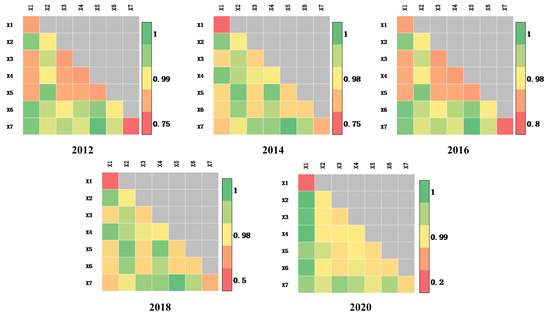
Figure 10.
Q values for the correlations of the influencing factors in 2012, 2014, 2016, 2018, and 2020.
According to the analysis of the indicators selected in this study, the spatial expansion characteristics of the Chengdu–Chongqing urban agglomeration are the result of the comprehensive effects of factors, such as economic development level, population size, regional investment level, and transportation development. Among them, the levels of economic development and regional investment are the main driving forces. The influence of the primary, secondary, and tertiary industries on the spatial expansion of the Chengdu–Chongqing urban agglomeration cannot be ignored, indicating that industrial orientation is an important factor. Traffic development is the internal factor, and population size is the external manifestation of urban expansion. The factors affecting the spatial expansion characteristics of the Chengdu–Chongqing urban agglomeration are nonlinear in different periods.
4. Discussion
4.1. Analysis of Urban Agglomeration Expansion Characteristics
4.1.1. Feasibility of Method Selection
The threshold method is used to compare the built-up areas extracted from the night light data for the Chengdu–Chongqing urban agglomeration to the statistical yearbook data. The value with the least difference between the imagery values and the statistical data is selected as the threshold to obtain the urban contour of the Chengdu–Chongqing urban agglomeration. After testing, the overall average error is 3.37% and all average errors are less than 5%, indicating that the threshold-based method has high rationality and feasibility for extracting urban built-up areas. This shows that this method produces high-precision results and is easy to implement [44]. Shi et al. used the NPP-VIIRS data and found that the errors of megacities, big cities, medium cities, and small cities were 3.70%, 1.77%, 1.38%, and 2.37%, respectively [44].
In the future, we also hope to continuously optimize the extraction accuracy of the built-up areas. For example, this time, we mainly use the night light remote sensing data to extract the built-up areas of the Chengdu–Chongqing urban agglomeration. In the future, we hope to integrate the night light data with Normalized Difference Vegetation Index (NDVI), Point of Interest (POI), and other data to improve the accuracy and to obtain a more accurate urban spatial boundary. Secondly, the research on the Chengdu–Chongqing urban agglomeration in this study is more focused on urban space. If the research perspective can be extended to the pixel perspective, the urban space and pixel changes in a longer time series will be more meaningful.
4.1.2. Characteristics of Urban Agglomeration Expansion Scale
From 2012 to 2020, the size of the Chengdu–Chongqing urban agglomeration built-up area increases by ~1.48 times, and the urban expansion experiences a development process from rapid expansion to gradual slowdown. Compared with other urban agglomerations in China, the expansion speed and intensity of the Chengdu–Chongqing urban agglomeration are slightly lower. Relevant studies have shown that from 2000 to 2020, the size of the five major urban agglomerations in the Yellow River Basin increased by 6.4 times and the expansion intensity increased by 10% [45]. The size of the Beijing–Tianjin–Hebei urban agglomeration built-up area increased by 273.13% from 1992 to 2020 [46]. The total mean light intensity of the urban agglomeration in the middle reaches of the Yangtze River increased by 70.06%, indicating that the size of the urban agglomeration expanded by ~1.7 times [47]. This is because the economic development level of the major urban agglomerations is different and the development orientation is different. Before 2016, the Chengdu–Chongqing urban agglomeration was part of the Yangtze River Economic Belt, which was built together with the urban agglomeration in the middle reaches of the Yangtze River and the Yangtze River Delta. On April 27, 2016, the National Development and Reform Commission and the Ministry of Housing and Urban-Rural Development officially and jointly issued the Development Plan of Chengdu–Chongqing Urban Agglomeration. The development orientation and direction of the Chengdu–Chongqing urban agglomeration were clearly defined. Therefore, its development started late and the urban expansion speed and intensity were lower than other developed urban agglomerations.
4.1.3. Morphological Characteristics of Urban Agglomeration Expansion
According to the analysis of the location and track results of the center of gravity of urban built-up areas in the Chengdu–Chongqing urban agglomeration from 2012 to 2020, the built-up areas of Sichuan and Chongqing show continuous close development with the central city as the core of circular expansion. Similar studies have shown that in the development of urban agglomerations, the center of gravity of expansion shifts. For example, the centers of gravity of the Shandong Peninsula urban agglomeration, the Yellow River Jizi Bay Urban agglomeration, the Guanzhong Plain urban agglomeration, and the Lanzhou–Xining urban agglomeration all move westward, whereas the center of gravity of the Central Plains urban agglomeration moves southeast [45]. As the development focus of the Chengdu–Chongqing urban agglomeration, Chengdu and Chongqing are the main embodiments of urban expansion. As shown in Figure 3, the two centers with significant changes in urban built-up areas are Chengdu and Chongqing. At the same time, the other surrounding cities of the two cities have little changes, which conforms to the conclusion of “center periphery”. Relevant studies have shown that the migration direction of the center of gravity in the built-up areas of the Chengdu–Chongqing urban agglomeration always points to the main urban areas of Chengdu and Chongqing, showing a typical “center-periphery” spatial pattern [28] that is consistent with the results of this study.
The compactness of the Chengdu–Chongqing urban agglomeration tends to increase slightly, and larger urban scale means smaller compactness, which is consistent with the conclusion of Li et al.’s research on the county-level urban development in Gansu Province using multi-source remote sensing images [48]. From the perspective of time scale, the overall compact development degree of the Chengdu–Chongqing urban agglomeration is slightly improved and the regional boundary begins to show a definite and regular trend. However, there is no obvious directionality in the change in urban spatial form and the changes are different. This indicates that the land-use efficiency of some cities should be improved and the economic and intensity of urban land needs to be further strengthened. The fractal dimension of the Chengdu–Chongqing urban agglomeration declines, which indicates that the urban interior filling is the main part of the Chengdu–Chongqing urban agglomeration, and the urban space shape is highly irregular. The urban space shape of the Chengdu–Chongqing urban agglomeration shows an increasingly complex development trend.
4.2. Analysis of Urban Expansion Driving Forces
According to the geographic detector analysis, the economic development level and the regional investment level are the leading factors of the Chengdu–Chongqing urban agglomeration. The trend of getting closer to the two poles is closely related to national policies over the years. In 2011, the Regional Plan of Chengdu–Chongqing Economic Zone was released, indicating that the development of the Chengdu–Chongqing area entered a stage of rapid growth. With the promotion of urbanization and greater industrialization, the expansion speed and intensity reached 13.63% and 0.095% in 2014, respectively. In 2016, the Chengdu–Chongqing Urban Agglomeration Development Plan was implemented and the urban agglomeration development gradually stabilized, with the expansion speed and intensity reaching 10.88% and 0.086%. The urban system became increasingly sound, Chongqing and Chengdu played an increasingly important role, and a number of small- and medium-sized cities showed a distinct development trend. In 2020, the Outline of the Plan for the Construction of the Chengdu–Chongqing Twin City Economic Circle proposes to build a strong and distinctive twin-city economic circle in the Chengdu–Chongqing region and to create an important pole of growth and a new source of power for the high-quality development of the whole country. Over the past decade, the Chengdu–Chongqing urban agglomeration has focused on the dual-core driving functions of Chongqing and Chengdu by focusing on the main development axis and the city belt along the Yangtze River and Chengde Mianle. It has promoted the development of dense urban areas in southern Sichuan, Nansuiguang, and Dawan, improved the efficiency of space utilization, and built a spatial development pattern of “one axis, two belts, two cores and three districts”.
In addition to being significantly affected by administrative measures or government policies, China’s rapid urbanization is also driven by the natural environment, accessibility, socio-economic development, and neighborhood factors and related planning [2], which is consistent with Jiang et al.’s discussion of urban expansion and socio-economic vitality using the NPP-VIIRS data. From 2012 to 2020, the Chengdu–Chongqing urban agglomeration is affected by population, industry, transportation, investment, and other aspects. The population size effect generated by population growth leads to the expansion of built-up areas and industrial agglomeration development, which further promotes urban agglomeration expansion. The flow of industrial economic elements in different regions becomes the main driving force of urban expansion. Transportation accelerates urban communication, industrial development, and urban spatial expansion. Investment activates rapid regional economic development and promotes urbanization.
5. Conclusions
Based on the NPP-VIIRS noctilucent data, this study investigates the spatio-temporal expansion of the Chengdu–Chongqing urban agglomeration from the aspects of size and form, and analyzes the expansion driving force combined with seven main dynamic factors. The results show that, first, from 2012 to 2020, the Chengdu–Chongqing urban agglomeration built-up areas exhibit circular expansion with “Chengdu” and “Chongqing” as the core cities. Second, during the study period, the expansion rate of each city first increases and then declines, and development rapidly expands and then gradually slows. Third, the urban construction of the Chengdu–Chongqing urban agglomeration is roughly centered on the development trend of Chengdu and Chongqing being closer to each other, which constantly drives the economic development of the regions around Chengdu and Chongqing. The whole area is dominated by urban interior filling and the shape of urban space is increasingly complex. Fourth, the level of economic development and regional investment are the dominant factors influencing the Chengdu–Chongqing urban agglomeration from 2012 to 2020.
Author Contributions
Conceptualization, Y.W., Y.L. and S.W.; methodology, Y.W.; software, Y.L.; validation, S.W. and Y.Z.; formal analysis, S.W.; investigation, Y.L.; resources, Y.W. and Y.L.; data curation, Y.L. and S.W.; writing—original draft preparation, Y.L., S.W. and Y.Z.; writing—review and editing, Y.W. and J.W.; visualization, Y.L.; supervision, Y.W. and J.W.; project administration, Y.W.; funding acquisition, Y.W. All authors have read and agreed to the published version of the manuscript.
Funding
This research is supported by the National Undergraduate Innovation and Entrepreneurship Training Program “Research on the spatial-temporal evolution and driving force of regional land use carbon emissions based on multi-source light data —Taking the Chengdu-Chongqing Economic Circle as an example” (Project No.: 202210626013) and the research interest group project of Sichuan Agricultural University “Research on the spatial expansion characteristics and driving force of Chengdu-Chongqing urban agglomeration based on night light data” (Project No.: 2022417).
Institutional Review Board Statement
Not applicable.
Informed Consent Statement
Not applicable.
Data Availability Statement
Not applicable.
Acknowledgments
We express our gratitude to the anonymous reviewers and editors for their professional comments and suggestions.
Conflicts of Interest
The authors declare no conflict of interest.
Abbreviation
| SPOT | Système Probatoire d’Observation de la Terre |
| NDBI | Normalized Difference Built-up Index |
| NOAA | the National Oceanic and Atmospheric Administration |
| NGDC | the National Geophysical Data Center |
| Q value | q value is the degree of interpretation of the detection factor to urban expansion, with a range of [0, 1]. |
References
- Jiang, H.P.; Sun, Z.C.; Guo, H.; Weng, Q.; Du, W.; Xing, Q.; Cai, G. An assessment of urbanization sustainability in China between 1990 and 2015 using land use efficiency indicators. Npj Urban Sustain. 2021, 1, 34. [Google Scholar] [CrossRef]
- Jiang, Y.T.; Sun, S.K.; Zheng, S. Exploring Urban Expansion and Socioeconomic Vitality Using NPP-VIIRS Data in Xia-Zhang-Quan, China. Sustainability 2019, 11, 1739. [Google Scholar] [CrossRef]
- Liu, T.; Li, L. Green development of China’s Pan-Pearl River Delta mega-urban agglomeration. Sci. Rep. 2021, 11, 15717. [Google Scholar] [CrossRef] [PubMed]
- Bai, X.M.; Shi, P.J.; Liu, Y.S. Society. Realizing China’s urban dream. Nature 2014, 509, 158–160. [Google Scholar] [CrossRef]
- Zhang, L.; Yang, L.; Zohner, C.M.; Crowther, T.W.; Li, M.; Shen, F.; Guo, M.; Qin, J.; Yao, L.; Zhou, C. Direct and indirect impacts of urbanization on vegetation growth across the world’s cities. Sci. Adv. 2022, 8, eabo0095. [Google Scholar] [CrossRef]
- Zhong, Y.; Lin, A.; Zhou, Z. Evolution of the Pattern of Spatial Expansion of Urban Land Use in the Poyang Lake Ecological Economic Zone. Int. J. Environ. Res. Public Health 2019, 16, 117. [Google Scholar] [CrossRef]
- Duh, J.; Shandas, V.; Chang, H.; George, L.A. Rates of urbanisation and the resiliency of air and water quality. Sci. Total Environ. 2008, 400, 238–256. [Google Scholar] [CrossRef]
- Wang, J.T.; Qu, S.Y.; Peng, K.; Feng, Y. Quantifying Urban Sprawl and Its Driving Forces in China. Discret. Dyn. Nat. Soc. 2019, 2019, 2606950. [Google Scholar] [CrossRef]
- Chen, J.D.; Gao, M.; Cheng, S.L.; Liu, X.; Hou, W.; Song, M.; Li, D.; Fan, W. China’s city-level carbon emissions during 1992–2017 based on the inter-calibration of nighttime light data. Sci. Rep. 2021, 11, 3323. [Google Scholar] [CrossRef]
- Chen, G.Z.; Li, X.; Liu, X.P. Global projections of future urban land expansion under shared socioeconomic pathways. Nat. Commun. 2020, 11, 537. [Google Scholar] [CrossRef]
- Bianchini, L.; Marucci, A.; Sateriano, A.; Di Stefano, V.; Alemanno, R.; Colantoni, A. Urbanization and Long-Term Forest Dynamics in a Metropolitan Region of Southern Europe (1936–2018). Sustainability 2021, 13, 12164. [Google Scholar] [CrossRef]
- Krayenhoff, E.S.; Moustaoui, M.; Broadbent, A.M.; Gupta, V.; Georgescu, M. Diurnal interaction between urban expansion, climate change and adaptation in US cities. Nat. Clim. Change 2018, 8, 1097–1103. [Google Scholar] [CrossRef]
- Sahana, M.; Hong, H.Y.; Sajjad, H. Analyzing urban spatial patterns and trend of urban growth using urban sprawl matrix: A study on Kolkata urban agglomeration, India. Sci. Total Environ. 2018, 628–629, 1557–1566. [Google Scholar] [CrossRef]
- Zhang, C.; Miao, C.H.; Zhang, W.H.; Chen, X. Spatiotemporal patterns of urban sprawl and its relationship with economic development in China during 1990–2010. Habitat Int. 2018, 79, 51–60. [Google Scholar] [CrossRef]
- Chen, C.; He, X.Y.; Liu, Z.S.; Sun, W.; Dong, H.; Chu, Y. Analysis of regional economic development based on land use and land cover change information derived from Landsat imagery. Sci. Rep. 2020, 10, 12721. [Google Scholar] [CrossRef]
- Leyk, S.; Uhl, J.H.; Connor, D.S.; Braswell, A.E.; Mietkiewicz, N.; Balch, J.K.; Gutmann, M. Two centuries of settlement and urban development in the United States. Sci. Adv. 2020, 6, eaba2937. [Google Scholar] [CrossRef]
- Zheng, Y.M.; He, Y.R.; Zhou, Q.; Wang, H. Quantitative Evaluation of Urban Expansion using NPP-VIIRS Nighttime Light and Landsat Spectral Data. Sustain. Cities Soc. 2022, 76, 103338. [Google Scholar] [CrossRef]
- Kyba, C.C.M.; Kuester, T.; de Miguel, A.S.; Baugh, K.; Jechow, A.; Hölker, F.; Bennie, J.; Elvidge, C.D.; Gaston, K.J.; Guanter, L. Artificially lit surface of Earth at night increasing in radiance and extent. Sci. Adv. 2017, 3, e1701528. [Google Scholar] [CrossRef]
- Chen, J.D.; Liu, J.L.; Qi, J.; Gao, M.; Cheng, S.; Li, K.; Xu, C. City- and county-level spatio-temporal energy consumption and efficiency datasets for China from 1997 to 2017. Sci. Data 2022, 9, 101. [Google Scholar] [CrossRef]
- Xu, L.H. Spatial and Temporal Evolution of urban Expansion in Yangtze River Delta Based on NPP-VIIRS Data. Master’s Thesis, Shanghai Normal University, Shanghai, China, 1 March 2019. [Google Scholar]
- Duque, J.C.; Lozano-Gracia, N.; Patino, J.E.; Restrepo, P.; Velasquez, W.A. Spatiotemporal dynamics of urban growth in Latin American cities: An analysis using nighttime light imagery. Landsc. Urban Plan. 2019, 191, 103640. [Google Scholar] [CrossRef]
- Chen, Z.Q.; Yu, B.L.; Zhou, Y.Y.; Liu, H.; Yang, C.; Shi, K.; Wu, J. Mapping Global Urban Areas From 2000 to 2012 Using Time-Series Nighttime Light Data and MODIS Products. IEEE J. Sel. Top. Appl. Earth Obs. Remote Sens. 2019, 12, 1143–1153. [Google Scholar] [CrossRef]
- Chen, J.Q.; Wei, H.; Li, N.; Chen, S.; Qu, W.; Zhang, Y. Exploring the Spatial-Temporal Dynamics of the Yangtze River Delta Urban Agglomeration Based on Night-Time Light Remote Sensing Technology. IEEE J. Sel. Top. Appl. Earth Obs. Remote Sens. 2020, 13, 5369–5383. [Google Scholar] [CrossRef]
- Zhao, M.; Zhou, Y.Y.; Li, X.; Zhou, C.; Cheng, W.; Li, M.; Huang, K. Building a Series of Consistent Night-Time Light Data (1992–2018) in Southeast Asia by Integrating DMSP-OLS and NPP-VIIRS. IEEE Trans. Geosci. Remote Sens. 2020, 58, 1843–1856. [Google Scholar] [CrossRef]
- Liu, Z.F.; He, C.Y.; Zhang, Q.; Huang, Q.; Yang, Y. Extracting the dynamics of urban expansion in China using DMSP-OLS nighttime light data from 1992 to 2008. Landsc. Urban Plan. 2012, 106, 62–72. [Google Scholar] [CrossRef]
- Zhou, Y.; Li, L. Spatial and Temporal Patterns of urbanization in Chengdu Plain Urban Agglomeration: A Study based on DMSP/OLS night light Data. Urban Dev. Res. 2015, 22, 28–32. [Google Scholar]
- Liu, Y.; Li, Y.C. Extraction and Analysis of urban Center Area Based on Night Light Data: A case study of Chongqing City. Compr. Resour. Util. China 2019, 37, 160–164. [Google Scholar]
- Liu, Q.Y.; Fan, J.P. Analysis of Chengdu-Chongqing Urban Agglomeration expansion under consistency correction of night light Remote sensing data. Sci. Surv. Mapp. 2022, 47, 99–108. [Google Scholar]
- Yang, R.F.; Luo, H.X. Reconstruction and Analysis of the spatial Formation Process of Chengdu-Chongqing urban Agglomeration Driven by night light data. J. Geo-Inf. Sci. 2017, 19, 653–661. [Google Scholar]
- Levin, N.; Kyba, C.C.; Zhang, Q.; de Miguel, A.S.; Román, M.O.; Li, X.; Portnov, B.A.; Molthan, A.L.; Jechow, A.; Miller, S.D.; et al. Remote sensing of night lights: A review and an outlook for the future. Remote Sens. Environ. 2020, 237, 111443. [Google Scholar] [CrossRef]
- Pu, Y.X.; Ma, R.H. Spatial and temporal evolution of urban size distribution in the Yangtze River Delta. Geogr. Res. 2009, 28, 161–172. [Google Scholar]
- Xie, Y.H.; Weng, Q.H. Updating urban extents with nighttime light imagery by using an object-based thresholding method. Remote Sens. Environ. 2016, 187, 1–13. [Google Scholar] [CrossRef]
- Zhong, Y.; Lin, A.W.; He, L.; Zhou, Z.; Yuan, M. Spatiotemporal Dynamics and Driving Forces of Urban Land-Use Expansion: A Case Study of the Yangtze River Economic Belt, China. Remote Sens. 2020, 12, 287. [Google Scholar] [CrossRef]
- Liu, S.H.; Li, X.B. Spatial patterns of urban land use growth in Beijing. J. Geogr. Sci. 2002, 12, 266–274. [Google Scholar]
- Wang, H.J.; Zhang, B. Multi-dimensional analysis of urban expansion pattern and driving force of Beijing-Tianjin-Hebei Urban Agglomeration based on barycentric GTWR model. Acta Geogr. Sin. 2018, 73, 1076–1092. [Google Scholar]
- Guan, X.L.; Fang, C.L. Spatial and Temporal Characteristics of urban land expansion in Wuhan Urban Agglomeration. J. Nat. Resour. 2012, 27, 1447–1459. [Google Scholar]
- Liu, H.X.; Zhu, K.W.; Li, Y.C. Urban Expansion in Chengdu-Chongqing Economic Zone in Recent 20 Years: Based on DMSP/OLS Night Light Data. J. Chongqing Norm. Univ. 2017, 34, 117–126. [Google Scholar]
- Liu, J.Y.; Wang, X.S. Convex hull Principle is used to identify types of urban land space expansion. Acta Geogr. Sin. 2003, 06, 885–892. [Google Scholar]
- Batty, M. Exploring Isovist Fields: Space and Shape in Architectural and Urban Morphology. Environ. Plan. B Plan. Des. 2001, 28, 123–150. [Google Scholar] [CrossRef]
- Xu, J.J.; Zang, S.Y. Characteristics and Driving Forces of urban expansion in Harbin. Bull. Surv. Mapp. 2019, 09, 68–72. [Google Scholar]
- Zhou, Z.H.; Ren, Y.Y. Analysis of Urban Spatial Morphology Characteristics in Wuwei from 1990 to 2016. Ind. Archit. 2020, 50, 120–126. [Google Scholar]
- Du, H.B.; Wei, W. Spatial and temporal patterns of carbon emissions from energy consumption in the Yellow River Basin and their influencing factors: Based on DMSP/OLS and NPP/VIIRS night light data. Geogr. Resaust. 2021, 40, 2051–2065. [Google Scholar]
- Niu, Y.W.; Zhao, X.C. Spatial differentiation of land use carbon emissions in Changzhutan County based on NPP-VIIRS nighttime lighting. J. Environ. Sci. 2021, 41, 3847–3856. [Google Scholar]
- Shi, K.F.; Huang, C.; Yu, B.; Yin, B.; Huang, Y.; Wu, J. Evaluation of NPP-VIIRS night-time light composite data for extracting built-up urban areas. Remote Sens. Lett. 2014, 5, 358–366. [Google Scholar] [CrossRef]
- Zhang, Z.W.; Liu, Y.F. Spatial Expansion and Correlation of Urban Agglomeration in the Yellow River Basin Based on Multi-Source Nighttime Light Data. Sustainability 2022, 14, 9359. [Google Scholar] [CrossRef]
- Zhang, H.; Liang, C.; Pan, Y. Spatial Expansion of Built-Up Areas in the Beijing–Tianjin–Hebei Urban Agglomeration Based on Nighttime Light Data: 1992–2020. IJERPH 2022, 19, 3760. [Google Scholar] [CrossRef]
- Zheng, W.S.; Kuang, A.P.; Liu, Z.; Wang, X. Analysing the spatial structure of urban growth across the Yangtze River Middle reaches urban agglomeration in China using NPP-VIIRS night-time lights data. GeoJournal 2021, 87, 2753–2770. [Google Scholar] [CrossRef]
- Li, J.F.; Pan, J.H. Urban Spatial Expansion in Gansu Province from 1992 to 2012 Based on Night Light. J. Glaciol. Geocryol. 2016, 38, 829–835. [Google Scholar]


Disclaimer/Publisher’s Note: The statements, opinions and data contained in all publications are solely those of the individual author(s) and contributor(s) and not of MDPI and/or the editor(s). MDPI and/or the editor(s) disclaim responsibility for any injury to people or property resulting from any ideas, methods, instructions or products referred to in the content. |
© 2023 by the authors. Licensee MDPI, Basel, Switzerland. This article is an open access article distributed under the terms and conditions of the Creative Commons Attribution (CC BY) license (https://creativecommons.org/licenses/by/4.0/).