Abstract
As a strong and effective alternative to disposable food boxes that cause serious pollution consequences, reusable takeaway containers are promising in terms of environmental protection. However, at present, in the service process of leasing, using, distribution, and recycling, reusable takeaway containers have many problems, such as incomplete cleaning, resulting in unhygienic conditions, repeated use of materials that are not safe enough, food spillage, leakage or theft of customer phone and address information due to exposed takeaway order labels, and wrong containers taken by customers. In addition, there is a lack of objective and comprehensive evaluation methods and systems to guide their design and improvement. In order to solve the current problems of reusable takeaway containers and explore a quantitative approach for evaluation of design solutions from the perspective of users, this paper analyzed user behaviors and needs through user interviews, questionnaires, user journey maps (UJM), and other methods. Analytic hierarchy process (AHP) and fuzzy comprehensive evaluation (FCE) were used to construct an evaluation model for the design of reusable takeaway containers, and it was calculated as a function of the survey dataset. The comprehensive index weight model was established, and the design indicators were sorted to obtain the priority of design elements. Three design schemes were proposed and calculated by combining questionnaire data and the FCE method to obtain the optimal Scheme B. The results showed that the combination of UJM and AHP–FCE method framework was suitable for scheme evaluation and design development, which could provide effective and detailed user evaluation for designers and guide the direction of product improvement.
1. Introduction
In recent years, the takeaway food industry, represented by the service model of consumers ordering online and having takeaway food delivered to their doorstep by a delivery person, has developed rapidly, and the amount of takeaway waste has increased year by year. With 17 billion orders and 500 million consumers in China in 2020, each order contains an average of 1.63–2.98 food containers, 70% of which are made of plastic [1]. Based on the average weight of 24 grams per plastic food container, about 0.46–0.85 million tons of waste plastic food containers were generated in 2020. The proposal for a revision of the EU legislation on packaging and packaging waste proposes that 10% of ready-to-eat takeaway food packaging should be made available in reusable packaging within a system for reuse or refill by 2030, and 40% by 2040 [2]. Reusable takeaway container means a ready-to-eat takeaway food container provided by a container supplier or takeaway merchant, returned to a collection point after being used by consumers, and then cleaned for reuse [3,4,5,6,7]. Reusable takeaway container models play a significant role in reducing takeaway food box waste and plastic waste. Recent research has shown that plastic takeaway food containers in reuse systems have less global warming potential than single-use plastic containers after being used just two to four times [3], so they have attracted the attention of many scholars and enterprises. Most academics in the field focus on their recycling systems and supply chain issues. For example, life cycle assessment (LCA) [8], life cycle environmental impact (LCEI) [9], Internet of things (IoT) [10], supply chain network design (SCND) [11], and sustainable supply chain management (SSCM) [12] have been introduced into the research on circular packaging systems. However, there are few studies on specific design improvement strategies for the appearance, structure, and functionality of reusable takeaway containers. Tamako House in Japan applied batch ordering and driver door-to-door recycling to realize the recycling of takeaway containers, but it still used traditional convenience boxes. Numata found that offering rewards helped to recycle takeaway containers [13]. Bold Reuse (United States), ReCIRCLE (Switzerland), Returnr (Australia), Ozarka (the Netherlands), Ozzi (United States), and Shuangti (China) all started the practical exploration of reusable takeaway containers. Yuying et al. (2021) [14] put forward the design of a traceable reusable takeaway container based on electronic tags, and they inlaid highly temperature-resistant NFC electronic tags on anti-fall, highly temperature-resistant, disinfected, and sealed containers. Zhiduo et al. (2021) [15] designed a new reusable takeaway container with food-grade silicone oil paper bags, and consumers only needed to tighten the paper bag seal and throw the bag into a kitchen waste bin with leftovers. Melamine resin material is ideal to make reusable takeaway containers owing to its collision resistance, corrosion resistance, high temperature resistance, nontoxicity, tastelessness, and low price. Therefore, the Shuangti (China) intelligent reusable takeaway containers made from food-grade materials followed the traditional box shape and used a built-in RFID chip to trace the whole process, and they were featured with nontoxicity, tastelessness, heat resistance, and excellent hardness.
It is essential to study reusable takeaway containers in terms of consumers’ use process and satisfaction. In the context of strategies to promote circular economy and sustainable development in countries and regions such as China, the EU, the US, and Australia [16,17,18,19,20], most consumers are willing to support reusable takeaway containers [3,6]. However, the market coverage and user penetration of reusable takeaway containers are currently low compared to those of disposable takeaway containers, and many reusable container companies such as Bold Reuse, ReCIRCLE, and Returnr serve only a few cities in their countries. The national replacement rate of reusable takeaway containers for disposable containers is less than 10% in China [21]. Some shortcomings in reuse systems and product design contribute to “the intention–behavior gap”. For one thing, there is no comprehensive and standardized reference for the design strategies of reusable takeaway containers. Since there is no unified design specification for the current design of reusable takeaway containers, different reusable takeaway companies vary in material selection, structural design, size, and other aspects, leading to increased difficulties in automatic dishwasher cleaning. As reusable takeaway containers are used by others and then washed and reused, consumers who choose to use them have greater concerns about their disinfection, hygiene, and food safety. People prefer to reuse the containers that are durable, resistant to appearance changes, and easy to clean, and the factors such as the material of containers, the type of packaging, the closure mechanism, and the appearance of environmental propaganda all influence consumers’ willingness to use [6,22]. Furthermore, reusable takeaway containers have a single style and lack designs for the diversity of takeaway food types. There is still room for research and improvement in the convenience of container use, food safety, the match of container specifications with different food components, and container cleaning [7]. With the increase in perceptual consumer demands for food packaging experience and quality among takeaway food consumers [23], it is urgent to solve the issue of how to improve user satisfaction through design and realize large-scale market use.
For reusable takeaway containers with multiple design elements, comprehensive multi-attribute and multi-factor evaluation is an appropriate method, which can help to construct a comprehensive evaluation model of design solutions, allow for the ranking of design elements in terms of importance, and turn traditional subjective user evaluations into quantifiable values, thus assisting designers in understanding more clearly where improvements are needed. Analytic hierarchy process (AHP) is a systematic and hierarchical analysis method proposed by Saaty, and it can combine quantitative indicators with qualitative analysis. It divides the problem to be solved into several different factors and levels in accordance with specific affiliations, and then calculates the importance ranking of each level’s component factors related to the target elements [24]. Fuzzy comprehensive evaluation (FCE) is a comprehensive evaluation method based on fuzzy mathematics, and it can transform qualitative evaluation into quantitative one [25]. The combined use of AHP and FCE allows for an organic combination of qualitative evaluation and quantitative calculation and transforms subjective evaluation results into precise values. AHP–FCE has many applications in the field of packaging design. Zixiang et al. [26] used it to design and evaluate the packaging of agricultural products. Xu Li et al. [27] applied it to the evaluation of green express packaging. However, to our knowledge, the AHP-FCE method has not been applied to the design of reusable takeaway containers. There are many methods to determine the multilevel evaluation index in AHP. Xian et al. [28] constructed an evaluation index including emotional factors according to the proposed extended three-level emotional design theory (ETTED) and used the AHP–FCE to guide the emotional design process of the intelligent bed. Chabi et al. [29] used strengths, weaknesses, opportunities, and threats (SWOT) to conduct interviews and research, and developed appropriate strategic elements as an analytical element of AHP. Zaim et al. [30] mentioned that quality function deployment (QFD) could help identify user needs, and the integrated QFD–AHP method could rank product function priorities [31]. Although the above methods propose feasible evaluation indicators from multiple perspectives, they have limitations in product service process systems with multiple contacts and diversified user needs.
User journey map (UJM) [32] is often used in the field of service design, which helps to summarize product use processes and interactive behaviors of users, analyze multiple contacts, and find pain points and opportunities. It can also summarize user needs and product features, as well as the deficiencies in product use, interaction, etc. Therefore, with the help of UJM, this study analyzed the problems existing in the current use process of reusable takeaway containers and extracted the design points from the perspective of user needs, thus enabling the design evaluation to be better recognized by users and attracting more users. In this study, 14 experts were invited to provide advice, and the results of expert research data were obtained by comparing and scoring the importance of each design element. Three design schemes were proposed for reusable takeaway containers, 253 users were invited to evaluate these schemes, and the user satisfaction of each design scheme was judged by calculating the results of the user evaluation scores.
This study aims to summarize the design points of reusable takeaway containers and determine the importance of each point. Based on user evaluation, it proposes a design solution evaluation method, which is used to select an optimal design solution. UJM is combined with the AHP–FCE framework evaluation model to explore the factors that improve user acceptance and satisfaction, reduce user concerns, guide design direction, facilitate design innovation, and promote popularization of reusable takeaway containers. The contributions of this paper are as follows: (1) a UJM-based evaluation model for reusable takeaway containers is proposed through investigation and analysis; (2) a new, comprehensive, and quantitative evaluation system is determined for reusable takeaway containers, the prioritization of the importance of each design element is confirmed, and a data processing method suitable for this study is proposed to improve the accuracy of the evaluation; and (3) three design schemes are proposed, the AHP–FCE method is used to evaluate them comprehensively, and a design scheme with the highest user satisfaction is obtained.
The structure of the remainder of this paper is as follows: Section 2 introduces the construction of an evaluation system for reusable takeaway containers using UJM; Section 3 describes the expert survey data processing methods and the AHP–FCE evaluation process; Section 4 uses the AHP–FCE to comprehensively evaluate the design schemes of the reusable takeaway containers; Section 5 presents an analysis and discussion of the evaluation results; and Section 6 provides a summary and outlook.
2. Materials and Methods
2.1. Research Process
The research process in this paper was divided into two main steps. The first was interview research with experts. A total of 14 experts were invited for one-on-one interviews [33], including four experts in the field of reusable takeaway containers, two experts in the field of circular economy business models, two university professors, two experts in the takeaway food industry, two executives in the rider service industry, and two senior designers. The interviews were conducted between October 2021 and February 2022, and each expert had more than five years of experience. The experts made recommendations on the current service model of reusable takeaway containers, pointed out their pain points and design elements, and completed an evaluation questionnaire based on the AHP methodology.
Combining the expert recommendations, the results of preference studies on the recycling model of reusable takeaway containers [6], and the practical exploration of current enterprises, the service process of the whole life cycle of reusable takeaway containers was summarized as follows: (1) suppliers of reusable takeaway containers provided clean containers to merchants; (2) After consumers chose to use the reusable takeaway containers, the merchants put the food into the containers and distributed them to self-pickup cabinets by delivery staff; (3) consumers took their containers from the self-pickup cabinets; (4) consumers finished their meals and put the reusable takeaway containers in recycling cabinets; (5) the used containers were recovered by a specialist and sent to a cleaning factory; and (6) clean containers were packed and distributed to the merchants, as shown in Figure 1.
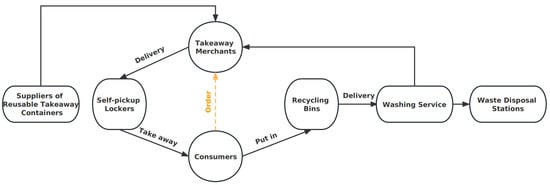
Figure 1.
The service process of the whole life cycle of reusable takeaway containers.
Then, to identify the problems in the use of reusable takeaway containers, user behavior observation, interviews, and questionnaire research were performed mainly in Guangzhou and Chengdu during the second half of 2021 to the first half of 2022. The peak meal periods of 11:00–13:00 and 17:00–19:00 were selected to investigate the use of reusable takeaway containers in a university in Guangzhou. The reusable takeaway container service in this university has been available for more than two years, many consumers have used it, and the service process is consistent with the process in Figure 1. The main research method was to observe the delivery method, the number of containers delivered at a time, the process of storing the containers in self-pickup cabinets, the spillage of the containers, the process of picking up the containers by consumers, the pickup method, and the number of containers picked up by each consumer during the 2-hour peak meal periods. The work of washing plants during the peak meal periods was observed, including the action of the staff before putting the containers into a washing machine, the washing process of the machine, and the process of the staff packing the clean containers. Interviews and questionnaires were conducted for consumers, delivery workers, merchants, and relevant staff from reusable takeaway container suppliers. The total number of participants was 253, of which consumers, distributors, merchants, and relevant staff from reusable takeaway container suppliers were 157, 53, 30, and 13, respectively. Table 1 provides their additional demographic information. They were asked about the problems they encountered in the process of using the containers, as well as their needs, preferences, concerns, and suggestions about the containers’ functions. Moreover, they were invited to fill out a questionnaire survey on the design of reusable takeaway containers. They evaluated each element of the three design options according to the FCE process. These experts and participants were invited again in December 2022 to conduct interviews and complete questionnaires due to additional research on the durability and weight of the containers.

Table 1.
Demographic details of survey participants (n = 253).
2.2. Analysis of the Design Requirements of Circular Takeaway Food Boxes
The first step in constructing the evaluation system was to analyze the design requirements. The basic functional requirements were analyzed by summarizing different takeaway types and food characteristics. From the service process and user behavior analysis of reusable takeaway containers, the user demands for reusable takeaway containers were identified, and the potential corresponding functional requirements were summarized.
2.2.1. Analysis of Basic Functional Requirements
The basic function of reusable takeaway containers is to be able to hold food and meanwhile ensure that the food is intact for a period of time. Common disposable plastic takeaway boxes are round or square, ranging from 300 mL to 3500 mL in size. Generally, small portions of salads, stir-fried dishes, rice, noodles, etc. use 300–450 mL disposable takeaway boxes, medium portions of food use 500–1250 mL ones, large portions of food use 1500–1750 mL ones, and extremely large portions of food such as hot pots and stewed fish in Chinese food use special ones or 2000–3500 mL ones. In addition, there are different sizes of carton packaging for hamburgers, chips, pizza, etc.
In order to meet the diversified demands in serving takeaway food, reusable takeaway containers needed to be designed to accommodate food types as many as possible. To expand the takeaway coverage of reusable takeaway containers, the basic functional requirements were analyzed in terms of food characteristics (see Figure 2).

Figure 2.
The functional requirements of reusable takeaway container for different takeaway food types.
2.2.2. Analysis of User Demands Based on UJM
By classifying the contacts in the service process, it was found that there were four user groups: consumers, merchants, riders, and company employees providing reusable takeaway container services. This paper combined UJM with a service flow chart to analyze user behaviors from the perspective of the service process, summarize the contacts in the service process of typical reusable takeaway containers, and identify four user groups, mobile phone APP online interaction terminals, takeaway self-pickup and recycling cabinets, cleaning factories and cleaning machines, distribution boxes for storing containers in the delivery process, etc. It was shown that the cleaning plants mainly adopted the way of automatic machine cleaning, and the staff only needed to open a container, pour out residual food, and then put the container into a machine. The machine cleaned, disinfected, and dried the container at 60–70 °C for 30 min. The typical users of these four groups were observed separately, and they were integrated according to the service process of the reusable takeaway container to identify the problems in their use process, explore their potential and unknown needs, and integrate them into core needs, as shown in Figure 3.
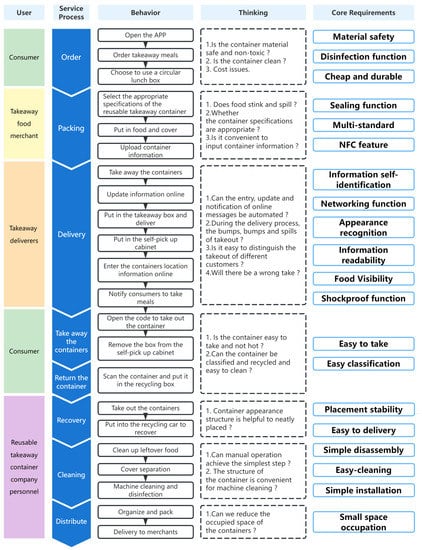
Figure 3.
The improved UJM diagram.
Many studies have revealed that the environmental impact of reusable takeaway containers depends on the number of times they are reused [7,9,34]. Accorsi et al. considered a maximum lifespan of plastic containers for 70 times, and Harnoto (2013) thought they, on average, were reused 43 times [34]. Several reusable food container companies list their containers made of the following materials and the number of times these containers can be reused, and PP is one of the most popular materials used, as shown in Figure 4.
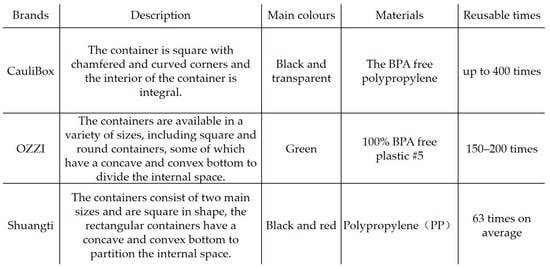
Figure 4.
The reusable takeaway containers used by several businesses.
2.3. Analysis of the Design Requirements of Reusable Takeaway Containers
According to the results of the survey and analysis, the main needs of reusable takeaway containers focused on the following four aspects: material, appearance, structure, and information. The quality and cost of containers can ensure their cycle life and safety. Reusable takeaway containers should have a clear identification system and user-friendly design and be easy to distinguish to ensure the convenience of users. The structure of containers should be improved to facilitate the intact transportation of food and the maximum preservation of flavor. Some intelligent means can be applied to enhance user experience and use convenience.
According to the four first-level evaluation indicators, the demand was summarized. The design elements were further clarified, and the second-level indicators were obtained. Thus, the evaluation system of reusable takeaway containers was established, as shown in Figure 5. The first-level evaluation indicators were represented by B1, B2, B3, and B4, while the second-level evaluation indicators [35] were represented by Bi1, Bi2, …, Bin (i = 1, 2, …, n). The secondary indicators were detailed in Table 2. With regard to the acquisition of various evaluation parameters, a questionnaire was used. The material, function, and structure of each solution were presented to all participants and the three design schemes were explained in detail. The models of each design scheme were created, and users were invited to experience them. The users were asked about their satisfaction with each design element and required to make a subjective judgment. Later, according to the proportion of the number of users who chose each comment in the set of comments, the judgment matrix of the design solutions was determined. For example, 45.85% of the users thought that the safety/nontoxicity aspect of Solution 1 was excellent and could meet their expectations and requirements well, so the value of 0.46 was taken by rounding off.
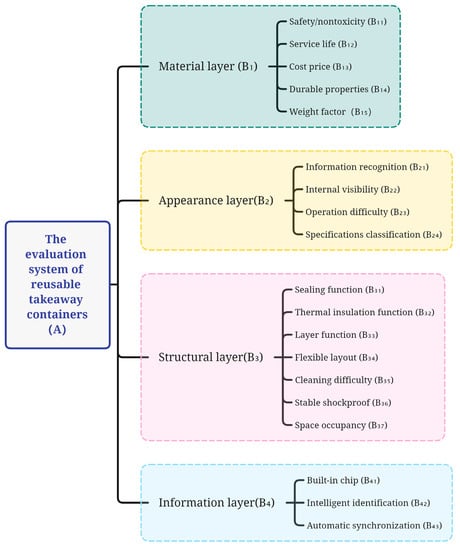
Figure 5.
The evaluation system of reusable takeaway containers.

Table 2.
Definitions of secondary indicators.
3. Evaluation Process Based on AHP–FCE Method
3.1. Subjective Weights Based on AHP Method
The experts and four user groups in the service process were invited to score the four first-level indicators and eighteen second-level ones before calculating their weight in the index layer using Matlab on a scale of 1–9 [36] (see Table 3). The judgment matrix A = (aij)n×n was calculated, as shown in Equation (1), where aij is the ratio of Bi to Bj, and thus aij > 0.
where aij represents the i-th row and j-th column of indicators in the judgment matrix and is the expert rating of Bi compared to Bj, and n represents the number of indicators in each row and column.

Table 3.
Judgment scale and meaning.
Considering the multilevel and multi-index evaluation, with the phenomenon of inconsistent results in the process of expert evaluation, a consistency test was needed [37]. Saaty [24] proposed using the eigenvector corresponding to the maximum eigenvalue λmax as the weight vector w. The geometric average method was used to calculate the weight vector wi, as shown in Equation (2):
where wi is the eigenvector for the i-th element, and aij and akj are indicators in the judgment matrix. The maximum eigenvalue of the matrix λmax was calculated using Equation (3):
where λmax is the maximum eigenvalue of the judgment matrix A, and (Aw)i is the i-th element of the product of matrix A and eigenvector w. The one-time index CI was calculated using the following Equation (4), where CI = 0 indicates complete consistency; and a closer value CI to 0 indicates a higher consistency.
To measure the size of CI, the corresponding average random consistency index RI was selected to calculate the consistency ratio CR, as shown in Equation (5). Generally, when the consistency ratio is less than 0.1, it is considered that the degree of inconsistency of A is within the allowable range and passes the consistency test [38]. The average random consistency index RI given by Saaty was shown in Table 4.

Table 4.
Random consistency index.
In order to ensure the rationality and effectiveness of the questionnaire data, it was necessary to process the expert questionnaire data uniformly. Since the 1–9 scale method had a score value of 0–1 for the unimportant degree of scoring, a direct arithmetic average would result in errors. Thus, a modified weighted arithmetic average was used for the calculation. It was known that a 1/2 to 1/3 scale difference was equal to a 2 to 3 scale difference, so the original expert scoring values were set to x and y, of which x represents the score for importance, i.e., 1 ≤ x ≤ 9, while y represents the score for unimportance, i.e., 0 < y < 1. Accordingly, the formula for calculating the mean aij of each expert scoring was
where n is the number of x-factors, m is the number of y-factors, zi is the average importance of the expert evaluations before correction, and aij is the average of the corrected evaluations following the 1–9 evaluation criteria.
3.2. Comprehensive Evaluation Based on FCE Method
Firstly, the Likert scale method [39] was used to determine the evaluation set V = {V1, V2, V3, V4, V5} = {excellent, good, general, slightly poor, very poor}. The weighted average method was used to assign values to each comment in the evaluation set and then obtain the comment vector β = {100, 85, 70, 55, 40}. The individual index in the index set was evaluated according to the evaluation set and normalized [40], and then the evaluation matrix Ri was obtained. Wi was used to represent the weight vector of each factor of the secondary index related to the primary index factor [41]. Therefore, the calculation of the fuzzy evaluation vector Ci of each design element was shown in Equation (8).
According to the fuzzy evaluation vector of the secondary index, the fuzzy evaluation matrix R = (C1, C2, …, Cn)T of the primary index could be obtained, where W was used to represent the weight vector of the primary index factor. Accordingly, the calculation of the total objective fuzzy evaluation vector C was
The weighted average fuzzy operator relationship M (⊕) [42] was used for calculation, as shown in Equation (10):
where rji refers to the indicator in row j and column i of the evaluation matrix and n is the number of indicators. The percentile score N of each design was
4. Comprehensive Evaluation of Reusable Takeaway Containers
According to the evaluation system construction in Section 2 for reusable takeaway containers and the comprehensive evaluation process in Section 3 (AHP–FCE), the weights of the index elements of reusable takeaway containers were calculated, and the design scheme was comprehensively evaluated.
4.1. Calculation and Testing of Index Layer Weight
The scoring data from the experts were summarized. In order to ensure the rigor of the evaluation questionnaire data, maximum and minimum values were removed. The mean value was calculated according to the above method, and the mean matrix of the expert score was obtained. According to the concept of AHP, the weight of each index layer was calculated, and the results were shown in Table 5, Table 6, Table 7, Table 8 and Table 9.

Table 5.
Judgment matrix and weight value of primary index layer.

Table 6.
Judgment matrix and weight value of material layer.

Table 7.
Judgment matrix and weight value of appearance layer.

Table 8.
Judgment matrix and weight value of structural layer.

Table 9.
Judgment matrix and weight value of information layer.
It could be known that the calculation results met the criterion CR < 0.1, thus passing the consistency test. The value of each level of the elements was weighted, and the comprehensive weight value of each element was obtained [43] (see Table 10).

Table 10.
Comprehensive weight value of each element.
4.2. Design Solutions of Reusable Takeaway Containers
According to the analysis and summary of user requirements and the comprehensive weight of design elements based on the AHP method, three schemes were designed (see Table 11).

Table 11.
Three design schemes.
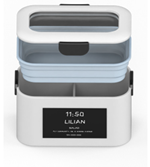
Scheme (A). This scheme adopts a double-layer structure. On the one hand, it ensures that the container has better thermal insulation performance to avoid scalding users due to the high-temperature shell. On the other hand, the stable shockproof function of the container is strengthened. The transparent design of the lid allows the food to be observed directly from the outside to avoid being taken by mistake. Merchants can directly write the order information such as order name, address, telephone number, and delivery time using a water-soluble pen in the writing area of the container. There are two specifications for the container: 190 × 120 × 112 mm and 190 × 120 × 82 mm. Merchants can flexibly choose one to meet the needs of daily orders.
The separation structure of the lid is convenient for stacking, storing, and transporting the container, and can save space and reduce the difficulty of cleaning. The bottom and cover of the container are designed with consistent bumps, which contribute to the stability of the transport process. Moreover, four opening and closing buttons are designed to avoid the opening of the container caused by bumps during transportation and ensure the tightness of the container. The opening and closing buttons on the side of the container can be used as a handle after opening. In order to increase the variety and layout of the food and ensure a certain degree of flexibility, a folding silicone box is set inside the container, and merchants can freely adjust as needed.
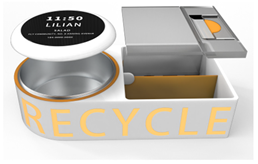
Scheme (B). The left side of the container is a circular stainless-steel insulation barrel, with a black writing board on the lid. A temperature-sensitive color-changing component is provided in the orange ring next to the insulation liner, and different temperatures have different colors, which can visually display the temperature of the food. The right side is a square box. A transparent box cover is used to facilitate the observation of the internal food. The internal partition can slide, rotate and stand, or be removed to meet the needs of different types of food and avoid being tainted in flavor. When a customer orders only one type of food, it can also guarantee that there is enough space. The overall size of the container is 220 × 110 × 60 mm. In order to save transportation space, the bottom of the container is designed with a concave–convex structure that is consistent with the top of the container, which can also enhance stability during transportation.
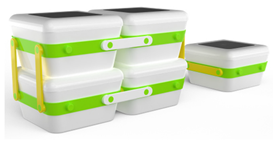
Scheme (C). This scheme adopts a modular design, creatively divides the container into multiple small boxes, and allows the selection of the number of the boxes according to different types and quantities of food ordered by customers. The size of each small box is 110 × 110 × 66 mm. The side of the container is designed with a rotating buckle component, which can be used to connect the small boxes after the package is completed. The transparent plastic plate at the top of the container can be used to not only see the internal food, but also write customer information. Each box has a chip for information tracking, and merchants only need to enter the corresponding number of the box. This modular approach can not only prevent the mixture of food, but also ensure the freedom of customer orders, and thus it has a wide range of applications.
4.3. Design Scheme Evaluation
To evaluate the design schemes based on the above index weight value and the FCE method, 253 participants were invited to fill out the questionnaire. The questionnaire data were normalized and statistically analyzed, and the results were shown in Table 12 by taking Scheme A as an example.

Table 12.
Normalized results of evaluation statistics.
According to the statistical data and the above formula, the evaluation matrix R1 of the secondary evaluation indicators was established, where the weight value W1 was applied for calculation at the material level.
Similarly, it could be calculated that
The total objective fuzzy evaluation vector C could be obtained according to the above steps.
Combined with the comment vector, the percentile score of Scheme A could be calculated as
Similarly, using the data in Tables S1 and S2, the scores could be calculated as 90.3 and 87.8 points for Schemes B and C, respectively.
4.4. Validation Test
Sensitivity analysis was performed to verify the validity and stability of the calculation results. The impact of changing the weight coefficients of the criteria on the design scheme scores and rankings was checked [44]. The weight of a factor was selected to be modified by 10%, i.e., the factor was modified by 10%, 20%, …, and 100%, as shown in Equation (18). The weights of the remaining factors were modified according to the formula, so that the sum of the weights satisfying the condition should be equal to 1, as shown in Equations (19) and (20). Since there were 19 indicators in the judgment matrix, 190 scenarios were formed.
where w1nv is the new value of the jth factor weight after modification, w1pv is the value before modification, μ is the percentage of modification (The value of μ was 0, 10%, 20%, …, 90% because the product calculation was used), w2pv is the value of the remaining factor before modification, w2qv is the new value of the remaining factor, and n is the number of factors, i.e., 19. The modified factor weight was applied to calculate the design solution scores, and the results were shown in Figure 6.
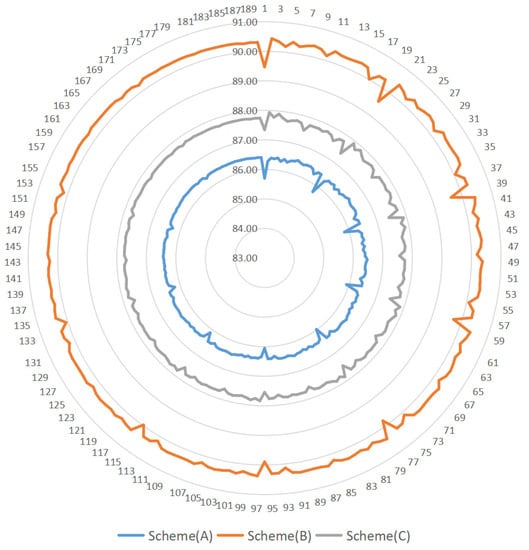
Figure 6.
Impacts of changes of criteria weight on the score and ranking performance of the alternatives.
It could be seen from Figure 6 that the changes in the factor weight did not have much impact on the preference of the design options, and the ratings did not change, either. Although the specific scores for each design option showed some variations, for the most part they remained stable within a one-point deviation. To demonstrate the effectiveness of the improved algorithm, comparisons were made with the two multiple expert data processing methods for AHP, i.e., the arithmetic average method and the geometric average method, as shown in Table 13.

Table 13.
Combined weight values for the secondary indicators in the three methods.
From the above data analysis, it could be seen that there were still differences in the results obtained by the above three algorithms for the same original data calculation. The influencing factors had relatively large changes. For instance, information recognition (B21) and internal visibility (B22) dropped from the 4th and 11th place to the 14th and 19th place, respectively, while the rankings of B36 and B43 rose to the 12th and 7th place, respectively, and B24’s ranking went up and down. The arithmetic average method, which simply summed the weight scores of the experts and averaged them, had the problem of inconsistent scales, resulting in large errors. The geometric average method also had some errors. For example, intelligent identification (B42), which ranked the 2nd, was based on built-in chip (B41) and therefore should not be more important than the ranking of built-in chip (B41). In this paper, the arithmetic average method was based on the unified scale, the original data were corrected, and the weighting calculation was carried out on this basis to obtain the final weighting calculation results. It could be noted that the B14 indicator rose from the 5th to the 3rd place, overtaking the B41 factor, and in practice the integrity of the container and its ability to function were more important than whether it had a chip. The ranking of the factors at the appearance level decreased and that at the structure level increased. This change weakened the error due to users’ preference for a particular aesthetic style of design and concentrated more on the experience of functionality, thus respecting objective facts more and making the overall weighting more precise.
5. Results and Discussion
5.1. Discussion on the Impact of Each Factor
Based on the above research findings and the calculation results of statistical data, the following results could be obtained:
- According to the calculation results of the percentile score of each scheme, Scheme B was the best. Unlike previous superficial evaluation methods, the users’ evaluation was refined with the AHP–FCE method, which allowed the understanding the score of the specific level of the design scheme through the score of each index layer, thus helping to analyze and improve the deficiencies. For example, more users found that the container of Scheme A was difficult to clean, and the embodiment of intelligent recognition and automatic synchronization was not clear enough, so this scheme could not directly guide and indicate the users’ behavior.
- According to the weights of the first-level indicators in Table 10, the users’ concerns about the reusable takeaway containers were in the following order: material > structure > information > appearance. Although the appearance of the product was the first sensory source and provided the most intuitive feeling, the factors determining whether the users chose to use or purchase a reusable takeaway container still focused on quality assurance, use experience, and product functions.
- According to the comprehensive weight value and ranking of each secondary indicator, the visual chart (Figure 7) and the ranking of the comprehensive weight value of each design element could be obtained, as shown in Table 10. In general, the primary appeal to the users was that the material of the reusable takeaway container was safe and nontoxic toward human health. Therefore, it is necessary to select the materials that meet international standards and avoid the potential risk of microplastics [45,46] being ingested as far as possible. The secondary focus was on the service life, durable properties, sealing function, built-in chips to realize the entry of reusable takeaway container information, etc. From the perspective of each level of indicators, in terms of material, the safety and health of the container, its strength and durability, and its ability to withstand multiple uses were the most important. In terms of appearance, simple use, minimal effort in opening and closing the containers, and clarity of order information were the primary concerns of users. In terms of structure, excellent sealing, spillage prevention, good thermal insulation performance, and easy cleaning were the main needs of users. In terms of information, a built-in chip to achieve full traceability was a main design point.
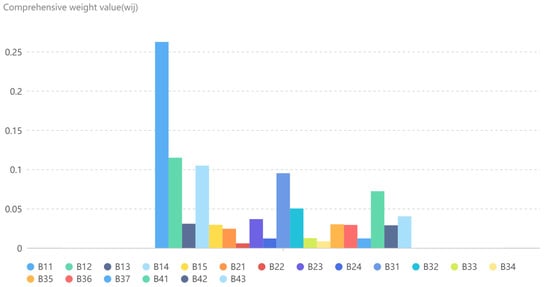 Figure 7. Comprehensive weight chart of secondary indicators.
5.2. Comparison and Proposal of Reusable Takeaway Container Options
Compared to the existing reusable takeaway containers, Scheme (B) adopts a combination of stainless steel and PP materials and redesigns the internal space division of the container to make it able to accommodate different types of takeaway food at the same time. A spiral structure instead of a traditional buckle structure is used in the design scheme to improve the tightness of the reusable takeaway container. The addition of external details, such as grooves and handles, provides intuitive guidance for users on how to use the container, and improves user experience and sense of quality. Unlike the common single-layer shell, the double-layer shell used in Scheme (B) ensures the physical strength of the container, improves its durability, reduces the adverse effects caused by bumps and knocks, and meanwhile enhances its thermal insulation performance. To change the invariable structural design of traditional containers, a dismountable and adjustable internal layout is designed to meet the needs of a wide range of takeaway orders and be easy to clean each corner of the container.
The built-in chip and automatic synchronization functions in Scheme (B) help to coordinate and deal with all aspects of information such as takeaway order information, consumer address, container location information, and merchant packing information in the process of using the circular service, which can be concretely embodied as follows: merchants put takeaway food into the reusable takeaway container, scan takeaway food information and container number, and synchronize them online; consumers can check the location and attributes of the container on their mobile phones; delivery staff scan the container and put it into a self-pickup cabinet to automatically inform consumers to take it; and then consumers scan the container and put it into a recycling cabinet to automatically inform suppliers and delivery staff of storage information and remind them to collect the used containers in time.
According to the user evaluation model of Scheme (B) (Table S1), it can be learned that the container has a higher rating from more users in terms of built-in chip and intelligent identification, safety function, sealing function, and durability properties. The poor evaluation of the various design factors of the scheme focused on the weight factor, stable shockproof and the cost price of the container, which requires continued improvement. In the takeaway food service, a design evaluation system can be used to improve the design of specific containers, and at the same time APP development can be combined to provide a more refined service and enhance user experience, including full process tracking, container usage data maps, cleaning process data, customized services, etc. The data on the recycling process of containers can be recorded for the convenience of both users and delivery staff.
In terms of the appearance and structure of reusable takeaway containers, the design of frequently bent structure should be reduced, and concave–convex and frosted treatment methods should replace printed ones to increase the durability of containers, decrease the wear and tear caused by repeated use, and avoid the problem of low usage intention due to the appearance. Moreover, a variety of container specifications should be explored to meet diversified demands of users.
In terms of the return of containers during the recycling process, on the one hand, incentive measures can be employed to encourage consumers to return them on time, and on the other hand, smart chips can be adopted to monitor consumer behaviors. In terms of cost, the number of times reusable takeaway containers are recycled should be increased as many as possible in their design because it is closely related to their economic benefits, and other ways to grow revenue should also be explored, such as seeking government support to reduce some taxes, or seeking cooperation with other enterprises to gain some profits by providing advertising printing and promotion.
6. Conclusions
Firstly, this paper summarized the current market situation of reusable takeaway containers through background research and found some existing problems such as non-standardization, complex cleaning processes, difficult recycling and classification, user concerns, and limited universal applicability. In view of the four user groups involved in reusable takeaway container models, the design factors of reusable takeaway containers were analyzed by means of user behavior observation, one-to-one interviews, questionnaire collection, and UJM. Based on the four levels of material, appearance, structure, and information, an evaluation system for the design scheme of reusable takeaway containers was established, and a path to analyze user needs, clarify design points, and combine qualitative and quantitative models was explored from the perspective of a full-service process and multiple contacts.
The AHP method was used to establish a hierarchical model, obtain the weight value of each element, judge their importance, and carry out scheme design, which provided more scientific, objective, and accurate judgment and evaluation indicators for the design of reusable takeaway containers. The innovative design of reusable takeaway containers was performed, and the optimization design was applied in the aspects of interlayer design, use mode, stacking mode, and detail design. Finally, a safe and healthy reusable takeaway container scheme with heat preservation, shock-proofing, clear information, convenient use, and traceability was proposed, thus promoting the development of reusable takeaway containers and improving their market coverage and user penetration. Combined with the subjective evaluation table of the FCE method, the evaluation results of the design scheme were obtained mathematically, which proved its feasibility. The comprehensive weight ranking table of design elements was established using the AHP–FCE method, thus providing guidance for the design direction and product improvement of reusable takeaway containers and offering a comprehensive and detailed evaluation method for reusable takeaway container schemes.
However, there are still some limitations. Firstly, a limited number of users are involved in the survey and a small number of employees come from reusable takeaway container suppliers, leading to some deviations in the data results of this study. Secondly, the participants in this study are divided into takeaway consumers, delivery staff, etc. according to their different identities in the reusable takeaway container service, and various stakeholder groups are researched and analyzed from an overall perspective. However, there is a lack of fine division and analysis of various groups. For example, the influence of different occupations, genders, ages, and regions of takeaway consumers on design scheme preferences can be analyzed. Finally, there are huge differences in takeaway market management in various countries, and also people of various countries have significant differences in dietary habits. The applicability of the schemes designed in this paper remains controversial due to a lack of consensus.
In the future, the factors influencing the design of reusable takeaway containers will be continuously investigated, and in-depth research will be conducted to develop a more appropriate model. Further studies should focus on the influence of user habits and folk customs on the preference of reusable takeaway containers in different geographical areas, consider the impact of economic factors on companies’ design and choice of reusable takeaway containers, and explore design approaches that meet user demands, minimize environmental impacts, and maximize economic benefits, in order to facilitate the development of the reusable takeaway container market.
Supplementary Materials
The following supporting information can be downloaded at: https://www.mdpi.com/article/10.3390/su15032191/s1, Table S1: Normalized results of evaluation statistics for Scheme (B); Table S2: Normalized results of evaluation statistics for Scheme (C).
Author Contributions
Conceptualization, methodology, investigation, experiments, data curation, writing—original draft preparation, and writing—review, H.S. and Q.Y.; formal analysis, software, validation, editing, and design, Q.Y.; supervision, project administration, and funding acquisition, H.S. and Y.W. All authors have read and agreed to the published version of the manuscript.
Funding
This work was supported by the Ministry of Education and Humanities and the Social Science Youth Foundation of the Ministry of Education in China (grant number 22YJC760083) and the Sichuan Mineral Resources Research Center (grant number SCKCZY2022-YB023).
Institutional Review Board Statement
Not applicable.
Informed Consent Statement
Not applicable.
Data Availability Statement
Not applicable.
Conflicts of Interest
The authors declare no conflict of interest.
References
- Yuting, Z.; Zongguo, W. Mapping the environmental impacts and policy effectiveness of takeaway food industry in China. Sci. Total Environ. 2022, 808, 152023. [Google Scholar] [CrossRef]
- Proposal for a Revision of EU Legislation on Packaging and Packaging Waste. Available online: https://environment.ec.europa.eu/publications/proposal-packaging-and-packaging-waste_en (accessed on 5 December 2022).
- Greenwood, S.C.; Walker, S.; Baird, H.M.; Parsons, R.; Mehl, S.; Webb, T.L.; Slark, A.T.; Ryan, A.J.; Rothman, R.H. Many Happy Returns: Combining insights from the environmental and behavioural sciences to understand what is required to make reusable packaging mainstream. Sustain. Prod. Consum. 2021, 27, 1688–1702. [Google Scholar] [CrossRef]
- Dorn, M.; Stöckli, S. Social influence fosters the use of a reusable takeaway box. Waste Manag. 2018, 79, 296–301. [Google Scholar] [CrossRef] [PubMed]
- Coelho, P.M.; Corona, B.; Klooster, R.T.; Worrell, E. Sustainability of reusable packaging—Current situation and trends. Conserv. Recycl. X 2020, 6, 100037. [Google Scholar] [CrossRef]
- Jiang, X.; Dong, M.; He, Y.; Shen, J.; Jing, W.; Yang, N.; Guo, X. Research on the Design of and Preference for Collection Modes of Reusable Takeaway Containers to Promote Sustainable Consumption. Int. J. Environ. Res. Public Health 2020, 17, 4764. [Google Scholar] [CrossRef] [PubMed]
- Gallego-Schmid, A.; Mendoza, J.M.F.; Azapagic, A. Environmental impacts of takeaway food containers. J. Clean. Prod. 2019, 211, 417–427. [Google Scholar] [CrossRef]
- Genovesi, A.; Aversa, C.; Barletta, M.; Cappiello, G.; Gisario, A. Comparative life cycle analysis of disposable and reusable tableware: The role of bioplastics. Clean. Eng. Technol. 2022, 6, 100419. [Google Scholar] [CrossRef]
- Accorsi, R.; Battarra, I.; Guidani, B.; Manzini, R.; Ronzoni, M.; Volpe, L. Augmented spatial LCA for comparing reusable and recyclable food packaging containers networks. J. Clean. Prod. 2022, 375, 134027. [Google Scholar] [CrossRef]
- Islam, M.T.; Iyer-Raniga, U.; Trewick, S. Recycling Perspectives of Circular Business Models: A Review. Recycling 2022, 7, 79. [Google Scholar] [CrossRef]
- Bortolini, M.; Galizia, F.G.; Mora, C.; Botti, L.; Rosano, M. Bi-objective design of fresh food supply chain networks with reusable and disposable packaging containers. J. Clean. Prod. 2018, 184, 375–388. [Google Scholar] [CrossRef]
- Pålsson, H.; Sandberg, E. Adoption barriers for sustainable packaging practices: A comparative study of food supply chains in South Africa and Sweden. J. Clean. Prod. 2022, 374, 133811. [Google Scholar] [CrossRef]
- Numata, D. Empirical analysis of reward to return: Based on case studies of lunch boxes in Japan. J. Mater. Cycles Waste Manag. 2016, 18, 582–588. [Google Scholar] [CrossRef]
- Yuying, Z.; Hongli, C.; Jiabin, W.; Aixi, Z.; Huimin, W. Study on the circulation mode and its feasibility of take-away tableware based on electronic tag. Logist. Eng. Manag. 2021, 43, 38–40. [Google Scholar] [CrossRef]
- Zhiduo, W.; Ruizhuo, L.; Xinlin, F. Recycling system for recyclable food containers. Electron. World 2021, 20, 132–134. [Google Scholar] [CrossRef]
- Halog, A.; Balanay, R.; Anieke, S.; Tsz, Y.Y. Circular Economy across Australia: Taking Stock of Progress and Lessons. Circ. Econ. Sustain. 2021, 1, 283–301. [Google Scholar] [CrossRef] [PubMed]
- Cáceres Ruiz, A.M.; Zaman, A. The Current State, Challenges, and Opportunities of Recycling Plastics in Western Australia. Recycling 2022, 7, 64. [Google Scholar] [CrossRef]
- Melles, G.; Wölfel, C.; Krzywinski, J.; Opeskin, L. Expert and Diffuse Design of a Sustainable Circular Economy in Two German Circular Roadmap Projects. Soc. Sci. 2022, 11, 408. [Google Scholar] [CrossRef]
- Brieanne, B.; Brianna, F.; Fernanda, C.R.; Michael, A.H.; Sujan, C.; Sara, S.L.; Melissa, M.B.; Cindy, I. Just by design: Exploring justice as a multidimensional concept in US circular economy discourse. Local Environ. 2022, 27, 1225–1241. [Google Scholar] [CrossRef]
- Yuping, S.; Malin, S.; Xin, Z. The development of China’s Circular Economy: From the perspective of environmental regulation. Waste Manag. 2022, 149, 186–198. [Google Scholar] [CrossRef]
- College Takeaway Garbage Piled Up in Mountains Attracts Attention! Experts Recommend Promoting the “Circular Lunch Box Model” Solution. Available online: http://plasticfreechn.org.cn/article/347_20.html (accessed on 5 December 2022).
- Gu, C.; Chen, J.; Wei, W.; Sun, J.; Yang, C.; Jiang, L.; Jiang, Q.; Jiang, L.; Hu, J.; Lv, B.; et al. The impact of reusable tableware packaging combined with environmental propaganda on consumer behaviour in online retail. PLoS ONE 2022, 17, e0264562. [Google Scholar] [CrossRef]
- Louwan, X.; Jungho, J. Sustainable Takeout Package Design Strategy Based on Universal Design Application Principles- Focused on Chinese Fast Food Takeout Package Design. J. Brand Des. Assoc. Korea 2021, 19, 197–210. [Google Scholar] [CrossRef]
- Saaty, T.L. Decision-making with the AHP: Why is the principal eigenvector necessary. Eur. J. Oper. Res. 2003, 145, 85–91. [Google Scholar] [CrossRef]
- Yanwen, W.; Peng, C.; Chen, F. Security assessment of coal mine power grid voltage based on an improved AHP-FCE. Math. Probl. Eng. 2022, 20, 5256285. [Google Scholar] [CrossRef]
- Zi-xiang, W.; Jia, X. Packaging design and evaluation of agricultural specialty products based on AHP and Fuzzy mathematical model. Packag. Eng. 2022, 43, 213–219. [Google Scholar] [CrossRef]
- Li, X.; Xinyi, W.; Xuesong, G.; Nanfeng, Z.; Changyan, X.; Dagang, L. Application of fuzzy comprehensive evaluation in green express packaging. Packag. Eng. 2019, 40, 180–188. [Google Scholar] [CrossRef]
- Xian, Y.; Ronghuan, W.; Chaolan, T.; Lihong, L.; Xiaohong, M. Emotional design for smart product-service system: A case study on smart beds. J. Clean. Prod. 2021, 298, 126823. [Google Scholar] [CrossRef]
- Dafia, C.S.N.; Chen, F.; Sumo, P.D. Guideline and Strategies of Textile Industry on the Sustainable Development of Benin. Sustainability 2022, 14, 12762. [Google Scholar] [CrossRef]
- Zaim, S.; Sevkli, M.; Camgöz-Akdağ, H.; Omer, F.; Demirel, A.; Yayla, Y.; Delen, D. Use of ANP weighted crisp and fuzzy QFD for product development. Expert Syst. Appl. 2014, 41, 4464–4474. [Google Scholar] [CrossRef]
- William, H.; Xin, M. The state-of-the-art integrations and applications of the analytic hierarchy process. Eur. J. Oper. Res. 2018, 267, 399–414. [Google Scholar] [CrossRef]
- Moretti, D.M.; Baum, C.M.; Wustmans, M. Application of journey maps to the development of emergent sustainability-oriented technologies: Lessons for user involvement in Agriculture. Bus. Strategy Dev. 2022, 5, 209–221. [Google Scholar] [CrossRef]
- Bradley, C.; Oliveira, L.; Birrell, S.; Cain, R. A new perspective on personas and customer journey maps: Proposing systemic UX. Int. J. Hum.-Comput. Stud. 2021, 148, 102583. [Google Scholar] [CrossRef]
- Gallego-Schmid, A.; Mendoza, J.M.F.; Azapagic, A. Improving the environmental sustainability of reusable food containers in Europe. Sci. Total Environ. 2018, 628–629, 979–989. [Google Scholar] [CrossRef]
- Lu, N.; Li, Y.; Xu, B. Evaluation of the Suitability of Smart Health Products for Aging Based on the IIVAHP-CRITIC Model: A Case Study of Smart Health Kiosk. Sustainability 2022, 14, 9212. [Google Scholar] [CrossRef]
- Dong, Q.X.; Saaty, T.L. An analytic hierarchy process model of group consensus. J. Syst. Sci. Syst. EngIineering 2014, 23, 362–374. [Google Scholar] [CrossRef]
- Naveed, Q.N.; Qahmash, A.I.; Al-Razgan, M.; Qureshi, K.M.; Qureshi, M.R.N.M.; Alwan, A.A. Evaluating and Prioritizing Barriers for Sustainable E-Learning Using Analytic Hierarchy Process-Group Decision Making. Sustainability 2022, 14, 8973. [Google Scholar] [CrossRef]
- Nefeslioglu, H.A.; Sezer, E.A.; Gokceoglu, C.; Ayas, Z. A modified analytical hierarchy process (M-AHP) approach for decision support systems in natural hazard assessments. Comput. Geosci. 2013, 59, 1–8. [Google Scholar] [CrossRef]
- South, L.; Saffo, D.; Vitek, O.; Dunne, C.; Borkin, M.A. Effective Use of Likert Scales in Visualization Evaluations: A Systematic Review. Comput. Graph. Forum 2022, 41, 43–55. [Google Scholar] [CrossRef]
- Zeng, W.Y.; Feng, S. An improved comprehensive evaluation model and its application. Int. J. Comput. Intell. Syst. 2014, 7, 706–714. [Google Scholar] [CrossRef]
- Zhu, L. Research and application of AHP-fuzzy comprehensive evaluation model. Evol. Intell. 2022, 15, 2403–2409. [Google Scholar] [CrossRef]
- Peng, P.; Changge, H.; Min, C. Application of snow thrower design evaluation based on fuzzy comprehensive evaluation method. Packag. Eng. 2022, 43, 59–65. [Google Scholar] [CrossRef]
- Zhu, Y.; Zhong, S.; Wang, Y.; Liu, M. Land Use Evolution and Land Ecological Security Evaluation Based on AHP-FCE Model: Evidence from China. Int. J. Environ. Res. Public Health 2021, 18, 12076. [Google Scholar] [CrossRef] [PubMed]
- Gorcun, O.F.; Senthil, S.; Küçükönder, H. Evaluation of tanker vehicle selection using a novel hybrid fuzzy MCDM technique. Decis. Mak. Appl. Manag. Eng. 2021, 4, 140–162. [Google Scholar] [CrossRef]
- Fangni, D.; Huiwen, C.; Qun, Z.; Qiqing, C.; Huahong, S. Microplastics in take-out food containers. J. Hazard. Mater. 2020, 399, 122969. [Google Scholar] [CrossRef]
- Liu, J.; Zhang, T.; Piché-Choquette, S.; Wang, G.; Li, J. Microplastic Pollution in China, an Invisible Threat Exacerbated by Food Delivery Services. Bull. Environ. Contam. Toxicol. 2021, 107, 778–785. [Google Scholar] [CrossRef]
Disclaimer/Publisher’s Note: The statements, opinions and data contained in all publications are solely those of the individual author(s) and contributor(s) and not of MDPI and/or the editor(s). MDPI and/or the editor(s) disclaim responsibility for any injury to people or property resulting from any ideas, methods, instructions or products referred to in the content. |
© 2023 by the authors. Licensee MDPI, Basel, Switzerland. This article is an open access article distributed under the terms and conditions of the Creative Commons Attribution (CC BY) license (https://creativecommons.org/licenses/by/4.0/).
