Abstract
Without a reliable design method for the leaching and seepage step of in situ leaching (ISL), problems such as low comprehensive resource recovery rate and frequent geological disasters such as landslides are prominent. This study established a simplified “liquid injection-collection” plane model of ISL with a linear barefoot type rare earth mine as the research object. The steady seepage line equation was derived based on groundwater dynamics and the Dupuit assumption. Then, engineering verification and calculation error analysis were performed. The seepage line equation is expressed as a piecewise function, where the seepage line in the liquid injection area is the upper half of the ellipse line, and the one in the non-liquid injection area is a parabola. The calculation error increases along the flow field direction. The seepage gradient, bedrock gradient, liquid injection range, and relative permeability coefficient have limited influence on the calculation error of the equation. The seepage line equation can be fairly applied in ISL. The seepage line equation can provide a theoretical basis for the “prior prediction (design)” of the “liquid injection/collection” leaching and seepage process in ISL.
1. Introduction
The in situ leaching (ISL) process has been applied in ionic rare earth mines in southern China for more than 20 years [1]. Its shortcomings are also emerging. The first is the resource problem, manifested as a low comprehensive resource recovery rate. According to incomplete statistics, more than half of the enterprises in southern China have a comprehensive resource recovery rate of less than 75% [2,3]. The second is the environmental problem characterized by frequent geological disasters, such as landslides. Ionic rare earth mines in Longnan, Jiangxi Province, China, are characterized by their small scale and large number because of ISL-induced geological disasters [4]. Specific mining technology is required for each mine, and the leaching process needs to be designed accordingly. However, current mine production management in China is sloppy and lacks innovation, and the process and parameters of a mine are even rigidly applied to others [5,6], which mainly explains the reasons for the above problems.
It has been shown that the above “resource-environment” problems are closely related to the leaching and seepage process of “liquid injection/collection” in mines. The resource loss during leaching and seepage mainly includes blind zone loss, mother liquor leakage loss, and anti-adsorption loss [7]. The first two kinds of loss can be attributed to the unreasonable arrangement of liquid injection and collection projects and inappropriate liquid injection intensity. The flow of leaching solution through the ore body can weaken the shear strength of the ore body [8,9,10], especially when the liquid injection intensity is greater than the seepage capacity of mines. Under this situation, the phreatic surface of the mine keeps rising, and when it reaches above the critical water level, a landslide will occur [11]. The level and shape of the phreatic surface depend on hydrogeological conditions, permeability and seepage capacity of the mine, liquid injection intensity, etc.
The topographical and geological conditions of the mine are the prerequisite for carrying out mine production. The terrain of the mine can be accurately mapped by digital remote sensing technology combined with machine learning and depth learning algorithms [12,13], and the geological structure of the mine can also be accurately determined by resistivity tomography technology [14]. In terms of the “leaching and seepage step”, many scholars have studied the leaching kinetics [15,16,17] and mass transfer process [18,19,20,21] by indoor tests from the perspective of the mechanism to screen leaching agents [22,23,24] and optimize the leaching process. Based on mine production field tests, some scholars have studied the changes in the phreatic surface, soil-water pressure, and slope surface crack in mines during ISL [4,25] and proposed prevention and control measures for mine landslides [26]. These research results contribute to the “observation in progress and conclusion afterward” of the leaching and seepage step but fail to guide the “prior prediction (design)”. Chi Ru’an pointed out that studying the seepage law of leaching agent solution inside the ore body from a perspective of mine macroscopic hydrodynamics can better guide the ISL of ionic rare earth ore [27].
This paper established a simplified “liquid injection/collection” plane model with the linear barefoot type rare earth mine as the research object. Based on groundwater dynamics and the Dupuit assumption, the steady seepage line equation was derived under the given mine topography and liquid injection conditions, which provides a theoretical basis for the “prior prediction (design)” of ISL.
2. Theoretical Analysis of Steady Seepage Line of In Situ Leaching
2.1. The Simplified “Liquid Injection/Collection” Plane Model in Mine
The ISL liquid injection project of ionic rare earth ore often adopts plum blossom-shaped injection holes with a general diameter of Φ0.15 m to Φ0.30 m. They are usually arranged in a certain range along the hilltop to hillside direction and 0.5 m to 1.0 m below the ore discovery depth [28]. The liquid collection project needs to be determined according to the specific engineering geological conditions of the mine. Barefoot type mine has a complete natural bedrock floor, with outcrops at the foot of the mountain or valley. Therefore, trenches are usually excavated at the foot of the mountain to collect the mother liquid [28].
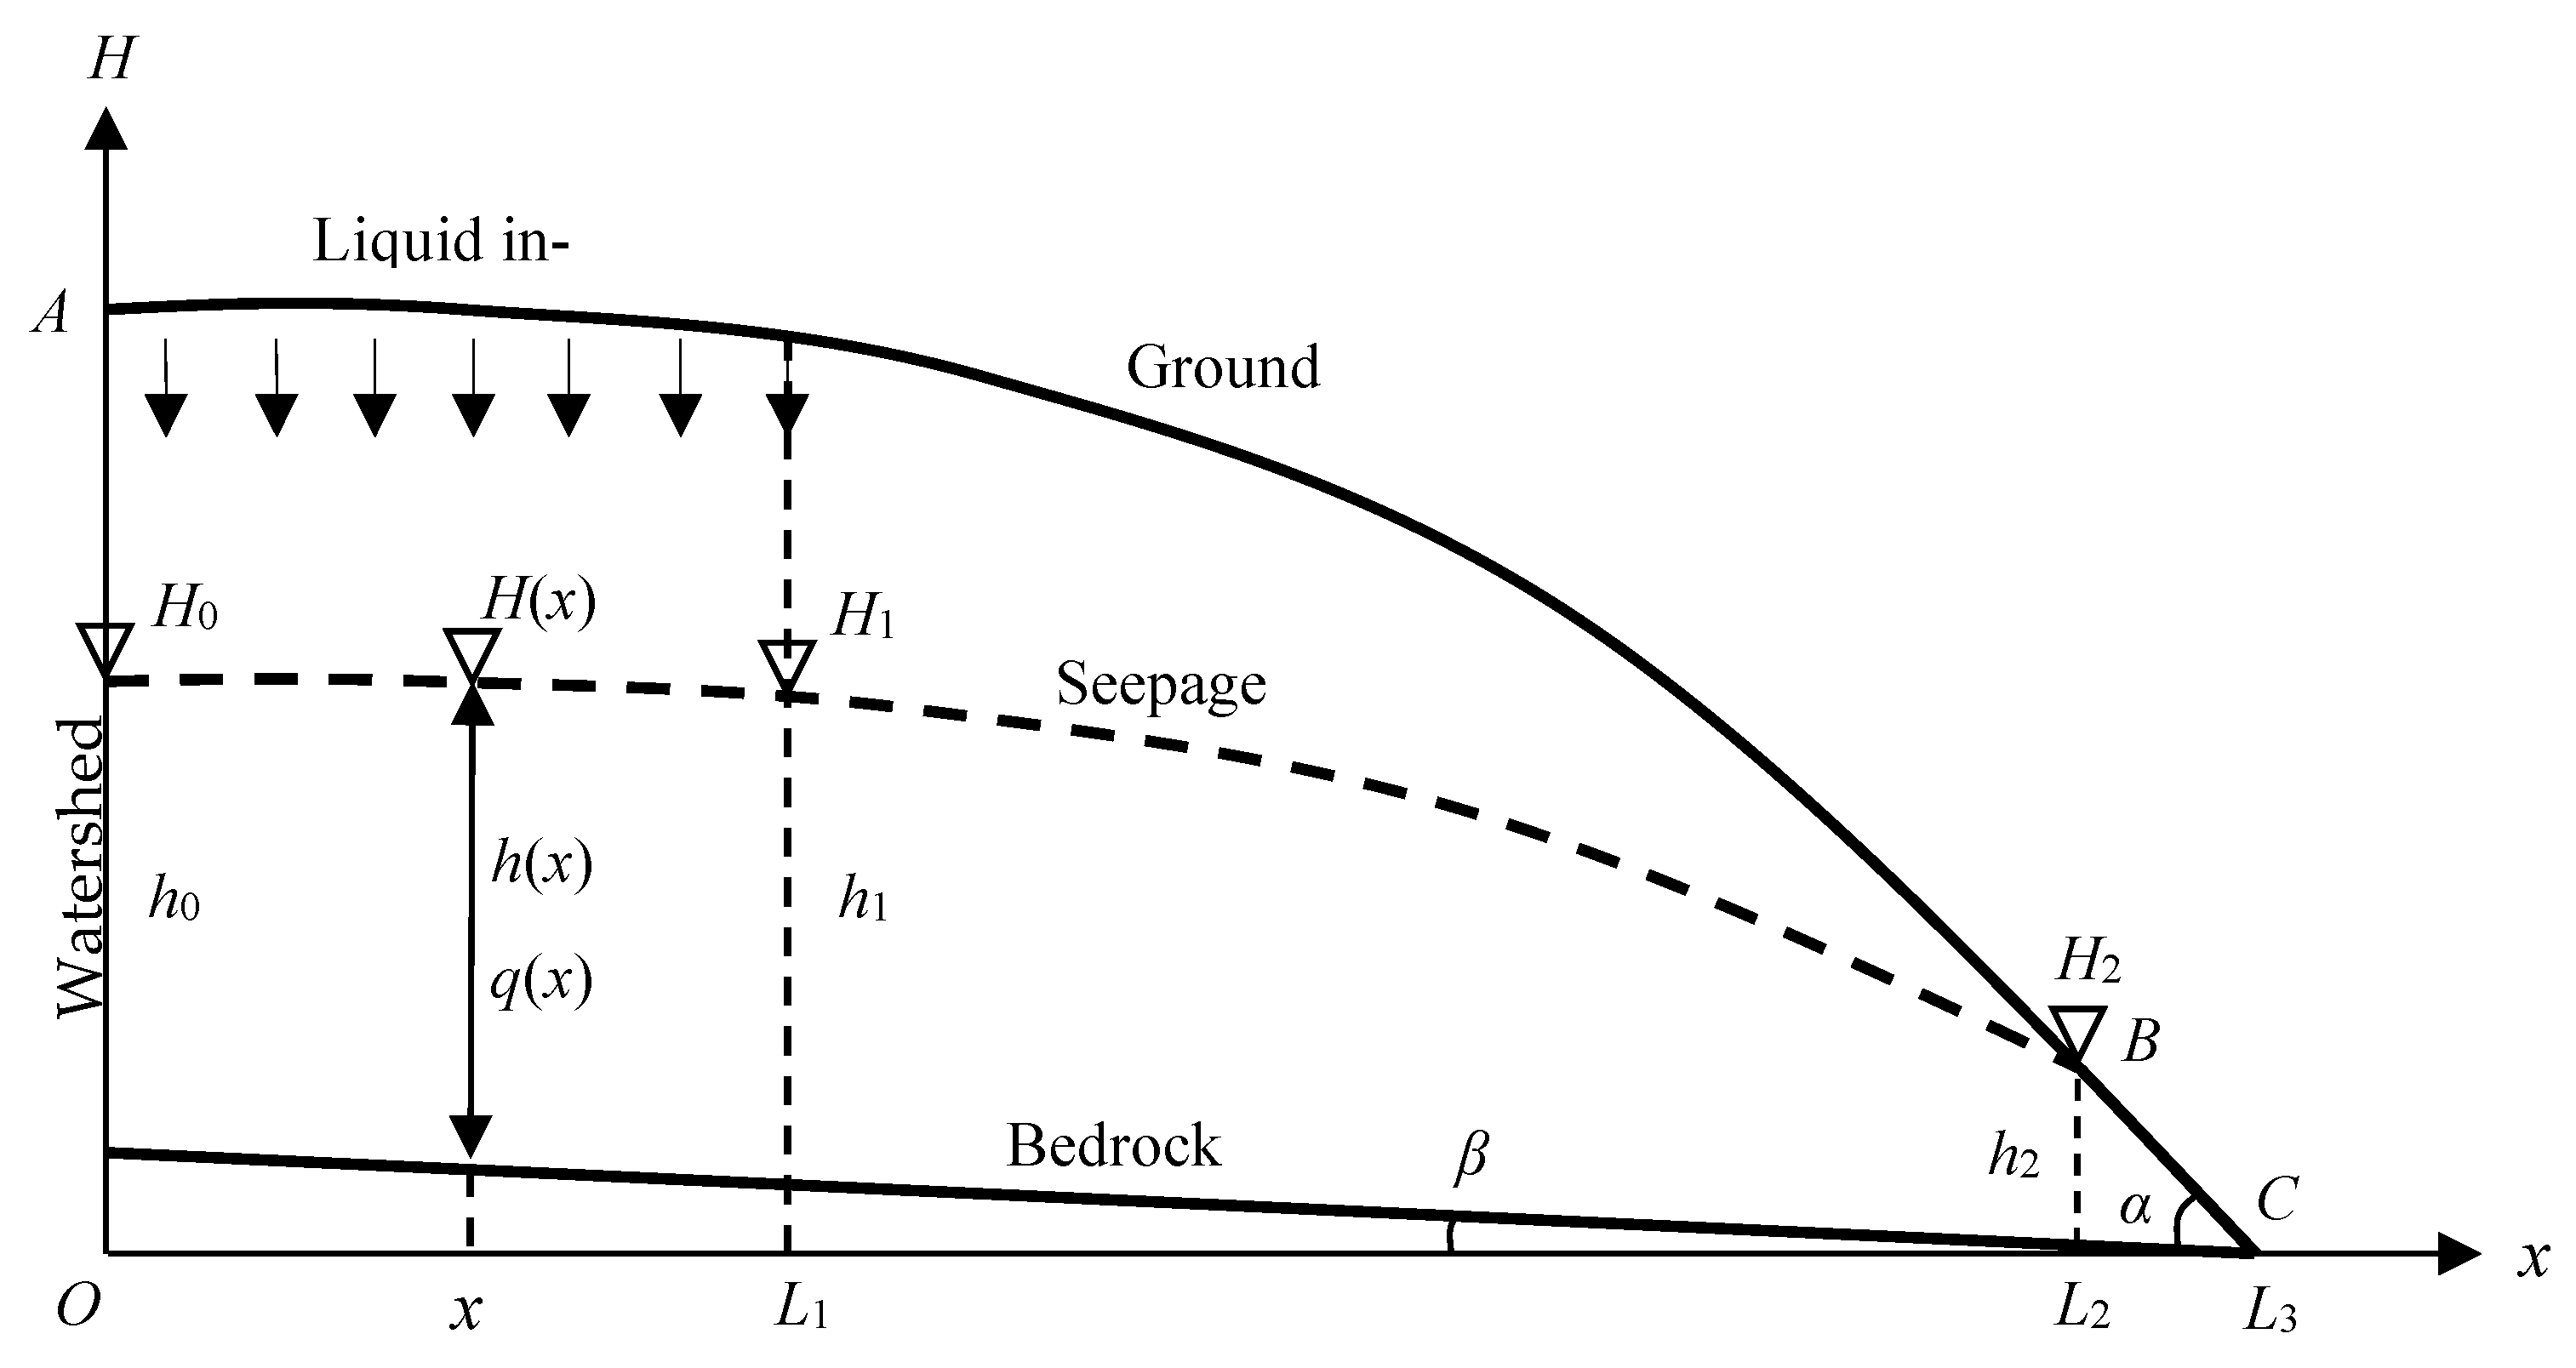
For linear barefoot-type mines with obvious ridgelines, the simplified “injection/collection” plane model can be established based on the profile along the direction vertical to the ridgeline, as shown in Figure 1. The following main assumptions are made for the model:
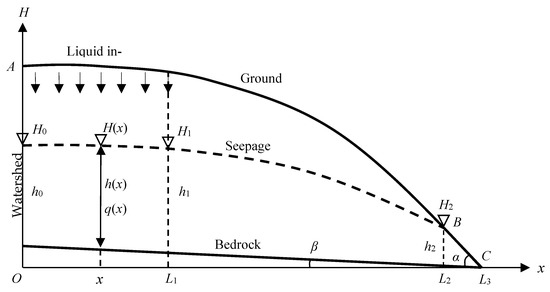
Figure 1.
The simplified “liquid injection/collection” plane model in mine.
- It was assumed that the watershed of surface runoff and underground runoff coincide on the plane. A vertical H-axis was plotted along the watershed at the ridgeline (often the highest point of the bedrock floor), and the horizontal x-axis intersected with the outcrop point of the collection trench floor at the foot of the mountain (point C in Figure 1, coordinate: L3, m);
- In situ leaching process requires the collection trench to drain the outflowing mother liquid in time, and point C was taken as the head reference point (Hc = 0);
- The gradient of the bedrock floor is generally small and taken as the average β (°) in this paper;
- Since the surface clay at the foot of the slope is excavated when constructing the liquid collection trench, the gradient α (°) at the seepage point B (coordinate: L2, m) is large;
- The movement of groundwater in Figure 1 is divided into two parts: (1) the liquid injection area above the seepage line is the unsaturated area, which belongs to the category of soil water movement, where the water flow is mainly vertical downward seepage under the action of gravity; (2) during single-hole injection, the solution infiltrates from the injection hole to the surrounding unsaturated ore body. The further away from the hole, the lower the saturation of the ore body. The wetting body is similar to an ellipsoid [29,30,31]. During the hole network injection, the interaction between the holes uniforms the infiltration of the solution into the unsaturated ore body beyond a certain range below the bottom of the hole [27]. Therefore, the boundary condition of the injection area (the injection range is L1, m) in Figure 1 is simplified to the uniform infiltration intensity W (the amount of water supplementing the groundwater by infiltration per unit horizontal area in unit time, m/d);
- As the liquid injection continues, the interior of the ore body is gradually saturated upwards from the bedrock floor, and the seepage line becomes higher and higher until it stabilizes. In general, the production cycle of ISL is 6–8 months, and the leaching agent solution is injected in the first 40 days or so [4]. Then, after the supernatant is injected, the seepage line within the ore body is close to the steady seepage line (shown by the dashed line in Figure 1). Therefore, the actual highest seepage line can be approximated by the steady seepage line;
- This paper does not consider the spatial variability and isotropy of the permeability coefficient of mine soil mass.
2.2. Derivation of the Steady Seepage Line Equation
Figure 1 is considered a plane, i.e., the seepage width is assumed to be constant, and the headline is an upward convex curve. Analysis of the flow line in Figure 1 shows that the water flow has diffluent rates in the horizontal and vertical directions and belongs to the plane two-dimensional flow. If the Dupuit assumption can be introduced and the vertical diffluent rate is neglected, the calculation can be simplified to a one-dimensional flow calculation in the x direction [32].
Based on the principle of water balance, the equation of the flow per unit width at any seepage section can be obtained by the segmentation method,
where q(x) is the flow per unit width at any seepage section, m3/(m·d); W is the infiltration intensity of the injected liquid, m/d; x is the coordinate of any seepage section, m; L1 is the liquid injection range, m; L2 is the coordinate of the seepage point B, m.
According to the Dupuit differential equation,
where Ks is the saturated permeability coefficient, m/d; h is the height of the seepage section, m; H is the head of the seepage section, m.
For the liquid injection area (0 ≤ x≤ L1),
After the separation of variables, an indefinite integral was performed from 0 to x, with λ = W/Ks.
Since the functional relationship between H and x is unknown, the third term on the left of Equation (4) cannot be integrated. But it can be approximated according to the integral mean value theorem.
Let , where xm is between 0 to x and is approximated to be x/2 due to the smoothness of the seepage line equation. Therefore, the steady seepage line equation for the inclined bottom floor injection area (0 ≤ x ≤ L1) was obtained.
For the non-liquid injection area (L1 ≤ x ≤ L2),
After the separation of variables, an indefinite integral was performed from L1 to x:
Similarly, the third term on the left of Equation (7) was approximated according to the integral mean value theorem.
Let , where xd is between L1 to x and is approximated to be (L1 + x)/2 due to the smoothness of the seepage line equation. Therefore, the steady seepage line equation was obtained for the non-liquid injection area (L1 ≤ x ≤ L2) of the inclined bottom floor.
Since the seepage line is tangential to the downstream slope at the seepage point B [33], it should be satisfied the following two conditions at point B,
where H2 is the head at seepage point B (x = L2), m; L3 is the coordinate of point C, m; α is the slope at seepage point B, °; JB is the hydraulic gradient at seepage point B.
By substituting Equation (10) and the point (L2, H2) into Equation (8),
After substituting Equation (11) into Equation (9),
Since H1 > H2 > 0, with f1 = tan(β)·(2L3 − L1 − L2), by substituting the point (L2, H2) into Equation (11),
Since H0 > H1, with f2 = tan(β)·(2L3 − L1), by substituting the point (L1, H1) into Equation (6),
By combining Equations (5), (8)–(14), the general steady seepage line equation can be obtained.
For the condition of the horizontal bottom floor, with β = 0°, the above formula can be simplified as follows:
According to Equation (15), under the condition of uniform and steady liquid injection (λ > 0), the seepage line in the injection area is the upper half of the elliptic line, and that in the non-injection area is parabolic. With λ = 0 and L1 = 0 in Equation (15) (i.e., no injection), H0 = H1 = H2 = tan(β)·L3 can be obtained, and the height of the wetted cross-section is h0 = h1 = h2 = 0; that is, no saturation zone is formed above the bedrock surface without liquid injection, which is consistent with the actual situation. When the liquid injection intensity is insufficient, forming a complete seepage line on the bedrock surface is difficult. Therefore, if a complete seepage line is obtained, it should satisfy H0 ≥ tan(β)·L3. By substituting this condition into Equation (15), the minimum injection intensity for a given injection range or the minimum injection range at a given injection intensity can be obtained.
3. Engineering Verification of the Seepage Line Equation
3.1. Experimental Purpose and Protocol
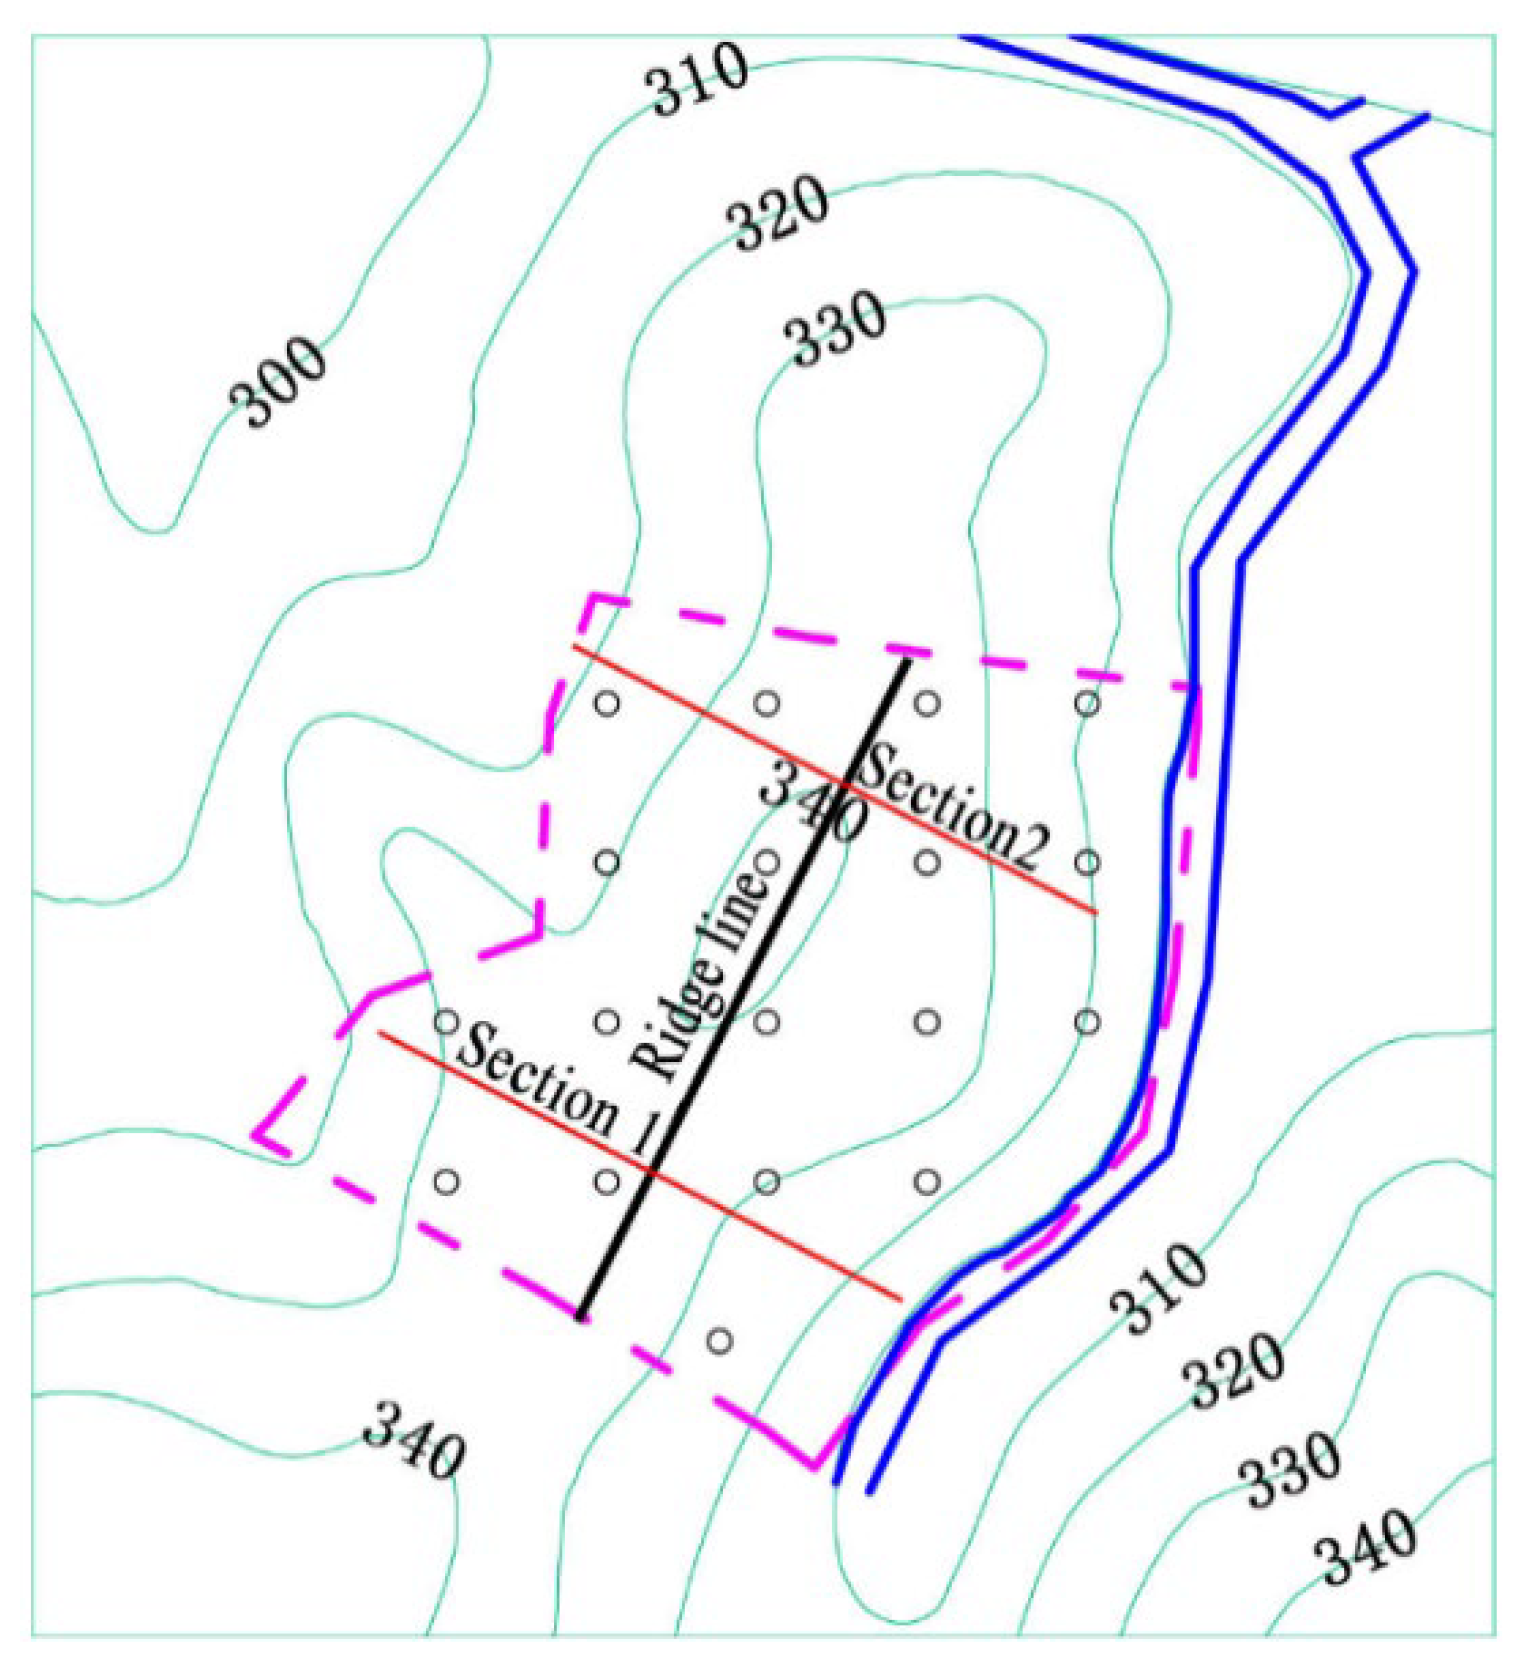
To verify the correctness and engineering applicability of the seepage line equation, an ore block in Guanxi, Longnan, Jiangxi Province, was selected for ISL field tests. As shown in Figure 2, the dashed line outlines the range of the test block. The mountain is about 40 m high, 100 m long in the east–west direction, and 75 m wide in the north–south direction. The slope of the mountain is about 28°–34°. The total area of the test block was measured to be approximately 7,672 m2, and the liquid injection area was approximately 3,689 m2. According to the exploration data, the test block comprises a clay layer, an ore body layer, and bedrock from top to bottom, where the bedrock is intact. The average gradient of the bedrock to the south of the ridgeline is 9.5°, and the gradient of the bedrock to the north of the ridgeline is approximately 12.3°. The clay layer at the foot of the mountain is thick, with an average of about 3.0 m to 3.5 m and a local thickness of 6.0 m. Thus, to prevent the mother liquid from entering the clay layer to generate an anti-adsorption loss, two main north–south tunnels were excavated horizontally above the collection trench at the foot of the test block, and several branch tunnels were excavated along the east–west direction at the end of main tunnels.
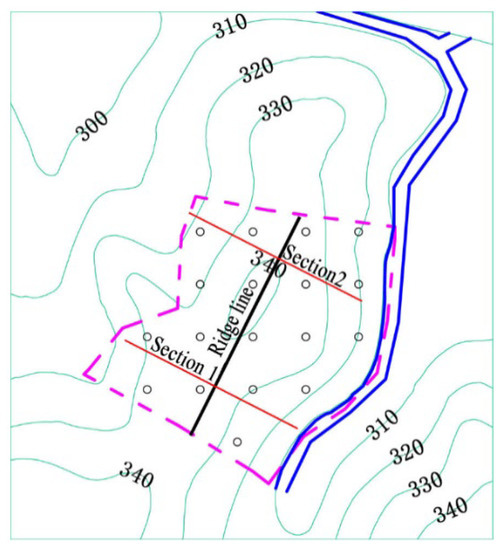
Figure 2.
The floor plan of the test ore block (altered according to the literature [28]).
The field test design is as follows: Two typical sections (Section 1 and Section 2 in Figure 2) were selected along the vertical mine ridgeline. Multiple water level observation wells were arranged to regularly observe the water level in each well every day. The location of the phreatic surface when the mine seepage field tended to be steady was determined. The results were compared with the seepage line calculated by the equation in this paper, and the errors and causes were analyzed to verify the correctness and engineering applicability of the seepage line equation.
3.2. Test Results and Analysis
The field test showed that the ore block entered the equilibrium phase of “liquid injection/collection” on the 42nd day (liquid injection volume of 740 m3/d). After that, the liquid injection volume increased slowly, and the seepage line rose slowly. The seepage line stopped changing when the liquid injection volume stabilized at around 850 m3/d. At this time, the seepage field is considered to enter a steady phase. The field infiltration experiment showed that the saturated permeability coefficient of the ore body was Ks = 1.6 m/d.
With Section 2 as an example, the vertical line over the highest point of bedrock was taken as the watershed to calculate the seepage lines of the south and north slopes. The rated conditions are shown in Table 1. The slopes of the seepage section of the collection trench and the tunnel are large and set to 75° in this paper. Since the liquid injection area of the north slope is about 1.5 times that of the south slope, the proportion of the liquid injection area on the north slope can be expressed as L1/L3 = (1.5/2.5) × 3689/(7672/2) = 0.577, and that on the south slope can be expressed as L1/L3 = (1.0/2.5) × 3689/(7672/2) = 0.385. The liquid injection intensity of the south and north slopes is the same, i.e., λ = 850/3689/1.6 = 0.144.

Table 1.
The rated conditions of the seepage line in Section 2.
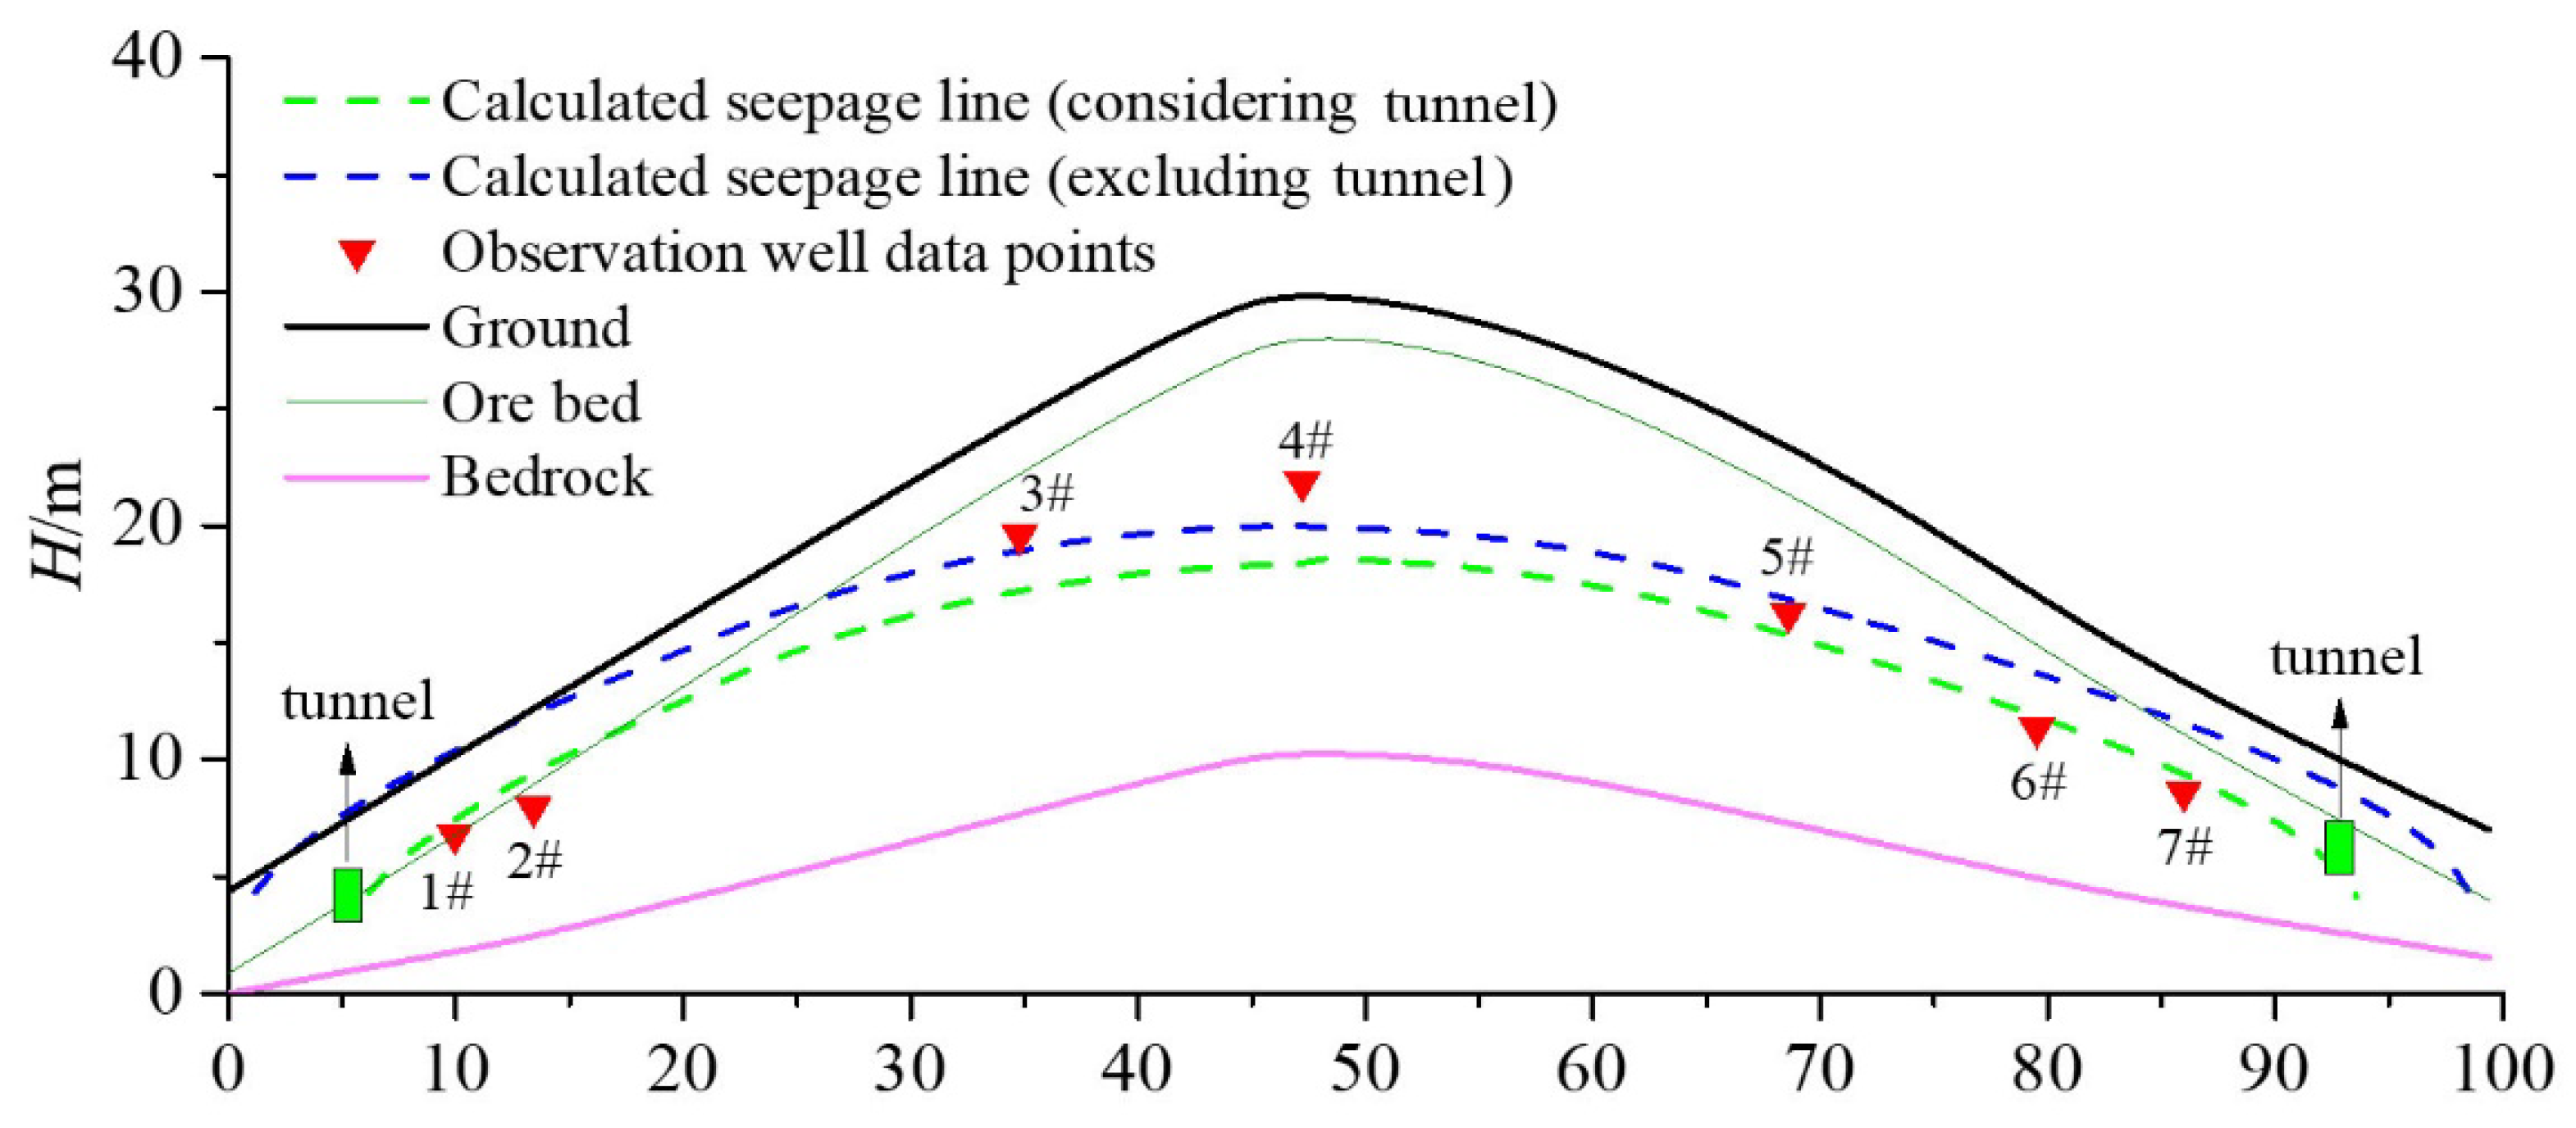
A total of seven liquid-level observation wells were arranged at different locations in Section 2. Table 2 summarizes the spatial coordinates of the observation wells, the observed height value of the steady seepage line at the wells, and the calculated value of the seepage line considering the effect of the tunnel. Figure 3 shows the topography of Section 2, the spatial location of the observation wells, the observed height value of the steady seepage line at the wells, and the calculated curves of the seepage line with and without considering the role of the tunnel.
Table 2.
Arrangement and result analysis of observation wells.
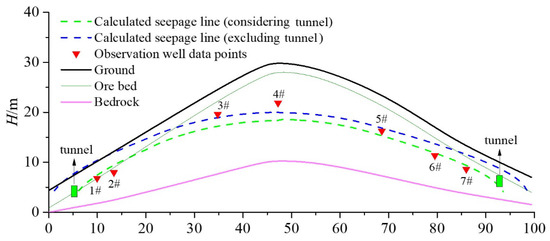
Figure 3.
The comparison chart of steady seepage lines in barefoot type mine (Section 2).
The seven liquid-level observation wells were divided into three groups according to their locations: the liquid injection section (3#, 4#), the intermediate section (5#), and the seepage section (1#, 2#, 6#, 7#). It can be seen from Table 2 that the calculated value of the seepage line in the liquid injection section is smaller than the actual value. The calculation error of the 4# observation well near the watershed is -16.03%, and the possible reasons are: the distance from the surface to the bedrock at this location is the largest, and the observation wells made with simple tools such as the Luoyang spade are limited in length. The distance from the bottom of the 4# observation well to the bedrock is 7.2 m. During liquid injection, the observation well became similar to a deep injection hole, and the leaching agent solution changed the soil structure of the local ore body at the bottom of the well [34]. Therefore, the permeability coefficient of the local ore body at the bottom of the well became small [35], which increased the head in the well and made the observation value of the liquid level in the well larger than the actual value. The calculation error of the 5# observation well is 3.27 %, indicating that the calculation error of the seepage line in the intermediate section is small. The calculated value of the seepage line in the seepage section is larger than the measured value, but most calculation errors are within an acceptable range, except for the calculation error of the 2# observation well. The calculation error in the seepage section is due to the fact that the specific length, width, and spatial location of the tunnel at this location are difficult to measure accurately. Moreover, the calculation has been somewhat simplified, which cannot fully reflect the actual three-dimensional situation. In addition, the saturated permeability coefficient value of the ore body K s is also a sensitive parameter affecting the calculation results, and its spatial variability is not considered in this research. In summary, it can be found from Table 2 and Figure 3 that the calculation error of the seepage line is acceptable for ionic rare earth mines.
Further comparison and analysis of the two calculated seepage lines in Figure 3 showed that the seepage line when the tunnel was not considered was 1.6 m to 2.5 m higher than that when the road was considered. Additionally, at the foot of the mountain, the seepage lines both entered the clay layer, which was more serious for the steeper north slope. It can be seen that the tunnel around the foot of the mountain can advance the seepage of the mother liquid and release the pressure to lower the water level. It can well prevent the mother liquid from entering the clay layer and producing anti-adsorption loss, thus enhancing the stability of the slope.
4. Parameter Analysis of the Calculation Error of the Seepage Line
4.1. Finite Element Model and Working Conditions
To further analyze the calculation error of the seepage line Equations (15) and (16), four parameters were proposed according to the topographic conditions and liquid injection conditions of the mine: the seepage gradient (α), bedrock gradient (β), liquid injection range (L1/L3), and relative permeability coefficient (λ). A finite element model was established according to the simplified model in Figure 1. The finite element calculation results were used as the theoretical values to analyze the influence law of the above four parameters on the calculation error of the seepage line equation.
The mining model was 30 m in height and L3 = 50 m in length. The calculation conditions are: (1) a total of 12 working conditions were set for analyzing the effect of the seepage gradient (α) of the calculation error with β =7.97°, L1/L3 = 0.4, and λ = 0.12 and α of 26.6°, 29.1°, 31.0°, 34.3°, 36.9°, 41.4°, 45.0°, 51.3°, 56.3°, 65.0°, 71.6°, and 82.4°; (2) a total of 7 working conditions were set for analyzing the effect of bedrock gradient (β), with α = 71.57°, L1/L3 = 0.4, and λ = 0.12 and β of 0°, 2.3°, 4.6°, 8.0°, 10.2°, 12.4°, and 14.6°; (3) a total of 7 working conditions were established for analyzing the effect of the liquid injection range (L1/L3) on the calculation error of the equation, with α = 71.57°, β = 7.97°, and λ = 0.12, and L1/L3 of 0.1, 0.2, 0.3, 0.4, 0.5, 0.6, and 0.7; (4) a total of 7 working conditions were established for analyzing the relative permeability coefficient (λ), with α = 71.57°, β = 7.97° and L1/L3 = 0.4, and λ of 0.04, 0.08, 0.12, 0.16, 0.20, 0.24, and 0.28.
4.2. Parameter Analysis of the Calculation Error
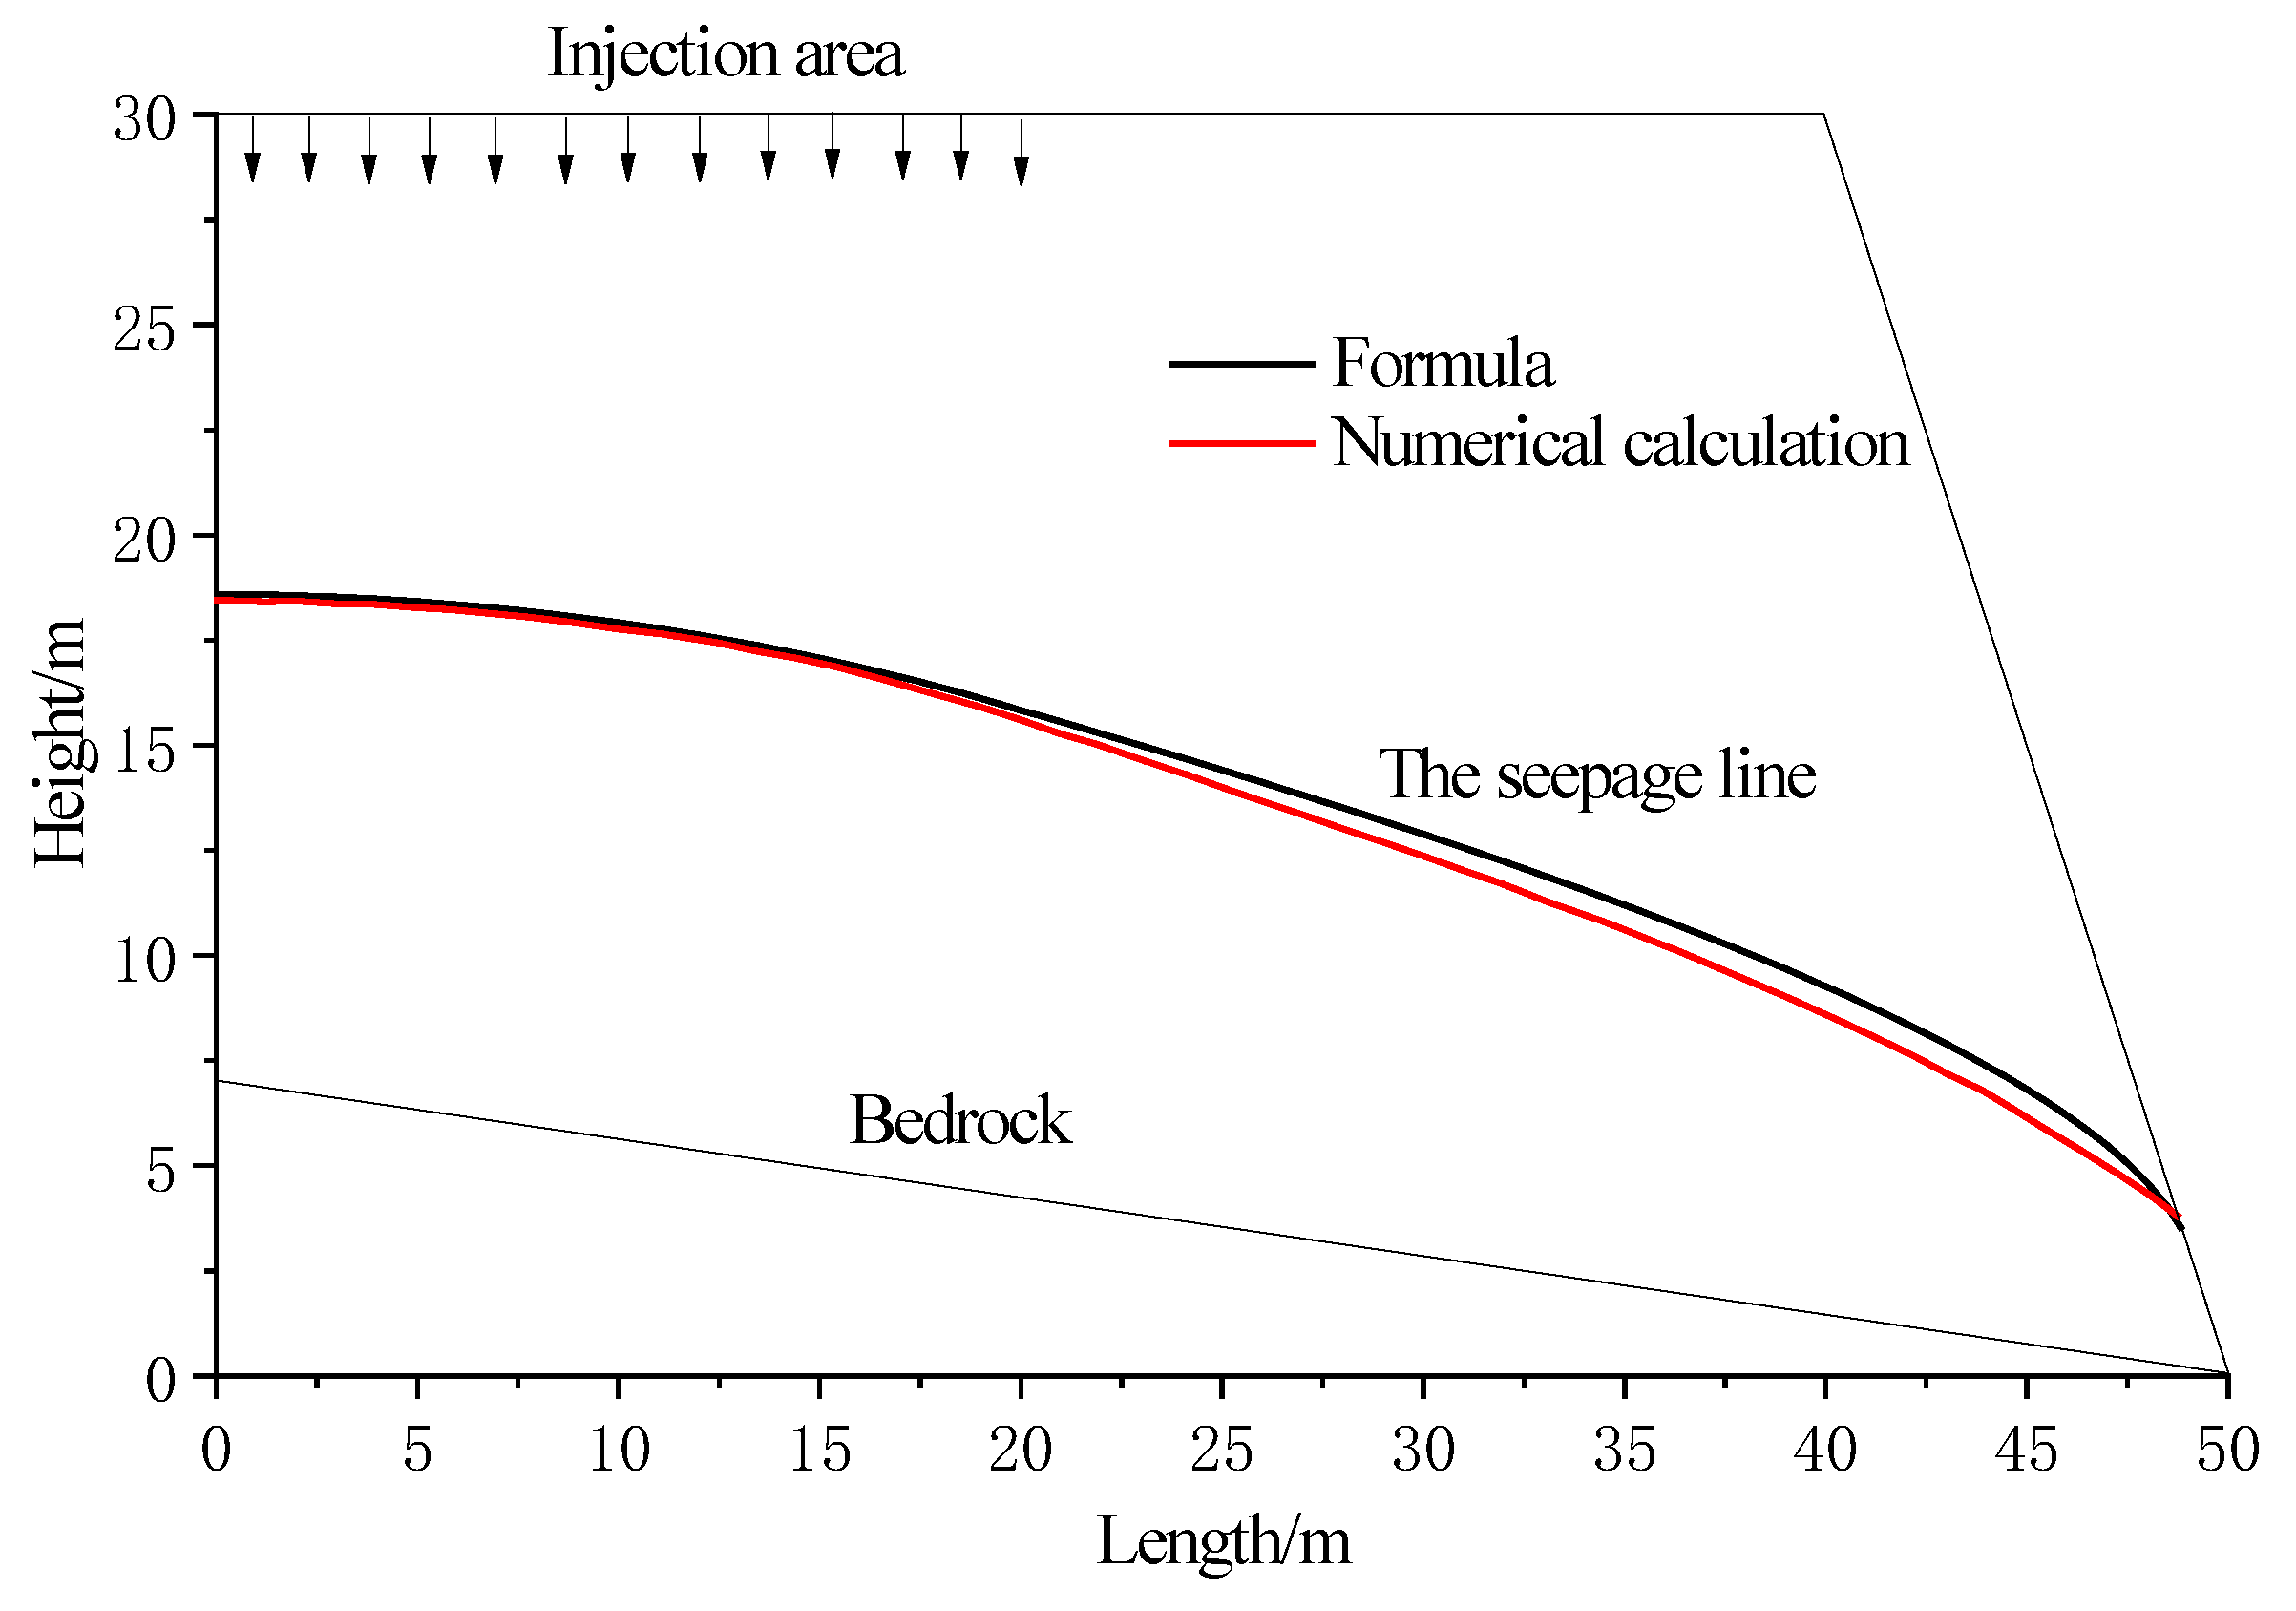
Under the typical working condition (α = 71.57°, β = 7.97°, L1/L3 = 0.4, λ = 0.12), the comparative analysis of the seepage line is shown in Figure 4. It can be seen that the seepage line calculated by the equation is slightly higher than that obtained by numerical calculation, and they are very close. The calculation error gradually increases along the flow field direction, i.e., the error in the liquid injection section is the smallest, followed by that in the intermediate section, and the error in the seepage section (near the seepage point) is the largest. However, the seepage line calculated by the equation is lower than that obtained from numerical calculation at the seepage point. The reasons are as follows: In this paper, the Dupuit assumption was introduced during the derivation of the seepage line equation. However, near the subsurface watershed and seepage point, the Dupuit assumption cannot be satisfied [28]. Near the watershed, the vertical velocity is large; the vertical plane is very close to the stream surface and therefore cannot be assumed to be an equipotential surface. The Dupuit assumption ignores the vertical velocity so that the value calculated by the equation is larger than the actual value. At the seepage section, the equipotential surface is often curved, and the hydraulic gradient gradually becomes large to facilitate the seepage of groundwater into surface water. Subsequently, the “water jump” phenomenon occurs. However, the Dupuit assumption cannot consider the “water jump” phenomenon. In addition, the seepage line equation at the seepage point meets the condition that the seepage line is tangent to the seepage slope, causing a serious “bending” of the seepage line at this point. Therefore, the value calculated by the equation is smaller than the actual value.
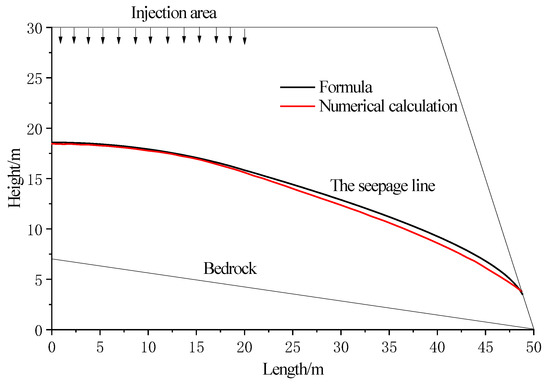
Figure 4.
The comparison chart of steady seepage lines in the typical working condition.
To further analyze the effect of each parameter on the calculation results of the seepage line equation at different sites, the influence law of the four parameters on the calculation error of the seepage line equation was analyzed with the watershed (x = 0 m), the intermediate point (L1/L3 = 0.5), and the seepage point (x = L2).
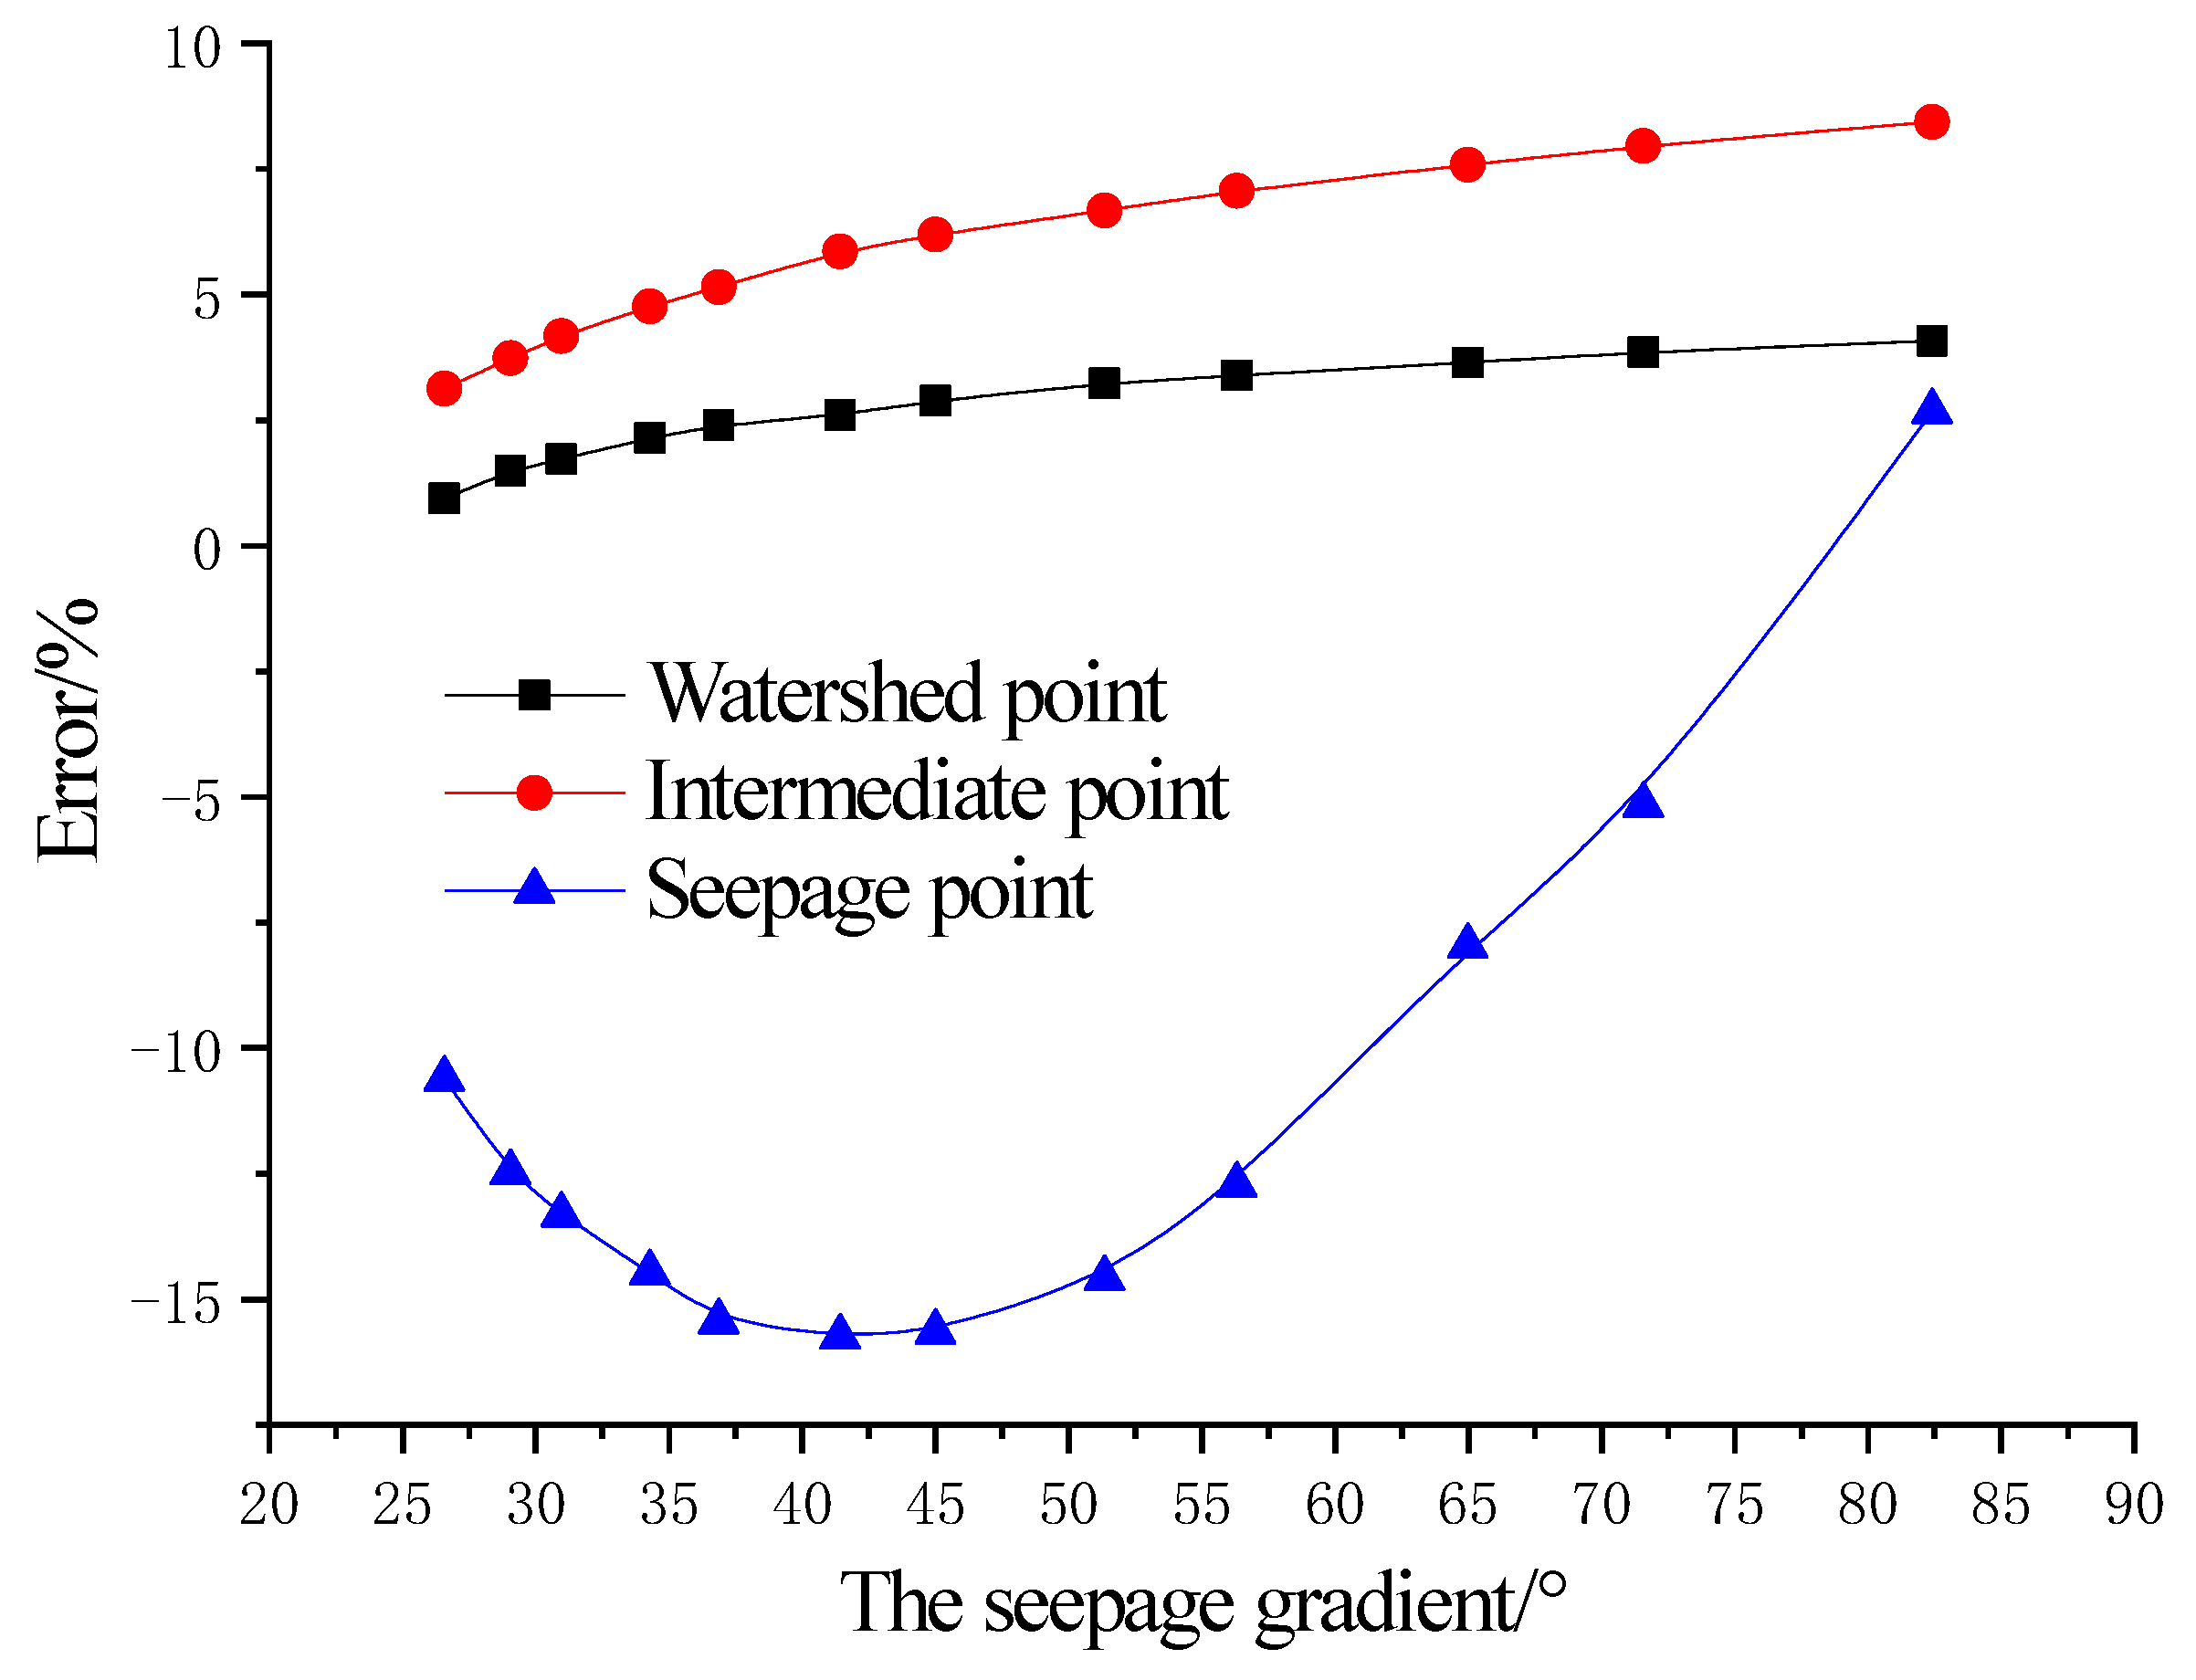
The variation curve of the calculation error of the seepage line with the seepage gradient is shown in Figure 5. It can be seen that the calculated value of the seepage line is larger than the theoretical value at the watershed and intermediate point and increases slightly with the increase of the seepage gradient. The maximum value of the error is 8.43%. The calculated value of the seepage line is smaller than the theoretical value at the seepage point. The absolute value of the error increases first and then decreases with the increase of the seepage gradient; when the seepage gradient α = 41.42°, the minimum error is −15.74%. Since the slope of the seepage surface of the ISL liquid collection trench is generally large, the effect of the seepage gradient on the calculation error of the seepage line equation is small.

Figure 5.
The changing curve of the calculation error vs. gradient of seepage.
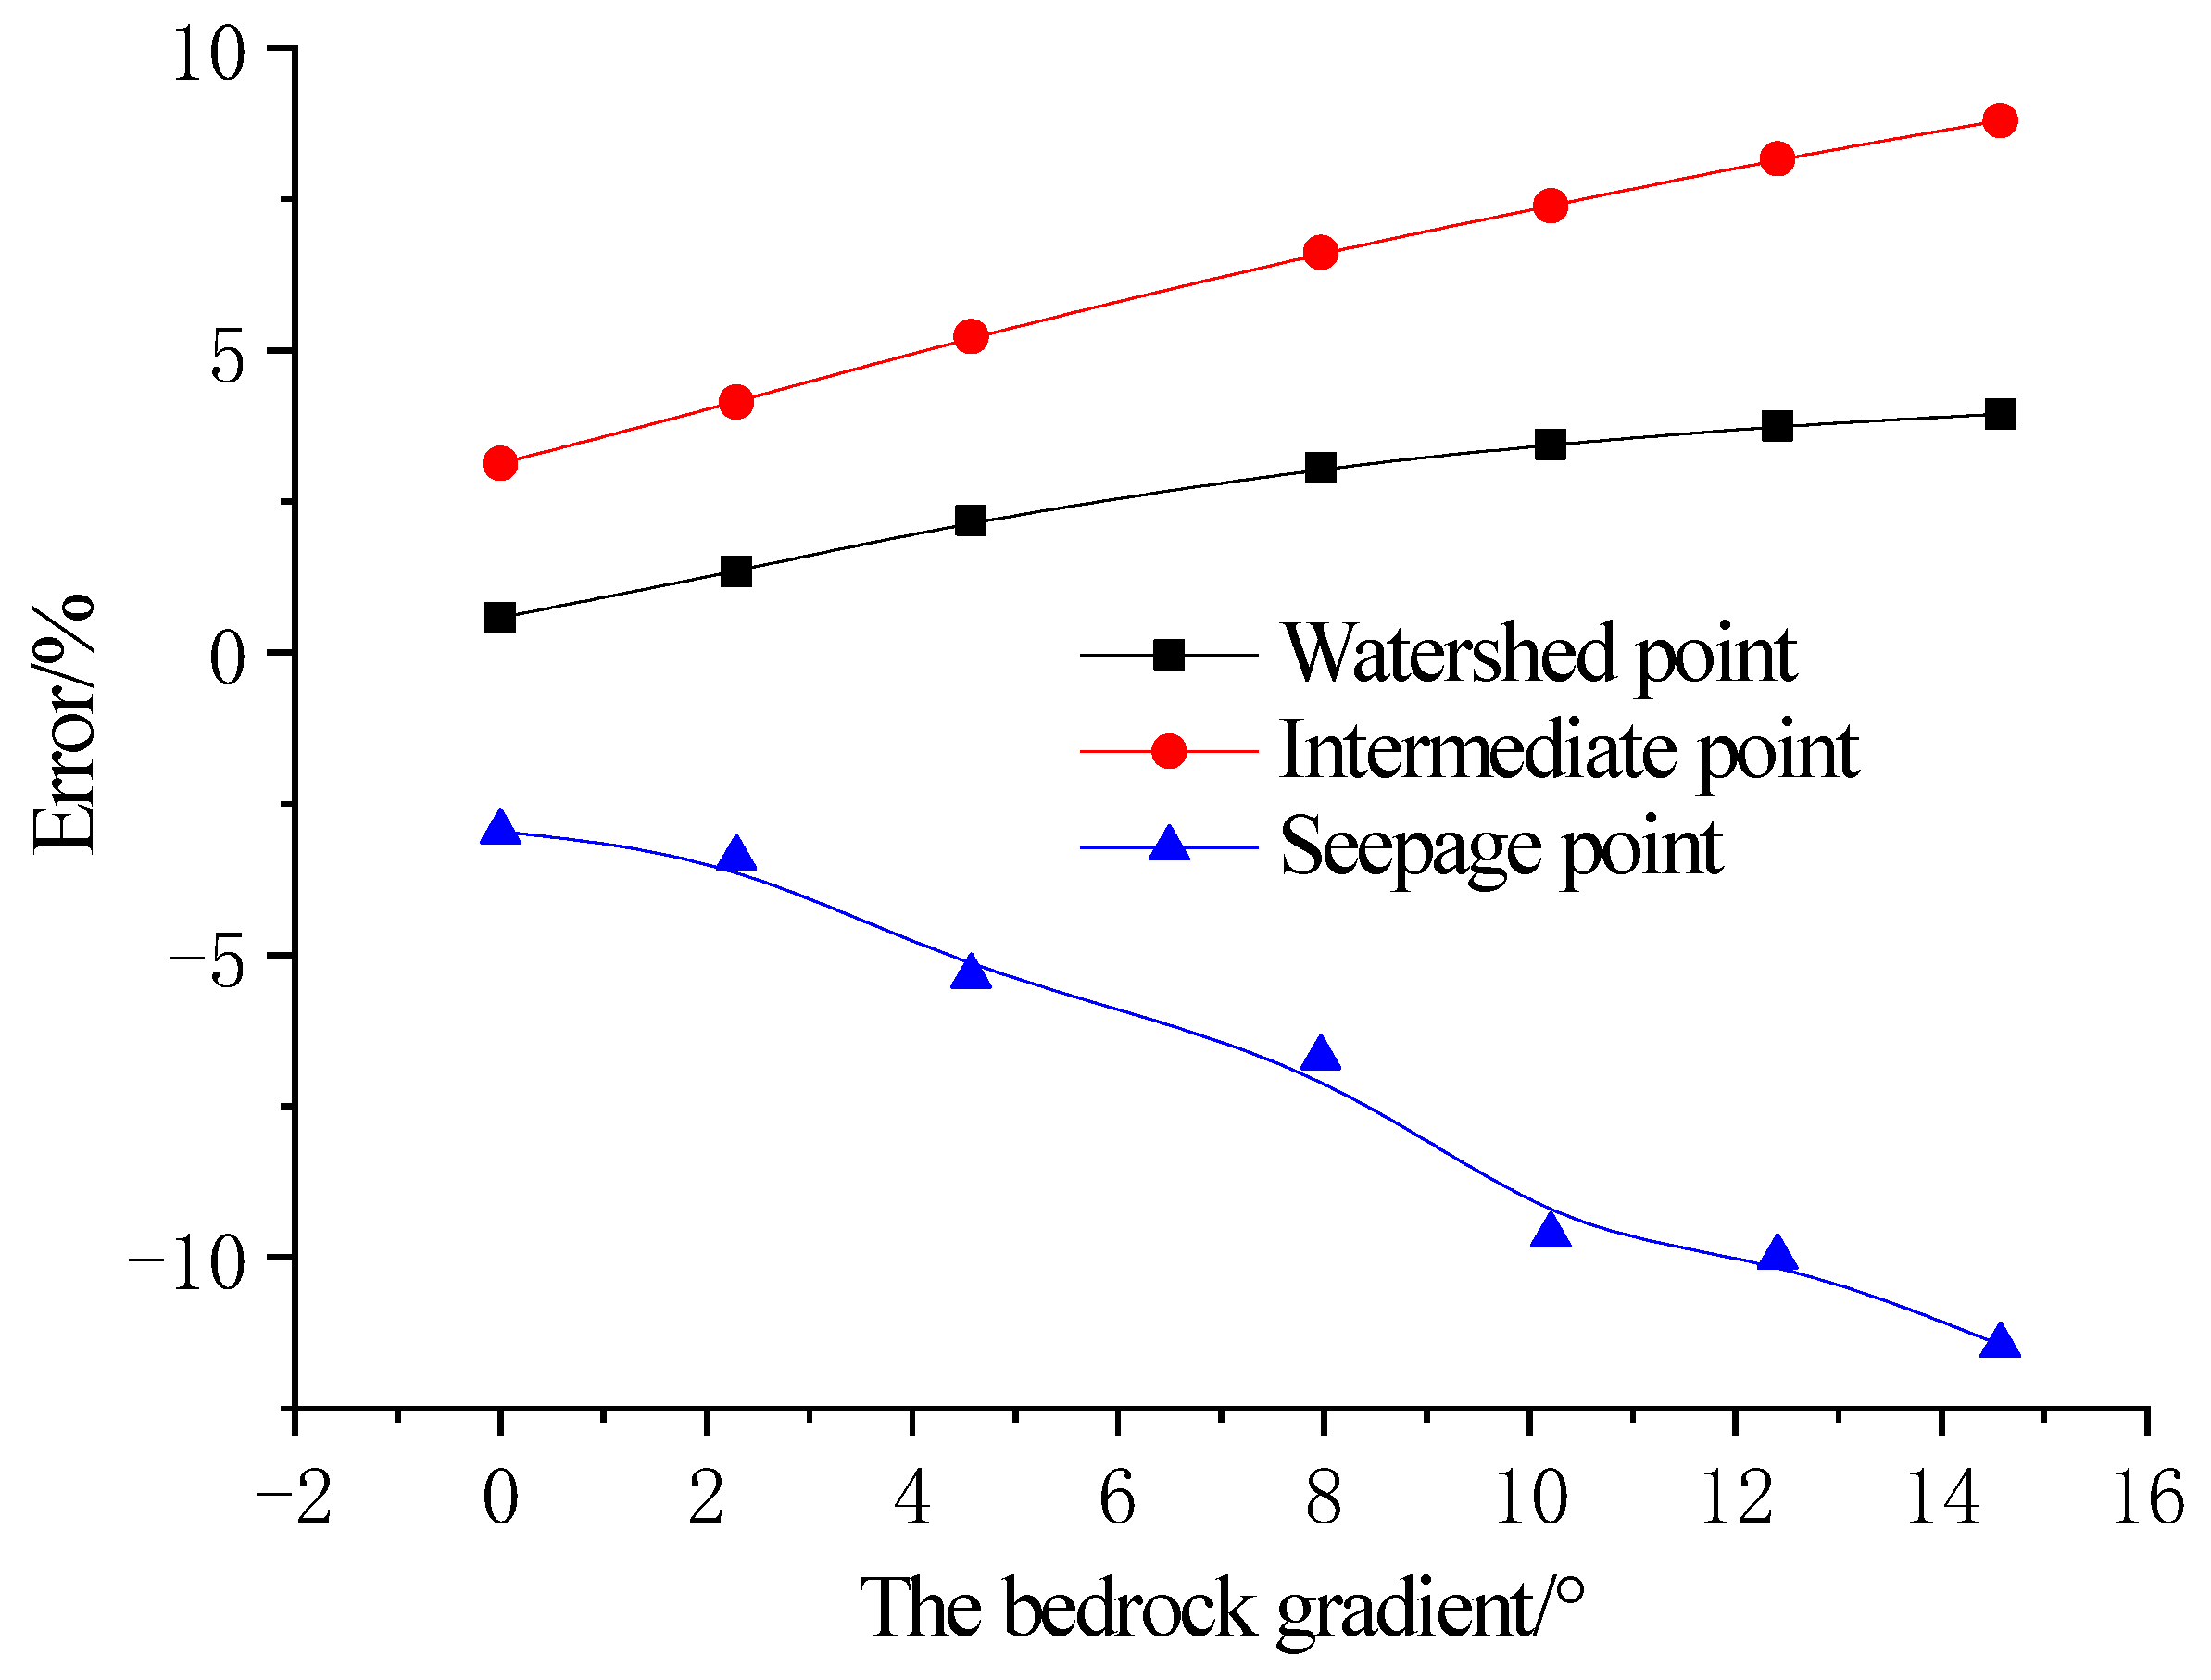
The variation curve of the calculation error of the seepage line with the bedrock gradient is shown in Figure 6. It can be seen that the calculated value of the seepage line is larger than the theoretical value at the watershed and intermediate point and smaller than the theoretical value at the seepage point. The absolute value of the error increases approximately linearly with the increase of the bedrock gradient. The error arises because the influence of the bedrock gradient is ignored in the calculation of the hydraulic gradient in the seepage line equation in this paper, and the horizontal distance is used to approximate the infiltration length. Since the bedrock gradient of ISL is generally small (β < 15°), the effect of the bedrock gradient on the calculation error of the seepage line is small.
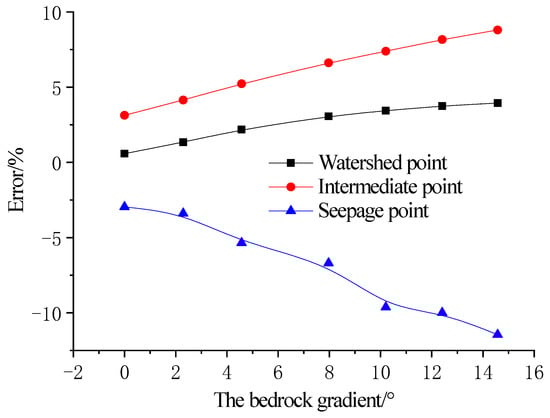
Figure 6.
The changing curve of the calculation error vs. gradient of bedrock.
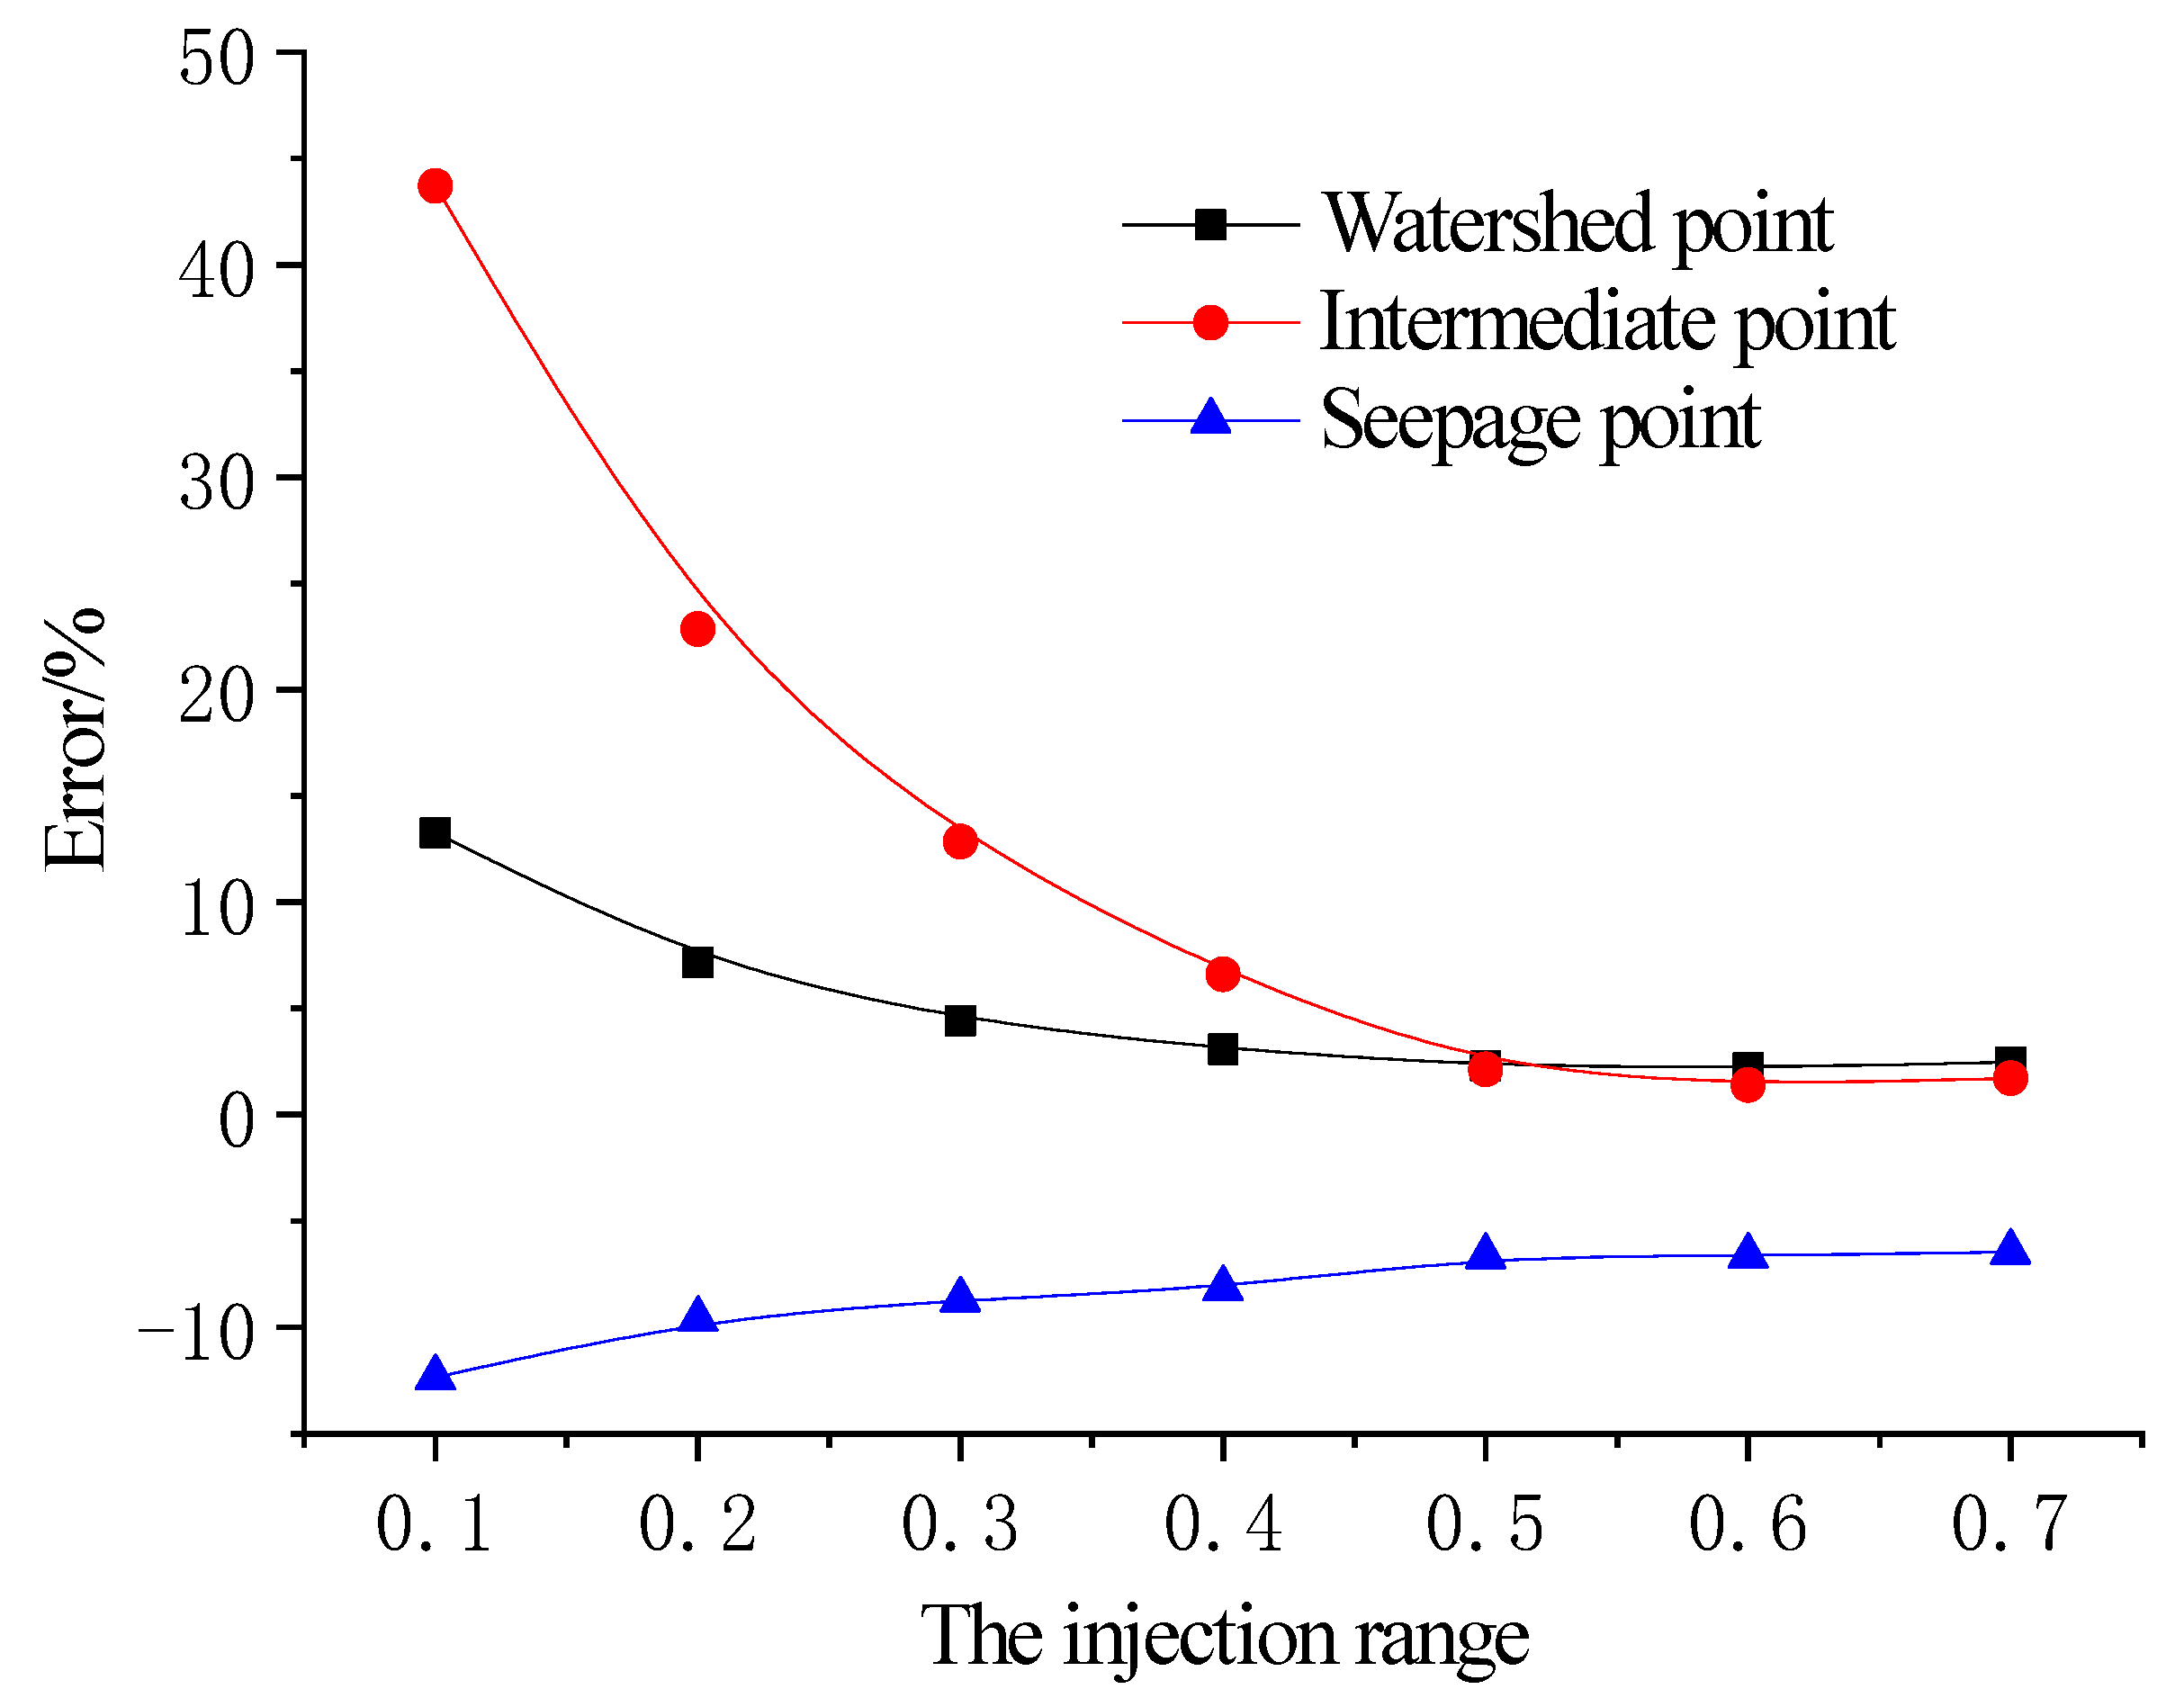
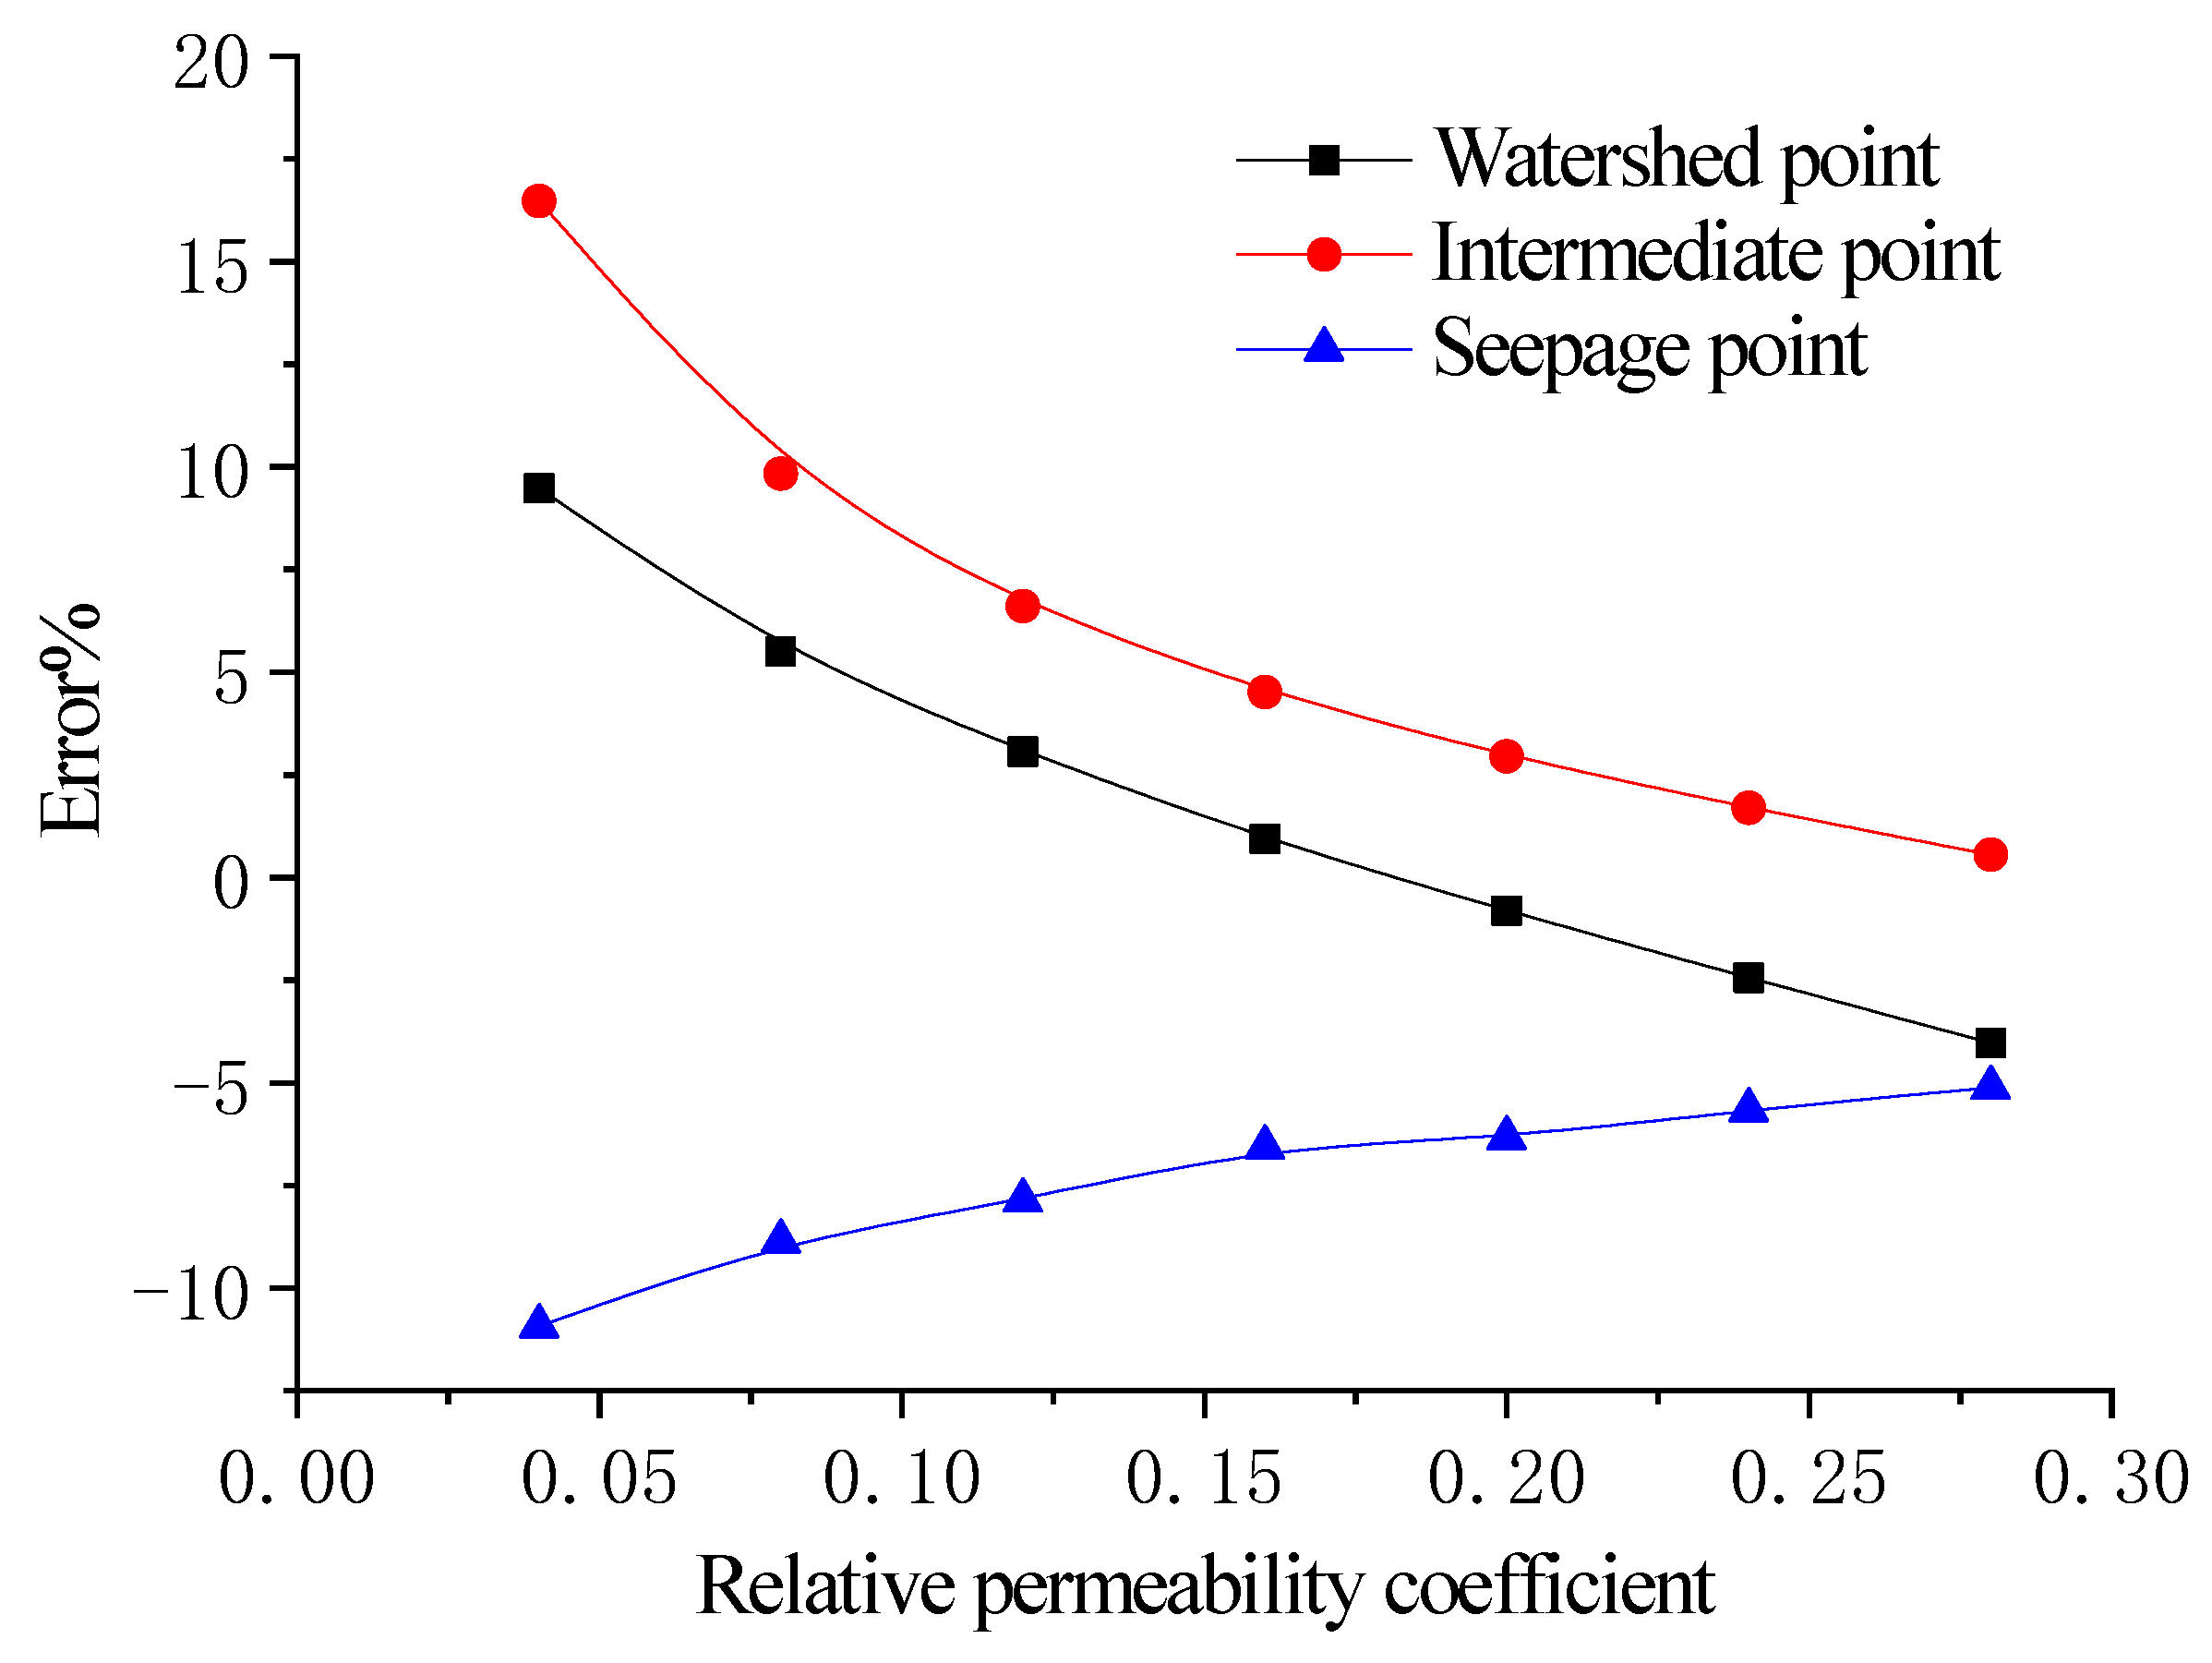
The variation curves of the calculation error of the seepage line with the fluid injection range and the relative permeability coefficient are shown in Figure 7 and Figure 8, respectively. It is shown that the change in the calculation error of the seepage line with the injection range has a similar pattern to the change with the relative permeability coefficient. Specifically, the absolute value of the error decreases as the injection range or relative permeability coefficient increases. The relative liquid injection intensity Wr was defined as the ratio of the actual injection flow rate of the mine to the saturation injection flow rate for the total area of the mine, i.e., Wr = λ·L1/L3. Figure 7 and Figure 8 show the change law of the calculation error of the seepage line equation with Wr. When Wr is very small, a complete seepage line cannot be formed on the bedrock of the mine. At this time, the seepage line calculation error is large, which only occurs in the early phase of ISL. In the steady phase, Wr is large, a high seepage line is formed on the mine bedrock, and calculation error is reduced to an acceptable range.
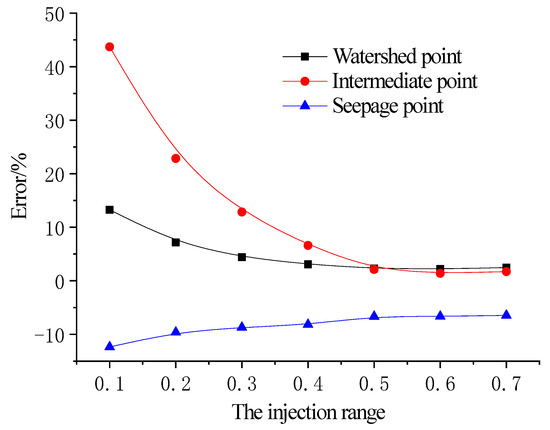
Figure 7.
The changing curve of the calculation error vs. the range of liquid injection.
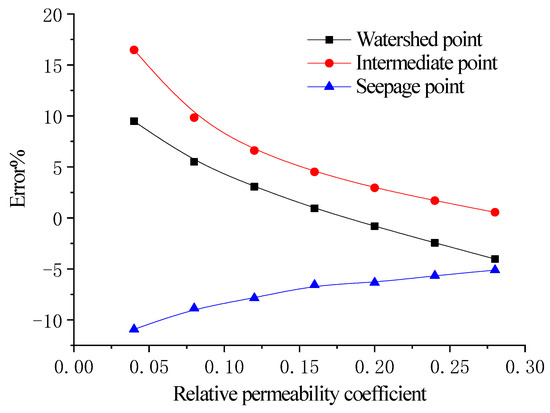
Figure 8.
The changing curve of the calculation error vs. relative permeability coefficient.
5. Discussion
In this study, a simplified “liquid injection/collection” plane model of ISL was established with a linear barefoot type rare earth mine as the research object. Based on the groundwater dynamics and the Dupuit assumption, the steady seepage line equation was derived under the known mine topographic conditions and liquid injection conditions, and the engineering verification and error analysis are carried out.
- The steady seepage line equation was expressed as a piecewise function, where the seepage line of the injection area is the upper half of the ellipse, and that of the non-injection area is a parabola. The seepage line equation can be solved under a given topographic condition (α, β, and L3) and liquid injection condition (L1 and λ). It is characterized by simple conditions and easy application;
- Typical sections were selected along the vertical mine ridgeline in an ore block in Guanxi, Longnan, Jiangxi Province. Several water level observation wells were arranged for ISL liquid-level observation field tests to determine the seepage line’s location when the mine’s seepage field tended to be steady. The measurement results were compared with the calculation results of the seepage line equation proposed in this paper. It was found that the calculation error was within an acceptable range for ionic rare earth mines, thus verifying the correctness and engineering applicability of the seepage line equation in this paper;
- With the finite element calculation results as the theoretical values, the influence of parameters such as seepage gradient, bedrock gradient, liquid injection range, and relative permeability coefficient on the calculation error of the equation was analyzed. It was found that the seepage line calculated by the equation is slightly higher than that obtained by the numerical calculation, and they are very close. The calculation error gradually increases along the flow field direction. For the general situation of ISL, the value of each parameter has limited influence on the calculation error of the equation;
- The level and shape of the seepage line of ISL are determined by the formation and development of the “liquid injection/collection” seepage field in the mine. They are also related to the stability of the mine slope, the percentage of the leaching volume of the ore body, the resource leaching rate, etc. Therefore, the seepage line equation can provide a theoretical basis for the “prior prediction (design)” of the leaching and seepage step of the “liquid injection/collection” of ISL. For example, with a given target value of the mine safety factor, the critical seepage line of the mine can be obtained according to the limit equilibrium method. Then, the maximum injection intensity under the given injection range or the maximum injection range under the given injection intensity can be obtained. When the clay layer at the foot of the mountain is thick, the seepage line equation can be used to guide the excavation of the tunnel around the foot of the mountain and prevent the mother liquor from entering the clay layer and causing anti-adsorption loss;
- The steady seepage line equation has many parameters, some parameters are not easy to obtain, and the model and parameters have been simplified to a certain extent. The calculation results should be fully evaluated before use. The equation can be further studied and improved in terms of accurately determining the topographic and geological conditions of the mine and the permeability coefficient of materials.
Author Contributions
Conceptualization, Y.G.; Methodology, Y.G.; Software, Y.G.; Validation, N.L.; Formal analysis, N.L.; Data curation, N.L.; Writing—original draft, Y.G.; Writing—review & editing, S.L. and G.W.; Visualization, N.L.; Supervision, N.L.; Project administration, S.L.; Funding acquisition, G.W. All authors have read and agreed to the published version of the manuscript.
Funding
This research was funded by the National Key R&D Program of China through Grant No. 2019YFC1805101. We greatly appreciate the financial support of the Doctoral Research Start-up Fund of the Jiangxi University of Technology (Grant No. YJ2018–03) and the Science and Technology Project from the Education Department of Jiangxi Province (Grant No. GJJ191592).
Institutional Review Board Statement
Not applicable.
Informed Consent Statement
Not applicable.
Data Availability Statement
All data generated or analyzed during this study are included in this article.
Acknowledgments
This work was also supported by the Innovation and Entrepreneurship Training Program for College Students funded by the College of Applied Sciences, Jiangxi University of Technology (Experimental study on liquid collection effect of fully covered rare earth mine in the tunnel, Grant No. S202013434018, and Calculation of critical liquid injection strength of in situ leaching in barefoot ion rare earth mines, Grant No. S202113434018); their support is gratefully acknowledged.
Conflicts of Interest
The authors declare no conflict of interest.
References
- Zheng, X.; Feng, X.; Chen, Z. Research progress on environmental problems of ionic rare earth mining and restoration of abandoned land. Appl. Chem. Ind. 2019, 48, 681–684. [Google Scholar]
- Zhou, X.; Wen, D.; Luo, X. The status quo and development trend of the extraction technology of ion-absorbed rare earth in southern China. Nonferrous Met. Sci. Eng. 2012, 3, 81–85. [Google Scholar]
- Xiao, Y.; Huang, X.; Feng, Z. Progress in the Green Extraction Technology for Rare Earth from Ion-adsorption Type Rare Earths Ore. Chin. Rare Earth 2015, 36, 109–115. [Google Scholar]
- Wang, G.; Luo, S.; Hu, S. Seepage Process and Slope Deformation of Barefoot Type Rare Earth Mine In-situ Leaching. Chin. Rare Rathe 2017, 38, 35–46. [Google Scholar]
- Wang, J.; Zhao, B.; Chen, D. AHP-based Analysis for Influencing Factors of Comprehensive Recovery of Ion-type Rare Earth Resources through Mining and Beneficiation Method. Min. Metall. Eng. 2016, 36, 9–13. [Google Scholar]
- Luo, X.; Wend, C.; Xu, J.; Ma, P.-L.; Tang, X.-K.; Chi, R.-A. Research Progress on and Development Trend of Exploitation Technique of Ion-absorbed Type Rare Earth Ore. Met. Mine 2014, 43, 83–90. [Google Scholar]
- Zhao, B.; Kang, Q.; She, Z. Technical Study on Promoting Leaching and Infiltration Effect of Ion Adsorption Rare Earth Deposit. Min. Metall. Eng. 2018, 38, 26–29. [Google Scholar]
- Zhuo, Y.; Iyang, X.; Zhao, K.; Deng, S.-Q. Study on Strength Weakening Earth Ore during Mechanism of Iron-adsorbed Rare Displacement Reaction. Chin. Rare Earths 2017, 38, 57–63. [Google Scholar]
- Zhuo, Y.; Wang, X.; Cao, S. Study on Relationship Between Pore Structure and Strength Weakening of Rare Earth Ore Under Seepage. Gold Sci. Technol. 2017, 25, 101–106. [Google Scholar]
- Zhong, W.; Zhu, W.; Zeng, P.; Huang, Z.; Wang, X.-J.; Guo, Z.-Q.; Hu, K.-J. Experimental study of the influence of leaching mining on mechanical properties of ionic rare earth ore floor bedrock. Rock Soil Mech. 2022, 43, 1481–1492. [Google Scholar]
- Tang, X.; Li, M.; Yang, D. Slope Slide in In-situ Leaching of Ionic Type Rare-earth Ore and Its Countermeasures. Met. Mine 2000, 289, 6–8. [Google Scholar]
- Hong, D.; Gao, L.; Yao, J.; Zhang, B.; Plaza, A.; Chanussot, J. Graph Convolutional Networks for Hyperspectral Image Classification. IEEE Trans. Geosci. Remote Sens. 2020, 59, 5966–5978. [Google Scholar] [CrossRef]
- Hong, D.; Gao, L.; Yokoya, N.; Yao, J.; Chanussot, J.; Du, Q.; Zhang, B. More Diverse Means Better: Multimodal Deep Learning Meets Remote-Sensing Imagery Classification. IEEE Trans. Geosci. Remote Sens. 2020, 59, 4340–4354. [Google Scholar] [CrossRef]
- Chen, S.; Min, G.; Cheng, R.; Shu, R.; Qiu, L.; Liu, K. An application of electrical resistivity tomography to investigate leakage pathways in the exploitation of IREO. IOP Conf. Ser. Earth Environ. Sci. 2021, 660, 012071. [Google Scholar] [CrossRef]
- Tian, J.; Yin, J.Q.; Chi, R.A.; Rao, G.H.; Jiang, M.T.; Kexian, O. Kinetics on leaching rare earth from weathered crust elution-deposited rare earth ores with ammonium sulfate solution. Hydrometallurgy 2010, 101, 166. [Google Scholar]
- He, Z.Y.; Zhang, Z.Y.; Yu, J.X.; Zhou, F.; Xu, Y.L.; Xu, Z.G.; Chen, Z.; Chi, R.A. Kinetics of column leaching of rare earth and aluminum from weathered crust elution-deposited rare earth ore with compound ammonium salt. Hydrometallurgy 2016, 163, 33. [Google Scholar] [CrossRef]
- Sun, Y.Y.; Xu, Q.H.; Li, Y.X. Leaching kinetics of ion adsorption rare earth using a low concentration of ammonium sulfate solution. Am. Chem. Soc. 2017, 38, 61. [Google Scholar]
- He, Z.Y.; Zhang, Z.Y.; Yu, J.X.; Xu, Y.L.; Zhou, F.; Chi, R.A. Column leaching process of rare earth and aluminum from weathered crust elution-deposited rare earth ore with ammonium salt. Trans. Nonferrous Met. Soc. China 2016, 26, 3024. [Google Scholar] [CrossRef]
- Qiu, T.S.; Zhu, D.M.; Wu, C.Y.; Wang, L.M. Lattice Boltzmann model for simulation on leaching process of weathered elution-deposited rare earth ore. Rare Earths 2017, 35, 1014. [Google Scholar] [CrossRef]
- Yang, Y.M.; Wang, L.; Xiao, M.; Huang, J.; Lan, Q.F.; Du, C.J. Study of leaching behaviors of main materials in ionic rare earth ore. Nonferrous Met. Sci. Eng. 2016, 7, 125. [Google Scholar]
- Feng, J.; He, Z.Y.; Zhou, F.; Xu, Z.G.; Zhang, Z.Y.; Sun, N.J.; Chen, Z.; Chi, R.A. The permeability research on a weathered crust elution-deposited rare earth ore. Chin. Rare Earths 2017, 38, 50. [Google Scholar]
- Zhang, Z.Y.; He, Z.Y.; Zhou, F.; Zhong, C.B.; Sun, N.J.; Chi, R.A. Swelling of clay minerals in ammonium leaching of weathered crust elution-deposited rare earth ores. Rare Met. 2018, 37, 72. [Google Scholar] [CrossRef]
- Tian, J.; Tang, X.K.; Yin, J.Q.; Chen, J.; Luo, X.P.; Rao, G.H. Enhanced leachability of a lean weathered crust elution-deposited rare-earth ore: Effects of sesbania gum filter-aid reagent. Metall. Mater. Trans. B 2013, 44, 1070. [Google Scholar] [CrossRef]
- Xiao, Y.F.; Lai, F.G.; Huang, L.; Feng, Z.Y.; Long, Z.Q. Reduction leaching of rare earth from ion-adsorption type rare earth ore: II. Compound leaching. Hydrometerlurgy 2017, 173, 1–8. [Google Scholar]
- Hu, S.; Hong, B.; Luo, S.; Wang, G.; Wang, X. Effect of in-situ leaching for rare earth mining to slope stability. J. Eng. Geol. 2017, 25, 110–116. [Google Scholar]
- Rao, R.; Li, M.; Zhang, S. Experimental Study on Landslide Features and Countermeasures of In-situ Leaching Slope of Ion-type Rare Earth Mines. Chin. Rare Earths 2016, 37, 26–31. [Google Scholar]
- Chi, R.; Liu, X. Prospect, and Development of Weathered Crust Elution-Deposited Rare Earth Ore. J. Chin. Soc. Rare Earths 2019, 37, 129–140. [Google Scholar]
- Gui, Y. The law and applications of infiltration and solute transport in situ leaching of ionic rare earth deposits. Ph.D. Dissertation, Jiangxi University of Science and Technology, Ganzhou, China, 2018. [Google Scholar]
- Gui, Y.; Luo, S.; Wang, G.S. Calculation of steady seepage flow from single-hole injection in in-situ leaching minim. J. Harbin Eng. Univ. 2018, 2018, 680–686. [Google Scholar]
- Gui, Y.; Wang, G.; Lai, Y.-M.; Hong, B.-G.; Hu, S.-L.; Long, P. A calculation model of influence radius of single-hole injection in in-situ leaching. Chin. J. Nonferrous Met. 2018, 18, 1050–1058. [Google Scholar]
- Guo, Z.; Lai, Y.; Zhao, K.; Jie, J.F.; Wang, G.S. Influence range of single hole injection of ionic rare earth for the constant head. Chin. J. Nonferrous Met. 2018, 28, 1918–1927. [Google Scholar]
- Chen, C. Dynamics of Groundwater, 4th ed.; Geological Publishing House: Beijing, China, 2011. [Google Scholar]
- Mao, C.X. Seepage Computation Analysis & Control, 2nd ed.; China Water&Power Press: Beijing, China, 2003. [Google Scholar]
- Wang, X.; Li, Y.; Huang, G.; Deng, S.Q.; Xiao, W.J.; Liao, S.Y. Changes of Pore Structure in Leaching Ion-adsorption Type Rare Earth Ore. J. Chin. Soc. Rare Earths 2017, 35, 528–536. [Google Scholar]
- Li, Y.; Wand, X.; Xiao, W.; Deng, S.; Cao, S.; Han, J. Study on Variation Regularity of Permeability in Leaching Process of Ion-type Rare Earth Ore. Met. Mine 2017, 17, 104–108. [Google Scholar]
Disclaimer/Publisher’s Note: The statements, opinions and data contained in all publications are solely those of the individual author(s) and contributor(s) and not of MDPI and/or the editor(s). MDPI and/or the editor(s) disclaim responsibility for any injury to people or property resulting from any ideas, methods, instructions or products referred to in the content. |
© 2023 by the authors. Licensee MDPI, Basel, Switzerland. This article is an open access article distributed under the terms and conditions of the Creative Commons Attribution (CC BY) license (https://creativecommons.org/licenses/by/4.0/).