1. Introduction
Food safety is no longer a national problem but one of the major issues affecting humanity on a global scale [
1]. Recent estimates indicate that 20% of food produced in the E.U. is lost, representing 88 million tonnes of food wasted annually, at the cost of almost €143 billion [
2]. Additionally, food waste significantly impacts the environment, contributing to around 6% of all greenhouse gas (GHG) emissions in the EU and imposing an unnecessary burden on scarce natural resources, such as water and land use [
3]. Reducing food waste has vast potential to save resources required to produce food, preserve food for human consumption, help farmers, companies and consumers to save money, and reduce the environmental impact of food production and consumption [
4,
5]. Food waste reduction and the need to adopt a more sustainable production and consumption model are priority areas in the European Green Deal and Farm to Fork plan due to their significant environmental and economic implications [
6]. As part of this new strategy, the EU will intensify its action to prevent food waste along the whole food supply chain [
6].
To maintain good product quality throughout the food supply chain, it is crucial to ensure that the food is handled under the proper environmental conditions [
6,
7]. In contrast to traditional supply chain management, the food in cold chains, such as chilled and frozen food, often have shorter shelf lives and are more sensitive to their surrounding environmental conditions, including temperature, humidity, and light intensity [
8]. Thus, maintaining the required environmental conditions requires specialised refrigeration systems along the entire cold chain. Depending on the food being handled, the ambient temperature might range from −25 °C to +10 °C in the cold chain [
9,
10]. These temperature conditions reduce the development of microorganisms (pathogens and spoilage flora), as well as the rates at which changes occur in perishable foods, such as ripening rates, browning reactions or water losses [
11,
12].
Specific attention should be made to potential risks that might directly impact product quality and operational efficiency while handling food in an environment with such a low temperature [
7]. Product quality risk is often defined as the degree to which a product falls short of consumers’ expectations, resulting from product degradation and contamination across the cold chain [
7]. Customer acceptability is heavily impacted by product quality degradation, which should be seriously regulated throughout the cold chain; otherwise, the product quality may fall below the acceptable level, resulting in waste and spoilage issues [
13]. Companies may suffer losses if any potential anomalies emerge along the cold chain, which can compromise not only the product quality but also consumer health [
14,
15]. These anomalies can be caused by various factors, including refrigeration system failures, incorrect temperature settings in refrigeration systems, and very irregular temperature distribution owing to unequal air distribution or exposure to outside air during delivery loading and unloading [
16,
17]. The circumstances of transportation and storage play a significant role in the safety and quality of perishable food [
18,
19]. Derens et al. [
20] found that the average temperature of food products during transportation is around 12% higher than recommended. A temperature break of 2 h during the transportation of perishable food may result in shelf-life decay by 10 to 40% [
21], and the loss of products can reach as much as 35% [
22]. Hence, the incidence of temperature anomalies can significantly influence the quality of highly perishable products [
21]. In conventional cold chain management systems, vehicles and warehouses are often equipped with thermometers and humidity sensors [
23,
24]. However, this approach cannot dynamically communicate the information with remote users and can only display and record environmental information locally [
25]. Additionally, it cannot determine the environmental conditions during vehicle switching, temporary storage, or truck loading, among other situations [
25]. Typically, it also does not monitor the microcosmic environment in the boxes holding perishable food: only the macrocosmic environment in the warehouse or vehicles [
25]. As a result, such systems cannot deliver continuous and real-time environmental information on perishable food.
In this sense, real-time environmental monitoring and control are critical for the safety and quality of perishable food and for tracking and evaluating the levels of risk throughout the cold chain [
19,
26,
27]. In recent years, Internet of Things (IoT) technologies have been increasingly applied in the food industry due to their promising potential for more efficient monitoring in real time [
28,
29,
30]. The IoT environment enables smart devices equipped with wireless communication technologies, sensors and actuators to connect to the internet and share their data in real time [
31,
32]. In the cold chain, IoT sensing technologies enable the automatic tracking and tracing of food items and surrounding conditions, resulting in transparent cold chain management [
7,
33]. In addition, food quality deterioration can be monitored in a real-time manner. Because of the progress of microelectronics technology, the cost and power consumption of IoT sensors have dropped substantially during the past few years [
34,
35,
36]. With appropriate configuration, it may be set up to monitor various environmental conditions connected to food safety and quality, including temperature, humidity, light, vibration, carbon dioxide, ethylene, and others [
25,
37,
38].
The main benefit of using these technologies is the ability to provide operators with automatic alerts to take corrective actions on time and prevent food quality deterioration [
21,
39]. In addition, IoT technology also enables supply chains to employ dynamic virtualisations in operational management procedures, which helps food organisations deal with perishable food products, unpredictable supply fluctuations, and strict food safety and sustainability requirements [
40]. On the other hand, without real-time traceability systems, it is difficult to ensure that the food items are moved and maintained in stable specified environmental conditions along the cold chain [
41]. Recent research discussed the development of cold chain monitoring systems using an online-decision-support system based on IoT technologies for fruits, vegetables, meat and fishery products [
42,
43,
44,
45,
46,
47]. The proposed systems monitor environmental conditions in real time and provide alerts on whether the temperature, humidity, or other factors exceed the safety limit. The combination of monitoring and decision-making support systems also showed promising results in reducing transportation losses. Furthermore, by installing the monitoring system, losses due to quality degradation were decreased, enhancing the overall performance of the food supply chain. The studies also showed that the product categories in the cold chain in which these technologies can be applied are varied [
42,
43,
44,
45,
46,
47].
Although real-time monitoring technologies on the cold chain will become more common in the coming years, several questions are raised by the imminent introduction of these new data monitoring sources, such as the placement of the sensors to take into account the entire load in the refrigeration equipment, the criteria for alert definition, and the methods for identifying and describing temperature abnormalities [
21]. Regarding placement, numerous studies indicate that the temperature inside the refrigerated equipment is heterogeneous [
11], and the current temperature control practice is complex because temperature measurements taken at one location may not represent what happens in the entire load. Additionally, only the ambient temperature is often monitored, while the product temperature may fluctuate, particularly in dynamic systems such as the cold chain [
21]. The criteria for determining the alerts must also be well specified; a too lenient definition may result in undetected alerts and lead to food waste [
21]. Conversely, too stringent criteria may result in false alerts and lead to food waste and high logistic costs [
21]. Therefore, to create an effective alert system that reduces food waste, the total number of undetected and false alerts must be minimised [
48]. Regarding the methods, to implement an efficient approach to detect temperature anomalies, a robust solution regarding the methodology used to determine the product temperature and the temperature distribution must be developed [
49].
To our knowledge, there is still a lack of knowledge of potential anomalies, their characteristics such as occurrence, break level (gap between recommended and actual temperature) and their duration, especially for temperature anomalies caused by products remaining at low temperatures during deliveries. Hence, better characterising the temperature profile throughout the cold food chain is required to estimate and avoid food quality deterioration accurately.
In this context, this study proposes a real-time monitoring system that uses Internet of Things technologies to gather data on the environmental conditions (temperature and humidity) of perishable food during transportation. The real-time monitoring system comprises temperature/humidity sensors, a cellular logger (which both acts as a sensor recording device and a gateway), a Big Data server, a web dashboard for monitoring, and an intelligent anomaly alerting system. Accelerometer data and GPS coordinates are used to indicate trip detection, which is utilised for both smart alerting and to increase the battery lifespan. The proposed system was applied in delivery vehicles for a Northern Irish food wholesaler. Integrating these technologies should ensure the quality and safety of the food products under analysis throughout the cold supply chain.
3. Materials and Methods
In order to minimise the loss of perishable food products during transportation, a Real-Time Anomaly Detection (RTAD) system is proposed to automatically monitor real-time environmental parameters, such as temperature and relative humidity. Additionally, this paper aims to demonstrate that a wireless network system based on LTE-M communication can operate properly under the conditions of flexibility, signal loss resistance and power autonomy enough to be used in the cold supply chain. The designed system should be able to communicate in real time the measured variables with a power consumption capable of providing maximum battery autonomy. In this sense, a trip detection algorithm was also created to reduce the power consumption of the IoT devices under analysis.
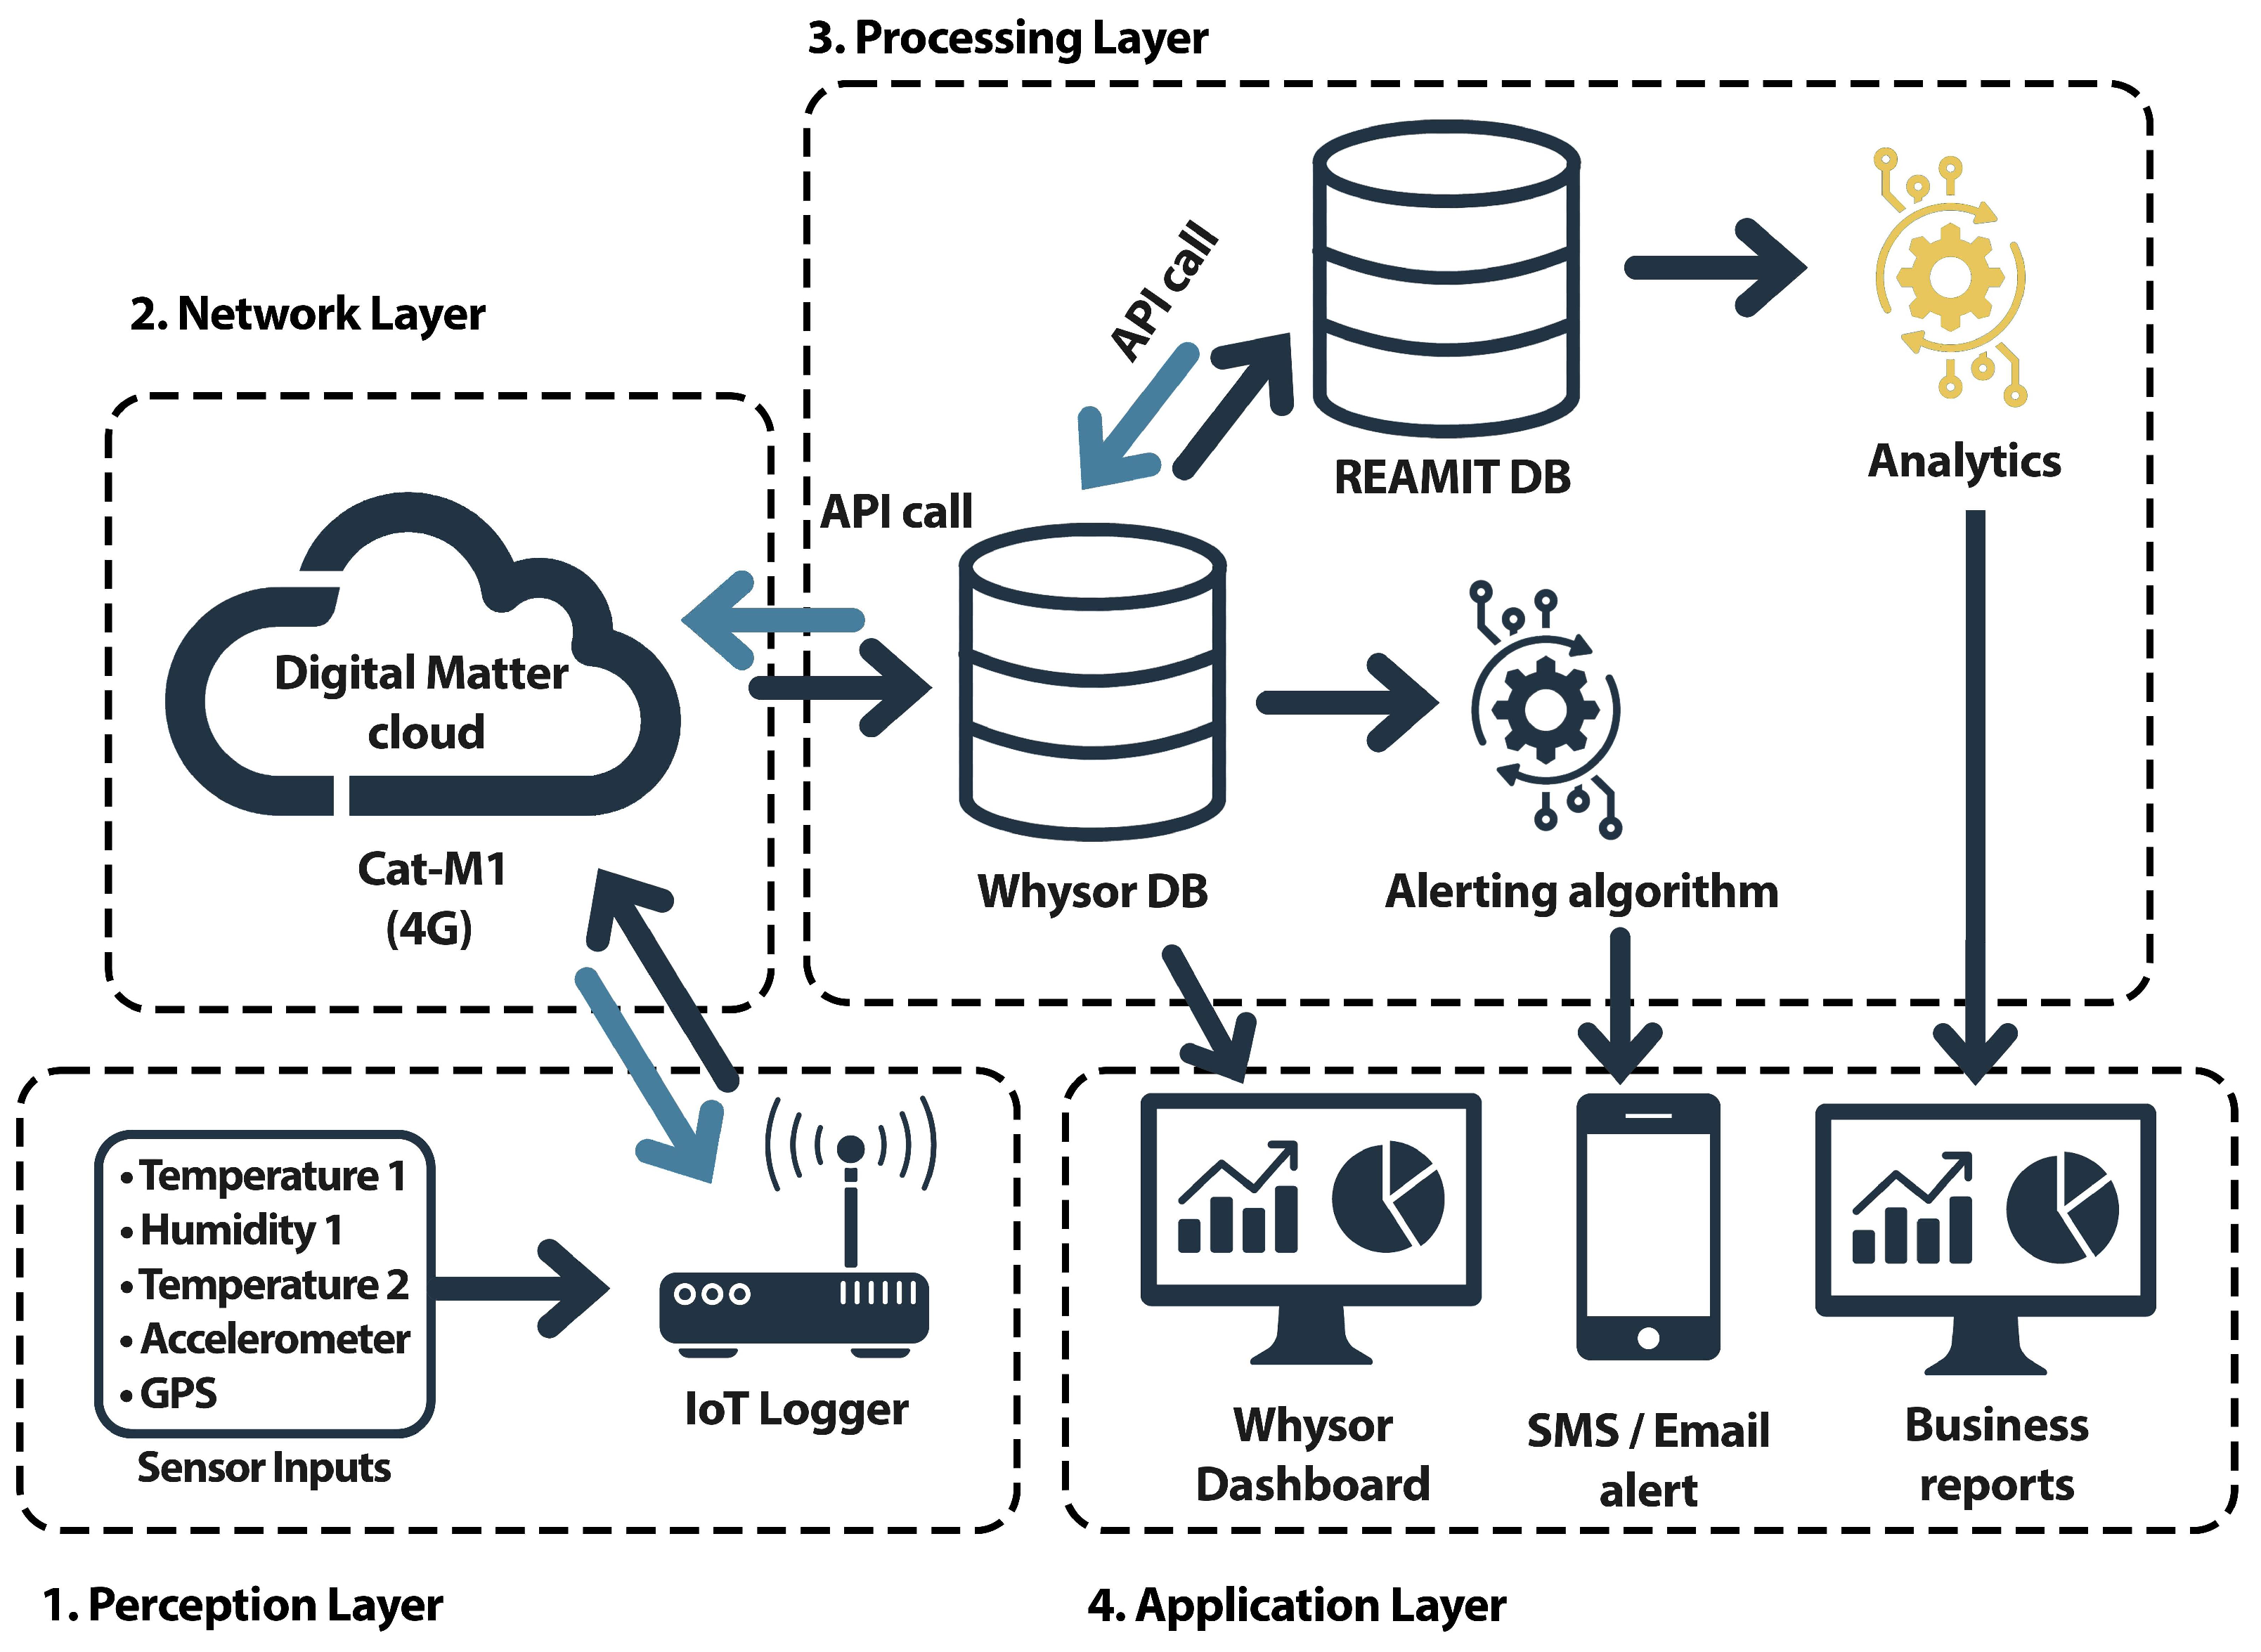
The architecture of the RTAD system follows the standard 4-layer approach often employed by IoT systems. These are (1) the perception layer, (2) the network layer, (3) the processing layer, and (4) the application layer.
1. The perception layer, sometimes referred to as the sensing or data acquisition layer, is responsible for collecting data from the environment based on the sensor technologies employed in the sensor setup.
2. The network layer, sometimes called the communication layer, is responsible for receiving the obtained data and transferring it to the cloud storage service via a gateway. The gateway connects to the network layer using internet connection.
3. The processing layer, sometimes called the storage and control layer, consists of data storage and analytics. This layer is responsible for the retrieval of the data from the network layer, transforming it, and storing it accordingly. Additionally, this layer handles the processing of the data for alerting and intelligent analytics.
4. The application layer provides a front end in the form of an online dashboard to allow viewing of the data in real time. The application layer also consists of an alerting system, which operates as an SMS/email service to the user’s mobile phone. The final component of the application layer is business reports which are prepared by the analytics team to give further insights into the recorded data.
Figure 1 provides a visualisation of the architecture employed for the IoT cold chain anomaly alerting system based on these 4 layers. The following sections provide more detail as to the components in each layer.
3.1. The Network Layer: Communication Protocol
A network down approach to architecture design was adopted when designing the IoT anomaly detection system, meaning the first area of the system considered and defined was the network layer protocol. This design approach was applied, as the chosen communication protocol would influence the rest of the sensor setup that could be deployed. The solution would require long-range transmission to connect the sensors to the cloud while the vehicles were in transport, while having low energy consumption would be required to ensure battery maintenance was kept to a minimum. Seminal works in the field focus on the low-energy aspect of the IoT requirement and propose technologies such as ZigBee and Bluetooth BLE for their IoT solutions [
73,
74]; however, these are based on short-range radio transmission and thus require a separate gateway device to interface with the world wide web. Solutions to combat the transmission range have been developed based on traditional cellular communication technologies (e.g., GPRS, 3G) [
45,
63]; however, these systems are very power intensive and thus inappropriate for long-term commercial use, where low maintenance is a driver toward technology acceptance.
Recently, however, a wireless communication technology called low-power wide area network (LPWAN) has emerged in response to the demands of Internet of Things applications. As the name suggests, this network operates on low power, has long range, and possesses affordable communication qualities. Sub-GHz unlicensed ISM bands (e.g., 868 MHz in Europe and 915 MHz in the U.S.) are used to operate LPWAN. In urban areas, the network allows for long-distance communication of 1–5 km, while in rural areas, it has a range of 10–40 km [
75]. It is also very energy-efficient, with a typical end node (i.e., sensor) battery life of more than 10 years [
76]. Because of this, the LPWAN communication protocol is gaining significant traction in both the industrial and research areas. While there are various implementations of LPWAN, the top emerging technologies at the moment are Sigfox, LoRa, NB-IoT, and LTE-M. As discussed, these technologies overcome the high-power consumption of conventional cellular networks and the range limitation of short-range networks while still providing an excellent radio penetration, which allows them to establish connection with objects located in intolerant or severe environments [
77].
Sigfox is a wireless company and network operator that launched the first LPWAN technology in the IoT domain in 2009, and it has enjoyed popularity since. The physical layer of Sigfox is characterised by using binary phase-shift keying (BPSK) modulation, an ultra-narrow bandwith of 100 Hz and broadcasting on unlicensed ISM bands (e.g., 868 or 902 MHz). Its main advantages include a suitable range of 10 km in urban areas and up to 40 km in rural environments, low power consumption, high receiver sensitivity, and low-cost antenna design. However, its maximum throughput is 100 bps.
Another key, energy efficient and popular LPWAN technology that emerged in recent years is LoRa (from “long range”). Likewise, LoRa also uses unlicensed ISM bands (e.g., 868 or 915 MHz), although the modulation relies on chirp spread spectrum (CSS) and the bandwidths are 250 kHz and 125 kHz. It was first developed by in 2009, and in 2015, it was standardised by LoRa-Alliance. LoRa has established itself as a world leader for IoT communication and as such has been rolled out in 42 countries to date. Of these, however, only a select few have countrywide coverage (for example, the Netherlands and France [
78]).
When considering the former technologies as candidates for the IoT solution proposed, one of the limitations encountered was the need for a broad network coverage suitable for the validation stage of the system: transport vehicles on the move delivering products in and around urban areas in northern Ireland. That is, the solution employed should not rely on a piece of hardware, or gateway, that provided network coverage in a limited area around its deployment location but rather a national-wide network coverage. Unfortunately, neither Sigfox or LoRa have the required national-wide coverage and thus would not be appropriate for the communication stack for the IoT solution being designed. Instead, a cellular telecommunication-based protocol would be required.
The other two popular LPWAN options that were considered were the Narrowband Internet of Things (NB-IoT) and Long-Term Evolution Machine (LTE-M). NB-IoT is part of the 3rd generation partnership project (3GPP) LTE specifications and shares several technical components with LTE. It can coexist with GSM and LTE under licensed frequency bands. Its main advantages are low power consumption, extended coverage and deep penetration [
79]. The LTE-M network is derived from the 3GPP 4G LTE standard. Likewise, it also offers a low power consumption, long range and deep penetration. In fact, both NB-IoT and LTE-M share considerable similarities, with their main difference residing in the operational bands they use. These technologies were considered suitable candidates for the validation stage of the system as they were both available in northern Ireland. While both protocols offer a high degree of compatibility with standard 4G LTE and 5G networks, LTE-M was finally chosen as the communication protocol as it offered the added advantages of a range of bandwidth, latency, and mobility [
80].
3.2. The Perception Layer
3.2.1. Iot Logger
With the requirement of LTE-M communication established, the Eagle datalogger (Digital Matter, South Africa) was selected as the platform for the development of the REAMIT solution. The logger is an IP67 rated rugged cellular IoT device, supporting a range of inputs for various IoT applications. The Eagle runs on either 4 × C Alkaline or Lithium Thionyl Chloride (LTC) batteries, or it can be wired to permanent power (6–16 V DC). It contains I2C, SDI-12 and RS-485 interfaces as well as 2 × analogue inputs, 3 × digital inputs, 2 × switched ground inputs, and 2 × 4–20 mA inputs, thus supporting a vast array of sensors to connect to the device. Additionally, it has an onboard GPS module and an accelerometer for geofencing and movement detection, and it is equipped with a SIM card allowing the device to run on the IoT low power LTE-M (CAT-M1) network [
80]. The Eagle offers third-party cloud integration via an HTTPS webhook allowing for the convenient retrieval of recorded data for visualisation and analytics.
3.2.2. Sensors
A limitation of the Eagle’s architecture was that I2C devices produced by third-party manufacturers could not be configured with custom addresses, and thus, the I2C communication bus only supported one sensor. For this, the highly accurate and robust T9602 Temperature/Relative Humidity (T/RH;
% RH,
C, 0.01
C resolution) I2C sensor (Amphenol, Wallingford, CT, USA) was chosen. However, since the objective of this work was to design a system which could monitor temperature in two areas of a delivery van in parallel, a second communication bus would have to be employed. The literature has shown that the DS18B20 temperature 1-Wire probe (Maxim Integrated, San Jose, CA, USA), noted for its low cost and accuracy, has been widely employed for IoT temperature monitoring solutions, especially those pertaining to food loss and waste monitoring [
81]. Thus, this sensor was selected as the second probe for the setup to allow monitoring in the chill area of vans in addition to their freezers. The sensor has an operating voltage of 3.3–5 V and
C accuracy. To allow flexibility on the installation location of the logger, the DS18B20 sensor was purchased on a 3 metre length to ensure it could be routed to the freezer area of the van. From official documentation from the sensor supplier, on cable lengths greater than 1 m, the sensor required a 5 V supply due to the voltage drop caused by the increased resistance which occurs on longer cable lengths. Given that
, the voltage drop will increase as resistance increases. Using the resistance of a length of material formula
, where
is the conductivity of the cables material,
l is the length of the cable, and
A is the cross-sectional area of the cable, it is demonstrated that as the length of the cable extends, the resistance of it also extends. Hence, the longer the cable, the larger the voltage drop.
However, the Eagle logger only had a 3.3 V supply so a voltage regulator had to be added to the circuit, which would step up the 3.3 V to 5 V. The 2119 (Pololou, Las Vegas, NV, USA) step up/step down voltage regulator ( = 2.7 V–11.8 V, = 5 V) was selected and added to each of the DS18B20 probes. This DC–DC converter is a switched-mode power supply which uses a buck-boost topology to regulate the input voltage to 5 V output with +5/−3% accuracy. Its typical continuous output current is 500 mA when stepping up, and its quiescent current is less than 0.1 mA.
An onboard accelerometer is used to detect the movement and change device state from sleep to awake. GPS logging was handled on-board the Eagle device by the EVA-M8 module (uBlox, Switzerland). The Eagle processes the GPS recordings and provides a single binary bit to indicate if the logger has moved in the last five minutes. The intention of this feature was to allow logistics companies to track whether their road transport vehicles were in motion. Further details on the trip detection algorithm will be presented in the next section.
3.2.3. Trip Detection
For an IoT anomaly detection system to be useful for users in food logistics, alerts should only be sent to personnel when the perishable food is in transport. This is to avoid false alerting when, for example, the delivery vehicle is parked overnight and the refrigeration unit is not powered on. Through being able to detect a trip on the device, an alerting algorithm can be constructed which is only enabled if the vehicle trip status parameter is true, therefore ensuring warnings are only delivered when the vehicle is being used. Additionally, by having the functionality to detect a trip, the device can assume a low-power sleep state and only wake and commence recording once the vehicle is in motion. Putting the device in a sleep state while not in use will significantly reduce battery consumption, thus reducing the maintenance schedule requirements of the device.
In order to detect a trip, therefore, a trip detection algorithm was incorporated in this work. The algorithm works as follows. When the device is powered on, it assumes a low-power sleep state. The only component active in this state is an ultra-low current piezoelectric accelerometer, which is constantly monitoring the acceleration applied to the device. If the accelerometer records a reading above a user-defined jostle threshold, it causes an interrupt to be fired on the integrated circuit, changing the state of the logger from low-power sleep mode to broadcast mode. Once in broadcast mode, the logger obtains a GPS fix. The logger then waits for a user-specified length of time before acquiring a second GPS fix. If the second GPS location is not equal to the first GPS location, the vehicle is in motion. The logger updates the trip parameter to true and the process repeats, acquiring two GPS fixes a period of time apart and checking if they match. Note that there is a ‘heartbeat’ mode implemented on the logger to send data periodically even if it is not in motion. This allows the user to see that the equipment still has battery power and is operating as normal. The frequency of the heartbeat can be configured by the user. For the case of food transportation, 12 h has been chosen. The pseudocode for the algorithm is presented in Algorithm 1.
| Algorithm 1: Device trip detection |
 |
3.3. The Processing Layer
The primary datastore for the anomaly detection system is provided by the software company Whysor (Netherlands), who specialises in Internet of Things solutions and Big Data architecture. As visualised in the architecture diagram in
Figure 1, the Whysor database is synchronised in real time from Digital Matter’s cloud using an in-house developed database connector which handles the data transformation. The Whysor datastore was a PostgreSQL database.
To allow the analytics researchers on the project to perform data analysis on the collected data, a backup data store was created. This served two purposes. Firstly, it allowed the REAMIT project to own the data and give GDPR assurances to pilot companies that their data were being stored on a secure university server dedicated to the project. Secondly, each researcher had their own private instance of the database, allowing them to manipulate the data without affecting the historical records saved to the Whysor DB. The backup database was a Microsoft SQL Server database and was synchronised with the Whysor database in real time using an in-house developed API.
The SMS alerting system runs in the processing layer and allows the user to build rule-based algorithms to send alerts if particular criteria are met. Further details on the algorithm and parameters chosen will be presented in the next section. The SMS alerting was provided by Amazon’s Simple Notification Service (SNS). The algorithm’s parameters are configurable from the dashboard, which is part of the application layer.
3.4. The Application Layer
Whysor developed and supplied the dashboard for real-time monitoring and alerting, which was utilised by each pilot study in the project. The web dashboard was developed in
Node.js and utilises the
Chart.js chart library for visualisation. The dashboard is implemented using the responsive web design principles, meaning the website and each of the chart elements appropriately scale to the device it is being viewed on. This allows the dashboard to run on both desktop computer and mobile phone, allowing the end-user to access it on multiple devices and interpret data in real time. The dashboard is completely customisable by the end-user, who can choose how they wish to visualise various sensor data, whether it be via line charts, gauges, tabular, or static text format. As visualised in the architecture diagram in
Figure 1, the dashboard’s data come from the Whysor database. All data analysis and visualisation were performed in Matlab 2021b.
3.5. Real-World Testing
Musgrave Group Ltd. is an Irish food wholesaler, founded in Cork by the Musgrave brothers, Thomas and Stuart in 1876. It is currently Ireland’s largest grocery distributor, with operations in Ireland and Spain, and they have estimated annual sales of over €4 billion. The company is still largely owned by the Musgrave family. Musgrave Northern Ireland is headquartered in Belfast, Northern Ireland. Musgrave clients include local restaurants, fast-food outlets, and convenience shops in northern Ireland, and they also operate multiple large cash and carry facilities for the general public. Musgrave maintains their own fleet of last-mile delivery vehicles to facilitate multi-drop deliveries to their business customers.
While performing deliveries of frozen goods and general perishables to their business customers, Musgrave noticed that the refrigeration units in the delivery vans operating in the greater Belfast area would occasionally break down without any indication to either the driver or the logistics staff at the warehouse. The temperature of the chilled and frozen food products inside the van would increase, surpassing the food storage temperature safety threshold, resulting in a van load of spoiled stock. Musgrave sought a system which could alert them of such anomalies.
The proposed system follows three requirements. Firstly, the transport vans should be connected to the cloud to allow for real-time data reporting/monitoring via a dashboard while the vans perform deliveries. Each of these vans have both a chill and a freeze compartment, both of which should be monitored throughout a journey. Secondly, the system should contain an alerting system which should send SMS messages to drivers and warehouse logistics staff notifying if any anomalies occur. These alerts should not be sent when the van is stationary, e.g., parked overnight, stopped while performing a delivery, etc. Thirdly, the power consumption of the proposed system should be such that maintaining the equipment does not become an arduous task.
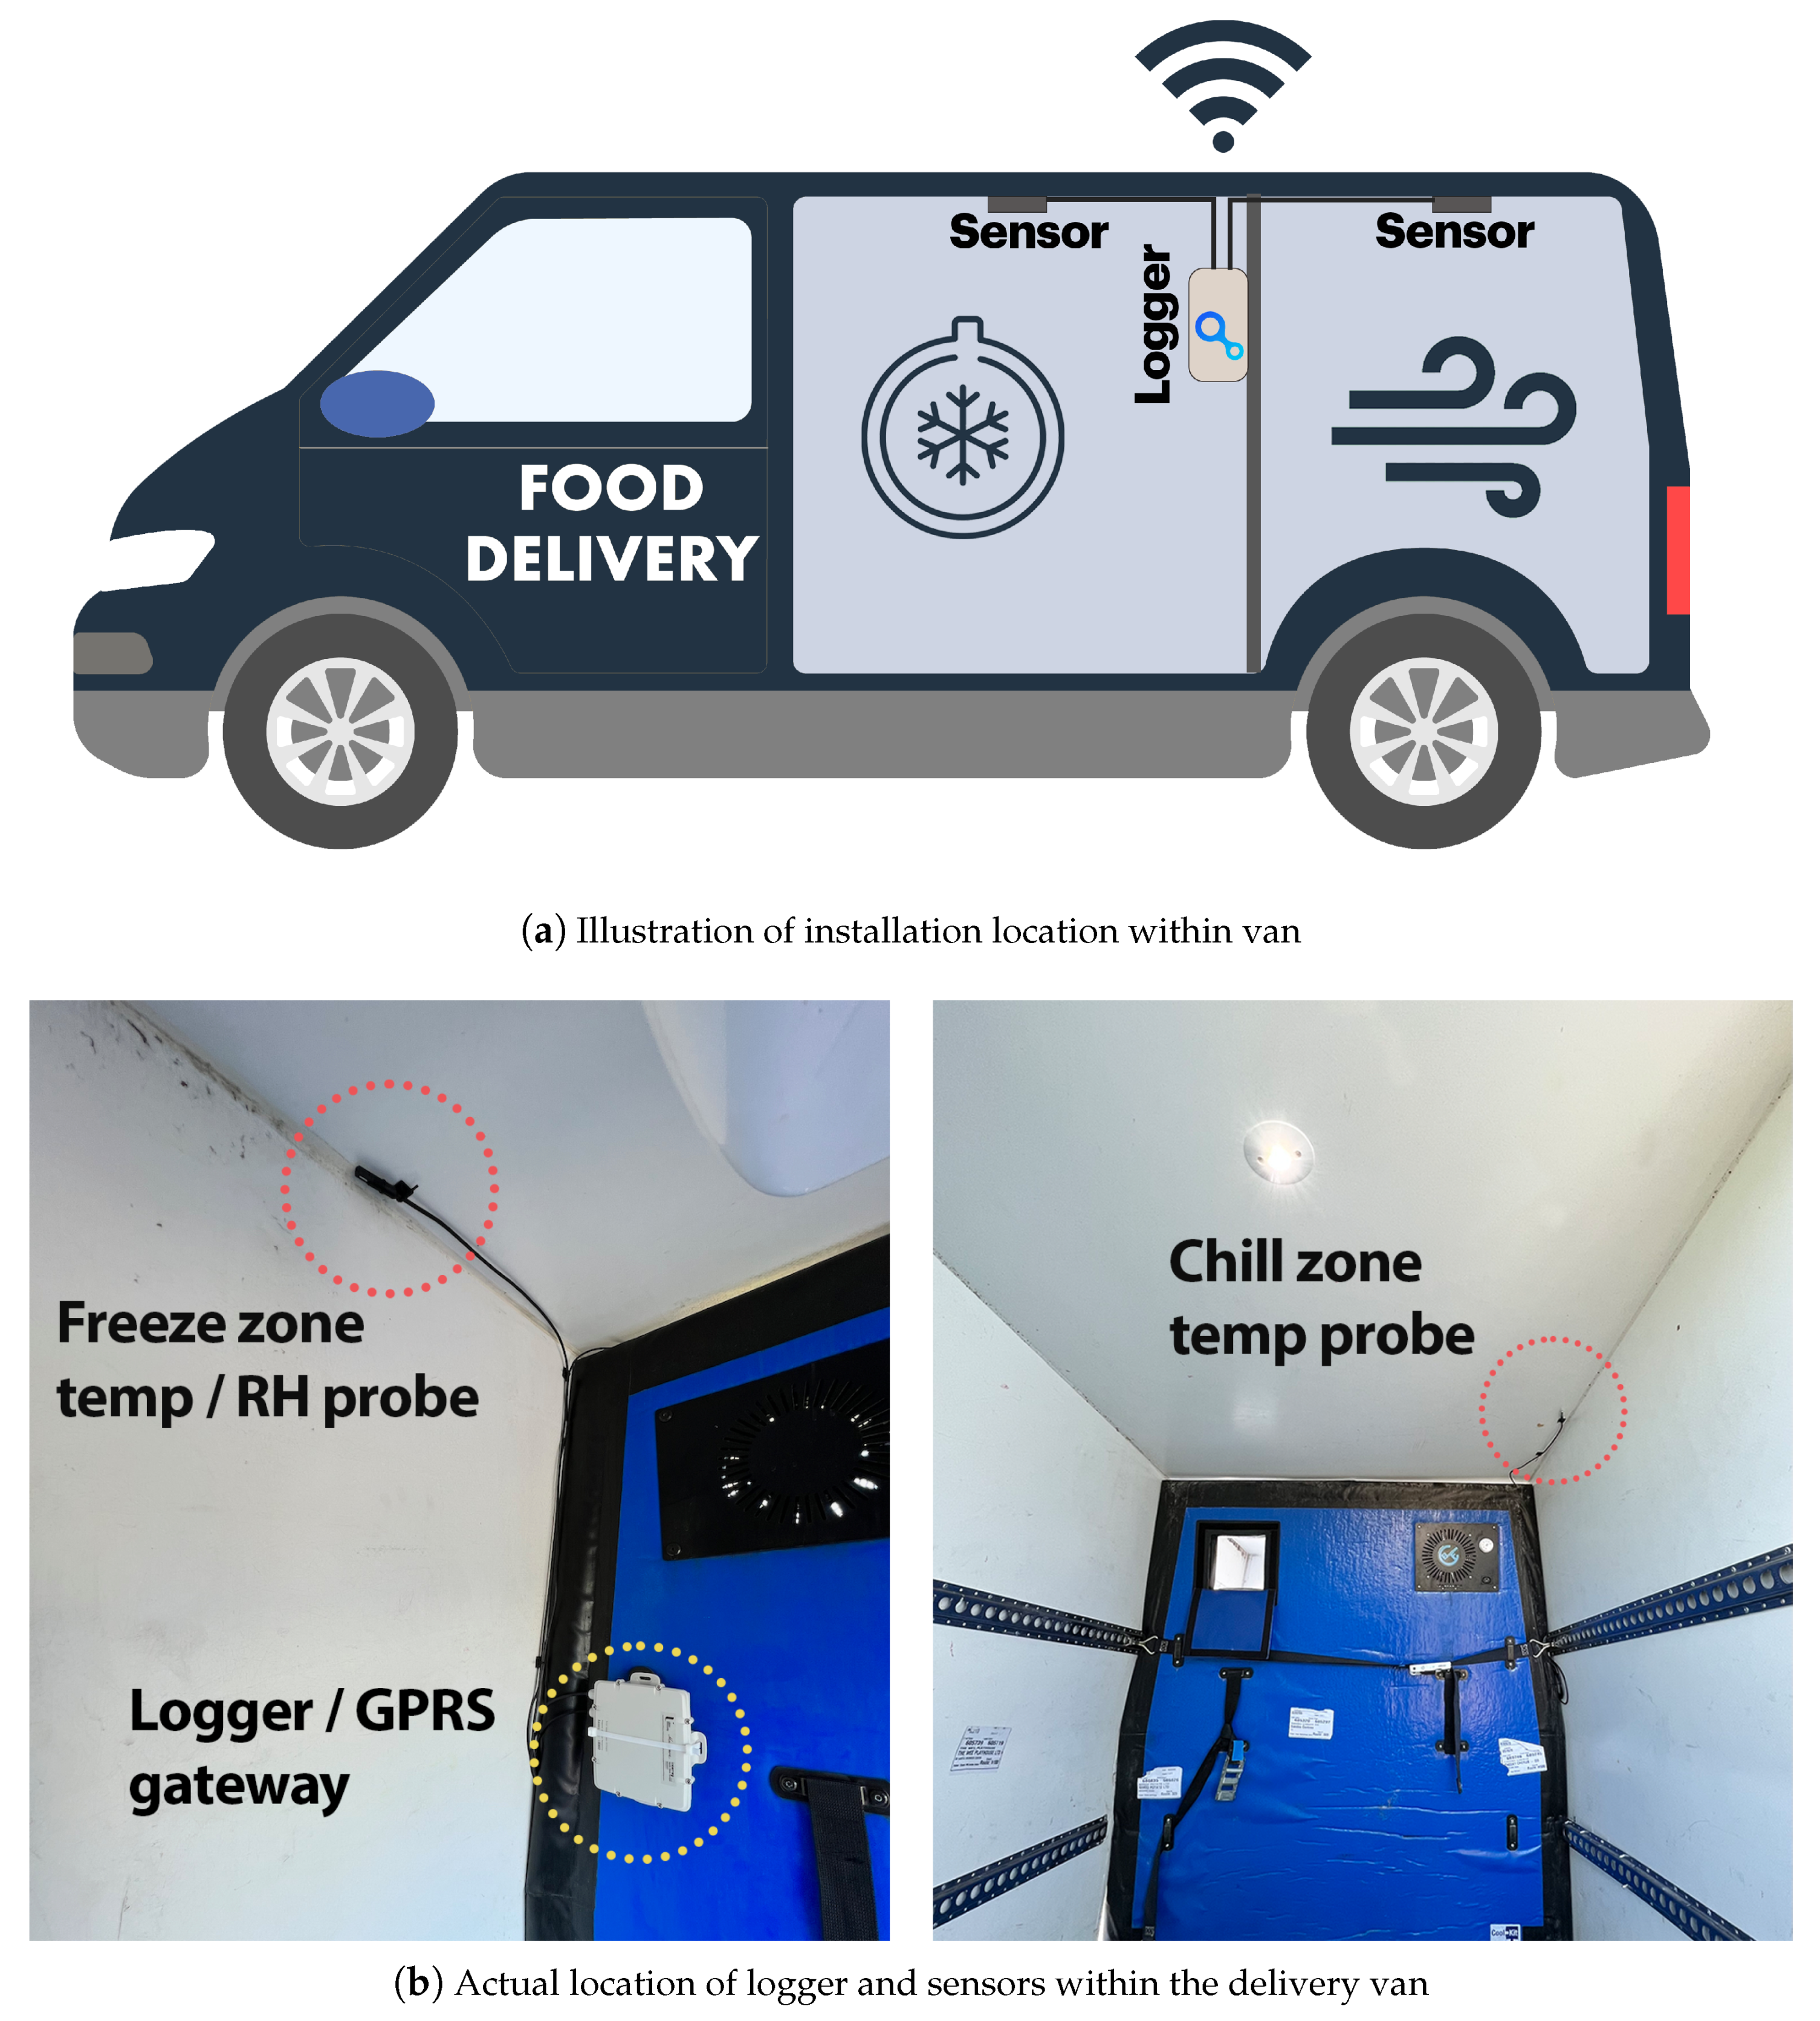
Figure 2a illustrates the proposed layout of the dual-zone monitoring system. The sensors would be placed along the roof of the van in the two different refrigerated compartments separated by an insulated wall which contains a fan to push cool air through from the refrigeration unit based in the freezer compartment at the front of the van to the chill compartment in the rear of the van.
Figure 2b shows the actual installation location. The logger was positioned on the insulted wall in such a way to ensure it would not interfere with the loading procedures of pallets followed by Musgrave.
For the field testing of the IoT system, it was decided to run the sensor on battery power to reduce the invasiveness of the installation. Each of the loggers were deployed with 4 × C cell long-life power alkaline batteries, each with a capacity of 7800 mAh.
In order to ensure minimal battery consumption was achieved, each logger deployed with the grocery distributor had the trip detection algorithm outlined in
Section 3.2.3 enabled, which puts the logger in a low-energy sleep state when it is not in motion. The parameters chosen for the logger was a heartbeat signal every 12 h while out of a trip, and while in a trip, recordings were made and uploaded every 5 min. A GPS timeout of 60 s was chosen in order to reduce unnecessary battery consumption.
4. Results
The IoT temperature anomaly detection system was deployed in three of the grocery distributor’s last-mile delivery vehicles in Belfast, northern Ireland, in April 2022. The analysis presented in this section was completed after 6 months of recording data. By this stage, the three vans had cumulatively recorded 3154 journeys, on average 10.2 journeys per day.
4.1. Dashboard for Real-Time Vehicle Monitoring
Each member of the logistics management team at the grocery distributor was given user credentials to access the monitoring dashboard. The dashboard allows its users to view and gain insights on the real-time data associated with all of the users assets in one centralized location. Once logged in, users are presented with the dashboard as shown in
Figure 3. Users of the dashboard can only view the dashboard and respective sensors that they have been given access rights to, meaning the system is scalable to multiple companies. Each van being monitored is easily identified for the user on the dashboard using both the van model and vehicle registration. The interface shows the real-time readings of the environmental parameters (temperature and humidity), battery voltage and trip detection. A 1 reported by trip tells the user the vehicle is currently in motion, while a 0 tells the user the vehicle is stopped. In the corner of each element, the time of last update is visible.
The interface shows the temperature in all zones where sensors have been installed as well as the thresholds for the gauges (red-orange-green). The temperature thresholds were set according to the company’s needs. The gauges provide a quick, easy to decipher visualisation into the transportation condition of the food. Green indicates that the food is being transported correctly, yellow indicates that the temperature is above the ideal temperature range but still does not compromise food quality and red indicates alarming status, and an automatic notification (
Figure 4) is sent to personnel for timely necessary action. Further details on the notification system are discussed in the next section.
4.2. Anomaly Alerting
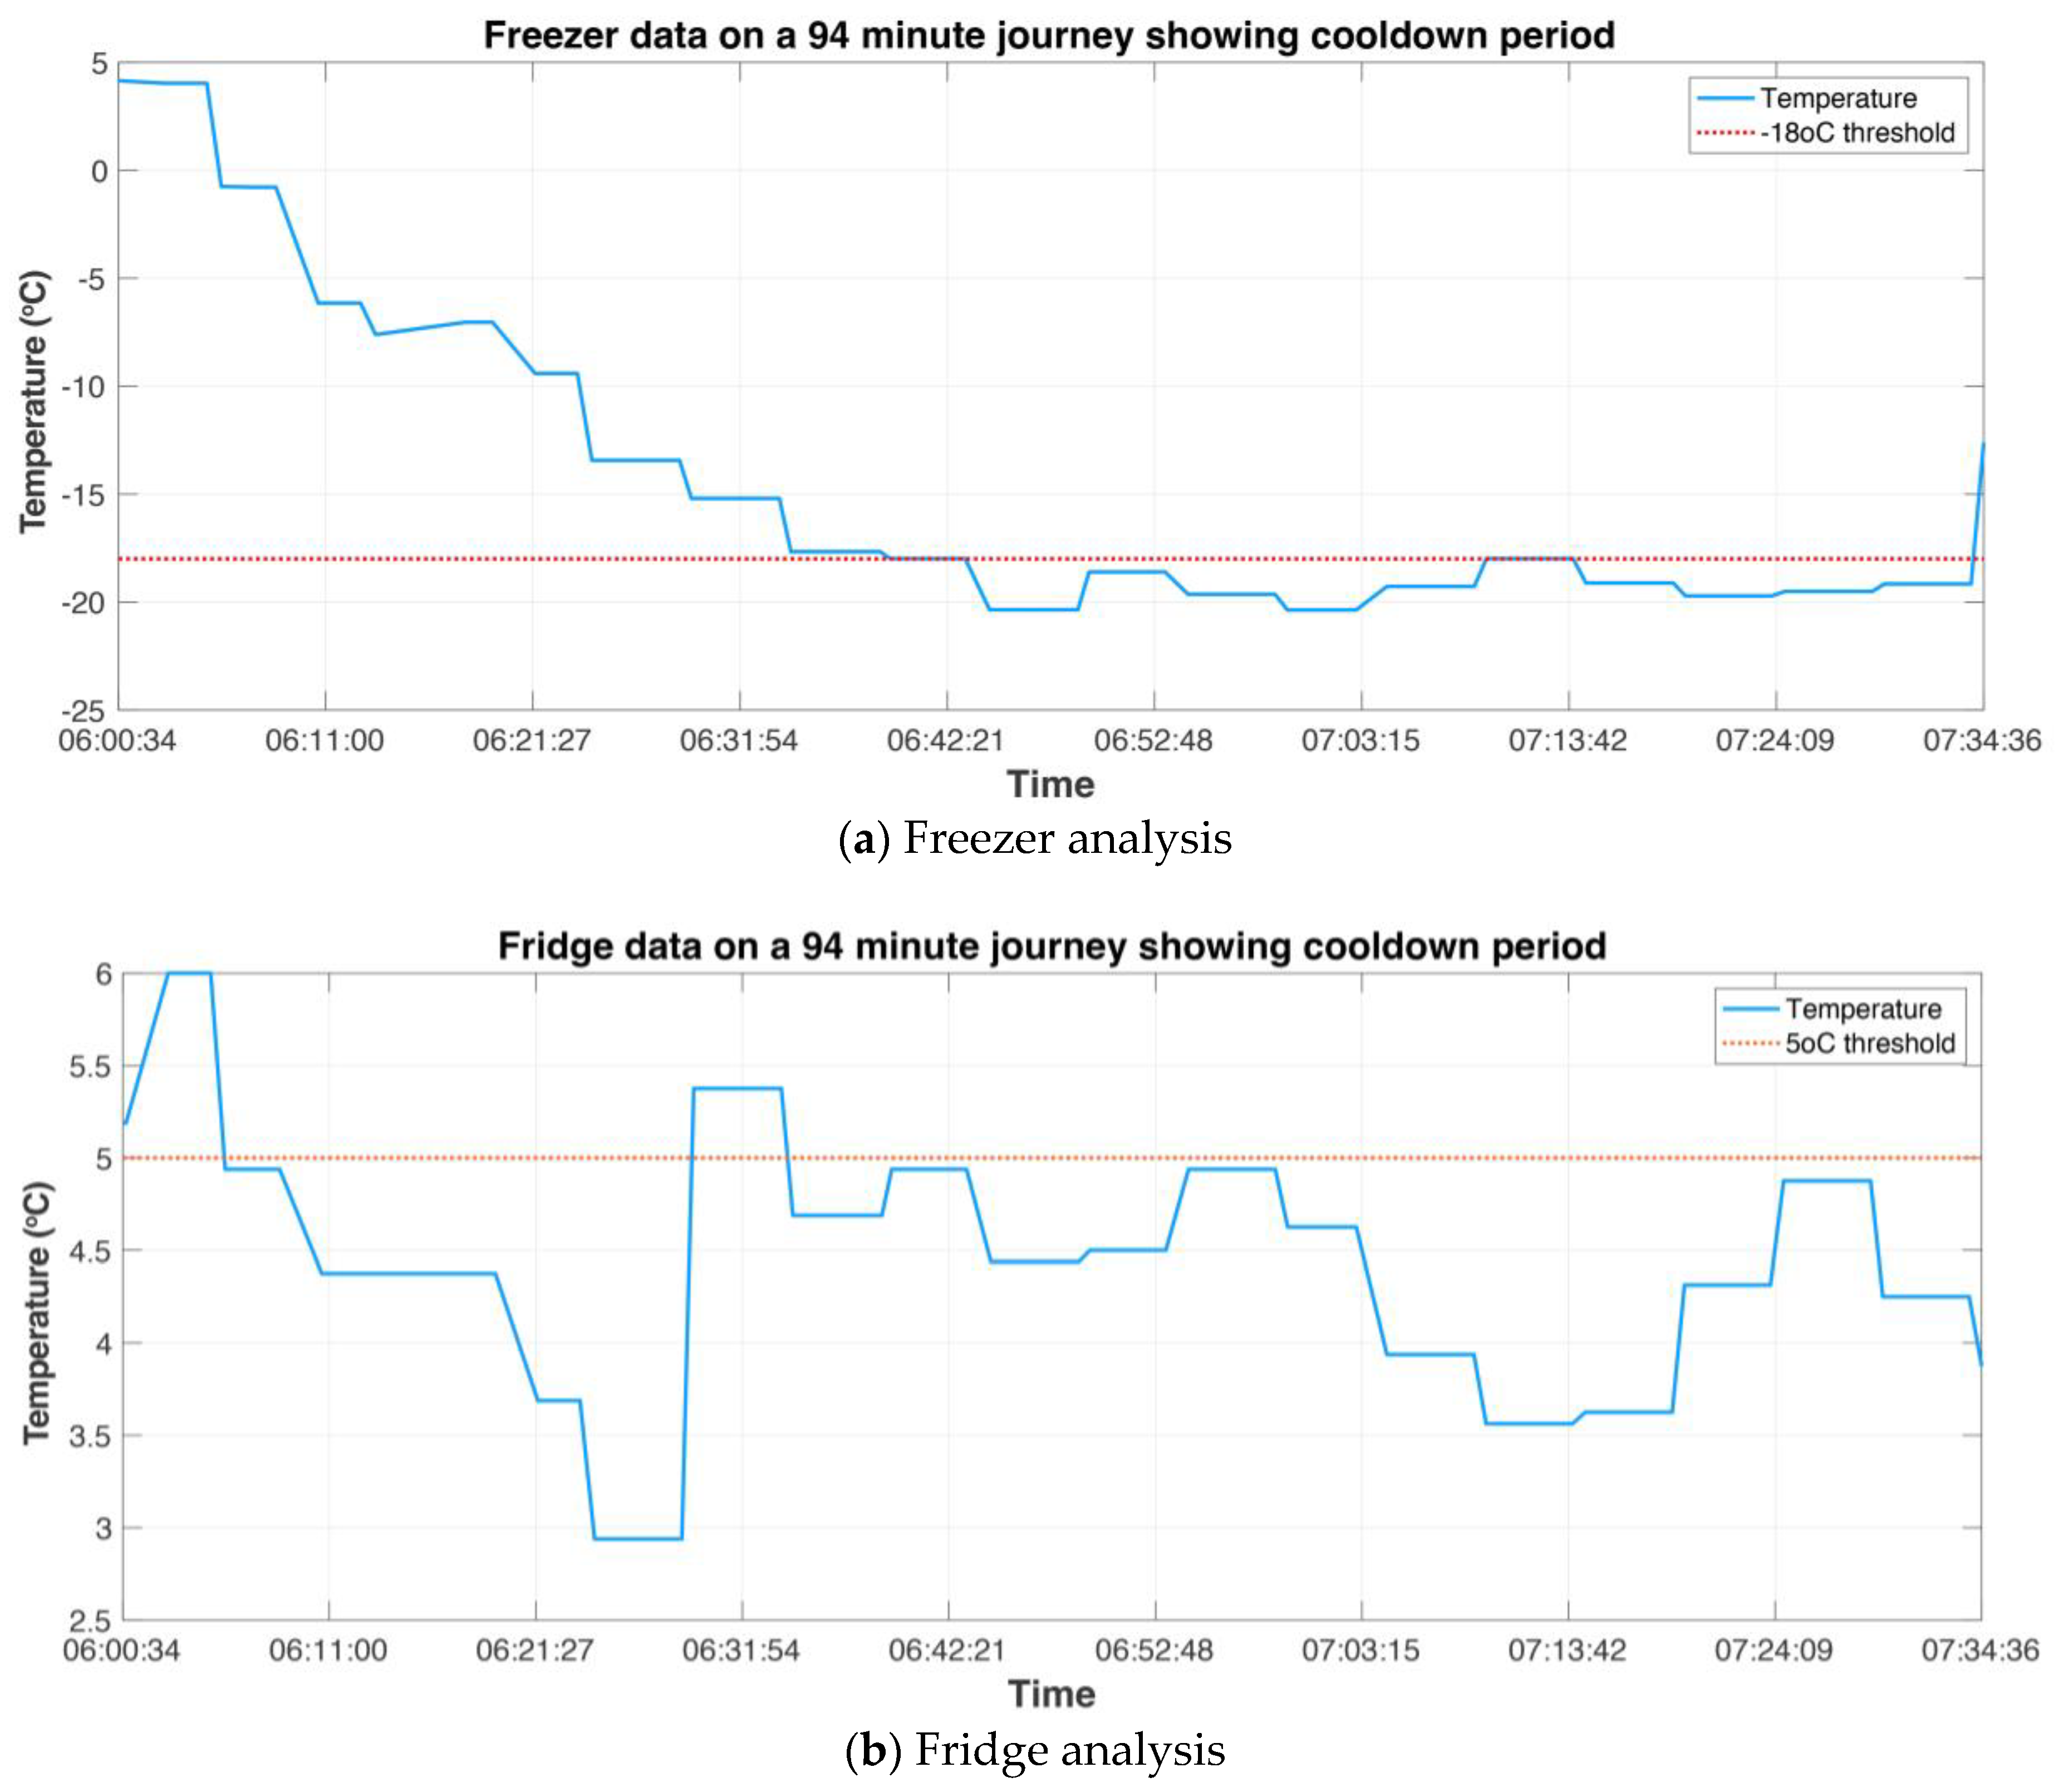
After 179 days of continuous operation, the three IoT loggers had cumulatively recorded 49,839 datapoints monitoring the chill and freeze zone conditions of the last mile delivery vans operated by the grocery distributor. The distributor operated a multi-drop delivery from the vans, and the average duration of each delivery was 16.2 min. To effectively deploy an alerting system that notified the company of refrigeration anomalies in the delivery vehicles, it was necessary to evaluate the cool-down period of the refrigerators, i.e., the amount of time that it took for the vans to reach the desired temperature. The reason for this was to avoid alerting during periods where no anomaly or malfunctioning was occurring, and the refrigeration units were merely cooling from ambient temperature to chill/freezing temperatures. Using the data recorded by the grocery distributor during deliveries, a preliminary analysis was carried out to estimate the cool-down period length of the delivery vans. The desired temperatures the vans were to operate at were 5
C in the fridge compartment and −18
C in the freezer compartment. Analysis from the recorded data showed that it took approximately 35 min for the vans to appropriately cool down (
Figure 5); thus, alerts should be configured in such a way that they were only sent after this initial period had passed. To do so, an alerting algorithm was implemented that only triggered the alerting system after 35 min.
To avoid false alerts being sent while the vehicle was stationary, the trip variable reported by the trip detection algorithm presented by Algorithm 1 in
Section 3.2.3 was used for the alerting algorithm. Given the trip status and the desired temperature thresholds, the alerting algorithm was designed as follows.
Each time the logger produces a recording, the temperature readings and trip information are passed to the alerting algorithm. The cool-down period and temperature thresholds of the fridge and freezer are configurable by the user. In this case, 35 min has been chosen as the cool-down period, −18 C has been chosen for the freezer threshold, and 5 C has been chosen for the fridge threshold. Given the user-specified cool-down period and frequency of sensor recordings, the total number of repeated true trip parameter recordings required is calculated. The algorithm then checks to see if the vehicle has been in motion for the specified number of recurring recordings. Only if the vehicle has been in motion constantly during the recurring recording period does the algorithm progress to the next stage: threshold checking. If at any point the vehicle stops moving and the trip parameter becomes false, the counter is reset and a further recurring recording period (in this case 35 min) will have to elapse before the algorithm progresses to threshold checking.
At the threshold checking stage, anomalies in the sensor equipment are accounted for by ensuring two repeat values abusing the user-specified temperature threshold are recorded. If the temperature threshold is broached twice in a row, an alert is sent. The algorithm behaves the same way for both the chill and freeze temperatures. Note that the cool-down period can be specified for each of the zones, meaning the user can define a longer cool-down period before alerting begins for the freezer and a shorter cool-down period before the alerting algorithm is triggered for the fridge zone. Examining the data presented in
Figure 5, it is probable that the grocery distributor would want to avail of this functionality. Notice that while the freezer takes 35 min to reach the appropriate chilled temperature, the fridge has reached the desired temperature within 5 min. Given that perishment occurs more quickly transporting refrigerated goods rather than frozen goods, more timely alerts for this area of the van are desirable. In this example, the freezer cool-down period could be set as 35 min and the fridge cool-down period could be set at 5 min. The pseudocode for the alerting system is presented in Algorithm 2.
| Algorithm 2: Anomaly alerting |
 |
Alerts can be sent via email or SMS to the end-user of the system.
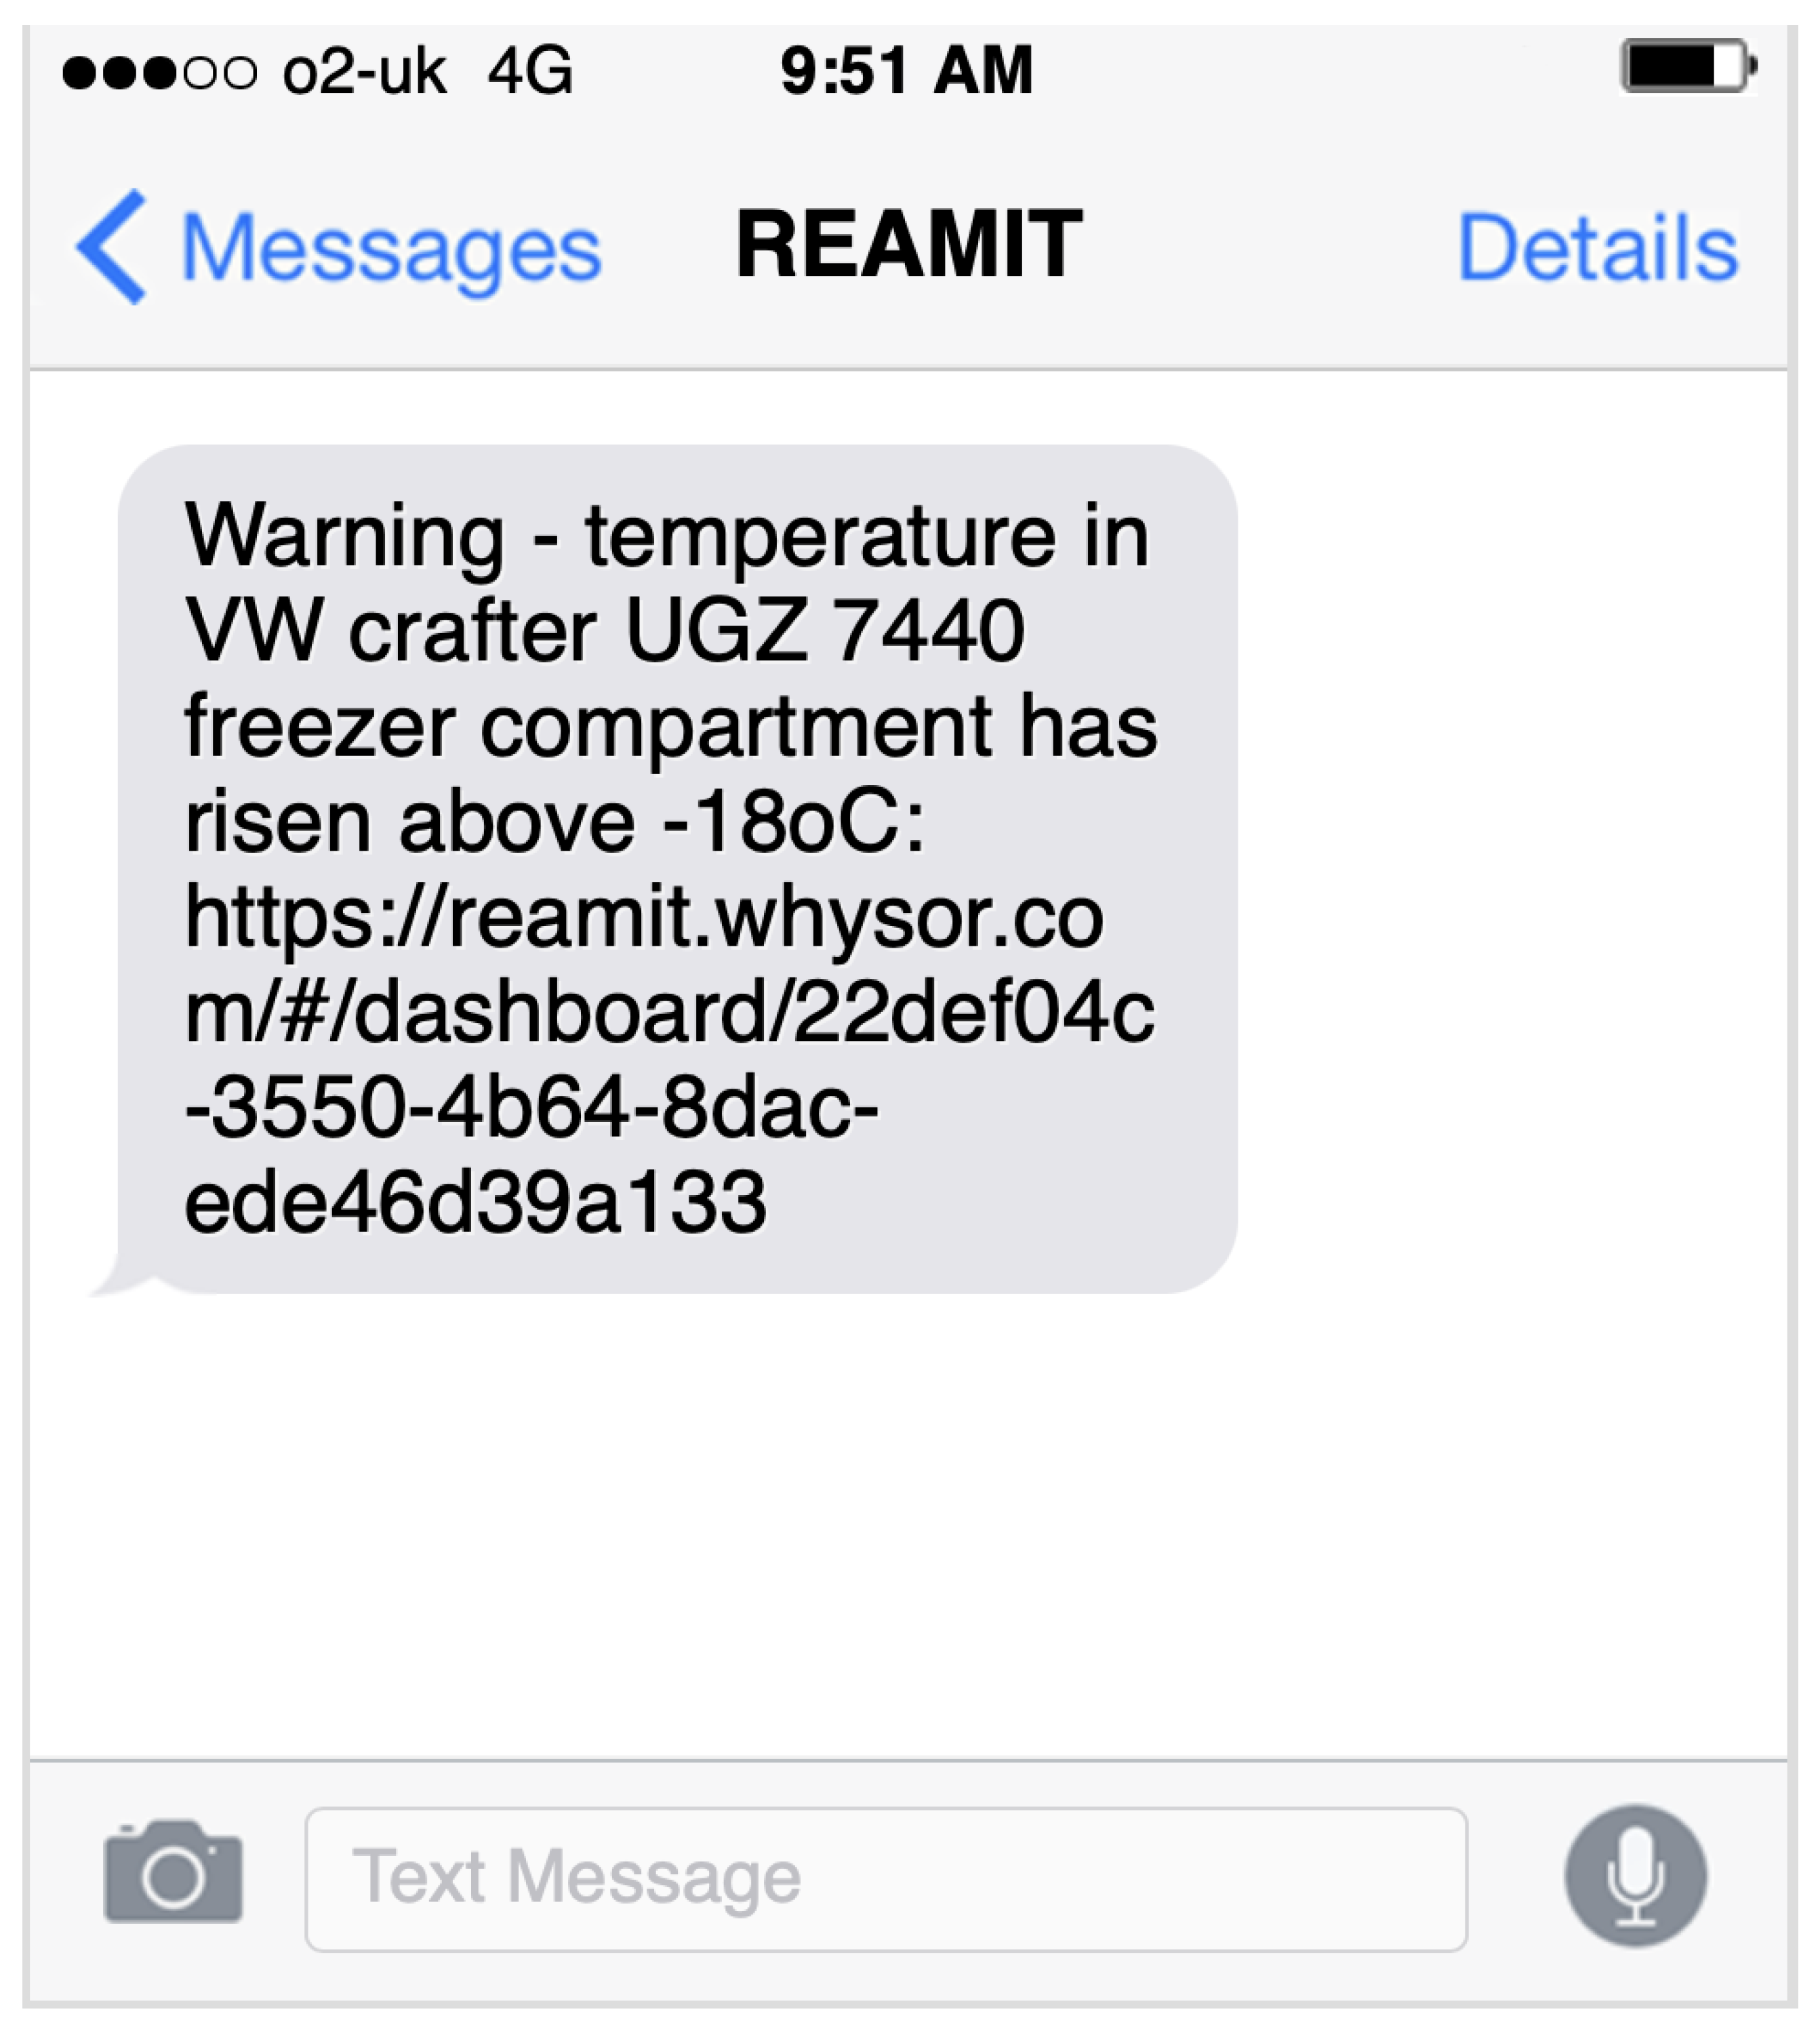
Figure 4 shows an example of the automatic notification which is sent to personnel for timely necessary action if temperature abuse is noted. A descriptive message detailing the van model, registration, if the error has been recorded in the freeze or chill compartment, and the user-specified temperature threshold that has been abused is sent to the personnel. Additionally, the message embeds a link to the organisation-specific dashboard so that the user can quickly access the live and historical data from their mobile phone and identify if a problem has really occurred.
It is worth noting that alerts are not continually sent if the vehicle remains in motion and the threshold continues to be abused. Once one alert is sent, a timeout period of min is activated before a follow-up alert is sent. This feature is to prevent end-users’ mobile phones from being spammed with text messages.
4.3. Battery Life Analysis
The logger’s were deployed with 4 × C cell
alkaline long life batteries, each with a capacity of 7800 mAh and manufactured by Varta [
82]. After 179 days of continuous operation, one of the loggers installed in a delivery van ran out of battery. In its lifetime, it recorded 29,342 datapoints representing 1812 journeys: approximately 10 journeys per day.
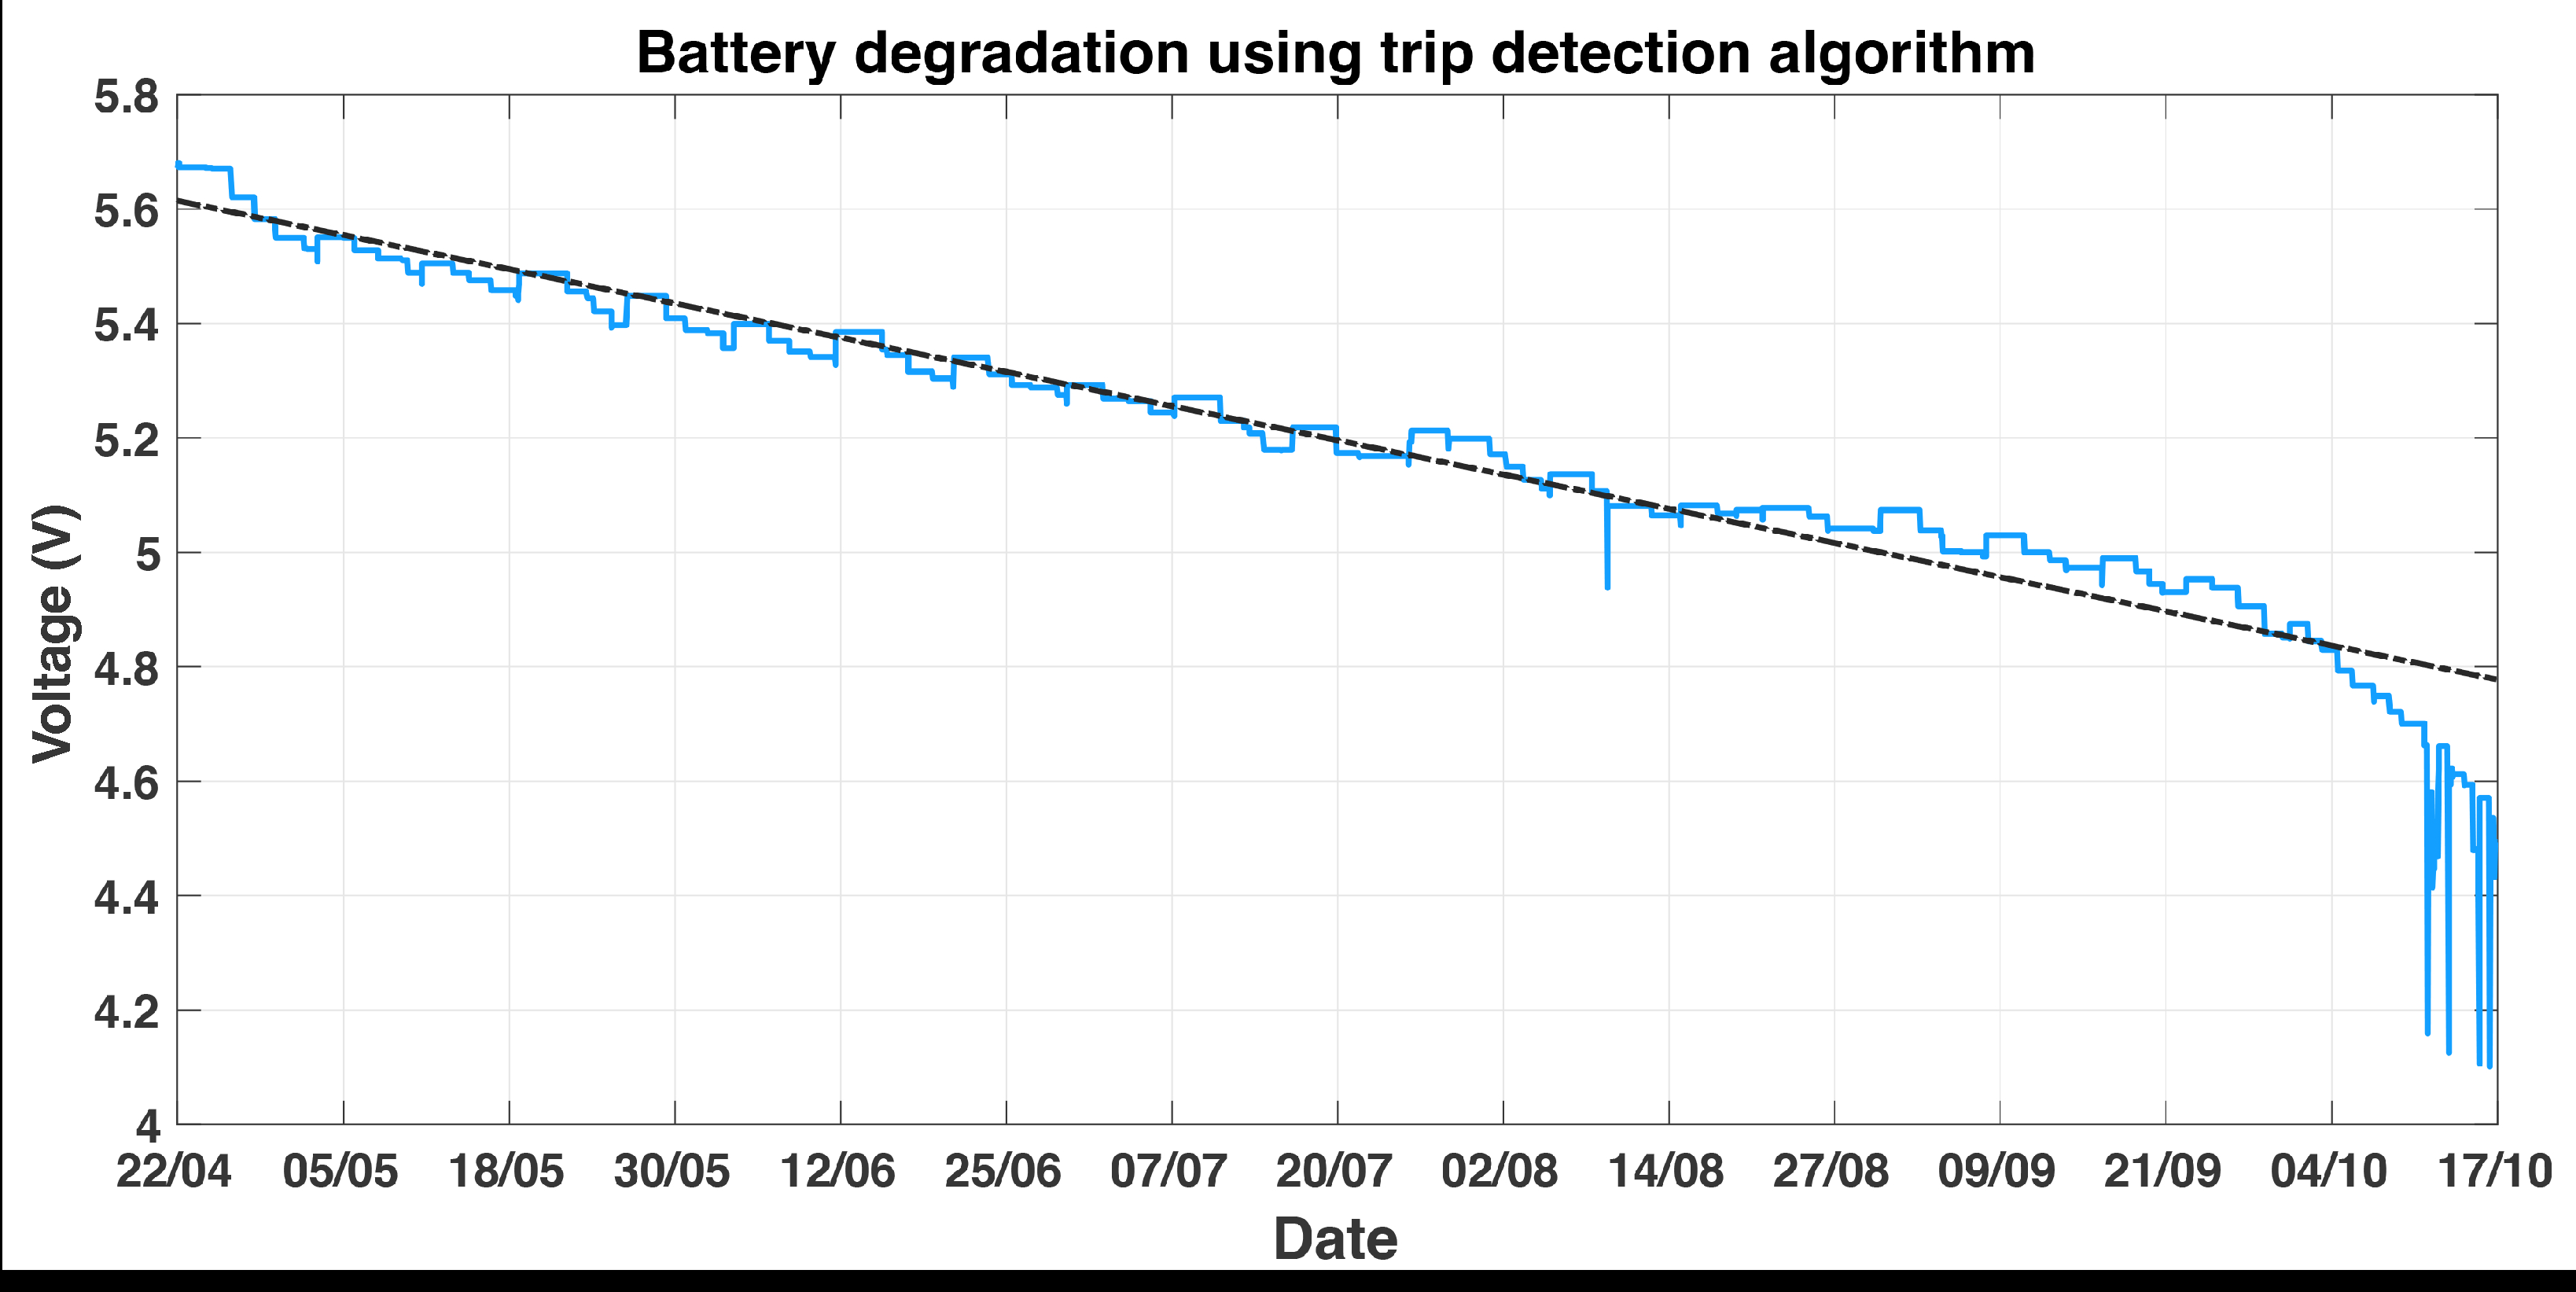
Figure 6 shows the degradation of the batteries over the lifetime of their discharge in blue. A degree one polynomial regression (i.e., a linear regression) is applied and is shown as a dashed black line laid on top to demonstrate the linear decay throughout the lifetime of the battery. Notice that near the end of the battery’s useful life, the battery starts to degrade much more quickly, as to be expected in alkaline performance [
83].
The battery’s starting voltage was
V. The last recorded voltage by the logger before the batteries no longer had the capacity to power the device was
V. Thus, during its useful life, the logger used
V. Given that the number of recordings made was 29,342, the average voltage consumption per recording is calculated using Equation (
1).
In this case, the resulting recording voltage per reading was equal to 4.02 × 10 V.
To demonstrate the benefit of the trip detection algorithm on battery conservation, the battery performance of the logger with trip detection enabled is compared to that of a logger without trip detection enabled. Without trip detection enabled, the logger uploads data every 5 min regardless of whether the vehicle is in motion or not. This results in 288 recordings made every 24 h, every day, while there is enough battery capacity to power the device. Using the average voltage consumption per recording, an approximation of how long the logger would have lasted without trip detection enabled can be made. Assuming that the logger uses the same power consumption whether trip detection is enabled or disabled, a battery life estimate can be provided using Equation (
2).
resulting in an estimated days of recording of 101.8 days.
To check the accuracy of this estimate, bench testing was performed on one of the devices. The logger was prepared to the same specification as the loggers deployed with the grocery distributor, and it was running the same firmware revision. The only difference between the two setups was that trip detection was disabled on the logger being used for battery performance testing. With trip detection disabled, the logger made and uploaded recordings every 5 min, regardless of motion. Given that the decay of the alkaline battery is linear (except at the end of its useful life), the testing can be applied at any battery voltage and be used as an insight into the life expectancy of the logger. In this case, the bench test began with a starting voltage V = 5.335. The bench testing experiment was performed for a period of 28 days. At the end of the testing, the final voltage was V = 5.039. In total, therefore, the logger used V over 28 days. Over this period, it had made 8104 recordings, presenting an average voltage spend of 3.65 × 10 V per recording.
For the updated estimate based on this usage, the period required for the logger with trip detection enabled to use V was checked. Upon analysing the data, it was found that the battery of the logger deployed with the food company took 66 days to use the same voltage. Over this period, the logger had made 12081 recordings, resulting in an average recording voltage spend of 2.45 × 10 V per recording.
The difference in these average recording voltages is by a factor of 1.4907, meaning the device with trip detection disabled is using power 1.5 times more quickly than the device which has it enabled. This is most likely because the device does not go to sleep, meaning components stay powered on during the 5-min intervals when recordings are not taking place.
The original estimate of battery life with trip detection disabled can now be updated using the results from this analysis. Given that power consumption during the linear decay phase is ≈1.5 times greater than that of trip detection logger, the new estimate for the total number of recordings during the batteries’ total useful life is 29,342/1.4907 = 19,683 data points. At 288 recordings per day, the life expectancy of the logger without trip detection enabled is estimated at 19,683/288 = 68.35 days.
This is a 61.8% decrease in performance from the logger with trip detection enabled, which recorded data for 179 days in total before battery exhaustion.
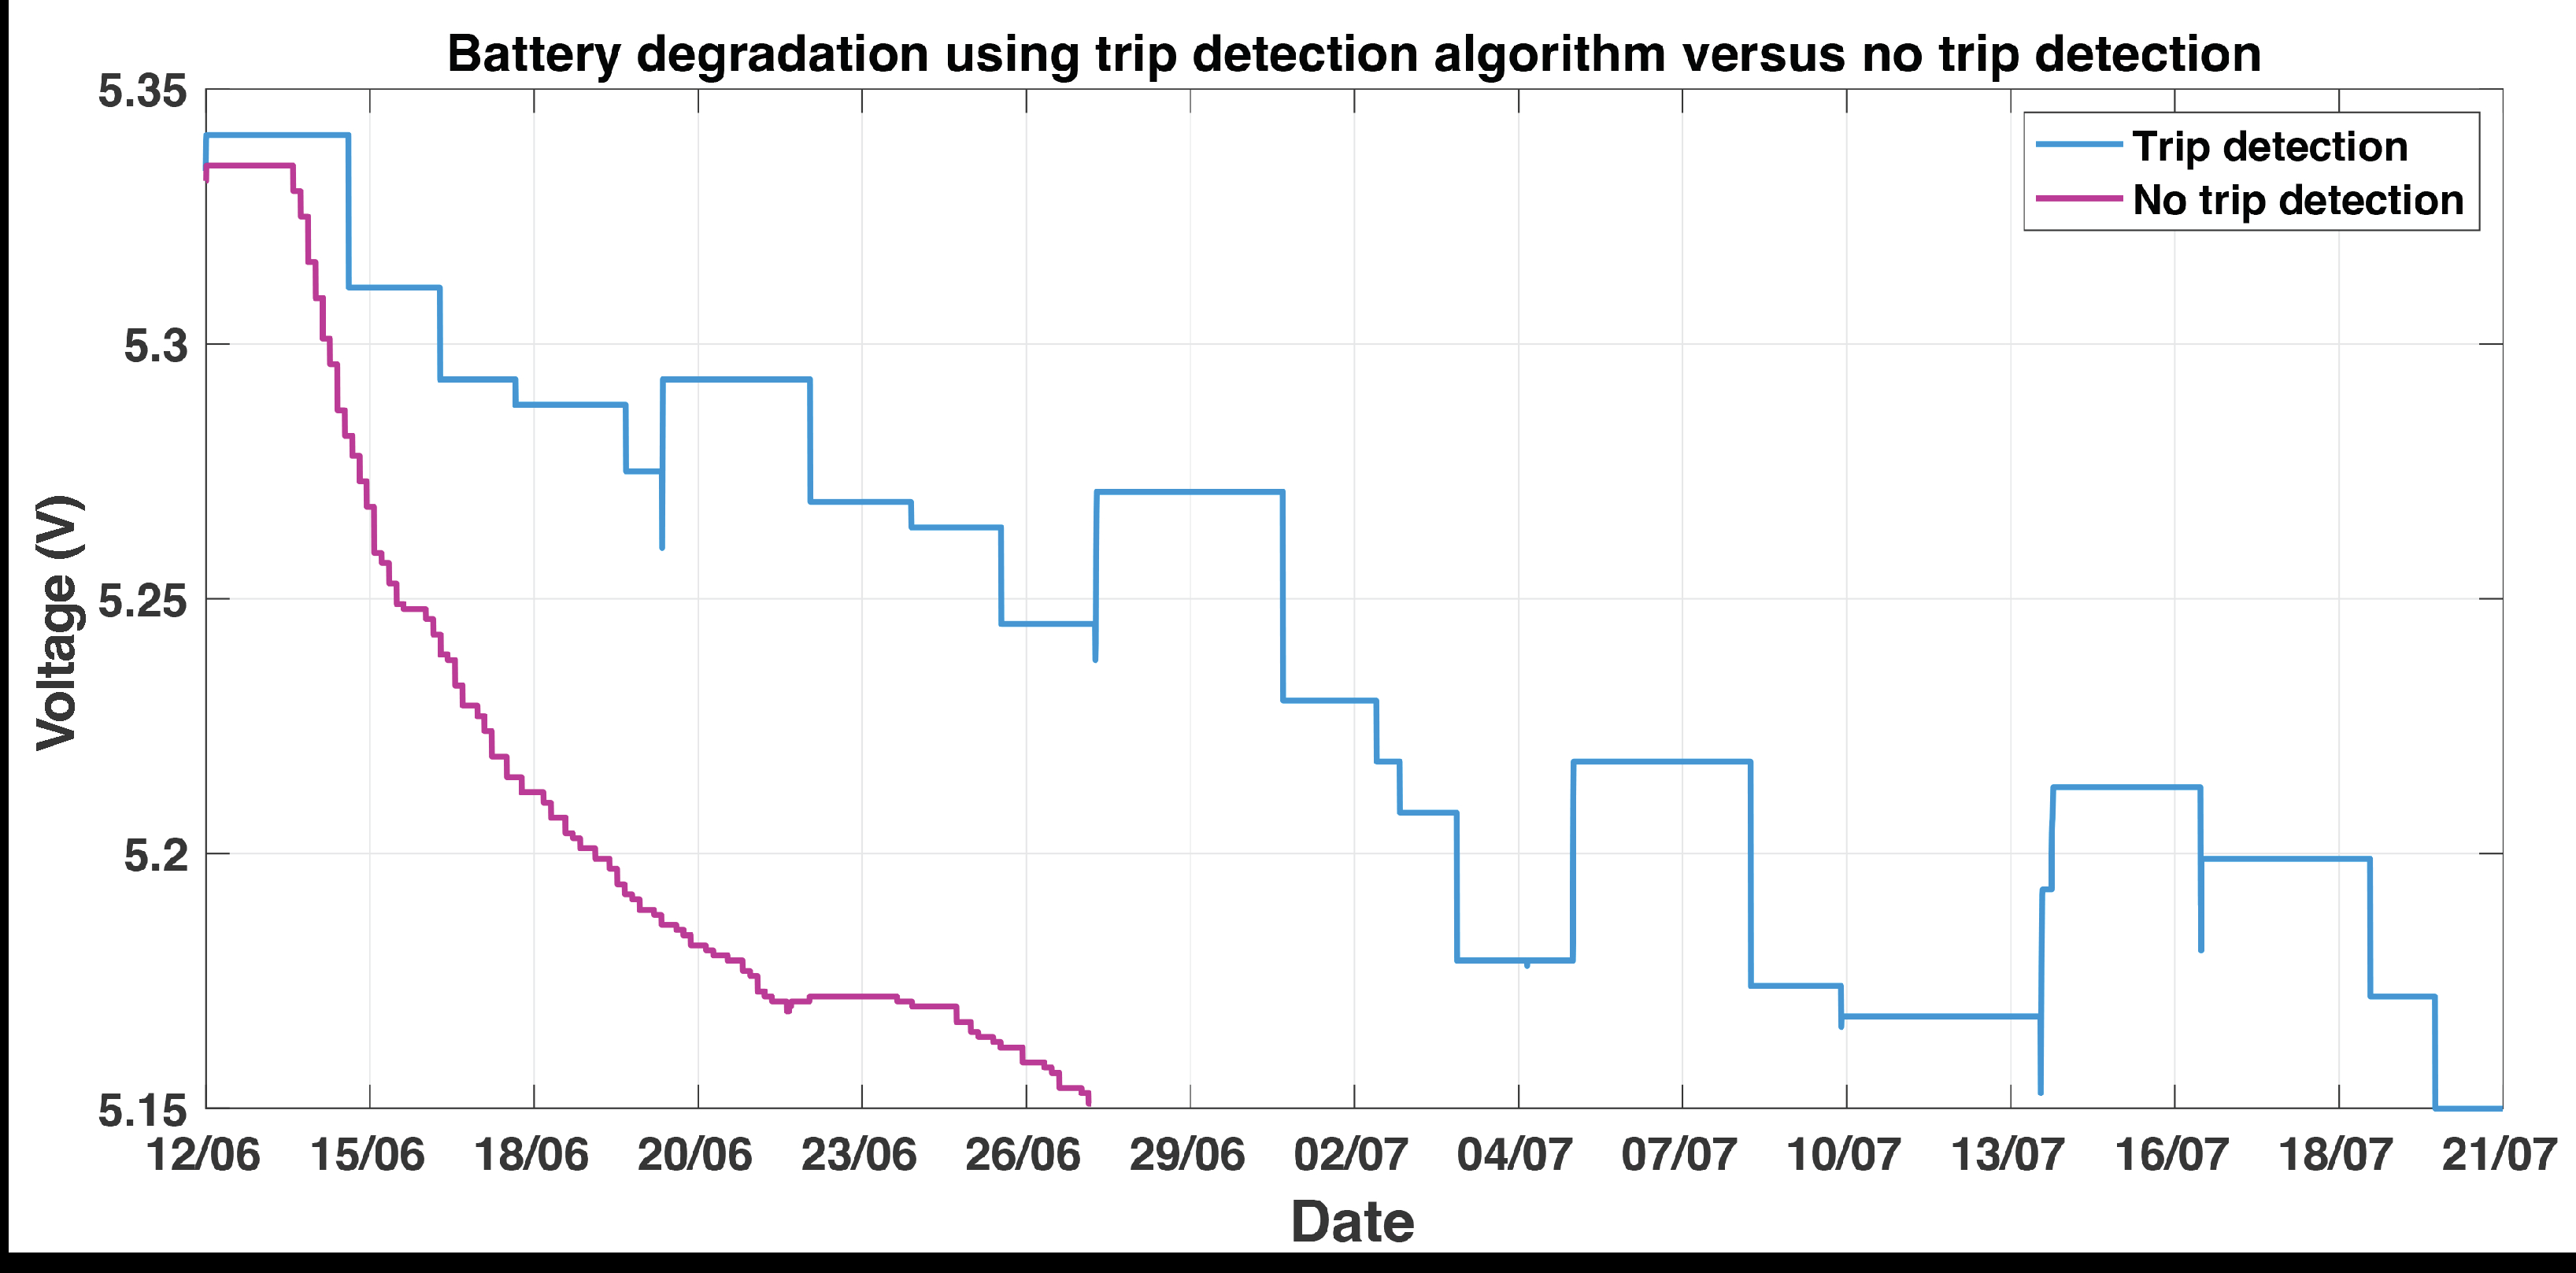
Figure 7 visualises the difference in battery degradation between the logger which has trip detection enabled (blue plot) versus the logger which has it disabled (purple plot). From this, the ≈2.5 times performance increase the algorithm has on battery life can be observed.
It is worth noting that the logger deployed in the refrigerated van with trip detection enabled is additionally exposed to lower temperature levels which can negatively influence the battery voltage and capacity. This is due to the slowdown of electrochemical reactions and decrease in the ionic conductivity in certain battery components [
83]. Therefore, the results of the trip detection algorithm may be exacerbated further if battery analysis testing was conducted on a logger deployed in the refrigerated van with trip detection disabled. Further research is required to see if this is the case.
5. Discussion
The development of real-time IoT monitoring systems for perishable food transportation provides a vast number of managerial opportunities for supply chain personnel. With the availability of real-time data giving insights into the transportation conditions of perishable stock, logistics managers of agri-food businesses can perform pro-active data-driven business decisions if anomalies occur. However, to date, most systems rely on either the manual human monitoring of data or device-specific platforms (Android [
70], Windows operating system [
55] or RFID reader [
56]) to detect anomalies.
The real-time anomaly detection system presented in this work mitigates both of these restrictions. The system has been shown to provide intelligent anomaly alerting based on vehicle motion and temperature threshold abuse. In addition to the trip-based alerting, to aid in minimising false warnings, the developed system accounts for detection anomalies by requiring two readings in a row to broach the threshold before sending the alert. Compared to other studies in the field, this paper has shown a fully implemented IoT system with a real-time monitoring application accessible on any device and a platform agnostic warning system if anomalies are detected during cold chain transportation. Companies are typically concerned about whether IoT can work well with their business process, strategic management, and supply chain flow, as well as preceding information systems. However, the proposed system overcomes these compatibility requirements that can act as a blocker toward technology implementation by adopting a framework available for mobile and computer devices. On the other hand, the platform agnostic warning system proposed can also handle the data complexity challenge. IoT monitoring technologies involves a vast data processing throughout its usage that requires not only skilled and knowledgeable users but also facilitating conditions in terms of data management such as tools and networks. In this study, a user-friendly dashboard is used, as shown in
Figure 3. In addition, while this paper validates the IoT RTAD system with a food wholesaler, the platform has been designed in an agnostic manner allowing it to be expanded to various logistics applications.
The anomaly detection system provides real-time information to logistics personnel, allowing them to redirect produce, if required, to a closer depot or a different business customer, resulting in the reduced spoilage or wastage of food stuffs. There are additional managerial benefits of implementing this IoT monitoring technology which should not be overlooked. As well as the economic and environmental impact that reducing food spoilage has on a business, IoT monitoring technologies increase the cold chain security and integrity. This leads to better client trust and relationships as there is a single source of truth allowing any stakeholder in the supply chain to refer back to the conditions that shipments have been exposed to. In addition, researchers and practitioners agree that IoT-enabled supply chain gains more benefits, including real-time information sharing, cost reduction, efficiency, transparency, traceability, and sustainability, than the one lagging disruptive technology.
However, the literature suggests some factors affecting IoT adoption in food supply chain management. Potential IoT adopters are still concerned by the hardware and infrastructure needed to deploy IoT technology in their supply chain management [
84]. IoT adoption must be followed by providing tools, sensors, gateways, mobile devices, protocols, applications, and connectivity to establish an environment that facilitates information sharing among all stakeholders, and some companies cannot afford to build and maintain such an IoT environment. The cost of adopting IoT remains a top challenge for the industry, making it another vital factor to be considered. A company generally is more willing to adopt IoT technology when the device cost and electricity bill decrease, some studies have conveyed. Therefore, the IoT adoption should consider whether the spent cost is worth the benefit.
As previously mentioned, cost is a limiting factor in the adoption of IoT-enabled systems, especially for small and medium-sized businesses. For this reason, in this study, the proposed technology uses cost-effective components to ensure the rollout of monitoring technology is cost-feasible for the business. Additionally, the system operates on pre-existing telecommunication infrastructure mitigating potential network layer overheads presented by other systems.
Many systems in the literature use fixed power supplies for their gateway unit [
68,
71]. Although this suits the use case of a refrigerated van or lorry such as that of the validation case company, there are applications where a power supply for the IoT system is either not present or inaccessible. For example, in the case of temperature-sensitive donor milk delivery [
85], the transportation method is a motorcycle where a power supply to the temperature-sensing unit is unavailable. While some portable systems have previously used mobile phones as a gateway device for data capture and upload [
61,
64,
69], constant mobile device charging and the pairing of sensors with driver changes increases the likelihood of missed data capture. The system presented in this paper was therefore designed with ease of use and energy efficiency in mind, operating without any intervention from the driver. Results from the battery testing show that by putting the device to sleep while not in use, a minimal device maintenance schedule is also achieved, thus keeping the costs of technology upkeep for the business to a minimum.
The sensitivity of the trip detection algorithm is configurable by adjusting the timeout between GPS readings. For Musgrave, NI, the detection window was every 5 min, meaning this was the time between GPS location checks to detect if the van was in motion. However, if the system was deployed in a traffic dense city, the users of the system could increase this parameter accordingly. Extending the window between trip checking could help ensure that the trip status remains valid in the case of a traffic jam. The algorithm, however, does not consider breakdowns in the van. Due to the way alerting is implemented, if the van completely broke down, the logistics staff would not receive an alert about potential temperature abuse as the algorithm relies on vehicle motion being true. Future work will seek to add geofencing functionality to the alerting algorithm. Through the establishment of the base location of the vans, the alerting system could be expanded to offer a breakdown monitoring mode if, for example, the van had been stationary for one hour and it was not located at the known home location of the van. Rather than not uploading data due to a lack of vehicle motion, the breakdown monitoring mode could continue to upload data in 5-min intervals, ensuring the integrity of the products.
Another limitation of the work presented in this paper is that different sensor placement locations were not explored during the installation and testing of the IoT RTAD system. The location of sensor placement chosen in this work was upon consultation with refrigeration logistics specialists at Musgrave, NI, who had prior knowledge installing cold chain transportation temperature monitoring equipment. However, previous studies have indicated that the temperature inside the refrigerated equipment is heterogeneous [
11]. For example, some suggest that the most accurate ambient temperature insights are provided by monitoring the ‘air on’ of the refrigeration unit, which is where the ambient air is drawn into the refrigeration unit after circulating the entire chill area. This contrasts the chosen installation location of the sensors in this work, which were placed along the roof, approximately in the middle of each zone. Furthermore, the relationship between the core product temperature and the ambient temperature recorded by the monitoring system in this case is unknown. Therefore, additional work needs to be undertaken, trying different sensor locations and monitoring how the ambient temperature recorded changes.
The warning system currently deployed, which offers alerts via SMS or email, can also be a limitation. It is sometimes the case that logistics staff working in warehouses do not have GSM cell coverage, rendering alerts sent on the SMS system undeliverable. While the email system provides an alternative alerting mechanism to ensure that while out of cell coverage but within WiFi range the end-user still receives alerts, many end-users do not have push notifications enabled for email due to the quantity they receive on a daily basis. Future work will focus on expanding the alerting system to a smartphone application such as that of [
70] so that push notifications can be delivered while in the range of WiFi. Additionally, technologies such as the real-time anomaly detection system presented in this paper could be deployed at each stage of the cold chain to allow for the uninterrupted monitoring of perishable goods. This would result in anomalies being detected not only during transportation but also during storage, at the retailer, etc. Each of these efforts could further reduce potential food wastage in agri-food businesses.
6. Conclusions
This work demonstrated the application of an energy-efficient battery-powered IoT-based alerting solution for the temperature anomaly detection of refrigerated food products during transport. The system was further validated in a real-world scenario by utilising the delivery vehicles of a last-mile grocery distributor in northern Ireland in which the loggers were installed. The alerting system was specially configured so that it could effectively notify staff members in a timely manner of anomalies occurring in the refrigerators but only under the following circumstances: when the vehicles were in operation and moving, and once they had appropriately cooled down and reached the desired temperatures of refrigeration, which is achieved after 35 min. An algorithm was developed to configure the dedicated alerting system so that it was only triggered once the conditions were met. To improve user technology acceptance as well as maintenance requirements and mitigate environmental impact related to resource consumption, another algorithm was designed and implemented to reduce the battery consumption of the IoT devices. This was carried out by means of enabling a trip detection mechanism based on acceleration and GPS information.
Battery life analysis was performed to determine the impact of the trip detection algorithm on trip-detection enabled loggers versus loggers without it. Results estimate a life expectancy performance increase of roughly 162% using the logger with trip detection enabled versus a logger without trip detection, increasing usage between battery changes from 68 to 179 days. The logger deployed in the refrigerated van with trip detection enabled was exposed to lower temperatures which may have negatively affected the battery voltage and capacity, and if the bench testing on trip detection had occurred in the same conditions, the results could have shown a higher difference in battery consumption.
The trip-detection algorithm was effective in reducing battery consumption and enabling loggers to remain operative for longer without a replacement, thus decreasing the total economic resources and environmental impact of the system in the long run. Additionally, the trip detection algorithm was also utilised to provide intelligent alerting for the anomaly detection system.
Future work will validate the battery usage of loggers without trip detection in a real-case refrigerated scenario to account for difference in temperature. Additionally, the sensor setup can be expanded upon to incorporate a door contact sensor so that alarms can be sent to driver and warehouse staff if it has been left open during a delivery. This will be especially relevant for multi-drop grocery distributors with perishable stock remaining in their vans as they perform multiple deliveries before returning to the warehouse.


 ,
, 


