Article

Technoeconomic Assessment of Biopolymer Production from Crustacean Waste with the UK as a Case Study

1
BioMatter Unit—École Polytechnique de Bruxelles, Université Libre de Bruxelles (ULB), Avenue F.D. Roosevelt, 50-CP 165/61, 1050 Brussels, Belgium
2
College of Life Sciences, Xinyang Normal University (XYNU), Xinyang 464000, China
3
Center for Nanotechnology and Biomaterials Application & Research (NBUAM), Marmara University, Kadıköy, Istanbul 34722, Turkey
*
Authors to whom correspondence should be addressed.
Sustainability 2023, 15(3), 2280; https://doi.org/10.3390/su15032280
Submission received: 8 December 2022 / Revised: 12 January 2023 / Accepted: 16 January 2023 / Published: 26 January 2023
(This article belongs to the Special Issue Advances in Biomass Valorization Approaches for the Circular Economy)

Abstract

:
Marine pollution has increased in recent decades, largely due to the proliferation of seafood processing plants and the improper disposal of their associated waste streams. The waste streams consist mainly of shells that are composed of chitin, which is the most abundant aminopolysaccharide biopolymer in nature. Recognizing the value of chitin, the potential for the valorization of crustacean waste for chitin production was explored. In this regard, biogenic crab waste was subjected to chemical-only, enzymatic–chemical, and microbial treatments for chitin production. The results were employed as inputs for process simulation as a precursor to undertaking performance assessments. This study subsequently showed that the net present values (NPVs) of the chemical-only, enzyme–chemical, and microbial chitin production pathways were GBP 118.63 million, GBP 115.67 million, and GBP 132.34 million, respectively, indicating that the microbial chitin production pathway constituted the most appropriate technology for future investment. Employing a cost–benefit (CB) analysis, the CB ratios for the chemical-only, enzymatic–chemical, and microbial approaches were determined to be 7.31, 0.45, and 0.23, respectively. These results reinforced the dominant status of the microbial approach for chitin production from crab waste as the preferred valorization strategy. This study was able to provide information regarding the implications of executing alternative scenarios for crustacean waste.

1. Introduction

The shells of crustaceans, insect exoskeletons, and the cell walls of several fungi, plants, and bacteria are reported to contain the biopolymer chitin [1,2]. Chitin is recognized as the second most abundant polysaccharide in nature, after cellulose [1,2]. It is composed of repeating β–(1→4) linked 2-acetamido-2-deoxy-D-glucopyranose monomers, making it structurally similar to cellulose [3]. This similarity is a result of the hydroxyl groups in cellulose being replaced by acetamide groups in chitin, with each chitin molecule characterized by varying chain lengths which are stabilized via hydrogen bonds [3]. The presence of these hydrogen bonds promotes the formation of an ordered crystalline structure with molecular weights ranging from 53 kDa to 1300 kDa [4,5] and with the molecules of chitin arranged to form microfibrils that are associated with cuticular proteins to form chitin–protein bundles (Figure 1) [6].
The ordered chitin crystalline structure exists in three polymorphic forms, namely α-chitin, β-chitin, and γ-chitin, which describe antiparallel, parallel, and a mixture of parallel and anti-parallel microfibril orientations, respectively (Figure 2) [8].
The properties of chitin, such as its solubility, flexibility, viscosity, and polymer conformation, are dependent on the degree of N-acetylation, which describes the molar fraction of deacetylated units present in its biopolymer chain [10], such that chitin is characterized by a >50% degree of N acetylation and is referred to as chitosan when the degree of N acetylation is <50% [11]. Chitin is characterized by favorable antibacterial, biocompatibility, and biodegradability properties that promote its applicability in diverse fields such as food, agriculture, biomedicine, and water detoxification [5,12]. The diverse applications of chitin arise due to the capacity of chitin to be converted to various derivatives. For instance, chitosan, a chitin major derivative, is generally obtained via deacetylation of chitin using deacetylase enzymes or mineral alkali NaOH ([13,14]) to enable the hydrolysis of acetamide groups and the trans-arrangement of the C-2/C-3 substituents in the rings [11] (Figure 2). Other chitin derivatives also include fluorinated chitin [15], (diethylamino) ethylchitin [16], phosphoryl chitin [17], mercaptochitin [18], and chitin carbamates [19]. Although chitin may be recovered from multiple sources, chitin sourced from marine sources (i.e., crustaceans) have been reported to be superior to chitin sourced from land sources (i.e., insects) [1]. This is because marine-sourced chitins are characterized by minor quality control issues and low concentrations of contaminants/toxins, with leads to negligible inflammatory responses and high metabolic compatibility [1]. Crustacean waste also contains valuable fractions such as salts of mainly calcium carbonate, astaxanthin, proteins, and lipid residues [10]. In the UK, it was reported that crustacean waste production is substantial, with up to ~63 ktons generated annually, leading to an associated disposal cost of GBP 3,500,000 (at GBP 0.86 = USD 1) per year [20]. This waste constitutes a significant environmental management challenge since the current strategies of disposal to landfills and by incineration are not recognized as sustainable approaches. This is because of the uncontrolled release of greenhouse gases (GHGs) to the atmosphere. Other waste management approaches, such as ocean dumping and composting, may lead, respectively, to a depletion in the oxygen levels in the ocean, thus inducing the death of oceanic living organisms, and the release of toxic gases such as H2S into the atmosphere [21]. Recognizing the potential benefits of marine-sourced chitin and the abundance of marine waste, the current project seeks to assess the potential of sustainable chitin production from marine waste [5]. The viability of this research is further supported by its promotion of the circular economy paradigm via the utilization of marine waste as a renewable resource. The application of this circular economy paradigm circumvents the serious pollution issues and high waste management costs associated with the seafood industry while simultaneously extracting value from waste [22]. Such chitin extractions from marine waste can be generally achieved using chemical, biological, or biological–chemical approaches. In the chemical approach, chitin extraction is achieved via the integration of protein removal (i.e., deproteinization) and inorganic salt removal (i.e., demineralization of Ca3(PO4)2) steps, using an alkaline (i.e., NaOH) and an acidic medium (i.e., HCl), respectively [11]. This approach is characterized by short processing times and the efficient removal of the organic salts, although challenges associated with secondary pollution due to the mineral waste stream generated have been reported [23]. The biological approach, on the other hand, achieves deproteinization and demineralization of the marine waste via the use of digestive proteolytic enzymes (i.e., pepsin, trypsin, etc.) or the utilization of probiotic bacteria [11]. Such biological processes are recognized as presenting reduced environmental impacts [23], although these processes incorporate less efficient protein and salt removal steps, leading to lower quality chitin products characterized by high residual mineral and protein contents. Notably, deproteinization via the biological pathway enables the production of protein-dense streams that may be employed as a by-product and sold as animal feed to enhance economic viability in scaled-up systems. It is acknowledged that the litertaure reports that the use of deep eutetic solvents (DESs) for chitin recovery could constitute a potentially viable alternative [24,25]. These DESs are generally represented as Cat+XzY in which the Cat+, X, Y, and z denote the cation (e.g., ammonium), anion (e.g., a Lewis base halide), acid (i.e., Lewis or Brønsted acid), and number of acid molecules required to produce a complex with the anionic species [24]. The use of DESs, however, constitutes a less mature technology relative to the use of mineral acids and bases, with their associated cost varying widely depending omn their composition, making it difficult to undertake a comprehensive costing analysis. The use of DESs for chitin extraction was therefore not considered in the present study.
This work will focus on the integration experimental and simulation studies to comparatively assess the feasibility of chitin production from crab waste. Crab waste was used as the representative crustacean waste in the present study because crab constitutes a dominant waste stream and is estimated to account for 15.4 kton (>20%) of the total crustacean waste generated each year in the UK [20,26]. The present study will employ simulation studies to aid in the assessment of the energetic, technical, and economic feasibility of alternative chitin production strategies.

2. Materials and Methods

2.1. Characterization of Crab Shell Waste

The crab waste samples were provided by Recycling Ocean Resources, which is a seafood processing company in Belgium, and initially stored in a freezer until its use. To conduct the characterization experiments, the samples were initially retrieved from the freezer and allowed to thaw at room temperature. The waste was subsequently characterized via undertaking proximate and ultimate analyses. The proximate analysis analytically determined the moisture, volatile, and ash content using standard ASTM methods as reported in earlier works [27,28,29]. Elemental analysis was undertaken using an elemental analyzer (LECO TruSpec CHN, Saint Joseph, MI, USA) to determine the carbon (C), hydrogen (H), nitrogen (N), and sulphur (S) contents, and the oxygen (O) was calculated by subtracting the sum of the fractions of C, H, N, and S from the unity [30]. The crude lipid fraction was determined using Soxhlet extraction, the protein content was calculated using the Kjeldahl method, and the carbohydrate fraction was determined by subtracting the sum of the protein, ash, and lipid fractions from the unity [31,32,33].

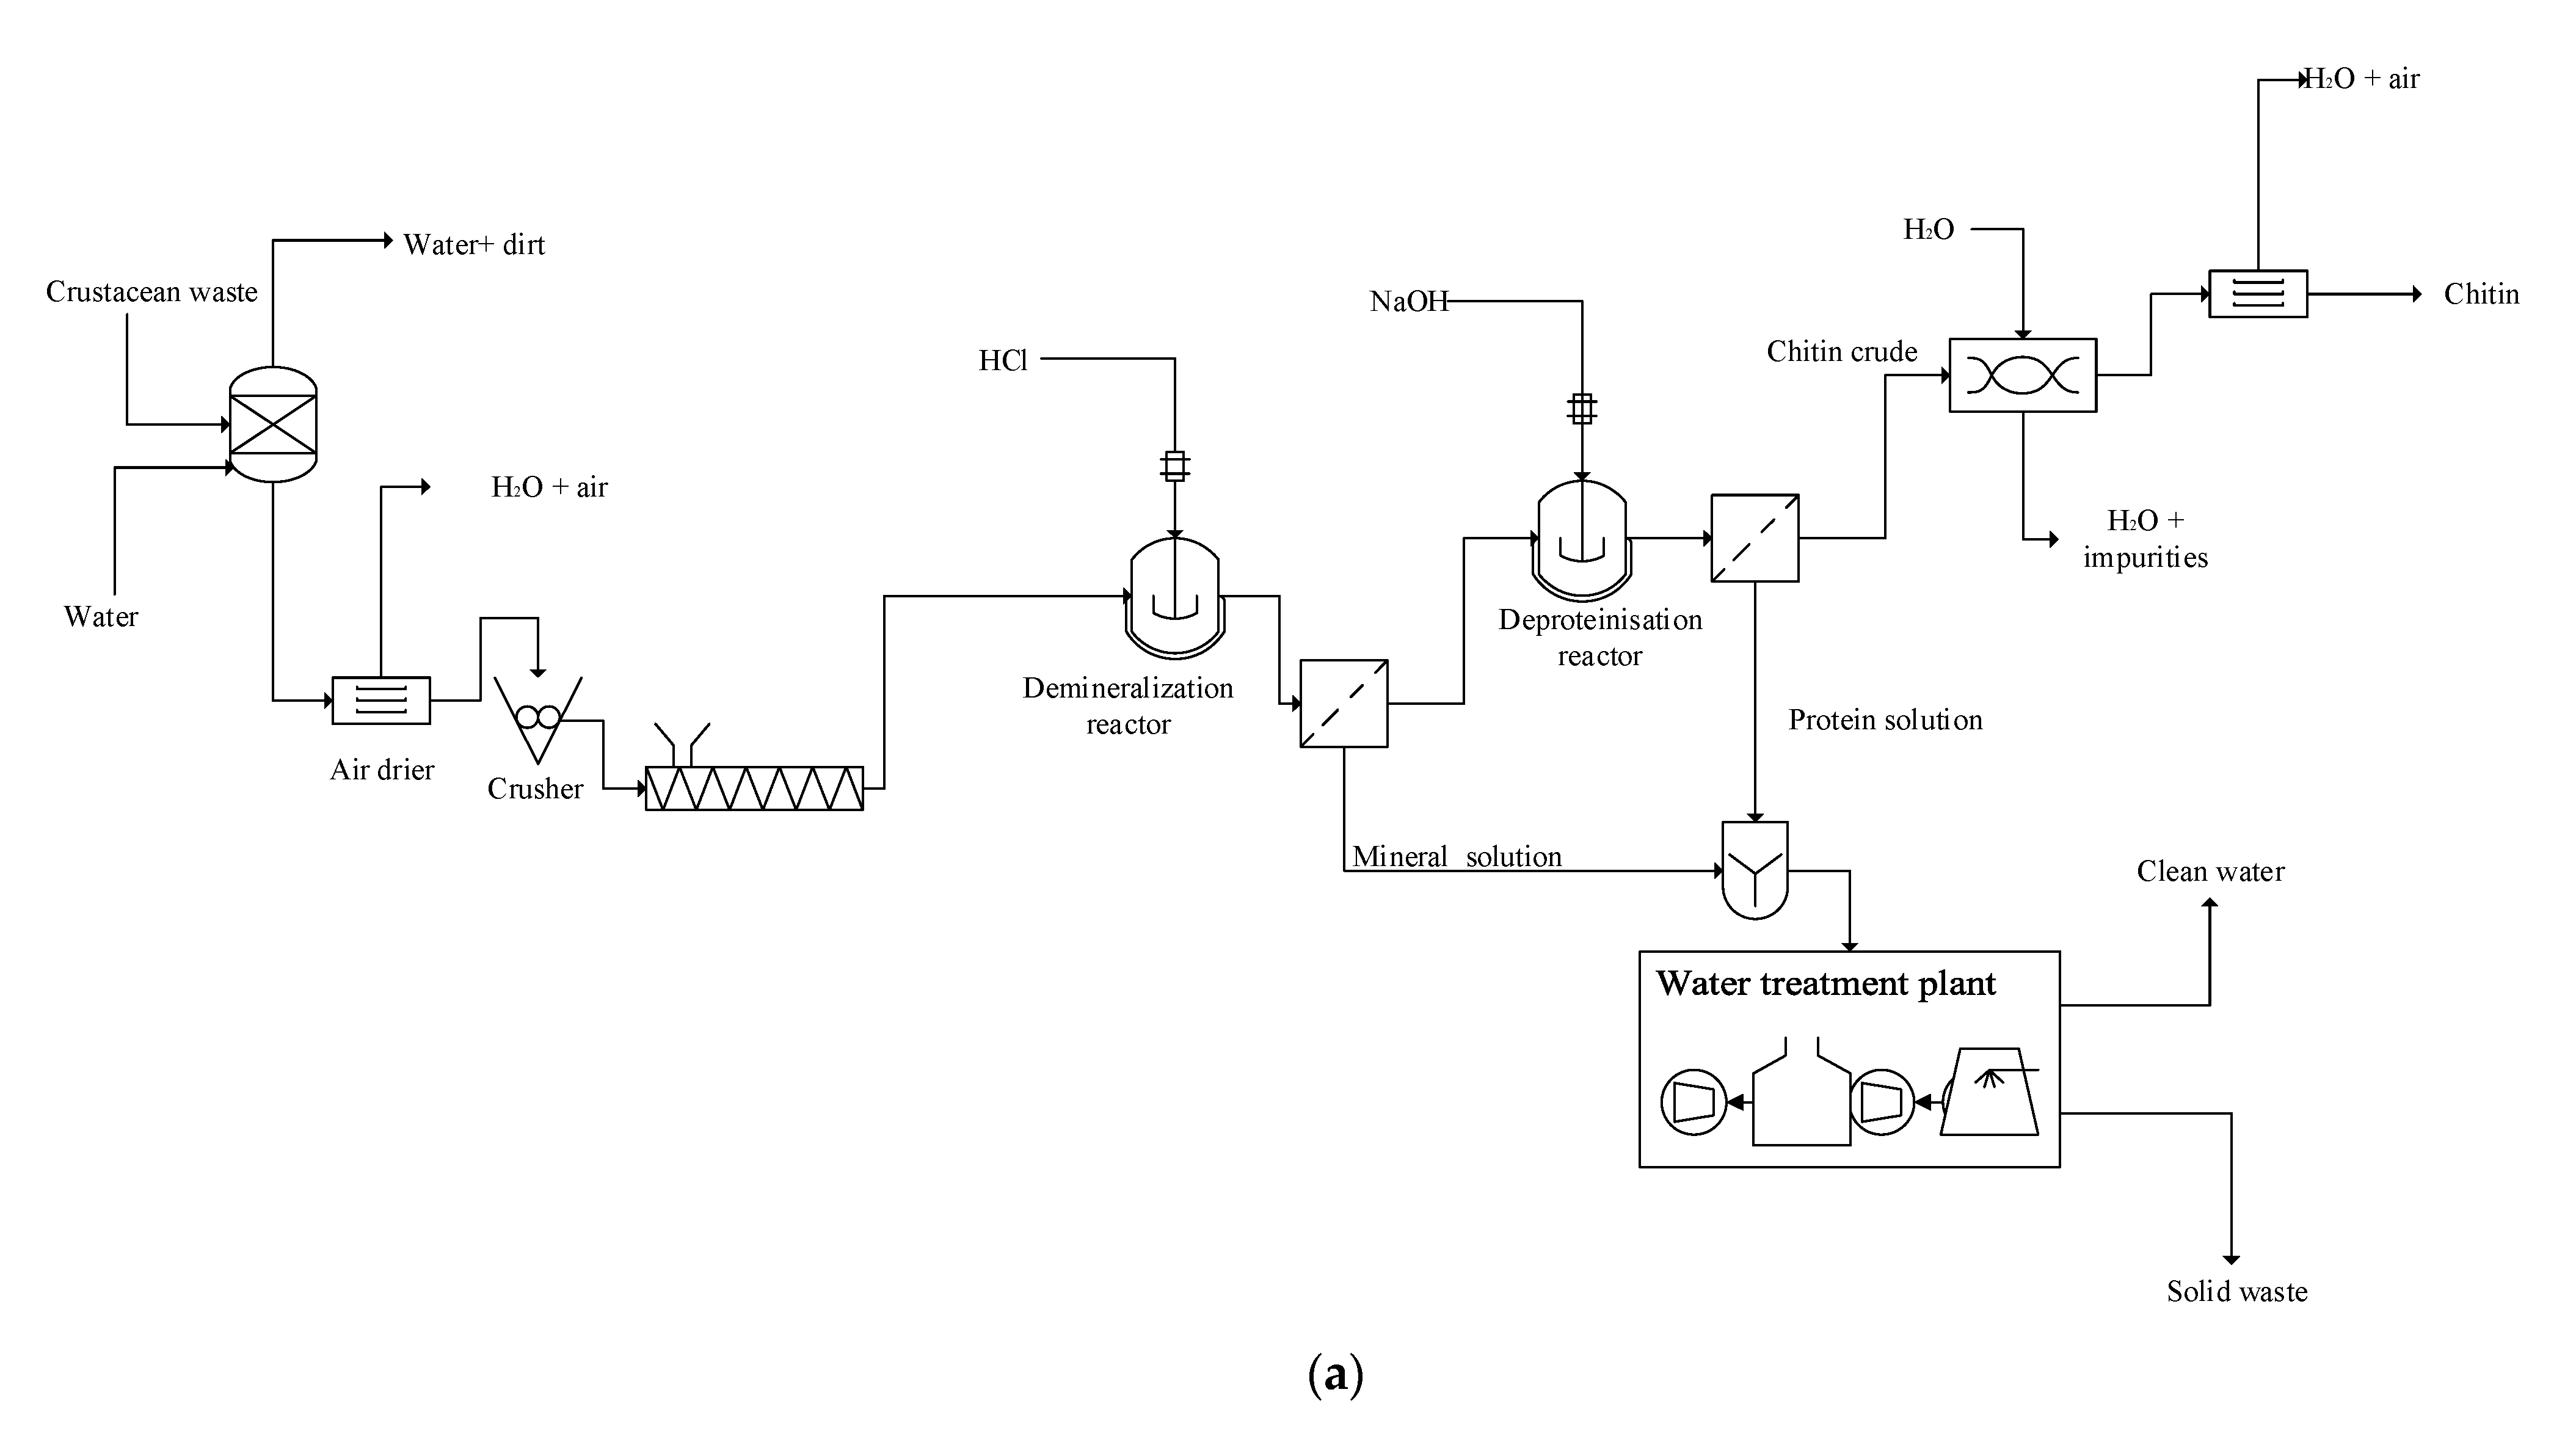
2.2. Chemical Method for Chitin Production

The crab shells were carefully recovered from the waste mixture and washed to remove dirt particles. The waste was then dried to a constant mass at 60 °C, pulverized to fine particles, and sieved using a 0.25 mm Endecott mesh. Demineralization was initially undertaken by introducing 1 g of sample into 30 mL of 1 M HCl for 75 min at room temperature (22 °C). The demineralized sample was then recovered and washed [34]. The washed sample was then dried to a constant mass at 60 °C and the degree of demineralization (DD%) was measured as follows:
D D % = A o A T A o × 100 %
where Ao and AT represent the ash content before and after (i.e., fractional concentration of ash × the mass of original sample (o) or mass of demineralised sample (T)) demineralization process, respectively.
The dried demineralized sample was then subjected to the deproteinization process by treatment using 3 M of NaOH while maintaining a solid–solvent ratio of 1 g/30 mL with the degree of deproteinization (DP%) determined as follows:
D P % = P o P T P o × 100 %
where Po and PT represent the protein content before and after (i.e., fractional concentration of protein × the mass of original sample (o) or mass of deproteinised sample (T)) the deproteinization process, respectively.
After the deproteinization reaction, the product stream was washed and dried, and the yield of the crude chitin was calculated as follows:
y % = c T m o × 100 %

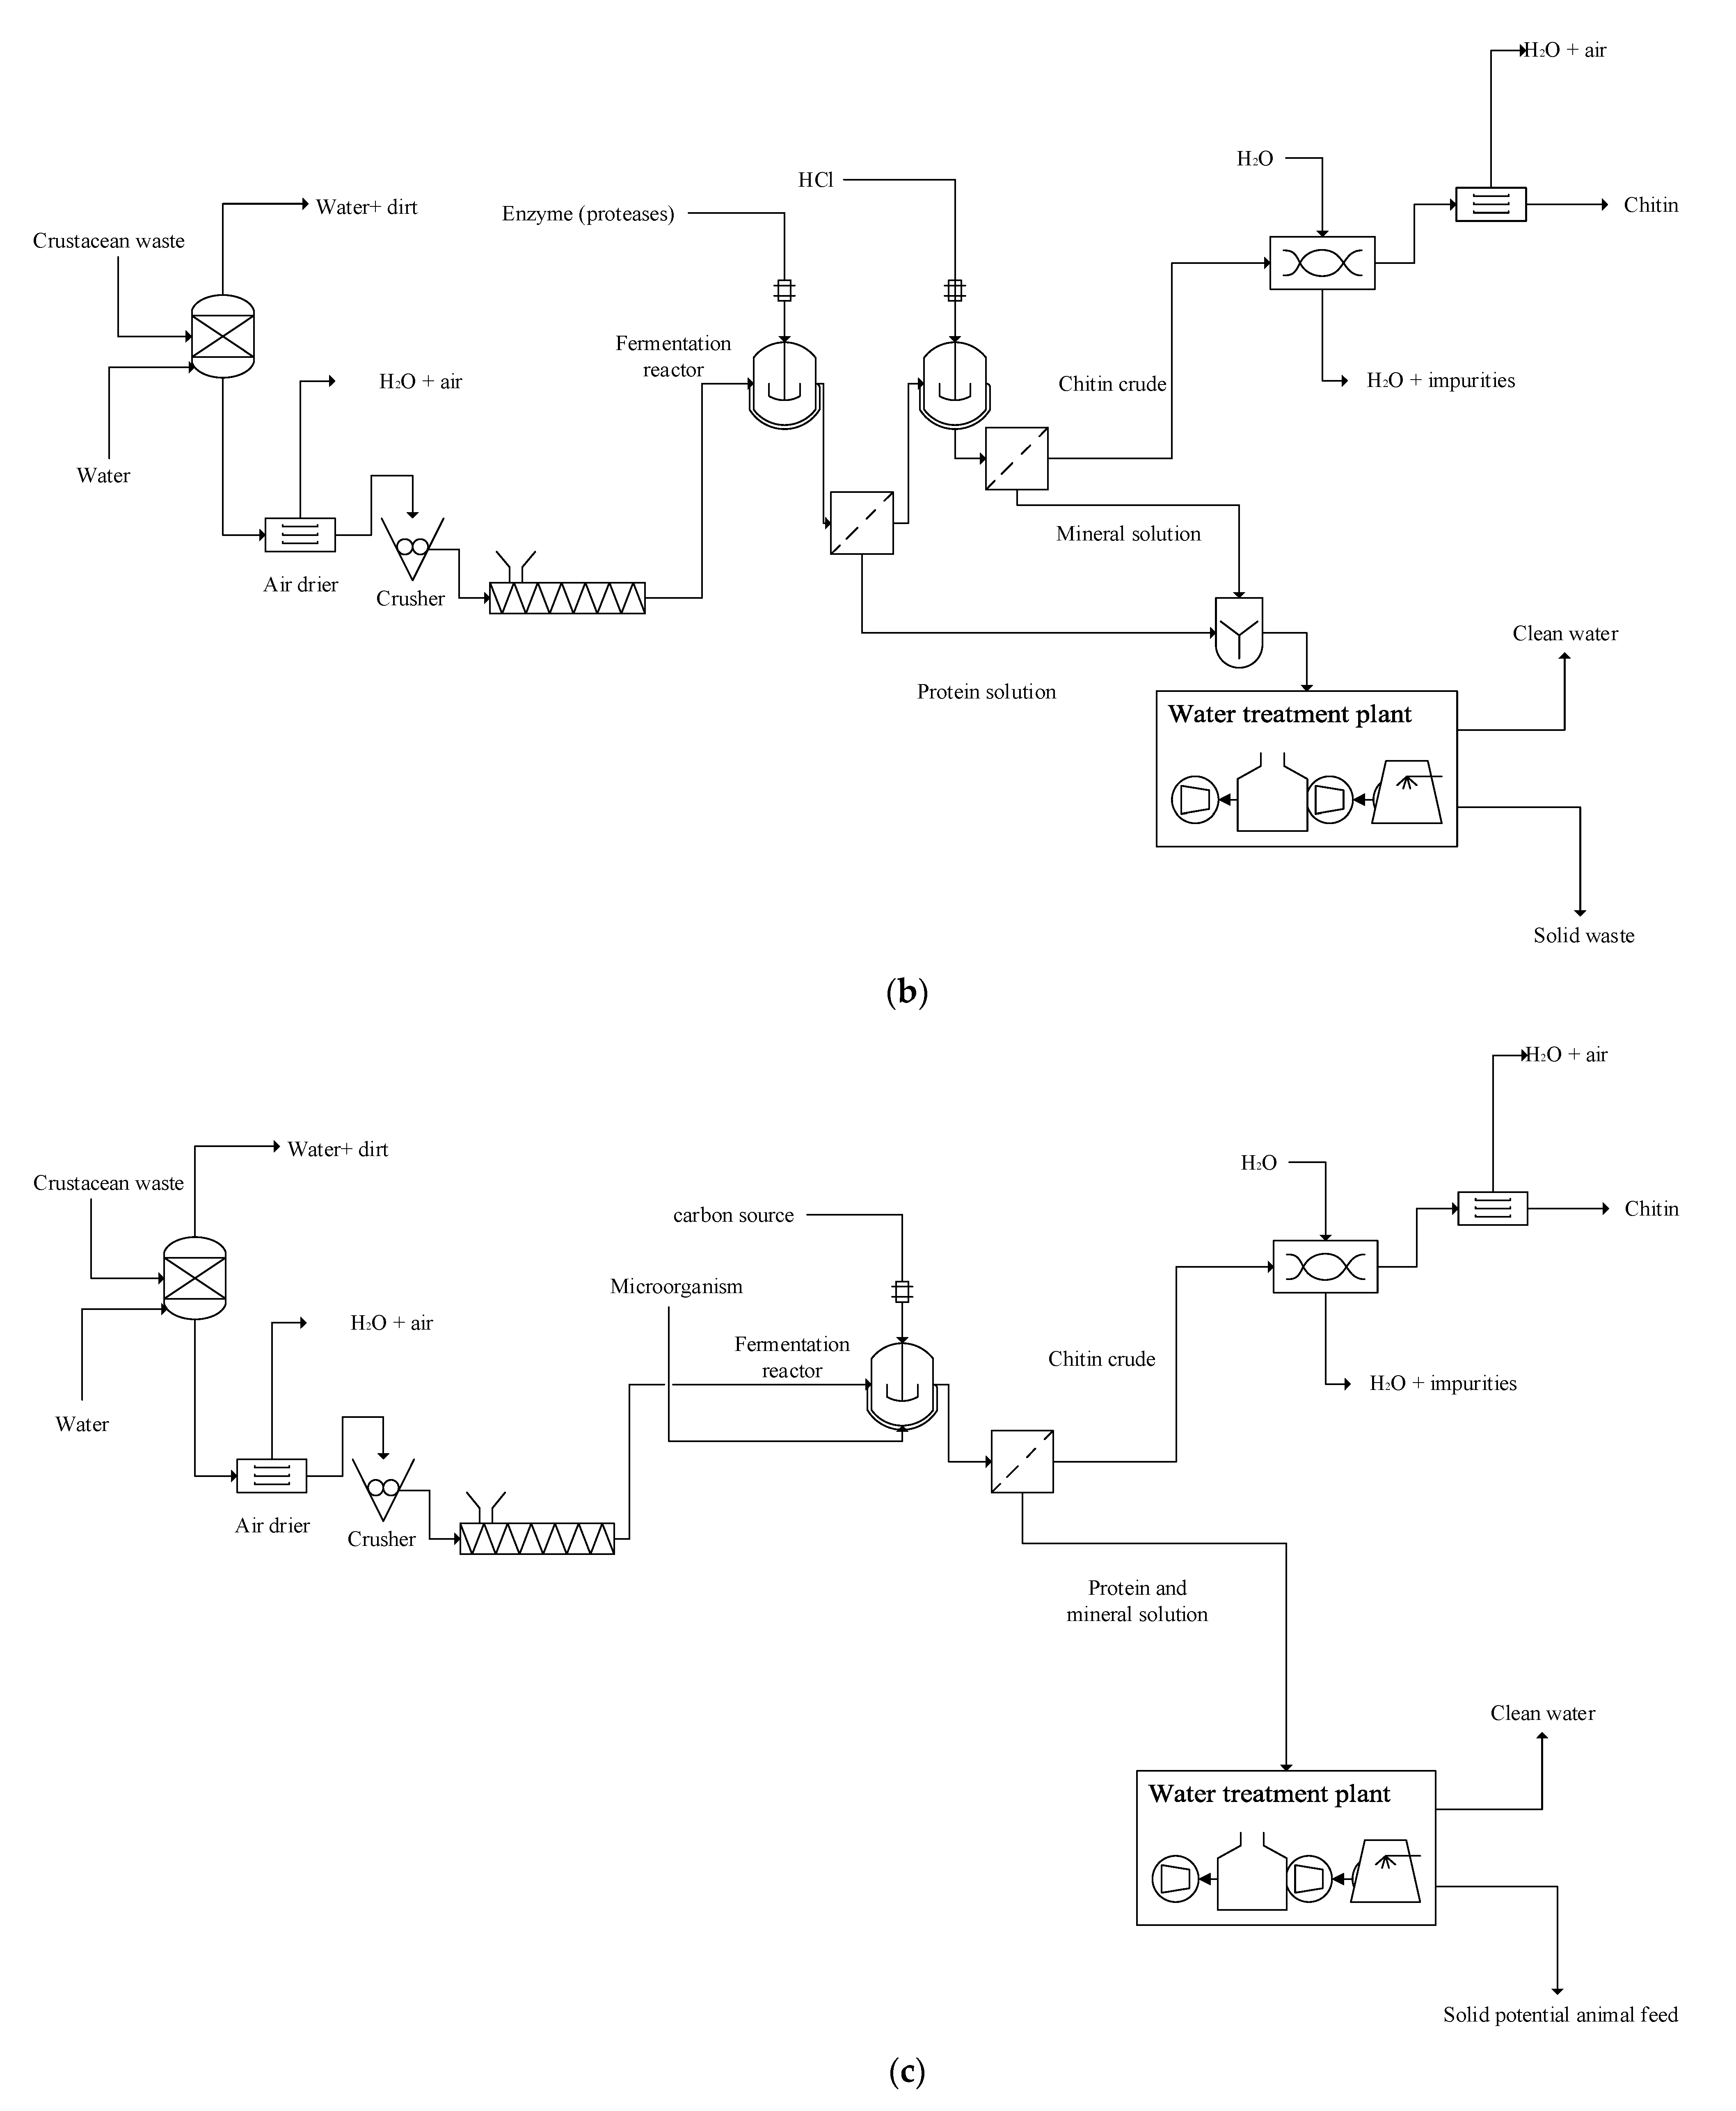
2.3. Enzymatic–Chemical Approach for Chitin Production

In this approach, deproteinization was initially undertaken using commercial proteases. The finely ground crab shell waste (1 g) was introduced to 10 mL of water containing trypsin (1000 U) and incubated for 6 h with constant stirring at 200 rpm. The pH and temperature were maintained at 7 and 37 °C, respectively. At the conclusion of the process, the mixture was separated using centrifugation at 12,000× g for 2 min, and the solid residue was recovered and dried to a constant mass [35,36]. The DP% of the dried sample was then calculated. The dried sample was then demineralized using the methods described earlier and the DD% was calculated. Finally, the yield of the solid residue was calculated.

2.4. Microbial Approach for Chitin Production

The freeze-dried L. paracasei was activated using a commercial de Man, Rogosa, and Sharpe agar medium and incubated for 24 h at 32 °C. Culturing was achieved using the agar under the same conditions while imposing two successive transfers. The inoculum containing 108 CFU mL−1 (at 540 nm) was then introduced to the fermentation vessel, 5% w/w sucrose was introduced, and the pH was adjusted to 6.4 [37]. In the study, 10% w/w of inoculum was used. The finely ground waste was then introduced to the mixture together with distilled water with a solid–liquid ratio in g/mL of 1:15. After 60 h of fermentation, the solid residue from the vessel was recovered and washed using distilled water. The solid residue was then dried and the yield was calculated. All experiments were undertaken in duplicate with mean values reported.

2.5. Process Design, Modelling, and Simulation

The assessment of the energetic, technical, and economic feasibilities of the alternative chitin extraction strategies were achieved via technoeconomic analysis (TEA). TEA facilitates the cost–profit assessments of different engineering alternatives and provides important material and energy balance data, process specifications, and investment and production cost data. This research will employ computer-aided process engineering to simulate scaled-up chitin extraction processes for the determination of energy balances and mass balances, processes, sizing, costing, etc. [38]. Process design, modelling, and simulation was achieved using Aspen Plus®v.11 software. The composition of the crab waste samples was modelled in accordance with the characterization results presented, with the carbohydrates, protein, lipid, ash, and chitin contents modelled as glucose, D-alanyl-D-alanine (a dipeptide), CaCO3, MgCO3, Ca3(PO4)2, and Na2CO3 salts, triolein, and D-N-acetylglucosamine, respectively. The sucrose was also modelled as glucose in the Aspen simulation for consistency and simplicity. In the present investigation, the Non-Random Two Liquid (NRTL) was specified as the preferred thermodynamic property model for phase equilibria calculations due to its established sufficiency in simulating complex multi-component systems of varying polarities and thermodynamic behaviors [39,40]. The models simulating the competing chitin production pathways from crab waste were modelled in accordance with the experimental conditions highlighted in Section 2.2, Section 2.3 and Section 2.4 above. Figure 3 shows the competing scenarios investigated in the present study. Scenario (a) highlights chitin production using chemical-only treatments. Figure 3a shows that the crab shell was initially washed and then air dried to a constant mass. The dried waste was then finely ground using an industrial grade grinder to obtain fine particles at 1 atm and 25 °C. An electricity input of 95 kWh per ton for the grinding process was specified, as in the literature [41], and applied in the simulation using FORTRAN commands. In modelling the demineralisation and deproteinisation reactions, several reaction equations were employed [42]. Figure 3a–c show the pathways for chitin production from crustacean waste via chemical, enzymatic–chemical, and microbial treatments, respectively. Figure 3a shows that the finely ground waste was transferred to the demineralization reactor such that demineralization was achieved using 1 M HCl at the solid solvent ratio of 1 g: 30 mL at temperature and pressure conditions of 22 °C and 1 atm, respectively. The demineralization reactions were modelled to occur as follows;
CaCO 3 + 2 HCl CO 2 + H 2 O + CaCl 2
MgCO 3 + 2 HCl CO 2 + H 2 O + MgCl 2
Na 2 CO 3 + 2 HCl CO 2 + H 2 O + 2 NaCl
Ca 3 PO 4 2 + 6 HCl 2 H 3 PO 4 + 3 CaCl 2
The fractional conversions of the salts were assumed to be similar and based on the experimentally determined degree of demineralization. At the conclusion of the demineralization reactions, the solution was filtered with the demineralized solids recovered, washed, and then air dried, as shown in Figure 3a. The ‘mineral solution’ contributed to the mass of wastewater generated from the process. The dried solid residue was then transferred to the deproteinization reactor for protein removal using 3 M NaOH while maintaining the solid solvent ratio of 1 g: 30 mL at temperature and pressure conditions of 22 °C and 1 atm, respectively. The deproteinization reaction was modelled as follows:
C 6 H 12 N 2 O 3 + 2 NaOH 2 C 3 H 6 NNaO 2 + H 2 O
The fractional conversion of the protein was based on the experimentally determined degree of deproteinization. At the conclusion of the deproteinization reaction, the solids were recovered, washed, and dried to produce the chitin product, with the protein solution contributing to the wastewater generated during the process. Figure 3b shows that the crab shells were initially prepared to produce finely ground particles using the abovementioned methods. The finely ground particles were transferred to the deproteinization process under the action of typsin proteases at a pressure of 1 atm and a temperature of 37 °C, and they were modelled to behave according to the following equation:
C 6 H 12 N 2 O 3 + H 2 O 2 C 3 H 7 NO 2
At the end of the enzyme-enabled deproteination process, the solids were recovered, washed, and dried to a constant mass, as described above, prior to being transferred to the demineralization reactor. Demineralization was achieved using HCl according to the conditions described in Section 2.3 and modelled in accordance with the earlier described demineralization reactions. Additionally, the fractional conversions imposed in modeling the deproteinization and demineralization reactions were based on the data obtained from the experimental study. The solids were then recovered, washed, and dried to a constant mass as described above. Figure 3c also shows that the crab shells were initially prepared to produce finely ground particles. The finely ground particles were transferred to a fermentation reactor where the demineralization and deproteinization processes occurred under the action of the L. paracasei microbe. Fermentation was achieved at a mesophilic temperature of 32 °C and a pressure of 1 am, with sucrose introduced to the mixture as a carbon source for the microbe. Lactic acid was produced from the carbon source via catabolic conversion by the microbe and modelled as follows:
C 6 H 12 O 6 2 C 3 H 6 O 3
The lactic acid was then employed in the demineralization of the sample and modelled as follows:
CaCO 3 + 2 C 3 H 6 O 3 C 6 H 10 CaO 6 + H 2 O + CO 2
Na 2 CO 3 + 2 C 3 H 6 O 3 2 C 3 H 5 NaO 3 + H 2 O + CO 2
MgCO 3 + 2 C 3 H 6 O 3 C 6 H 10 MgO 6 + H 2 O + CO 2
Ca 3 ( PO 4 ) 2 + 6 C 3 H 6 O 3 3 C 6 H 10 CaO 6 + 2 H 3 PO 4
For simplicity, the microbes present have been assumed to facilitate protein conversion in accordance with Equation (9).
Recognizing the wastewater generation potential of all chitin production processes, the potential for the recovery of valuable macromolecules (i.e., protein, lipid, etc.) and the need to regenerate water for re-use, a water treatment plant was integrated in all the chitin production processes. For simplicity, the water treatment plant was modelled as a cascade of vaporizers, coolers, and condensers.

2.6. Economic Performance Assessment

A comparative assessment of the different chitin production pathways was undertaken using the net present value (NPV) metric, according to which a profitable process is established when NPV is >0. The NPV (GBP) for each chitin production process was therefore calculated as follows [39]:
NPV = 1 n D F × A TCI
where the net cash flow arising from the sale of useful products (i.e., chitin) is denoted by A in GBP, TCI in GBP denotes the total capital investment, and n denotes the life span of the project in years. In the equation, i denotes the discount rate specified as 10%. The TCI was calculated using the classic plant design correlations summarized in Table S1.
For simplicity, the purchase cost of common equipment (i.e., filtration units, pumps, flash tanks, etc.) were obtained using the ASPEN economic analyzer V11 and adjusted using the Chemical Engineering Plant Cost Index (CEPCI) [43]. The quoted price of the reactors employed in the processes was employed and specified as GBP 272, 800 per 30.4 tons/h processing capacity [44]. Due to differences in processing capacity, the purchase cost of the scaled-up reactor was adjusted as follows:
P c : i , J = P c : i , J r e f J J r e f s
where Pc:i,J and Pc:i,Jref denote the reactor purchase costs in GBP at the desired capacity and the reference capacity, and Jref, J, and s represent the reference capacity, desired capacity, and the scaling factor of 0.65, respectively [45,46]. The NPV calculation was achieved by imposing several economic assumptions. These assumptions are as follows: a plant availability of 7200 h per y, a project lifespan of 30 y, and a salvage value of 0. Equipment depreciation was calculated using the straight-line method. Furthermore, the study also assumed a project financing of 100% equity and an income (corporate) tax for the project in the UK of 19% [47]. The total operating cost (TOC) was determined based on the total variable costs and total fixed costs [48]. The TOC was estimated using the costing correlations and input purchase costs summarized in Table S2.

2.7. Cost–Benefit Analysis of the Alternative Chitin Production Pathways

In the present study, the costs associated with each project were specified as composed of economic and environmental components. The present study has quantified the economic costs of the alternative chitin production pathways as the summation of the total operating cost and the annualized capital cost. The annualized capital cost, CAC (GBP), was calculated as follows [49]:
C A C = TCI × 1 + i n × i 1 + i n 1
where n and i denote the lifespan and discount rate of the project, assumed to be 30 years and 10%, respectively, as stated above.
Since landfills constitute the most common solid waste management strategy in the UK, with 24% of total waste generated typically disposed of in landfills [50], the environmental costs associated with the disposal of solid wastes from the alternative chitin production pathways were assessed. The environmental costs of the alternative processes were estimated by specifying the GHG emission costs associated with the disposal of the solid polluting residues in landfills. The CO2 equivalent per kg of CW residue was therefore assumed to be 12 CO2e/kg CW [51] after chitin recovery and the associated cost was subsequently quantified as GBP 43.86 [52] per ton of CO2. For simplicity, the benefit associated with each chitin production pathway was quantified in terms of the revenue generated from the sale of the chitin product. Notably, it was expected that the different production pathways would generate chitins characterized by varying levels of impurities due to incomplete demineralization and deproteinization reactions, thus highlighting the need to adjust the selling prices of the different chitins accordingly. The selling price of each chitin product was therefore adjusted by multiplying the mass fraction of the actual chitin and the selling price of pure chitin specified as GBP 14.62 per kg (Alibaba commercial website). The cost–benefit ratio of each chitin production pathway was subsequently calculated.

3. Results

3.1. Sample Characterization and Chitin Extraction

The proximate, ultimate, and macromolecular analyses results are presented in Table 1.
Having characterized the samples, chitin extractions via chemical-only, enzymatic–chemical, and biological methods were undertaken. The determined mean degrees of demineralization and mean degrees of deproteinization for the different chitin extraction methods are presented in Table 2.

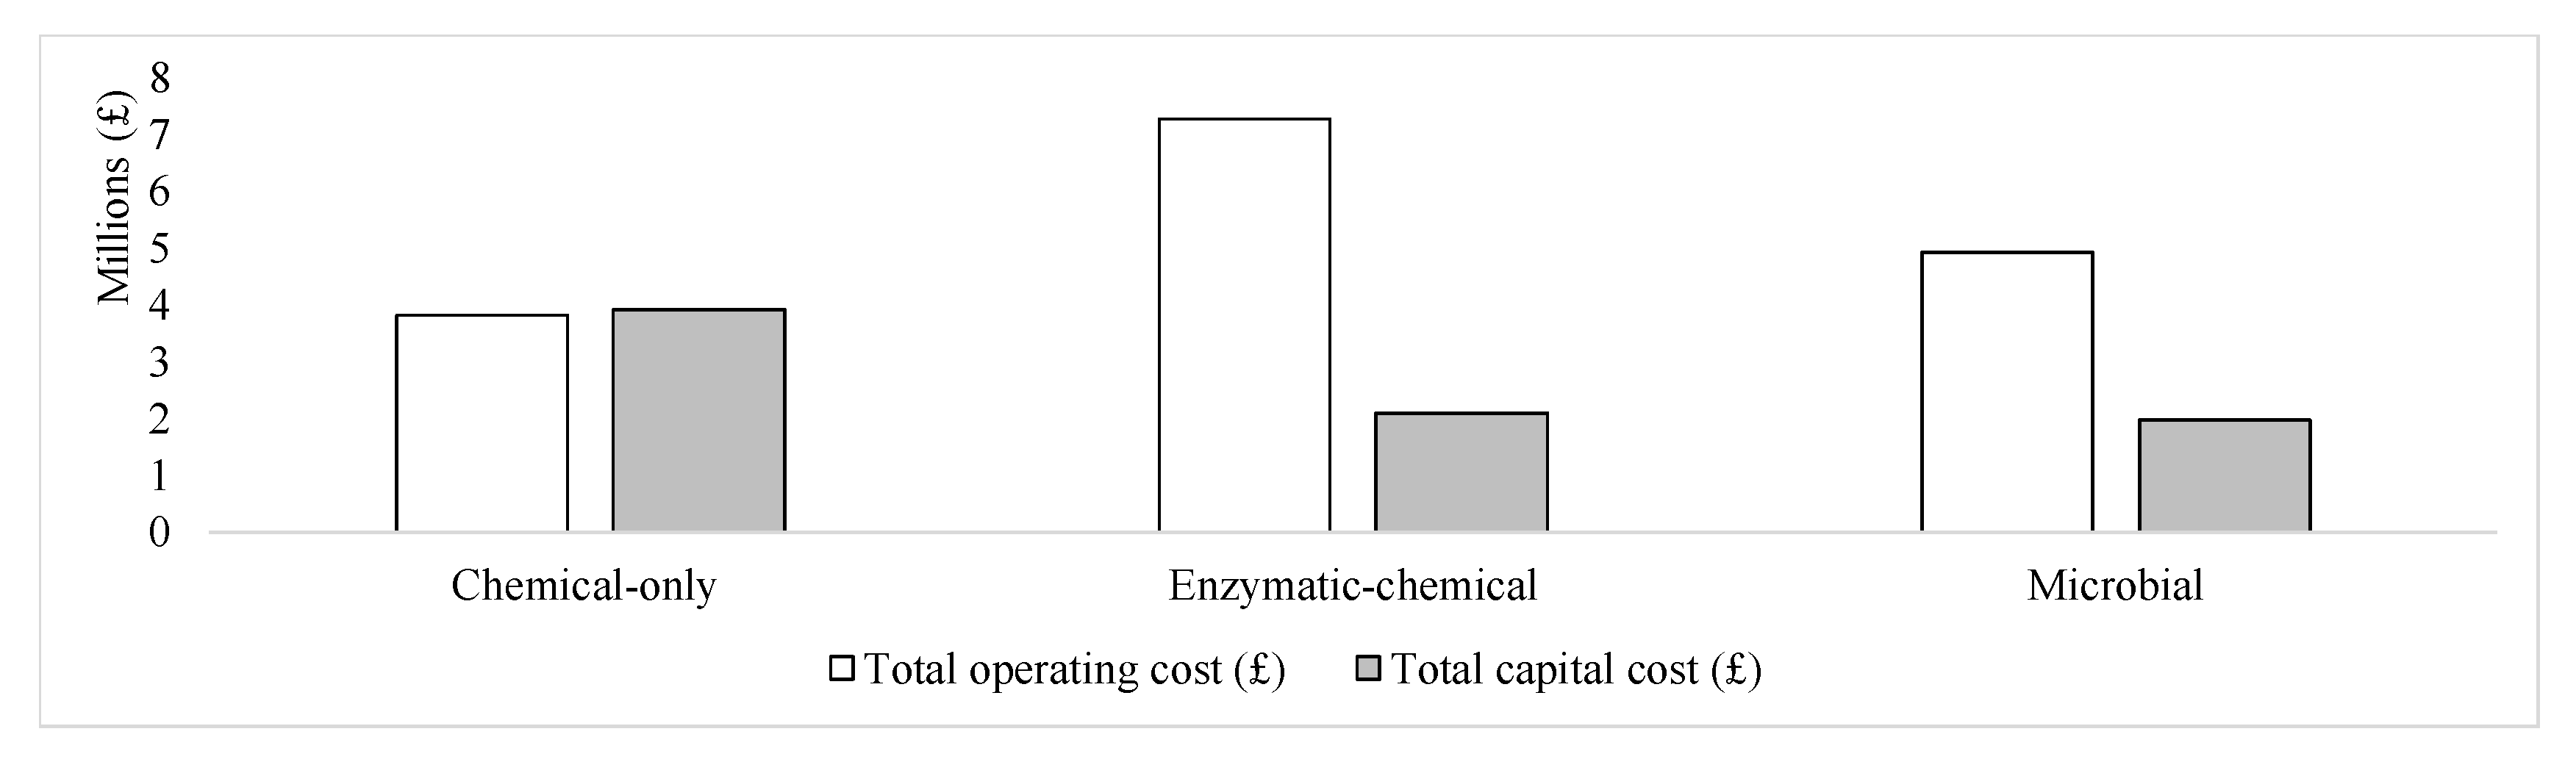
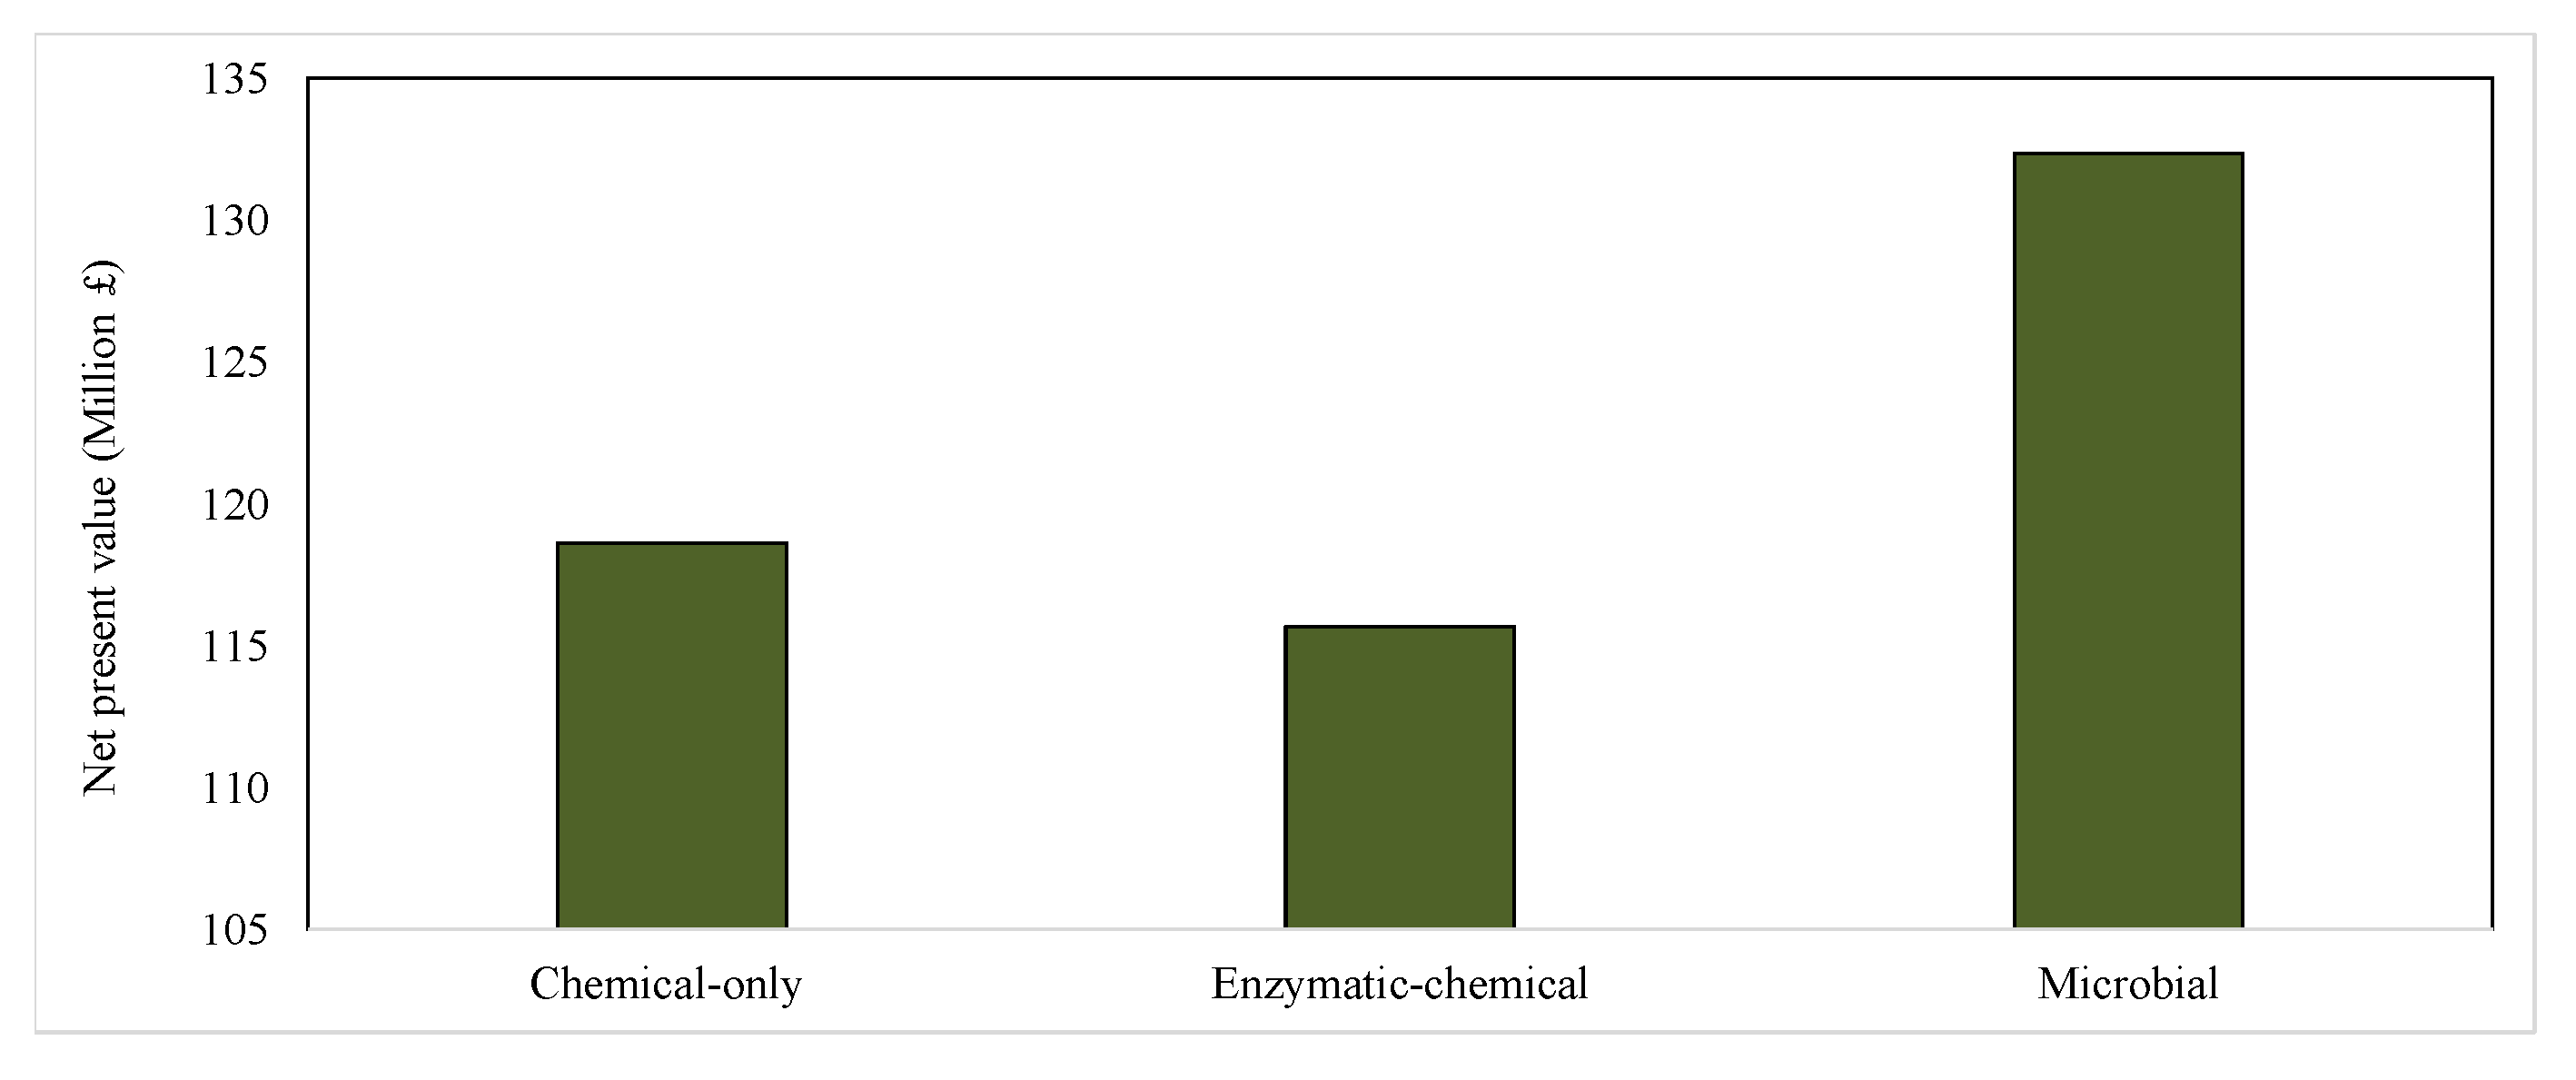
3.2. Scaled-Up Chitin Production from Crab Shells: Comparative Technical and Economic Assessments

This project has investigated chitin production scenarios based on a CW processing capacity of 1000 kg/h (dry basis). Figure 4 shows the strategies for the production of chitin from crab shells via chemical, enzymatic–chemical, and microbial approaches, which are designated as scenarios (a–c), respectively.
The major simulation results presented in Table 3.
The requirement for higher cooling and heating utilities in scenario (a) relative to scenarios (b) and (c) is due to the energetic penalty incurred in the treatment of large masses of these waste streams for water recovery. Employing the costing approaches described in Section 2.6 above, the costing results were determined and are summarized in Table 4. The associated TCI (i.e., total capital cost), TOC (i.e., total operating cost), and NPV (i.e., net present value) values for the different chitin extraction techniques are presented in Figure 5 and Figure 6.
Employing the methods described in Section 2.7 above, the cost–benefit (CB) ratios for the alternative chitin production pathways were determined and are presented in Figure 7.
Based on the results obtained thus far, the major strengths, weakness, opportunities, and threats of the alternative chitin extraction processes are summarized in Table 5.

4. Discussion

4.1. Characterization of Sample

Table 1 shows that the moisture content, protein content, and ash content of the crab shells are comparable to those reported in the literature (72 wt.%, 34.2 wt.%, and 28.5 wt.%, respectively) [53]. Similarly, the carbon, hydrogen, nitrogen, oxygen, and sulphur contents of the locally sourced crab samples are also comparable to those reported in the literature [54,55]. Unlike the study in which the lipid content was reported to be ~17 wt.% [53], the lipid content of the crab shells in the present study was determined to be 3 wt.%. The measured lipid content of the shells in the present study was, however, consistent with the 3.17 wt.% lipid content reported in another study [56], suggesting that significant variations in the composition of shells may occur depending on several factors, such as crab species, presence of residual crab meat on the shell, crab source, etc.

4.2. Chitin Yields via Alternative Pathways

Table 2 shows that the DD and DP are highest when the chemical-only method is employed, with values of 87.75 wt.% and 95.80 wt.%, respectively, while for the microbial and the enzymatic–chemical methods, respective values of 61.84 wt.% and 56.41 wt.% and 79.50 wt.% and 50.23 wt.% were determined. The chemical-only approach, therefore, constitutes the most efficient chitin extraction process, and based on its DD and DP results, the chitin content of the CW can be calculated to be 17.1 wt.%. These results are consistent with the literature, in which biological methods have been reported to lead to incomplete chitin extraction due to poorer DD and DP values compared with the more effective chemical-only approach. Notably, the DD and DP values for the microbial approach were determined to be lower than the respective values of 64.07–90.76 wt.% and 61.61–87.97 wt.% reported in the literature when Lactobacilus strains were employed in facilitating demineralization and deproteinization [57,58]. The low DD and DP values in the microbial chitin recovery translate to a mean crude (impure) chitin yield of 71.36 wt%. These differences may be due to structural and compositional differences in the crustacean wastes utilized since the studies highlighted herein employed shrimps as the chitin source. The poor DD and DP values of the microbial-enabled chitin production process may also indicate the sub-optimal experimental conditions imposed.

4.3. Simulation-Based Analysis of Alternative Chitin Production Pathways

Figure 4 shows that for scenarios (a) and (b), masses of waste solids containing mineral salts and toxic unreacted chemicals are produced and must be treated. On the other hand, scenario (c) generates a waste stream that does not contain such toxic mineral acids or salts since all the reacting components involved in scenario (c) are naturally sourced.
Table 3 shows that the experimental and simulated crude chitin yields are comparable, thus highlighting the sufficiency of the modelling approach. It is observed that the solid waste fraction is substantial in scenario (b), with a waste-generation potential of 36.72 kg/kg dry CW after waste recovery. This observation was expected and is due to the generation of wanted mineral salts as by-products of the chitin extraction process using HCl and NaOH.
Table 4 and Figure 5 show that the chemical-only, enzymatic–chemical, and microbial chitin extraction methods have TCIs of GBP 3.91 million, GBP 2.1 million, and GBP 1.97 million, respectively. The high TCI of the chemical-only method is a direct consequence of the high equipment purchase cost of GBP 0.88 million, compared with the GBP 0.544 million and GBP 0.441 million calculated for the enzymatic–chemical and microbial chitin extraction processes, respectively. This is due to the high capital cost required to treat highly polluting wastewater. Indeed, a positive correlation between the increasing use of toxic compounds (i.e., mineral acids) and the increasing masses of mineral acid and/or bases was observed. Figure 5 also shows that the TOC of the enzymatic–chemical process (GBP 7.27 million) is higher than the TOCs of the chemical (GBP 3.82 million) and microbial processes (GBP 4.92 million). This is due to the high cost of the enzyme employed in the process. Indeed, the calculations determined that the enzyme cost accounts for 67% of the total OPEX incurred, with further escalations in the enzyme cost having the potential to lead to process infeasibility (i.e., NPV < 0). Figure 5 also shows that while the TCI of the enzymatic–chemical and microbial chitin extraction processes are comparable, the TOC of the microbial process is lower, with the microbe contributing to ~10% of the TOC. Thus, unlike the enzymatic–chemical approach, in the microbial process, the carbon source (i.e., sucrose) constitutes the most impactful costing component since it accounts for ~41% of the TOC. Crucially, since the installation cost constitutes the major contributor to the TCI (i.e., 51%), the method employed in this study is considered a class 4 estimation approach [59], which is sufficient for this preliminary investigation. Employing the TCI and TOC costs, the NPVs (Figure 6) for the alternative chitin processes were calculated and determined to be GBP 118.63 million, GBP 115.67 million, and GBP 132.34 million for the chemical-only, enzymatic–chemical, and microbial chitin extraction processes, respectively. This indicates that the microbial chitin extraction process is the most economically viable approach, and thus is worthy of future scaling-up investigations.
Figure 7 shows that the chemical-only pathway is the most unfavorable approach when economic cost and environmental cost are considered, with the costs exceeding the potential benefits (i.e., a CB ratio of 7.31). One the other hand, the microbial pathway is the most beneficial chitin production pathway, with the benefits exceeding the costs (i.e., a CB ratio of 0.23). These outcomes were expected since the economic performance calculations previously determined that the chemical-only chitin production process was the least economically favorable process while the microbial process was the most economically favorable pathway for chitin production. Furthermore, since the pollution potentials of the alternative processes were estimated by specifying the GHG emission costs associated with the disposal of the solid polluting residues (i.e., residues containing NaOH, HCl, etc.) in landfills, significant environmental costs of the chemical-only and enzymatic–chemical pathways were expected. On the other hand, since the solid residue generated from the microbial pathway does not contain toxic mineral acids, bases, or salts, the need for the disposal of residual solids in landfills was considered redundant.

4.4. Benefits of Exploring Technological Improvements to the Microbial Pathway

Although Table 5 shows that the future application of the economically favorable and less polluting microbial chitin production process could be limited by its complexity, the benefits of developing a commercial microbe–chitin production plant are not trivial. This is because, in addition to the environmental benefits, significant economic benefits from the production of chitin are anticipated when the global market is considered. For instance, while the chitin market size was valued at GBP 36.37 billion in 2020 [60], it is anticipated that the global market demand for chitin will reach GBP 45.58 million in 2024 and increase at a compound annual growth rate of 15.4% in market size from 2024 onwards [61,62]. Another study predicts that the chitin market will reach GBP 59.60 billion in 2028 [60].
A literature review shows that the major companies, such as Jiangsu Shuanglin Marine Biological, AOXIN, Jining Taihao, Golden-Shell Pharmaceutical, Fengrun Biochemical, Chinova Bioworks, Golden-Shell Biochemical, and G.T.C. Bio-corporation, are involved in chitin marketing [63,64]. The literature also shows that the Asian Pacific constitutes the largest market, with a share of ~58% [64]. This market share is followed by the European and North American markets, with the European market having a demand of >7.8 ktons [65]. The existing and predicted markets are due to the growing demand for chitin and its derivatives as an environmentally friendly alternative to petroleum-based polymers [66]. For instance, chitin has widespread applications in water treatment and agriculture [60], with its anti-inflammatory characteristics promoting its application in the biomedical industry [67]. Indeed, it was reported that chitin and its derivatives could be conjugated with anticancer agents for enhanced anticancer effects [68]. These observations further justify the need to explore more efficient and sustainable approaches to chitin recovery from the waste stream and proposals for enhanced microbial chitin production processes.

5. Conclusions and Future Research

The present study has established that the microbial-enabled chitin production process presents the highest potential to be scaled-up for commercial applications based on the benefits and costs highlighted in earlier sections. To translate the microbial-enabled chitin production pathway into a viable business model, further work must be undertaken to improve the chitin purity and yield simultaneously. It is therefore proposed that our future research in the area must:
Explore the use of a combination of microbial strains characterized by multi-functionalities: For instance, microbes capable of producing high concentrations of organic acids, such as P. acidilactici [69], and microbes equipped with excellent protein valorization properties, such as L. helveticus [70], may be combined. When such microbes are combined, their synergizing effects are optimized to facilitate enhanced demineralization and deproteinization.
Explore options for enhancing both the yield and purity of the chitin product: This will be achieved via an experimental design incorporating the controlled variation of the process variables governing the microbe-based extraction process. Thus, process variables such as pH, the nitrogen source (i.e., ammonium sulfate), the carbon/carbohydrate source (i.e., sucrose), the solid–solvent ratio, etc., will be considered. In this scenario, the responses of the ‘yield’ and ‘purity’ of the chitin will be employed as sufficient objective functions that must be optimized. Having optimized the chitin yield and purity, we will seek to model and investigate the kinetics and multiphase fluid mechanics as a precursor to developing a chitin production kinetic model as a crucial input for future scale-up executions.
Explore the use of non-conventional carbon sources: According to the circularity paradigm, alternative sugars or carbohydrate-dense waste streams (e.g., apple pomace) must be explored as renewable and cheap carbon sources. This is because the carbon source was determined to constitute the most impactful cost component in the microbial chitin production process since it accounts for ~41% of the total operating cost. It must be emphasized that the exploration of alternative carbon sources in the proposed project is of timely importance to the UK due to the persistent concerns previously raised regarding the inadequacies of current efforts towards achieving the zero-emission target. Indeed, using such waste streams may also promote synergies between different sectors of the food industry.
Explore the potential of recycling the microbe-containing exit stream: The potential of recycling the microbes for use in the fermentation broth will further reduce the cost of inputs required in a scaled-up system, thus improving the overall economic viability.
Explore the potential of producing valuable by-products: Notably, future studies should explore the viability of employing the protein-containing residual stream from microbial–chitin production as a cheap and sustainable animal feed.
Microbial chitin production from CW has the potential to constitute an important method for chitin recovery in the future, provided that the knowledge gaps highlighted in this study are resolved. The efficiency of the microbial-enabled chitin recovery process must be optimized without compromising the need for enhanced chitin purity.

Supplementary Materials

The following supporting information can be downloaded at: https://www.mdpi.com/article/10.3390/su15032280/s1, Table S1: Capital cost of components employed in TCI (CAPEX) determination; Table S2: Correlations employed in operating cost (OPEX) determination. References [71,72,73,74] are cited in the Supplementary Materials.

Author Contributions

Conceptualization, O.V.O. and A.S.; methodology, O.V.O., M.H., and L.N.; software, O.V.O. and L.N.; validation, A.S., L.N., and M.H.; writing—original draft preparation, O.V.O., L.N., and A.S.; writing—review and editing, O.V.O., O.G., A.S., and S.U. All authors have read and agreed to the published version of the manuscript.

Funding

This research was funded by UK SEAFOOD INNOVATION FUND, Ref.: FS140.

Institutional Review Board Statement

Not applicable.

Informed Consent Statement

Not applicable.

Data Availability Statement

Data are contained within the article or supplementary material.

Acknowledgments

The contribution of Recycling Ocean Resources, Belgium, in the provision of the samples of crabs employed in the study is acknowledged.

Conflicts of Interest

The authors declare no conflict of interest.

References

  1. Dave, U.; Somanader, E.; Baharlouei, P.; Pham, L.; Rahman, M.A. Applications of Chitin in Medical, Environmental, and Agricultural Industries. J. Mar. Sci. Eng. 2021, 9, 1173. [Google Scholar] [CrossRef]
  2. Mohan, K.; Ganesan, A.R.; Ezhilarasi, P.N.; Kondamareddy, K.K.; Rajan, D.K.; Sathishkumar, P.; Rajarajeswaran, J.; Conterno, L. Green and eco-friendly approaches for the extraction of chitin and chitosan: A review. Carbohydr. Polym. 2022, 287, 119349. [Google Scholar] [CrossRef]
  3. Gopakumar, D.A.; Pai, A.R.; Pasquini, D.; Shao-Yuan, L.; Khalil, A.H.P.S.; Thomas, S. Chapter—State of Art, New Challenges, and Opportunities. In Nanoscale Materials in Water Purification; Thomas, S., Pasquini, D., Leu, S.-Y., Gopakumar, D.A., Eds.; Elsevier: Amsterdam, The Netherlands, 2019; pp. 1–24. [Google Scholar]
  4. Zhang, J.; Feng, M.; Lu, X.; Shi, C.; Li, X.; Xin, J.; Yue, G.; Zhang, S. Base-free preparation of low molecular weight chitin from crab shell. Carbohydr. Polym. 2018, 190, 148–155. [Google Scholar] [CrossRef]
  5. Wang, Y.; Yang, Y.; Wang, R.; Zhu, Y.; Yang, P.; Lin, Z.; Wang, Z.; Cong, W. Efficient extraction of chitin from crustacean waste via a novel ternary natural deep eutectic solvents. Carbohydr. Polym. 2022, 286, 119281. [Google Scholar] [CrossRef]
  6. Cohen, E. Chapter 43—Chitin. In Encyclopedia of Insects, 2nd ed.; Resh, V.H., Cardé, R.T., Eds.; Academic Press: San Diego, CA, USA, 2009; pp. 156–157. [Google Scholar]
  7. Chen, X.; Yang, H.; Yan, N. Shell Biorefinery: Dream or Reality? Chemistry 2016, 22, 13402–13421. [Google Scholar] [CrossRef]
  8. Kaya, M.; Lelešius, E.; Nagrockaitė, R.; Sargin, I.; Arslan, G.; Mol, A.; Baran, T.; Can, E.; Bitim, B. Differentiations of chitin content and surface morphologies of chitins extracted from male and female grasshopper species. PloS ONE 2015, 10, e0115531. [Google Scholar] [CrossRef] [Green Version]
  9. Yang, X.; Liu, J.; Pei, Y.; Zheng, X.; Tang, K. Recent Progress in Preparation and Application of Nano-Chitin Materials. Energy Environ. Mater. 2020, 3, 492–515. [Google Scholar] [CrossRef]
  10. Arbia, W.; Arbia, L.; Adour, L.; Amrane, A.J. Chitin extraction from crustacean shells using biological methods—A review. Food Technol. Biotechnol. 2013, 51, 12–25. [Google Scholar]
  11. Pakizeh, M.; Moradi, A.; Ghassemi, T. Chemical extraction and modification of chitin and chitosan from shrimp shells. Eur. Polym. J. 2021, 159, 110709. [Google Scholar] [CrossRef]
  12. Hahn, T.; Tafi, E.; Paul, A.; Salvia, R.; Falabella, P.; Zibek, S. Current state of chitin purification and chitosan production from insects. J. Chem. Technol. Biotechnol. 2020, 95, 2775–2795. [Google Scholar] [CrossRef]
  13. Tsigos, I.; Martinou, A.; Kafetzopoulos, D.; Bouriotis, V. Chitin deacetylases: New, versatile tools in biotechnology. Trends Biotechnol. 2000, 18, 305–312. [Google Scholar] [CrossRef]
  14. Synowiecki, J.; Al-Khateeb, N.A. Production, properties, and some new applications of chitin and its derivatives. Crit. Rev. Food Sci. Nutr. 2003, 43, 145–171. [Google Scholar] [CrossRef]
  15. Makino, A.; Ohmae, M.; Kobayashi, S. Synthesis of fluorinated chitin derivatives via enzymatic polymerization. Macromol. Biosci. 2006, 6, 862–872. [Google Scholar] [CrossRef]
  16. Pestov, A.; Bratskaya, S. Chitosan and Its Derivatives as Highly Efficient Polymer Ligands. Molecules 2016, 21, 330. [Google Scholar] [CrossRef] [Green Version]
  17. Kudzin, M.H.; Giełdowska, M.; Krata, A.A.; Sulak, E.; Urbaniak, P.; Drabowicz, J. Phosphorylation of chitosan (chitin) surface with PCl3. Phosphorus Sulfur Silicon Relat. Elem. 2022, 197, 625–629. [Google Scholar] [CrossRef]
  18. Kurita, K.; Yoshino, H.; Nishimura, S.-I.; Ishii, S.; Mori, T.; Nishiyama, Y. Mercapto-chitins: A new type of supports for effective immobilization of acid phosphatase. Carbohydr. Polym. 1997, 32, 171–175. [Google Scholar] [CrossRef]
  19. Yamamoto, C.; Hayashi, T.; Okamoto, Y. High-performance liquid chromatographic enantioseparation using chitin carbamate derivatives as chiral stationary phases. J. Chromatogr. A 2003, 1021, 83–91. [Google Scholar] [CrossRef]
  20. Seafish. Crustacea Processing Waste Management Data; Seafish Edinburgh: Edinburgh, UK, 2022; Available online: https://www.seafish.org/document/?id=A8C385D7-0CDD-4074-A1F0-72A41474EE64/ (accessed on 9 September 2022).
  21. Venugopal, V. Valorization of Seafood Processing Discards: Bioconversion and Bio-Refinery Approaches. Front. Sustain. Food Syst. 2021, 5, 611835. [Google Scholar] [CrossRef]
  22. Okoro, O.V.; Sun, Z.; Birch, J. Meat processing waste as a potential feedstock for biochemicals and biofuels—A review of possible conversion technologies. J. Clean. Prod. 2017, 142, 1583–1608. [Google Scholar] [CrossRef]
  23. Kim, Y.; Park, R.-D. Progress in bioextraction processes of chitin from crustacean biowastes. J. Korean Soc. Appl. Biol. Chem. 2015, 58, 545–554. [Google Scholar] [CrossRef]
  24. Li, Z.; Liu, C.; Hong, S.; Lian, H.; Mei, C.; Lee, J.; Wu, Q.; Hubbe, M.A.; Li, M.-C. Recent advances in extraction and processing of chitin using deep eutectic solvents. Chem. Eng. J. 2022, 446, 136953. [Google Scholar] [CrossRef]
  25. Okoro, O.V.; Jafari, H.; Hobbi, P.; Nie, L.; Alimoradi, H.; Shavandi, A. Enhanced keratin extraction from wool waste using a deep eutectic solvent. Chem. Pap. 2022, 76, 2637–2648. [Google Scholar] [CrossRef]
  26. Al-Tamimi, M.; Azure, J.D.-C.; Ramanathan, R. Corporate Reporting on Food Waste by UK Seafood Companies: Literature Review and an Assessment of Current Practices. Sustainability 2023, 15, 1213. [Google Scholar] [CrossRef]
  27. ASTM D3175-11; Test Method for Volatile Matter in the Analysis Sample of Coal and Coke. ASTM International: West Conshohocken, PA, USA, 2017.
  28. ASTM D2017-98; Standard Test Method of Accelerated Laboratory Test of Natural Decay Resistance of Woods, Decay, Evaluation, Laboratory, Natural, Resistance and Subjected to Termite Bioassay According to No-choice Test Procedure Based upon AWPA E1-97 (AWPA, 1). American Society for Testing and Materials: West Conshohocken, PA, USA, 1998.
  29. Hobbi, P.; Okoro, O.V.; Delporte, C.; Alimoradi, H.; Podstawczyk, D.; Nie, L.; Bernaerts, K.V.; Shavandi, A. Kinetic modelling of the solid–liquid extraction process of polyphenolic compounds from apple pomace: Influence of solvent composition and temperature. Bioresour. Bioprocess. 2021, 8, 114. [Google Scholar] [CrossRef]
  30. ASTM D6175-20; Specification for Biodiesel Fuel Blend Stock (B100) for Middle Distillate Fuels. ASTM International: West Conshohocken, PA, USA, 2020.
  31. Caligiani, A.; Marseglia, A.; Leni, G.; Baldassarre, S.; Maistrello, L.; Dossena, A.; Sforza, S. Composition of black soldier fly prepupae and systematic approaches for extraction and fractionation of proteins, lipids and chitin. Food Res. Int. 2018, 105, 812–820. [Google Scholar] [CrossRef]
  32. Lynch, J.M.; Barbano, D.M. Kjeldahl Nitrogen Analysis as a Reference Method for Protein Determination in Dairy Products. J. AOAC Int. 1999, 82, 1389–1398. [Google Scholar] [CrossRef] [Green Version]
  33. AOAC. Official Method of Analysis. In Association of Analytical Chemists, 19th ed.; AOAC International: Washington, DC, USA, 2012; pp. 121–130. [Google Scholar]
  34. Srinivasan, H.; Kanayairam, V.; Ravichandran, R. Chitin and chitosan preparation from shrimp shells Penaeus monodon and its human ovarian cancer cell line, PA-1. Int. J. Biol. Macromol. 2018, 107, 662–667. [Google Scholar] [CrossRef]
  35. Deng, J.-J.; Mao, H.-H.; Fang, W.; Li, Z.-Q.; Shi, D.; Li, Z.-W.; Zhou, T.; Luo, X.-C. Enzymatic conversion and recovery of protein, chitin, and astaxanthin from shrimp shell waste. J. Clean. Prod. 2020, 271, 122655. [Google Scholar] [CrossRef]
  36. Hongkulsup, C.; Khutoryanskiy, V.V.; Niranjan, K. Enzyme assisted extraction of chitin from shrimp shells (Litopenaeus vannamei). J. Chem. Technol. Biotechnol. 2016, 91, 1250–1256. [Google Scholar] [CrossRef]
  37. Castro, R.; Guerrero-Legarreta, I.; Bórquez, R. Chitin extraction from Allopetrolisthes punctatus crab using lactic fermentation. Biotechnol. Rep. 2018, 20, e00287. [Google Scholar] [CrossRef]
  38. Alshekhli, O.; Foo, D.C.Y.; Hii, C.L.; Law, C.L. Process simulation and debottlenecking for an industrial cocoa manufacturing process. Food Bioprod. Process. 2011, 89, 528–536. [Google Scholar] [CrossRef]
  39. Okoro, O.V.; Nie, L.; Podstawczyk, D.; Shavandi, A. Technoeconomic and Environmental Assessment of Alternative Biorefineries for Bioenergy and Polyphenolic Production from Pomace Biomass. BioEnergy Res. 2022, 15, 1–15. [Google Scholar] [CrossRef]
  40. Okoro, O.V.; Shavandi, A. An assessment of the utilization of waste apple slurry in bio-succinic acid and bioenergy production. Int. J. Environ. Sci. Technol. 2021, 19, 1323–1334. [Google Scholar] [CrossRef]
  41. Xia, Y. An Experimental Research of Biomass Crushing System. In Proceedings of the IOP Conference Series: Earth and Environmental Science, Suzhou, China, 22–24 March 2017; p. 012006. [Google Scholar]
  42. Gómez-Ríos, D.; Barrera-Zapata, R.; Ríos-Estepa, R. Comparison of process technologies for chitosan production from shrimp shell waste: A techno-economic approach using Aspen Plus®. Food Bioprod. Process. 2017, 103, 49–57. [Google Scholar] [CrossRef]
  43. Chemical-Engineering. CE Plant Cost Index. 2021. Available online: https://www.chemengonline.com/ (accessed on 9 September 2022).
  44. Alibaba. Reactor Cost Alibaba. 2022. Available online: https://www.alibaba.com/product-detail/High-Pressure-Reactor-250ml-Lab-Mini_1600454993140.html?spm=a2700.galleryofferlist.normal_offer.d_title.3c48cb12E2OZyw&s=p (accessed on 12 July 2022).
  45. Bartels, J.R. A Feasibility Study of Implementing an Ammonia Economy; Iowa State University: Ames, IA, USA, 2008. [Google Scholar]
  46. Holmgren, K. Investment Cost Estimates for Gasification-Based Biofuel Production Systems; Swedish Environmental Research Institute: Stockholm, Sweden, 2015. [Google Scholar]
  47. GOV.UK. Guidance: Rates and Allowances for Corporation Tax; Crown Copyright. 2022. Available online: https://www.gov.uk/government/publications/rates-and-allowances-corporation-tax/rates-and-allowances-corporation-tax (accessed on 15 June 2022).
  48. Towler, G.; Sinnott, R. Chemical Engineering Design: Principles, Practice and Economics of Plant and Process Design; Elsevier: Amsterdam, The Netherlands, 2008. [Google Scholar]
  49. Okoro, O.V.; Sun, Z.; Birch, J. Techno-Economic Assessment of a Scaled-Up Meat Waste Biorefinery System: A Simulation Study. Materials 2019, 12, 1030. [Google Scholar] [CrossRef] [Green Version]
  50. BBC. Where Does Recycling and Rubbish from the UK Go? 2021. Available online: https://www.bbc.com/news/science-environment-49827945 (accessed on 6 September 2022).
  51. Neufeld, D. The Carbon Footprint of the Food Supply Chain. 2020. Available online: https://www.visualcapitalist.com/visualising-the-greenhouse-gas-impact-of-each-food/ (accessed on 9 September 2022).
  52. Clifford, C. Here’s What You Need to Know about ‘the Social Cost of Greenhouse Gases’—A Key Climate Metric; CNBC. 2021. Available online: https://www.cnbc.com/2021/03/09/heres-everything-you-need-to-know-about-the-social-cost-of-greenhouse-gases.html#:~:text=There%20are%20estimates%20for%20the,according%20to%20the%20SCC%20measure (accessed on 15 June 2022).
  53. Asunción Lage-Yusty, M.; Vilasoa-Martínez, M.; Álvarez-Pérez, S.; López-Hernández, J. Chemical composition of snow crab shells (Chionoecetes opilio) Composición química del caparazón del cangrejo de las nieves (Chionoecetes opilio). CyTA-J. Food 2011, 9, 265–270. [Google Scholar] [CrossRef]
  54. Sebestyén, Z.; Jakab, E.; Domán, A.; Bokrossy, P.; Bertóti, I.; Madarász, J.; László, K. Thermal degradation of crab shell biomass, a nitrogen-containing carbon precursor. J. Therm. Anal. Calorim. 2020, 142, 301–308. [Google Scholar] [CrossRef] [Green Version]
  55. Wardiatno, Y.; Riyanto, B.; Iskandar, N.A.; Kleinertz, S.; Funch, P.; Kurniawan, F. A New Marine Biomaterial: The Shell of Mangrove Horseshoe Crabs, Carcinoscorpius rotundicauda (Latreille, 1802) Emphasizing Its Physico-Chemical Characteristics. Front. Mar. Sci. 2021, 8, 612016. [Google Scholar] [CrossRef]
  56. Pathak, N.; Shakila, R.; Jeyasekaran, G.; Shalini, R.; Ulaganathan, A.; Patel, A.; Kumar, U.; Hema, A.; Mayilvahnan, R.; Malini, A. Variation in the Nutritional Composition of Soft and Hard Blue Swimming Crabs (Portunus pelagicus) Having Good Export Potential. J. Aquat. Food Prod. Technol. 2021, 30, 706–719. [Google Scholar] [CrossRef]
  57. Cira, L.A.; Huerta, S.; Hall, G.M.; Shirai, K. Pilot scale lactic acid fermentation of shrimp wastes for chitin recovery. Process Biochem. 2002, 37, 1359–1366. [Google Scholar] [CrossRef]
  58. Rao, M.S.; Muñoz, J.; Stevens, W.F. Critical factors in chitin production by fermentation of shrimp biowaste. Appl. Microbiol. Biotechnol. 2000, 54, 808–813. [Google Scholar] [CrossRef]
  59. AACE. AACE Classification System; AACE International Recommended Practice No. 18R-97. 2005. Available online: http://www.costengineering.eu/Downloads/articles/AACE_CLASSIFICATION_SYSTEM.pdf (accessed on 17 June 2022).
  60. VMR. Global Chitin Market Size By Derivative Type, By End-User, By Geographic Scope And Forecast; Verified Market. 2021. Available online: https://www.verifiedmarketresearch.com (accessed on 17 June 2022).
  61. Kaczmarek, M.B.; Struszczyk-Swita, K.; Li, X.; Szczęsna-Antczak, M.; Daroch, M. Enzymatic Modifications of Chitin, Chitosan, and Chitooligosaccharides. Front. Bioeng. Biotechnol. 2019, 7, 243. [Google Scholar] [CrossRef] [Green Version]
  62. Jardine, A.; Sayed, S.J.P.; Chemistry, A. Valorisation of chitinous biomass for antimicrobial applications. Pure Appl. Chem. 2018, 90, 293–304. [Google Scholar] [CrossRef]
  63. Philibert, T.; Lee, B.H.; Fabien, N. Current Status and New Perspectives on Chitin and Chitosan as Functional Biopolymers. Appl. Biochem. Biotechnol. 2017, 181, 1314–1337. [Google Scholar] [CrossRef]
  64. Topmarketsreports. Chitin Market with Amid New Technological Factors; Topmarketsreports. 2021. Available online: https://topmarketsreports.com/chitin-market-with-amid-new-technological-factors-no-of-pages-124/24401/07/15/17/2022/ (accessed on 9 August 2022).
  65. Reportlinker. Global Chitin and Chitosan Derivatives Industry; Global Industry Analysts: Lyon, France, 2020. [Google Scholar]
  66. Thomas, S.K.; Parameswaranpillai, J.; Krishnasamy, S.; Begum, P.M.S.; Nandi, D.; Siengchin, S.; George, J.J.; Hameed, N.; Salim, N.V.; Sienkiewicz, N. A comprehensive review on cellulose, chitin, and starch as fillers in natural rubber biocomposites. Carbohydr. Polym. Technol. Appl. 2021, 2, 100095. [Google Scholar] [CrossRef]
  67. Park, B.K.; Kim, M.M. Applications of chitin and its derivatives in biological medicine. Int. J. Mol. Sci. 2010, 11, 5152–5164. [Google Scholar] [CrossRef] [Green Version]
  68. Elieh Ali Komi, D.; Sharma, L.; Dela Cruz, C.S. Chitin and Its Effects on Inflammatory and Immune Responses. Clin. Rev. Allergy Immunol. 2018, 54, 213–223. [Google Scholar] [CrossRef] [Green Version]
  69. Holland, R.; Crow, V.; Curry, B. Lactic Acid Bacteria|Pediococcus spp. In Encyclopedia of Dairy Sciences, 2nd ed.; Fuquay, J.W., Ed.; Academic Press: San Diego, CA, USA, 2011; pp. 149–152. [Google Scholar]
  70. Griffiths, M.W.; Tellez, A.M. Lactobacillus helveticus: The proteolytic system. Front. Microbiol. 2013, 4, 30. [Google Scholar] [CrossRef] [Green Version]
  71. Humbird, D.; Davis, R.; Tao, L.; Kinchin, C.; Hsu, D.; Aden, A.; Schoen, P.; Lukas, J.; Olthof, B.; Worley, M.; et al. Process Design and Economics for Biochemical Conversion of Lignocellulosic Biomass to Ethanol: Dilute-Acid Pretreatment and Enzymatic Hydrolysis of Corn Stover; NREL Technical Report: NREL/TP-5100-47764; National Renewable Energy Laboratory: Golden, CO, USA, 2011. [Google Scholar]
  72. Zyl, v.M. Valorisation of Bio-aromatics from Pulp Mill Residues and Commercial Forest Species in South Africa; Stellenbosch University: Stellenbosch, South Africa, 2017. [Google Scholar]
  73. TDT. Fourth Quarter 2007 Guide to Labor Burden; Texas Department of Transportation: Austin, TX, USA, 2007. [Google Scholar]
  74. Macedo, J.V.C.; Ranke, F.F.d.B.; Escaramboni, B.; Campioni, T.S.; Núñez, E.G.F.; Neto, P.d.O. Cost-effective lactic acid production by fermentation of agro-industrial residues. Biocatal. Agric. Biotechnol. 2020, 27, 101706. [Google Scholar] [CrossRef]
Figure 1. Pictorial illustration of the structure and spatial arrangement of chitin in marine species. (Copyright © 2023 WILEY-VCH Verlag GmbH & Co. KGaA) [7].
Sustainability 15 02280 g001
Figure 2. (a) Highlights the similarities of cellulose, chitin, and chitosan structures with R1 and R2 representing -NHCOCH3 and -NH2, respectively; (b) highlights the arrangements of chitin molecules in α-chitin, β-chitin, and γ-chitin (Copyright © 2023 John Wiley & Sons) [9].
Sustainability 15 02280 g002
Figure 3. Simplified process diagrams for chitin production from crustacean waste via (a) chemical, (b) enzymatic–chemical, and (c) microbial treatments.
Sustainability 15 02280 g003aSustainability 15 02280 g003b
Figure 4. ASPEN plus simulation output for the alternative chitin production pathways. Scenario (a): chemical-only chitin production method; scenario (b): enzymatic–chemical chitin production method; scenario (c): microbial chitin production method.
Sustainability 15 02280 g004aSustainability 15 02280 g004b
Figure 5. The total capital costs and total operating costs of the chemical-only (scenario (a)), enzymatic–chemical (scenario (b)), and microbial (scenario (c)) chitin extraction processes.
Sustainability 15 02280 g005
Figure 6. The net present values of the chemical-only (scenario (a)), enzymatic–chemical (scenario (b)), and microbial (scenario (c)) chitin extraction processes.
Sustainability 15 02280 g006
Figure 7. Cost–benefit ratios of the chemical-only (scenario (a)), enzymatic–chemical (scenario (b)), and microbial (scenario (c)) chitin extraction processes.
Sustainability 15 02280 g007
Table 1. Characterization of the crab waste (CW) samples.
CharacterizationValue
Moisture content (% w/w, wet CW basis)70.92
Lipid content (% w/w, dry CW basis)3.00
Carbohydrate content (% w/w, dry CW basis)34.00
Protein content (% w/w, dry CW basis)31.55
Ash content (% w/w, dry CW basis)31.45
Volatiles (% w/w, dry CW basis)66.65
Fixed carbon (% w/w, dry CW basis)1.90
Carbon content (% w/w, dry CW basis)44.53
Hydrogen content (% w/w, dry CW basis)5.75
Nitrogen content (% w/w, dry CW basis)5.53
Oxygen content (% w/w, dry CW basis)42.02
Sulphur content (% w/w, dry CW basis)2.19
Table 2. Mean yield of crude chitin produced from the different processing methods.
ApproachDD (wt.%)DP (wt.%)Yield of Crude Chitin (wt.%)
Chemical-only87.7595.8022.70
Enzymatic–chemical79.5050.2340.20
Microbial61.8456.4171.36
Table 3. Simulation results for the major product and inlet streams for the scenarios considered.
Stream NameScenario (a)Scenario (b)Scenario (c)
Experimental crude chitin yield (kg/kg dry CW)0.2270.4020.714
Simulated crude chitin yield (kg/kg dry CW)0.2150.4410.750
Solid waste for treatment (kg/kg dry CW)36.720.6430
External cooling utility (MW)4.0430.0440.240
External heating requirement (MW)3.1230.0572.730
Scenario (a): chemical-only chitin production method; scenario (b): enzymatic–chemical chitin production method; scenario (c): microbial chitin production method.
Table 4. The major cost components for the different chitin production methods considered.
Cost ComponentsChemical-OnlyEnzymatic–ChemicalMicrobial
Total equipment purchase cost (GBP)882,725.71544,137.25441,247.61
Total equipment installation cost (GBP)1,978,969.991,062,009.77998,935.49
Warehouse cost (GBP)79,158.8042,480.3939,957.42
Home office and construction fee (GBP)465,057.95249,572.30234,749.84
Project contingency (GBP)232,528.97124,786.15117,374.92
Other costs (start-up, permits) (GBP)232,528.97124,786.15117,374.92
Fixed capital investment (GBP)3,720,463.591,996,578.361,877,998.73
Working capital cost (GBP)186,023.1899,828.9293,899.94
Total capital investment (GBP)3,906,486.772,096,407.281,971,898.66
Labor cost (GBP)913,196.16913,196.16913,196.16
Labor burden cost (GBP)821,876.54821,876.54821,876.54
Maintenance cost (GBP)26,481.7716,324.1213,237.43
Property insurance (GBP)26,043.2513,976.0513,145.99
Total variable cost (GBP)2,032,663.295,506,565.003,160,360.71
Fixed operating cost (GBP)1,787,597.721,765,372.871,761,456.12
Total operating cost (GBP)3,820,261.017,271,937.874,921,816.83
Table 5. Strengths, weakness, opportunities, and threats (SWOT) of the alternative chitin extraction processes.
ProcessStrengthsWeaknessesOpportunitiesThreats
Chemical-onlyThe chitin produced is characterized by a high level of purity. Additionally, this is a mature technology implying that significant information regarding its application is available in the literature.This approach has a substantial environmental footprint. There may also be health and safety concerns due to the use of mineral acids for demineralization operations.Not applicableCountries with weaker environmental regulations than the UK may ignore the need for waste water treatment. This would lead to lower costs and thus a more competitive chitin product overall.
Enzymatic–chemicalThe chitin produced is characterized by a moderate level of purity.Moderate environmental footprint. There may also be health and safety concerns due to the use of mineral acids for demineralization operations.Further work could explore the use of organic acids for demineralization processes.Countries with weaker environmental regulations than the UK may ignore the need for waste water treatment. This would lead to lower costs and thus a more competitive chitin product overall.
MicrobialMinimal environmental footprint. This process is also the most economically viable overall, thus making it sustainable.The chitin produced is characterized by a low level of purity. Additionally, microbial systems are time consuming and difficult to control.Further work could explore approaches to further improve the chitin purity. The opportunity for microbe re-use could also be investigated.The complexity of the process and the need for specialist skills could limit acceptance of this process.
Disclaimer/Publisher’s Note: The statements, opinions and data contained in all publications are solely those of the individual author(s) and contributor(s) and not of MDPI and/or the editor(s). MDPI and/or the editor(s) disclaim responsibility for any injury to people or property resulting from any ideas, methods, instructions or products referred to in the content.

