Abstract
A two-year pot experiment was set up to determine the ability of Actosol (Act) to improve soil properties and maize yields. The Act effects were compared to those of manure, nitrogen/phosphorus/potassium (NPK) and an additive-free control (Ctr). After years 1 and 2, the pH, sorption properties, total carbon (TC), total N (TN), available P and K contents, dehydrogenase activity (DHA), residuum (Re) and humic acids (HAs) were measured in coarse- and medium-textured soils. Maize yield, N, P and K were also quantified. The plant element uptake and soil quality index (SQI) were calculated. In both soil types, the Act increased the DHA, cation exchange capacity, bioavailable K, P, TC, TN, C HAs and C Re in the soils compared to the Ctr. The maize yield, K and P contents and their uptake by the maize increased in both soil types after Act application. The SQI increased by >50% with a single dose (Act1), almost doubling with a double dose (Act2) compared to the Ctr. With Act1 and Act2, the P and K uptake increased several-fold. The soil properties and maize yield after using Act demonstrated its utility in improving soil organic matter and maize growth and in disposing of waste.
1. Introduction
The main source of energy in many countries, including Poland, is coal combustion, which, apart from causing air pollution, generates large amounts of waste. In recent decades, the use of lignite has increased, resulting in the necessity to store its useless, fine-grained fraction, which has a low energy value, making its combustion economically unprofitable [1,2].
Acidic and low in organic-matter (OM) content, coarse-grained soils constitute a large share of the arable lands in the world. The soil OM (SOM) content is gradually reduced in such soils, as a result of leaching or mineralisation. Therefore, the search for additives to increase the SOM content and soil sorption capacity has become a leading task in both the fields of agriculture and environmental protection [3,4,5]. One source of external OM is lignite, especially its low-energy varieties, which can be used in agriculture as a soil amendment, and as a substrate for greenhouse and hydroponic crops [4,5,6]. Lignite may be a more valuable soil amendment than farmyard manure (FYM) or compost, as it contains much higher amounts of humic acids (HAs), at about 45%, and fulvic acids (FAs), at about 12%, while FYM only contains about 5% HAs and 15% FAs [4,7]. In addition, in order to decrease greenhouse gas emissions (mainly methane), livestock reduction has been recommended, which results in the lowered production and use of FYM [8]. For these reasons, lignite provides opportunities for soil improvement, as well as an increase in carbon (C) sequestration in order to mitigate climate change [9].
Maize is one of the most important crops in the world due to its different uses, and, in terms of area of cultivation, it ranks second only to wheat [3]. Both the grain and aboveground parts of maize are used as a raw material for silage, as well as for biofuel (ethanol, biogas) production [10]. In the last 20 years, there has been a systematic increase in the global area of maize cultivation to over 1 million ha [11,12]. Increasing maize yields, especially when cultivated on poor soils, has become an important task from an economic perspective.
The beneficial effect of HAs from various materials, including lignite, on the physical, chemical and biological properties of soils has already been proved under dry-climate and alkaline-soil conditions [5,6,13,14], and the stimulating effect of HAs on natural, yield-forming physiological processes in plants has also been demonstrated [15,16,17,18]. Following the application of Actosol (Act), higher growth rates and improvements in the yield quality of chamaedorea seifrizii [19], wheat [20] and olive trees [21] have been observed. There have also been studies showing that the application of humic substances increases phosphorus (P) availability in soils under wheat cultivation [22], improve enzyme activity under different herb plantations [23] and enhance the organic C content and OM quality under celery cultivation [24]. However, only a few studies have addressed the effect of lignite-waste liquid extracts, applied in different doses, on soils and maize biomass yields in acidic soils with different textures. To fill this gap in our knowledge, we aimed to determine the effect of lignite extract (Act) application on selected parameters of the maize and biomass yield of coarse- and medium-textured soils. We hypothesised that the beneficial effects of HAs on the soil properties and biomass yield would be the same, or even greater, than the effect of conventional fertilisers, such as FYM or nitrogen/P/potassium (NPK). The soil properties and biomass yield were evaluated after the first and second years of maize harvesting. Three indices were calculated––the uptake of N, P and K, to estimate the capacity of the soils to supply the plants with these elements, and the soil quality index (SQI), to compare the quality of the soils that were treated with the soil amendments.
2. Materials and Methods
2.1. Characteristics of the Organic Products Introduced into the Soils
In the experiment, two organic soil amendments were used:
- -
- a commercial liquid soil additive––Act (Actosol®®, produced by Arctech Inc., Chantilly, VA, USA) [25], which is produced from fine-grained lignite waste. This had a pH in K chloride (KCl) of 7.6 and contained 49.3% C as total C (TC), 6% HAs, 0.4% N, 1.5% K (in the form of potassium oxide [K2O]), 0.08% P (in the form of P pentoxide [P2O5]), 0.07% magnesium (Mg), 0.08% calcium (Ca) and small amounts of microelements and FAs; and
- -
- a pig FYM, applied in solid form after being stored for six months on a manure plate. This had a pH in KCl of 6.2 and contained 47.3% C, 4.8% HAs, 0.51% N, 0.68% K (as K2O), 0.44% P (as P2O5), 0.10% Mg, 0.31% Ca and a small number of microelements. All the values are expressed as a percentage of the total solid dry mass.
2.2. Establishment of the Pot Experiment
The pot experiment was carried out in a greenhouse (with natural light and without heating) at the University of Agriculture in Krakow, Poland. The experiment was conducted over two growing periods (from the beginning of May to the end of July). The experiment was set up using two soil types with different textures––a coarse-textured (loamy sand) dystric Cambisol and a medium-textured (silt) haplic Luvisol [26]. Both soils were taken from arable fields, from a depth of 0–20 cm, air-dried and sieved through a 2-mm mesh. The pot experiment consisted of five treatments prepared from each soil. In order to prepare the treatments, the soils were manually mixed with the additives.
The following treatments were administered: (1) an additive-free control (Ctr); (2) NPK mineral fertilisation; (3) FYM supplemented with K and P; (4) NPK plus a single dose of Act (Act1); and (5) NPK plus a double dose of Act (Act2). Before setting up the experiment, 0.5 g N, 0.3 g P and 1.2 g K pot−1 were introduced into the soil of the fertilised treatments. The doses of NPK, FYM and Act were calculated so that the same amount of N was introduced into each pot. The FYM provided 6.2 g HAs per pot. The Act1 dose contained an amount of HAs equal to their amount in the FYM, whereas Act2 contained double the amount of HAs compared to the FYM (12.4 g). The N added to the soil fertilised with mineral salts was in the form of ammonium nitrate (NH4NO3) solution. The P and K were introduced into the fertilised soil in solutions of monocalcium phosphate monohydrate [Ca(H2PO4)2∙H2O] and KCl salts. After being mixed with the additives, the soil was equilibrated for seven days. Before the second growing period, NPK fertilisation was applied in the same doses as prior to the experiment being set up. The NPK was introduced into all fertilising treatments (except the Ctr) in the same doses as the mineral background in order to emphasise any differences between the treatments resulting from the effects of the additives introduced in the first year.
The soil moisture during the growing period was kept at 60% of the maximum soil water capacity. In between the growing periods, the soil moisture was reduced to 20% and the pots were covered with paper. The experiment was carried out in six replications (n = 6) in a randomised block design. There were 60 pots in total, 30 containing coarse- and 30 containing medium-textured soil. In order to reduce the edge effect, 36 additional pots were placed around the experimental ones.
The pots were filled with the prepared soil (5 kg d.m. per pot). The pots were 25 cm in diameter and 37 cm high. Each pot had four holes in the bottom and was placed on a stand so the leachate could be collected and poured back into the pot. After each growing period, soil samples (50 g from each pot) were collected. Before the second growing period, the soil from the six pots undergoing the same treatment was mixed together and placed back in the pots. During the experiment, the soil in the pots was not replenished to its primary weight.
The tested plant was maize (zea mays L. var. Bejm, FAO 230-240), cultivated for silage. In each year of the experiment, seven grains were sown in each pot. After sprouting, the number of plants was reduced to five in each pot. After each growing period, the plants were harvested in the 9th-leaf phase. The adhering soil was removed with precision from the roots, which were then gently washed in distilled water. The plants were divided into shoots and roots. The shoots and roots from each pot were dried separately. After harvesting, the roots and aboveground parts of the maize were dried in a dryer at 70 °C. The roots were dried for 24 h and the aboveground parts for 48 h.
2.3. Soil Physicochemical and Biochemical Analyses
The textures of the soils used in the experiment were classified according to World Reference Base [26] recommendations. pH values were measured in 1 M KCl using the potentiometric method at a soil:solution ratio of 1:2.5. The exchangeable Ca2+, Mg2+, sodium (Na+) and K+ cations were extracted using 1 M ammonium chloride (NH4Cl) [27]. The hydrolytic acidity (Hh) was established in 1 M Ca acetate [Ca(CH3COO)2] by titration with 0.1 M Na hydroxide (NaOH) [28]. The available P and K were extracted according to the modified Egner’s method, using a 0.03-M acetic acid (CH3COOH) buffered solution [29]. The concentrations of Ca2+, Mg2+, K+ and Na+, and the available P and K, were assessed using inductively coupled plasma–optical emission spectrometry (ICP–OES, PerkinElmer Optima 7300 DV, Canada), with a multi-element ICP-IV Merck solution used as the standard. The accuracy of the analytical methods was verified using GSS-8-certified reference material (GBW 07408, State Bureau of Metrology, Beijing, China).
Fractionation of the SOM was preceded by the isolation of the residuum (Re) from the heavier fraction, using Na iodide (NaI) with a density of 1.8 g cm−3 [30]. The HAs were separated from the heavy fraction based on their property to dissolve in the alkaline aqueous solution (0.1 M NaOH) used as an extractant [31]. The C in the SOM fraction, HAs (CHAs) and Re (CRe), and the TC and total N (TN) concentrations were determined using an automatic CNS analyser (Elementar Vario MAX Cube, Germany).
The dehydrogenase activity (DHA) was determined following the incubation of the samples with a 2,3,5-triphenyltetrazolium chloride solution used as the substrate for 24 h at 37 °C. The intensity of colouration was measured using a Shimadzu UV-1800 spectrophotometer at a wavelength of 450 nm [32].
The sum of the determined cations (BC) was calculated:
BC = Ca2+ + Mg2+ + K+ + Na+ [mmol(+)·kg−1]
BC and Hh were used for CEC calculation:
CEC = BC + Hh [mmol(+)·kg−1]
The effect of the application of NPK, FYM and Act on the soil parameters and biomass yields in comparison to the Ctr was calculated according to the formula [33]:
2.4. Plant Analyses and Calculations of the Elemental Uptake
After determining the plant dry-matter yield, the material was ground to prepare the samples for the determination of the N, P and K contents. The N content was determined by the Kjeldahl method on a Kjeltec 2300 (FOSS) apparatus. The P and K contents was determined using ICP–OES on a Perkin Elmer Optima 7300 DV apparatus. The material was mineralised in a muffle furnace (8 h, 450 °C), evaporated using a hydrochloric acid (HCl) solution, and the remains were dissolved in a nitric acid (HNO3) solution [28]. The uptake of each particular element was calculated by multiplying the amount of yield by the element content in that yield.
2.5. Statistical Analyses
The statistical calculations were performed using Statistica PL v.13 software [34]. The means and standard deviations were computed in order to present the general characteristics of the soil and plant properties. The significance of the differences between the means was estimated using the Bonferoni test (p < 0.05). Correlations between selected soil parameters were calculated using a Pearson test, significant at p < 0.05.
Soil parameters and their weighting factors were selected for the calculation of the SQI using principal component analysis (PCA). Prior to the PCA, the normal distribution of the variables (Shapiro–Wilk test) and the homogeneity of variance (Levene test) were checked. In cases where the distribution data were not normal, log transformation was used to normalise the data. When the variables were highly correlated, the variable with the highest loading factor was selected.
In order to determine similarities between the soils studied, a hierarchical cluster analysis was employed, using the Ward method, which included pH, Ca2+, Mg2+, Na+, K+, available P, K, DHA, TC, TN, CHAs, CRe and the N, P and K contents in maize.
2.6. Soil Quality Index Calculation
The SQI was calculated based on Masto et al. [35] and Sinha et al. [36], according to the Equation:
where ω is the load factor of the soil parameters selected as a result of the PCA within a given factor and S is the soil property score, calculated in order to convert the real individual soil property values into a score defined by a sigmoidal curve, which had one asymptote going to 1 and the other going to 0. A score was calculated according to the Equation:
where x is the value of the soil property, a reflects the maximum value (a = 1.0), x0 is the average value of each soil parameter and b is the value of the equation slope.
3. Results
3.1. Basic Soil Properties
The properties of the soils prior to the experiment are presented in Table 1. They have been described in detail in previous publications [24,37].

Table 1.
Soil characteristics before establishing the experiment.
At the end of the first growing period, the pH values measured in the coarse-textured soil ranged from 4.6 (NPK) to 5.4 (Act2), and in the medium-textured soil, they ranged from 4.8 (NPK) to 5.4 (Act2). In both soils and years, with Act2, increases in pH of about 10% in relation to the Ctr and 12% in relation to the NPK were recorded (Table 2).
Table 2.
Values of pH, content of TC and TN (mean ± SD *) in soils after the first and second years of the experiment.
The TC content in the coarse-textured soil ranged from 0.89 (Ctr) to 1.08% (Act2) after the first growing period, and from 0.92 (Ctr) to 1.16% (Act2) after the second year of the experiment. In the medium-textured soil, the TC varied from 0.92 (Ctr) to 1.05% (Act2) at the end of the first growing period, and from 0.92 (Ctr) to 1.12% (Act2) at the end of the second growing period. Regardless of the dose, the TC content after Act application was generally higher than in the Ctr. In the coarse-textured soil, the TC changed from 17 to 21% with respect to the Ctr after the first year, and from 13 to 26% after the second year. In the medium-textured soil, these changes were from 4 to 13% at the end of the first year, and 12 to 22% at the end of the second year of the experiment. After the first year, the TC content with both Act doses (in both soils) was similar to the TC content with NPK and FYM. After the second year, only a double dose of Act increased the TC content compared to NPK and FYM (Table 2).
The application of Act increased the CHAs extracted from the SOM. In the coarse-textured soil, in both years of the experiment, after applying both doses of Act, higher CHA contents were found in relation to not only the Ctr but also FYM. In the medium-textured soil, the CHA contents with both Act1 and Act2 were higher compared to their contents in the Ctr, but only with Act2 were the CHA contents higher than with FYM (Figure 1a,b).
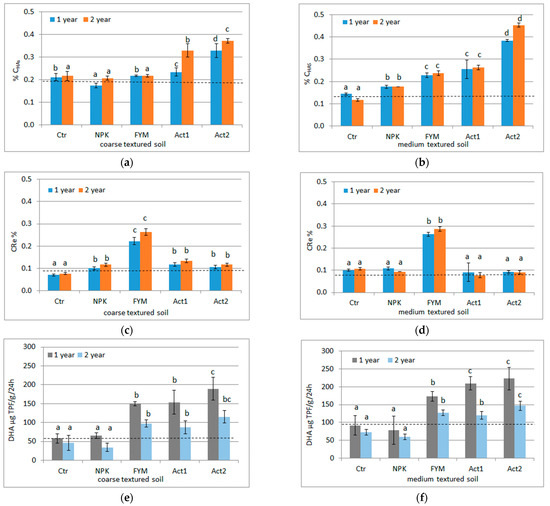
Figure 1.
CHAs (a,b), CRe (c,d) and DHA (e,f) respectively in coarse- and medium-textured soils, and their changes after the first and second years of the experiment (means and SD); Ctr –control, NPK–NPK treatment, FYM–FYM treatment, Act1–single humic acid treatment, Act2–double dose of humic acid treatment. A dashed line indicates soil parameters before the experiment was set up. Statistically significant differences between treatments (Ctr, NPK, FYM, Act1, Act2) separate in the first and second years of the experiment are marked with different letters (α ≤ 0.05).
The highest CRe content in both soils and in both years was found after the application of FYM. In the coarse-textured soil (in both years), the lowest CRe content was found in the Ctr, whereas in the treated soil (except for FYM), the CRe content was similar. In the medium-textured soil, the CRe content in all the samples (except for FYM) was similar (Figure 1c,d).
The TN content in the coarse-textured soil ranged from 0.079 (NPK) to 0.099% (Act2) after the first growing period, and from 0.062 (Ctr) to 1.137% (Act2) after the second growing period. In the medium-textured soil, the TN varied from 0.083 (Ctr) to 0.093% (Act2) and from 0.064 (Ctr) to 1.106% (Act2), respectively, after the first and second growing periods. The highest TN content was found in the coarse-textured soil after the application of a double dose of Act after the second year (Table 2).
The CEC in both soils was higher at the end of the first than after the second year, ranging from 64.5 (NPK) to 77.3 mmol(+)∙kg−1 (Act2) in the coarse-textured soil after the first growing period, and from 57.0 (Ctr) to 65.9 (Act2) mmol(+)∙kg−1 after the second growing period. In the medium-textured soil, the CEC ranged from 66.5 (NPK) to 89.5 (Act2) and from 64.1 (Ctr) to 75.4 (Act2) mmol(+)∙kg−1, respectively, at the end of the first and second growing periods. In the coarse-textured soil, higher CEC values in relation to the Ctr were recorded at the end of both years of the experiment with Act2, whereas with Act1, this was the case only in the second year. The double dose of Act increased the CEC in relation to its value with FYM, but only in the second year of the experiment. In the medium-textured soil, higher CEC values in relation to their values in the Ctr were recorded after the application of both doses of Act, whereas in relation to their values with FYM, this effect was only observed after the application of a single dose of Act in the second year, and after a double dose of Act in both years of the experiment (Table 3).
Table 3.
CEC and available forms of K and P (mean ± SD *) in soils after the first and second years of the experiment.
After the application of Act, by the end of the first year of the experiment, the content of available K had increased from 69.7 (Ctr) to 644.6 mg·kg−1 (Act2) in the coarse-textured soil (about an eightfold increase) and from 102.9 (Ctr) to 737.6 mg·kg−1 (Act2) in the medium-textured soil (about a six-fold increase). At the end of the second year of the experiment, the bioavailable K content with Act2 showed approximate seven- and fourfold increases compared to the Ctr in the coarse- and medium-textured soils, respectively. The K content with Act2 was also higher in relation to its content with NPK and FYM in both soils and in both years of the experiment (Table 3).
In the coarse-textured soil, the addition of humic substances also contributed to an increase in bioavailable P, with from 180.5 (Ctr) to 411.1 mg·kg−1 (Act2) noted at the end of the first year, and 116.4 (Ctr) to 292 mg·kg−1 (Act2) at the end of the second year. In the medium-textured soils, the P content increased from 143.5 (Ctr) to 363.8 mg·kg−1 (Act2) after the first growing period, and from 111.7 (Ctr) to 234.6 mg·kg−1 (Act2) after the second growing period. In both soils and years, the P content was the highest with Act2, being higher at the end of the first year than at the end of the second year. In both soils, the increase in P content with Act2 in relation to its increase with NPK and FYM was above 80% after the first year and around 60% after the second year (Table 3).
In the coarse-textured soil, the DHA ranged from 57 (Ctr) to 189 µg TPF g−1·24 h−1 (Act2) after the first growing period, decreasing after the second year, and being the lowest with NPK (34 µg TPF g−1·24 h−1) and the highest with Act2 (115 µg TPF g−1·24 h−1). In the medium-textured soil, the DHA activity was higher than in the coarse-textured soil, being in the range of 78 (NPK) to 223 µg TPF g−1·24 h−1 (Act2) after the first year and decreasing in the second year with a range from 60 (NPK) to 147 µg TPF g−1·24 h−1 (Act2). Greater changes in DHA were observed with Act in relation to the Ctr in the coarse-textured soil than in the medium-textured soil (Figure 1e,f).
3.2. Maize Yield Biomass, Chemical Composition and Elemental Uptake by Plants
The total maize biomass yield (from the two years of the experiment) is shown in Figure 2a,b. The application of Act resulted in an overall increase in the maize biomass yield from both soils in comparison to the Ctr and FYM, with the highest increase (about 200%) being between the Ctr and both Act1 and Act2.

Figure 2.
Sum of plant dry masses after two years of the experiment on (a) coarse-textured and (b) medium-textured soils. Soil treatment abbreviations as in Figure 1. Statistically significant differences between treatments (Ctr, NPK, FYM, Act1, Act2) separate for the coarse- and medium-textured soils are marked with different letters (α ≤ 0.05).
The N content in the maize shoots (cultivated in both soils and both years) ranged from 4.86 to 8.52 g N∙kg−1 d.m., whilst in the roots, it ranged from 4.12 to 8.88 g N∙kg−1 d.m. (Table 4). The highest N content was recorded in the shoots and roots of the maize fertilised with NPK (except for the plants grown in the medium-textured soil in the second year, where differences between the treatments were small).
Table 4.
Nitrogen, phosphorous and potassium content in maize.
The P content in the maize shoots (grown in both soils and both years) ranged from 1.78 to 6.07 g P∙kg−1 d.m., whilst in the roots, it ranged from 1.57 to 6.90 g P∙kg−1 d.m. (Table 4). For K, the content in the maize shoots (grown in both soils and both years) ranged from 16.7 to 44.6 g K∙kg−1 d.m., whilst in the roots, it ranged from 8.0 to 28.4 g K∙kg−1 d.m. (Table 4). The P and K contents in the maize parts differed between years and soils. However, the beneficial effect of Act1 and Act2 on the P and K contents in maize was notable (especially in the medium-textured soil, but also, to a lesser extent, in the coarse-textured soil).
The uptake of N, P and K was higher from the amended soils than from the non-amended soils (Ctr) (Figure 3a–c). The greatest differences between the amended treatments were observed for the P and K uptake, with the highest uptake recorded after the application of Act. The uptake of P in the coarse-textured soil increased approximately fourfold with both Act1 and Act2, whereas in the medium-textured soil, the P uptake also increased fourfold with Act1, but about sevenfold with Act2, compared to the uptake of P in the Ctr. Similar increases were observed in the K uptake. In the coarse-textured soil, the increase in K uptake with both Act1 and Act2 was about fourfold, whereas in the medium-textured soil, it was similar with Act1, but about 5.5 times higher with Act2 in relation to the Ctr.
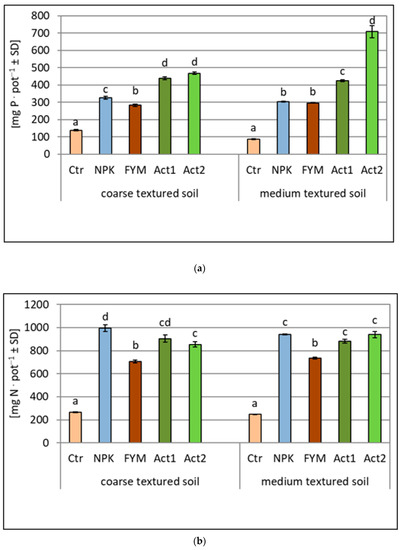
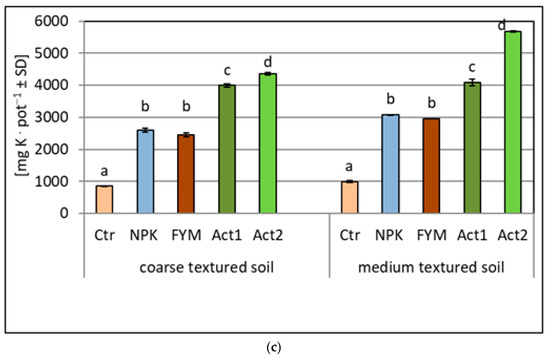
Figure 3.
Amount of nitrogen (a), phosphorus (b) and potassium (c) taken up by maize within two years of the experiment (means and SD). Statistically significant differences between treatments (Ctr, NPK, FYM, Act1, Act2) separate for the coarse- and medium-textured soils are marked with different letters (α ≤ 0.05).
3.3. Soil Quality Index and Hierarchical Cluster Analysis
The SQI was calculated according to Equation (4), using the results of the PCA (Table 5):
where each numerical value corresponds to the appropriate weighting factor assigned to the soil parameter. Standardisation of the scales was performed:
where the denominator of the fraction is the sum of all the weights obtained, which led to the final form of the SQI:
SQI = 0.4388 ∗ CEC + 0.4388 ∗ DHA + 0.1923 ∗ K+ + 0.1724 ∗ P + 0.1742 ∗ CHAs + 0.1257 ∗ Cre
Normalised weights = ωi/1.1016
SQI = 0.3983 ∗ CEC + 0.3983 ∗ DHA + 0.1746 ∗ K+ + 0.1565 ∗ P + 0.1565 ∗ CHAs + 0.1141 ∗ Cre
Table 5.
Results of the principal component analysis of the main soil parameters.
The application of Act increased the SQI values calculated at the end of the experiment. Regardless of soil texture, these values were ranked as follows: Ctr < NPK < FYM < Act1 < Act2. However, the SQI values for the medium-textured soil were always higher than for the coarse-textured soil. In the coarse-textured soil, the increase in SQI values in comparison to the Ctr was greater (by 59% with Act1 and 102% with Act2) than in the medium-textured soil (by 55 and 73%, respectively, with Act1 and Act2) (Figure 4).
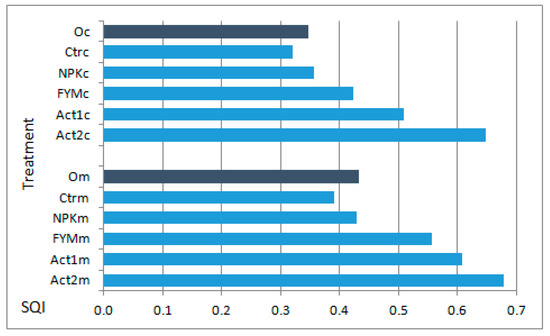
Figure 4.
SQI of coarse textured (c) and medium textured soil (m) before setting up the experiment (Oc and Om) and after the two years of the experiment. Soil treatments abbreviations as in Figure 1.
Using selected results for the soil and plant parameters (see Section 2), obtained at the end of the experiment, a hierarchical cluster analysis was conducted, using Euclidean distance as a measure of the treatment affinities. In both the coarse- and medium-textured soils, the first cluster grouped FYM with NPK as the most similar, with the smallest distance between their binding (10 and 12, respectively). The Ctr was connected to these, followed by Act1, with increasing distances. In the coarse-textured soil, the binding distance of Act1 was 27, while in the medium-textured soil, it was 36 (Figure 5a,b). However, independent of texture, the greatest difference was between Act2 and the other treatments, with a binding distance of 100.
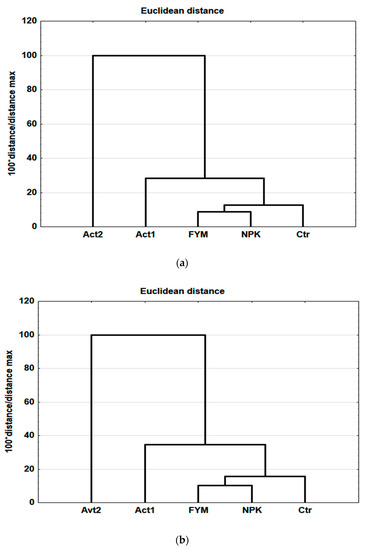
Figure 5.
Hierarchical cluster analysis (Ward method) based on the results obtained after two years of the experiment, coarse-textured soil (a), medium-textured soil (b).
4. Discussion
4.1. Effect of Lignite Extract on Soil Properties
In our experiment, the application of Act, especially in a double dose, improved certain soil properties, including pH, TC, available K and P, and DHA. We observed an increase in pH with Act2, although the soils remained acidic. Similar changes in pH after HA application have been observed [24] under celery and leek cultivation, as well as by Arjumend et al. [5] and Tahir et al. [6] under wheat cultivation in pot experiments. This effect is probably due to the buffering capacities of the HAs, which resist changes in soil pH [5]. The highest percentage of change in TC content in both soils was found after the double Act application in the second year of the experiment. With these treatments, the TC content was also higher than with FYM. The maintenance of the increased TC content into the subsequent year of the experiment indicated a relatively slow mineralisation of the OM being introduced into the soil in the form of the lignite extract [38]. The application of Act also resulted in an increased CHA content, which is particularly important in acidic soils in humid climates, where precipitation is conducive to the washing out of humus from the surface horizons and its penetration into the soil profile [24]. Similar effects have been observed when a different soil additive based on lignite (Rekulter) was used in soil reclamation [39]. There have also been other reports of increased TC accumulation in soils following the application of lignite HA additives to soils under medicinal herb [23] or different tree species [40] cultivation. Increased soil organic carbon storage results from the high hydrophobic properties of additives containing lignite waste, which is not leached out from soils [41].
A significant increase in the available K, recorded after Act application to both soils, was the result of a greater amount of K being introduced with the Act, which contains about 1.5% K2O (according to the producer), compared to FYM, which is usually poor in this element (0.7%, on average). Such large increases in the K content with Act2 (eight- and sevenfold, respectively, at the end of the first and second years of maize cultivation) in the coarse-textured soil may be a little surprising because maize needs a great deal of K. When grown for grain, maize takes up 2.5 times more K than P, whereas when grown for silage, the use of K is even higher [37]. This significant increase in available K in the soils in our experiment, resulting from the application of Act, is consistent with the findings of Khaz et al. [16] in their study on lignite application to soil under maize cultivation. Similar results were also obtained by Turgay et al. [8] for broccoli and Selim and Mosa [42] for wheat cultivation.
After Act application, the available P content also increased, which may have resulted from the addition of HAs increasing the P availability through competition for P-binding sites and the solution of poorly soluble P in acidic soil [5,8,43]. Soil phosphates are often not available to plants because they react with iron (Fe) and aluminium (Al), and are held by the SOM. Adding chelating agents, such as HAs, can break the Fe and Al bonds between the soil phosphates and SOM, thus releasing phosphate (PO3) ions into soil solution. This process occurs naturally in the presence of humic substances or plant-root exudates, and applying humic substances to soil can stimulate this process, resulting in an increase in the plant-available P content [43].
The increase in DHA after the application of Act was mainly due to the increased availability of nutrients, with Act possibly being both a source of nutrients and contributing to the increase in nutrient concentrations in soil solution through a soil buffering reaction. A similar conclusion was drawn by Sugier et al. [23] and El-Sayed et al. [44] who analysed the effect of Act on the metabolic activity of microorganisms. In our study, the DHA was affected by the nutrient content, such as K, P and CHAs, because the level of DHA correlated positively with K (correlation coefficient r = 0.648), P (r = 0.729) and the CHAs (r = 0.538) at p < 0.05.
4.2. Effect of Act on Biomass Maize Yield, Chemical Composition and Elemental Uptake by Plants
In this study, the application of Act increased the K and P contents in the plants. The high contents of these elements in the plants and the high biomass yields resulted in high P and K uptake. The beneficial effects we observed of the use of humic substances on maize biomass yields, as well as on P and K content and uptake, can be explained as an interaction between humic substances and physiological and metabolic processes. The addition of humic substances stimulates nutrient uptake and cell permeability, and regulates the mechanisms associated with plant growth stimulation [18,45,46,47]. The use of humic substances also improves the physicochemical and biological environment of the soil, including the availability of some macro- and microelements and growth of the microbial biomass [22,48]. Suganya and Sivasamy [49] and Ciarkowska [50] found that the introduction of HAs improves soil structure, resulting in better water retention and increased nutrient supply and retention––especially in coarse-textured soils––which ensure better crop biomass yields. Such interactions confirm the similar and high biomass yields obtained with Act1 in the coarse-textured soil and with Act2 in the medium-textured soil in this study (Figure 6).
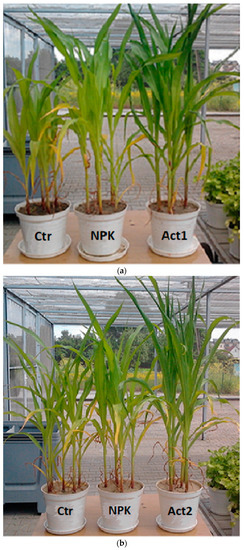
Figure 6.
Maize in the 7th-leaf phase in the first year of cultivation, on (a) coarse-textured soil and (b) medium-textured soil. With Act treatment, the maize specimens were approximately 40% (Act1 + coarse-textured soil) and 30% (Act2 + medium-textured soil) taller than in the Ctr, and they had typical leaf colouration and were more compact in shape. In the Ctr and with NPK treatment, we observed anomalies in plant development, dwarfism and insufficient (light green) colouring of the leaves.
The use of humic substances is known to have a positive effect on wheat [6] and celery and leek [24] biomass yields. Among the hypotheses explaining the beneficial effects of HAs on yield is their direct impact on the plant through the production of plant hormones, and indirectly through stimulation in the development and activity of microorganisms [17]. Increased elemental contents in plants after the application of humic substances have also been reported by Dinçsoy and Sönmez [51].
The application of Act increased N uptake in relation to the Ctr and FYM, resulting in an increase in maize biomass with both Act treatments. The uptake of N with Act1 and Act2 was similar to the uptake of N with NPK in medium-textured soil and a little higher in coarse-textured soil. The N uptake with FYM was much lower than with Act, probably because of the time-delayed release of the organic N pool from the manure. However, it is difficult to explain the slightly higher uptake of N with NPK than with Act, as observed in the coarse-textured soil, which was not reflected in a yield increase from treatment with mineral fertilisation. Omondi et al. [52] explained that this was likely related to the variety of N forms applied and their effect on plant physiological processes (photosynthesis).
4.3. Changes in Soils after Humic acid Application Expressed by the Soil Quality Index
The SQI value is considered to be an overall assessment of soil quality, reflecting the impact of the pattern of use [53,54]. The results of this experiment indicate that the application of a double dose of Act to the coarse-textured soil significantly increased the SQI value when compared to a single dose, whereas a similar increase in Act dosage was not as effective in the medium-textured soil. The limited reaction in the medium-textured soil may be due to its more favourable original soil conditions, as has been pointed out by Szczepanek and Wilczewski [55]. Verlinden et al. [56] considered the use of humic products under good soil conditions to be a cause of poor reactions in cultivated plants. The improvement in soil quality is of key importance in the case of coarse-textured soils, which are classed as poor soils with very low (<1.0%) and low (1.1–2.0%) soil C contents [3]. Our findings are in line with the results of a previous study concerning the impact of Act liquid amendment under celery and leek cultivation [24].
4.4. Combined Effects of Humic acid Application to Soils and Plants
Our findings from the two-year experiment indicate that the application of Act improved both the soil parameters and the total maize biomass yield. In addition, on one hand, the Act increased the uptake of K by the maize compared with other treatments, but on the other, despite the fact that maize is a K-loving crop, both soils amended with Act contained higher amounts of this element than the soils under other treatments. According to the fertilisation recommendations presented by Jadczyszyn et al. [57], a soil with such a high content of available K (over 330 mg·kg−1 in the coarse-textured soil and over 415 mg·kg−1 in the medium-textured soil) does not require fertilisation with that nutrient in the next growing period. Similarly, Act application increased the uptake of P. The highest uptake of this element was recorded in the medium-textured soil with Act2. This may be due to the higher pH value of this soil than the others. According to Jurga and Filipek [58], the availability of P increases with an increase in pH in the range of 5.0 to 5.5. In spite of the high uptake of P, there was still a high content of available P with Act2 (over 200 mg·kg−1), indicating there was no need to supply this nutrient in the next growing period [57]. However, if the P content is too high, there is a risk of limiting the uptake of micronutrients by plants, especially Fe and zinc (Zn), which are antagonistic to P [59]. To counteract this problem, Act has been enriched with various micronutrients (https://arctech.com/actosol.html accessed on 20 October 2021).
The cluster analysis showed that the effect of a single dose of Act was similar to the effect of FYM, but a double dose of Act made a substantial difference compared with the other treatments. The greatest binding distance between Act1 and Act2 was observed in the coarse-textured soil. Similar relationships were found between the SQI values in the soils studied. The application of Act to the coarse-textured soil caused a greater variation in the SQI values between Act1 and Act2 than between the respective treatments in the medium-textured soil (Figure 4 and Figure 5).
4.5. Environmental Implications of Adding Actosol to Soils
One of the possible effects of Act use on the environment may be linked to the substantial increase in the amount of available P in the humus horizons of agricultural soils. Phosphorus is considered to be a poorly soluble and mobile element, but there is a possibility that it could leach from the soil and cause eutrophication in local water bodies. However, the water-soluble P that can be leached represents only a small fraction of the available P. Phosphorus losses due to leaching under Polish conditions have been estimated at being around 0.2–0.5 kg P ha−1 [60]. In addition, the accumulation of P in the surface horizons of arable soils does not contribute to its leaching and accumulation in the lower horizons, as it is often sorbed chemically during its movement downwards through the soil profile [61]. It has also been noted that there is a decrease in microbial activity caused by excess P in soils [61]. Our results did not support such an observation. We noted a substantial increase in DHA in the soils following the addition of Act and, furthermore, DHA was positively correlated with available P. We also found an increased accumulation of C and humic acids in the soils after the introduction of Act. The accumulation of SOM is of particular environmental concern because it is essential in providing an energy source for the soil microbial communities that drive key soil ecological processes. Therefore, the introduction of humic compounds into the soil stimulates the activity of the soil microorganisms [23,48]. In addition, the storage of C in soil due to SOM stabilisation reduces the mineralisation of C, thus its change into CO2 and its release into the atmosphere, thus it helps to counteract climate change [34].
5. Conclusions
Through this study, we have proved the positive effect of lignite extract on selected coarse- and medium-textured soil parameters and SQIs in a 2-year pot experiment with maize cultivation. We found increases in the sorption properties, DHA, available K and P, TN, TC, CHAs, maize biomass yield, and the P and K contents and uptake in the plants. The positive effects of Act application on the sorption properties, DHA and P content remained for two years after its application, but were greater in the first year than in the second. The TC, CHAs and available K content were higher in the second year than in the first, after Act application, indicating the slow mineralisation of the OM introduced. The application of Act contributed to the accumulation of available K and P in the soils in amounts such that there was no need to supplement these elements in the next growing season. The effect of a single dose of Act on the SQI values was similar to the FYM effect, whereas the benefits of a double dose of Act were much greater.
The positive effect of the Act lignite extract on the properties of a coarse-textured soil with a low sorption capacity, which was poor in nutrients and low-yielding, and had a high susceptibility to degradation, is proof that its application is a useful option for improving soil quality, plant growth and C accumulation.
To sum up, this study has demonstrated the potential for using lignite waste as an effective soil additive on one hand, and as an environmentally friendly way to dispose of waste on the other. However, we are aware that the study was performed in a 2-year pot experiment, and therefore the results should be considered to be preliminary, requiring validation by studies performed under field conditions.
Author Contributions
B.F.-M. planned the experiments. K.S.-P., K.C. and B.F.-M. conducted the pot experiment. K.S.-P. carried out the statistical analysis, wrote the main manuscript text and prepared figures. All authors have read and agreed to the published version of the manuscript.
Funding
The work was partially supported by the Ministry of Science and Higher Education of the Republic of Poland (SUB 010013-DO11, 010013-DO14). The knowledge and skills acquired during the training “Multidimensional analyzes”, organised as part of the project: Integrated Program of the University of Agriculture of H. Kołłataj in Krakow, which is co-financed by the European Union under the European Social Fund, were used to develop the research results.
Institutional Review Board Statement
Not applicable.
Informed Consent Statement
Not applicable.
Data Availability Statement
The datasets analysed during the current study are available from the corresponding author on reasonable request.
Conflicts of Interest
The authors declare no conflict of interest.
References
- Ciarkowska, K.; Gambus, F.; Antonkiewicz, J.; Koliopoulos, T. Polycyclic aromatic hydrocarbon and heavy metal contents in the urban soils in southern Poland. Chemosphere 2019, 229, 214–226. [Google Scholar] [CrossRef] [PubMed]
- Ciećko, P. Report on the State of the Environment in Malopolskie Voivodship in 2016. 2017. Available online: https://www.krakow.pios.gov.pl (accessed on 2 November 2021). (In Polish)
- Pikuła, D. Environmental aspects of managing organic matter in agriculture. Stud. Ekon. I Reg. 2015, 8, 98–112. (In Polish) [Google Scholar]
- Kulczycka, J.; Pietrzyk-Sokulska, E.; Wirth, H. Sustainable production and consumption of mineral resources. Assessment of domestic lignite deposits as a raw material for obtaining humic and organic products. Proc. ECOpole 2011, 22, 44–53. (In Polish) [Google Scholar]
- Arjumend, T.; Abbasi, M.K.; Rafique, E. Effects of lignite-derived humic acid on some selected soil properties, growth and nutrient uptake of wheat (Triticum aestivum L.) grown under greenhouse conditions. Pak. J. Bot. 2015, 47, 2231–2238. [Google Scholar]
- Tahir, M.M.; Khurshid, M.; Khan, M.Z.; Abbasi, M.K.; Kazmi, M.H. Lignite-derived humic acid effect on growth of wheat plants in different soils. Pedosphere 2011, 21, 124–131. [Google Scholar] [CrossRef]
- Huculak-Mączka, M.; Hoffman, J.; Hoffman, K. Evaluation of the possibilities of using humic acids obtained from lignite in the production of commercial fertilizers. J. Soils Sediments 2018, 18, 2868–2880. [Google Scholar] [CrossRef]
- Turgay, O.C.; Karaca, A.; Unver, S.; Tamer, N. Effects of coal-derived humic substance on some soil properties and bread wheat yield. Commun. Soil Sci. Plant Anal. 2011, 42, 1050–1070. [Google Scholar] [CrossRef]
- Šimanský, V.; Šrank, D.; Jonczak, J.; Juriga, M. Fertilization and Application of Different Biochar Types and their Mutual Interactions Influencing Changes of Soil Characteristics in Soils of Different Textures. J. Ecol. Eng. 2019, 20, 149–164. [Google Scholar] [CrossRef]
- Księżak, J. Evaluation of yielding maize grown in short-term monoculture on of various soils. Fragm. Agron. 2013, 30, 103–111. [Google Scholar]
- Central Statistical Office (CSO 2001). Production of Agricultural and Horticultural Crops in 2000; Statistics Poland: Warsaw, Poland, 2001; p. 138. (In Polish) [Google Scholar]
- Central Statistical Office (CSO 2019). Production of Agricultural and Horticultural Crops in 2018; Statistics Poland: Warsaw, Poland, 2019; p. 91. (In Polish) [Google Scholar]
- Daur, I.; Bakhashwain, A.A. Effect of humic acid on growth and quality of maize fodder production. Pak. J. Bot. 2013, 45, 21–25. [Google Scholar]
- Olk, D.C.; Dinnes, D.L.; Callaway, C.; Raske, M. On-Farm Evaluation of a Humic Product in Iowa (US) Maize Production; USDA-ARS/UNL Faculty: Lincoln, NE, USA, 2013; pp. 1047–1050. Available online: https://digitalcommons.unl.edu/usdaarsfacpub/1292 (accessed on 7 November 2022).
- Eyheraguibel, B.J.; Silvestre, J.P.; Morard, P. Effects of humic substances derived from organic waste enhancement on the growth and mineral nutrition of maize. Bioresour. Technol. 2008, 99, 4206–4212. [Google Scholar] [CrossRef] [PubMed]
- Khan, M.Z.; Akhtar, M.E.; Ahmad, S.; Khan, A.; Khan, R.U. Chemical composition of lignitic humic acid and evaluating its positive impacts on nutrient uptake, growth and yield of maize. Pak. J. Chem. 2014, 4, 19–25. [Google Scholar] [CrossRef]
- Nuraly, A.; Xiaohui, Q.; Ilya, D.; Gulzhamal, A.; Perizat, U.; Azhar, Z. The effect of leonardite-derived amendments on soil microbiome structure and potato yield. Agriculture 2020, 10, 147. [Google Scholar] [CrossRef]
- Rose, M.T.; Patti, A.F.; Little, K.R.; Brown, A.L.; Jackson, W.R.; Cavagnaro, T.R. A meta-analysis and review of plant-growth response to humic substances: Practical implications for agriculture. Adv. Agron. 2014, 124, 37–89. [Google Scholar] [CrossRef]
- Emam, O.N.K. Usage of actosol (humic acid) and some growth regulators for improving plant quality of Chamaedorea Seifrizii, Burre. Sci. J. Flowers Ornam. Plants 2019, 6, 175–189. [Google Scholar] [CrossRef]
- Kandil, A.A.; Sharief, A.E.M.; Seadh, S.E.; Altai, D.S.K. Role of humic acid and amino acids in limiting loss of nitrogen fertilizer and increasing productivity of some wheat cultivars grown under newly reclaimed sandy soil. Int. J. Adv. Res. Biol. Sci. 2016, 3, 123–136. Available online: www.ijarbs.com/pdfcopy/apr2016/ijarbs18.pdf (accessed on 9 February 2022).
- Abd El-Razek, E.; Haggag, L.F.; El-Hady, E.S.; Shahin, M.F. Effect of soil application of humic acid and bio-humic on yield and fruit quality of “Kalamata” olive trees. Bull. Natl. Res. Cent. 2020, 12, 73. [Google Scholar] [CrossRef]
- Bezuglova, O.S.; Polienko, E.A.; Gorovtsov, A.V.; Lyhman, P.D.; Pavlov, P.D. The effect of humic substances on winter wheat yield and fertility of ordinary chernozem. J. Ann. Agrar. Sci. 2017, 15, 239–242. [Google Scholar] [CrossRef]
- Sugier, D.; Kołodziej, B.; Bielińska, E. The effect of leonardite application on Arnica montana L. yielding and chosen chemical properties and enzymatic activity of the soil. J. Geochem. Explor. 2013, 129, 76–81. [Google Scholar] [CrossRef]
- Ciarkowska, K.; Sołek-Podwika, K.; Filipek-Mazur, B.; Tabak, M. Comparative effects of lignite-derived humic acids and FYM on soil properties and vegetable yield. Geoderma 2017, 303, 85–92. [Google Scholar] [CrossRef]
- Arctech Inc. Actosol® Base Produced by American Company. Available online: https://arctech.com/actosol.html (accessed on 4 November 2021).
- WRB Recommendations Soil Resources Reports 106. FAO UN, Rome. 2014. Available online: www.fao.org/3/a-i3794en.pdf (accessed on 29 October 2021).
- Tan, K.H. Soil Sampling, Preparation and Analysis; Taylor & Francis Group: Boca Raton, FL, USA; London, UK; New York, NY, USA; Singapore, 2005; p. 408. [Google Scholar]
- Ostrowska, A.; Gawliński, S.; Szczubiałka, Z. Methods of Soil and Plant Analyses and Evaluation; Instytut Ochrony Środowiska: Warszawa, Poland, 1991; p. 234. (In Polish) [Google Scholar]
- Gorlach, E.; Mazur, T. Agricultural chemistry. In Basics of Nutrition and Principles of Fertilization; PWN: Warszawa, Poland, 2001; p. 347. (In Polish) [Google Scholar]
- Sohi, S.P.; Powlson, D.S.; Gaunt, J.L. A procedure for isolating soil organic matter fractions suitable for modelling. Soil Sci. Soc. Am. J. 2001, 65, 1121–1128. [Google Scholar] [CrossRef]
- Swift, R.S. Organic matter characterization. In Methods of Soil Analysis. Part 3. Chemical Methods—SSSA Book Series No.5 Soil Science Society of America and American Society of Agronomy; Soil Science Society of America, Inc.: Madison, WI, USA; American Society of Agronomy, Inc.: Madison, WI, USA, 1996; pp. 1011–1068. [Google Scholar] [CrossRef]
- Cassida, L.E.; Klein, D.A.; Santoro, T. Soil dehydrogenase activity. Soil Sci. 1964, 98, 371–376. [Google Scholar] [CrossRef]
- Podwika, M.; Solek-Podwika, K.; Ciarkowska, K. Changes in the properties of grassland soils as a result of afforestation. iForest 2018, 11, 600–608. [Google Scholar] [CrossRef]
- StatSoft Inc. Statistica (Data Analysis Software System), Version 13.3; StatSoft Inc.: Tulsa, OK, USA, 2019.
- Masto, R.E.; Chhonkar, P.K.; Singh, D.; Patra, A.K. Soil quality response to longterm nutrient and crop management on a semi-arid Inceptisol. Agric. Ecosyst. Environ. 2007, 118, 130–142. [Google Scholar] [CrossRef]
- Sinha, S.; Masto, R.E.; Ram, L.C.; Selvi, V.A.; Srivastava, N.K.; Tripathi, R.C.; George, J. Rhizosphere soil microbial index of tree species in a coal mining ecosystem. Soil Biol. Bioch. 2009, 4, 1824–1832. [Google Scholar] [CrossRef]
- Filipek-Mazur, B.; Tabak, M.; Żukowska, G.; Ciarkowska, K.; Sołek-Podwika, K. Characteristics of a humic acid preparation and its influence on plant yielding. Chem. Ind. 2019, 98, 920–923. (In Polish) [Google Scholar] [CrossRef]
- Sharif, M.; Khattak, R.A.; Sarir, M.S. Effect of different levels of lignitic coal derived humic acid on growth of maize plants. Commun. Soil Sci. Plant Anal. 2002, 33, 3567–3589. [Google Scholar] [CrossRef]
- Huculak-Mączka, M.; Hoffman, K.; Skut, J.; Hoffman, J. Assessment of humic substances content in selected raw materials and waste. Proc. ECOpole 2010, 4, 383–387. (In Polish) [Google Scholar]
- Tsetsegmaa, G.; Akhmandi, A.; Cho, W.; Lee, S.; Chandra, R.; Jeong, C.E.; Cia, R.W.; Kang, H. Effects of oxidized brown coal humic acid fertilizer on the relative height growth rate of three tree species. Forests 2018, 9, 360. [Google Scholar] [CrossRef]
- Spaccini, R.; Piccolo, A.; Conte, P.; Haberhauer, G.; Gerzabek, M.H. Increased soil organic carbon sequestration through hydrophobic protection by humic substances. Soil Biol. Biochem. 2002, 34, 1839–1851. [Google Scholar] [CrossRef]
- Selim, E.M.; Mosa, A.A. Fertigation of humic substances improves yield and quality of broccoli and nutrient retention in a sandy soil. J. Plant Nutr. Soil Sci. 2012, 175, 273–281. [Google Scholar] [CrossRef]
- Ifansyah, H. Soil pH and Solubility of Aluminum, Iron, and Phosphorus in Ultisols: The Roles of Humic Acid. J. Trop. Soils 2013, 18, 203–208. [Google Scholar] [CrossRef]
- El-Sayed, A.; El-Hanafy, H.; Nabih, S.A.; Atowa, D.I. Raising Freesia refracta cv. red lion corms from cormels in response to different growing media and actosol levels. J. Hort. Sci. Ornamen. Plants 2012, 4, 89–97. [Google Scholar]
- Jindo, K.; Martim, S.A.; Navarro, E.C.; Pérez-Alfocea, F.; Hernandez, T.; Garcia, C.; Aguiar, N.O.; Pasqualoto, L. Canellas. Root growth promotion by humic acids from composted and non-composted urban organic wastes. Plant Soil 2012, 353, 209–220. [Google Scholar] [CrossRef]
- Nardi, S.; Pizzeghello, D.; Muscolo, A.; Vianello, A. Physiological effects of humic substances on higher plants. Soil Biol. Biochem. 2002, 34, 1527–1536. [Google Scholar] [CrossRef]
- Qin, K.; Leskovar, D. Lignite-derived humic substance modulate pepper and soil-biota growth under water deficit stress. J. Plant Nutr. Soil Sci. 2018, 181, 655–663. [Google Scholar] [CrossRef]
- Amoah-Antwi, C.; Kwiatkowska-Malina, J.; Thornton, S.F.; Fenton, O.; Malina, G.; Szara, E. Restoration of soil quality using biochar and brown coal waste: A review. Sci. Total Environ. 2020, 722, 137852–137873. [Google Scholar] [CrossRef]
- Suganya, S.; Sivasamy, R. Moisture Retention and Cation Exchange Capacity of Sandy Soil as Influenced by Soil Additives. J. Appl. Sci. Res. 2006, 2, 949–951. [Google Scholar]
- Ciarkowska, K. Effect of fertilization on the structure of upland grassland soil. Pol. J. Environ. Stud. 2010, 19, 693–697. [Google Scholar]
- Dinçsoy, M.; Sönmez, F. The effect of potassium and humic acid applications on yield and nutrient contents of wheat (Triticum aestivum L. var. Delfii) with same soil properties. J. Plant Nutr. 2019, 42, 2757–2772. [Google Scholar] [CrossRef]
- Omondi, J.K.; Lazarovitch, N.; Rachmilevitch, S.; Yermiyahu, U.; Sperling, O. High nitrogen availability limits photosynthesis and compromises carbohydrate allocation to storage in roots of Manihot esculenta Crantz. Front. Plant Sci. 2019, 10, 1041. [Google Scholar] [CrossRef] [PubMed]
- Paz-Kagan, T.; Shachak, M.; Zaady, E.; Karnieli, A. Evaluation of ecosystem responses to land-use change using soil quality and primary productivity in a semi-arid area, Israel. Agr. Ecosyst. Environ. 2014, 193, 9–24. [Google Scholar] [CrossRef]
- Podwika, M.; Solek-Podwika, K.; Kaleta, D.; Ciarkowska, K. The Effect of Land-Use Change on Urban Grassland Soil Quality (Southern Poland). J. Soil Sci. Plant Nutr. 2020, 20, 473–483. [Google Scholar] [CrossRef]
- Szczepanek, M.; Wilczewski, E. Maize response to soil-applied humic substance and foliar fertilization with potassium. J. Anim. Plant Sci. 2016, 26, 1298–1303. [Google Scholar]
- Verlinden, G.; Pycke, B.; Mertens, J.; Debersaques, K.; Verheyen, K.; Baert, G. Application of humic substances results in consistent increases in crop yield and nutrient uptake. J. Plant Nutr. 2009, 32, 1407–1426. [Google Scholar] [CrossRef]
- Jadczyszyn, T.; Kowalczyk, J.; Lipiński, W. Fertilization Recommendations for Field Crops and Permanent Grasslands; IUNG-PIB: Puławy, Poland, 2010; p. 24. ISBN 978-83-7562-054-2. (In Polish) [Google Scholar]
- Jurga, B.; Filipek, A. The impact of selected agricultural practices on the availability of phosphorus for plants-a review of the literature. Stud. I Rap. IUNG-PIB 2017, 53, 55–66. (In Polish) [Google Scholar]
- Sapek, B. Soil phosphorus accumulation and release–sources, processes, causes. Water-Environ.-Rural. Areas 2014, 14, 77–100. (In Polish) [Google Scholar]
- Szymańska, M.; Szara, E.; Łabętowicz, J. Phosphorus cycle in polish agriculture. Fragm. Agron. 2008, 4, 152–161. (In Polish) [Google Scholar]
- Zhang, G.; Burghardt, W.; Gong, Z. Phosphorus-enriched soils of urban and suburban Nanjing and their effect on groundwater phosphorus. J. Plant Nutr. Soil Sci. 2001, 164, 295–301. [Google Scholar] [CrossRef]


Disclaimer/Publisher’s Note: The statements, opinions and data contained in all publications are solely those of the individual author(s) and contributor(s) and not of MDPI and/or the editor(s). MDPI and/or the editor(s) disclaim responsibility for any injury to people or property resulting from any ideas, methods, instructions or products referred to in the content. |
© 2023 by the authors. Licensee MDPI, Basel, Switzerland. This article is an open access article distributed under the terms and conditions of the Creative Commons Attribution (CC BY) license (https://creativecommons.org/licenses/by/4.0/).