

Integrated GIS and Fuzzy-AHP Framework for Suitability Analysis of Hybrid Renewable Energy Systems: A Case in Southern Philippines


Abstract
:1. Introduction
- To develop and use various socio-environmental and techno-economic suitability indices for determining suitable sites for a variety of renewable energy systems.
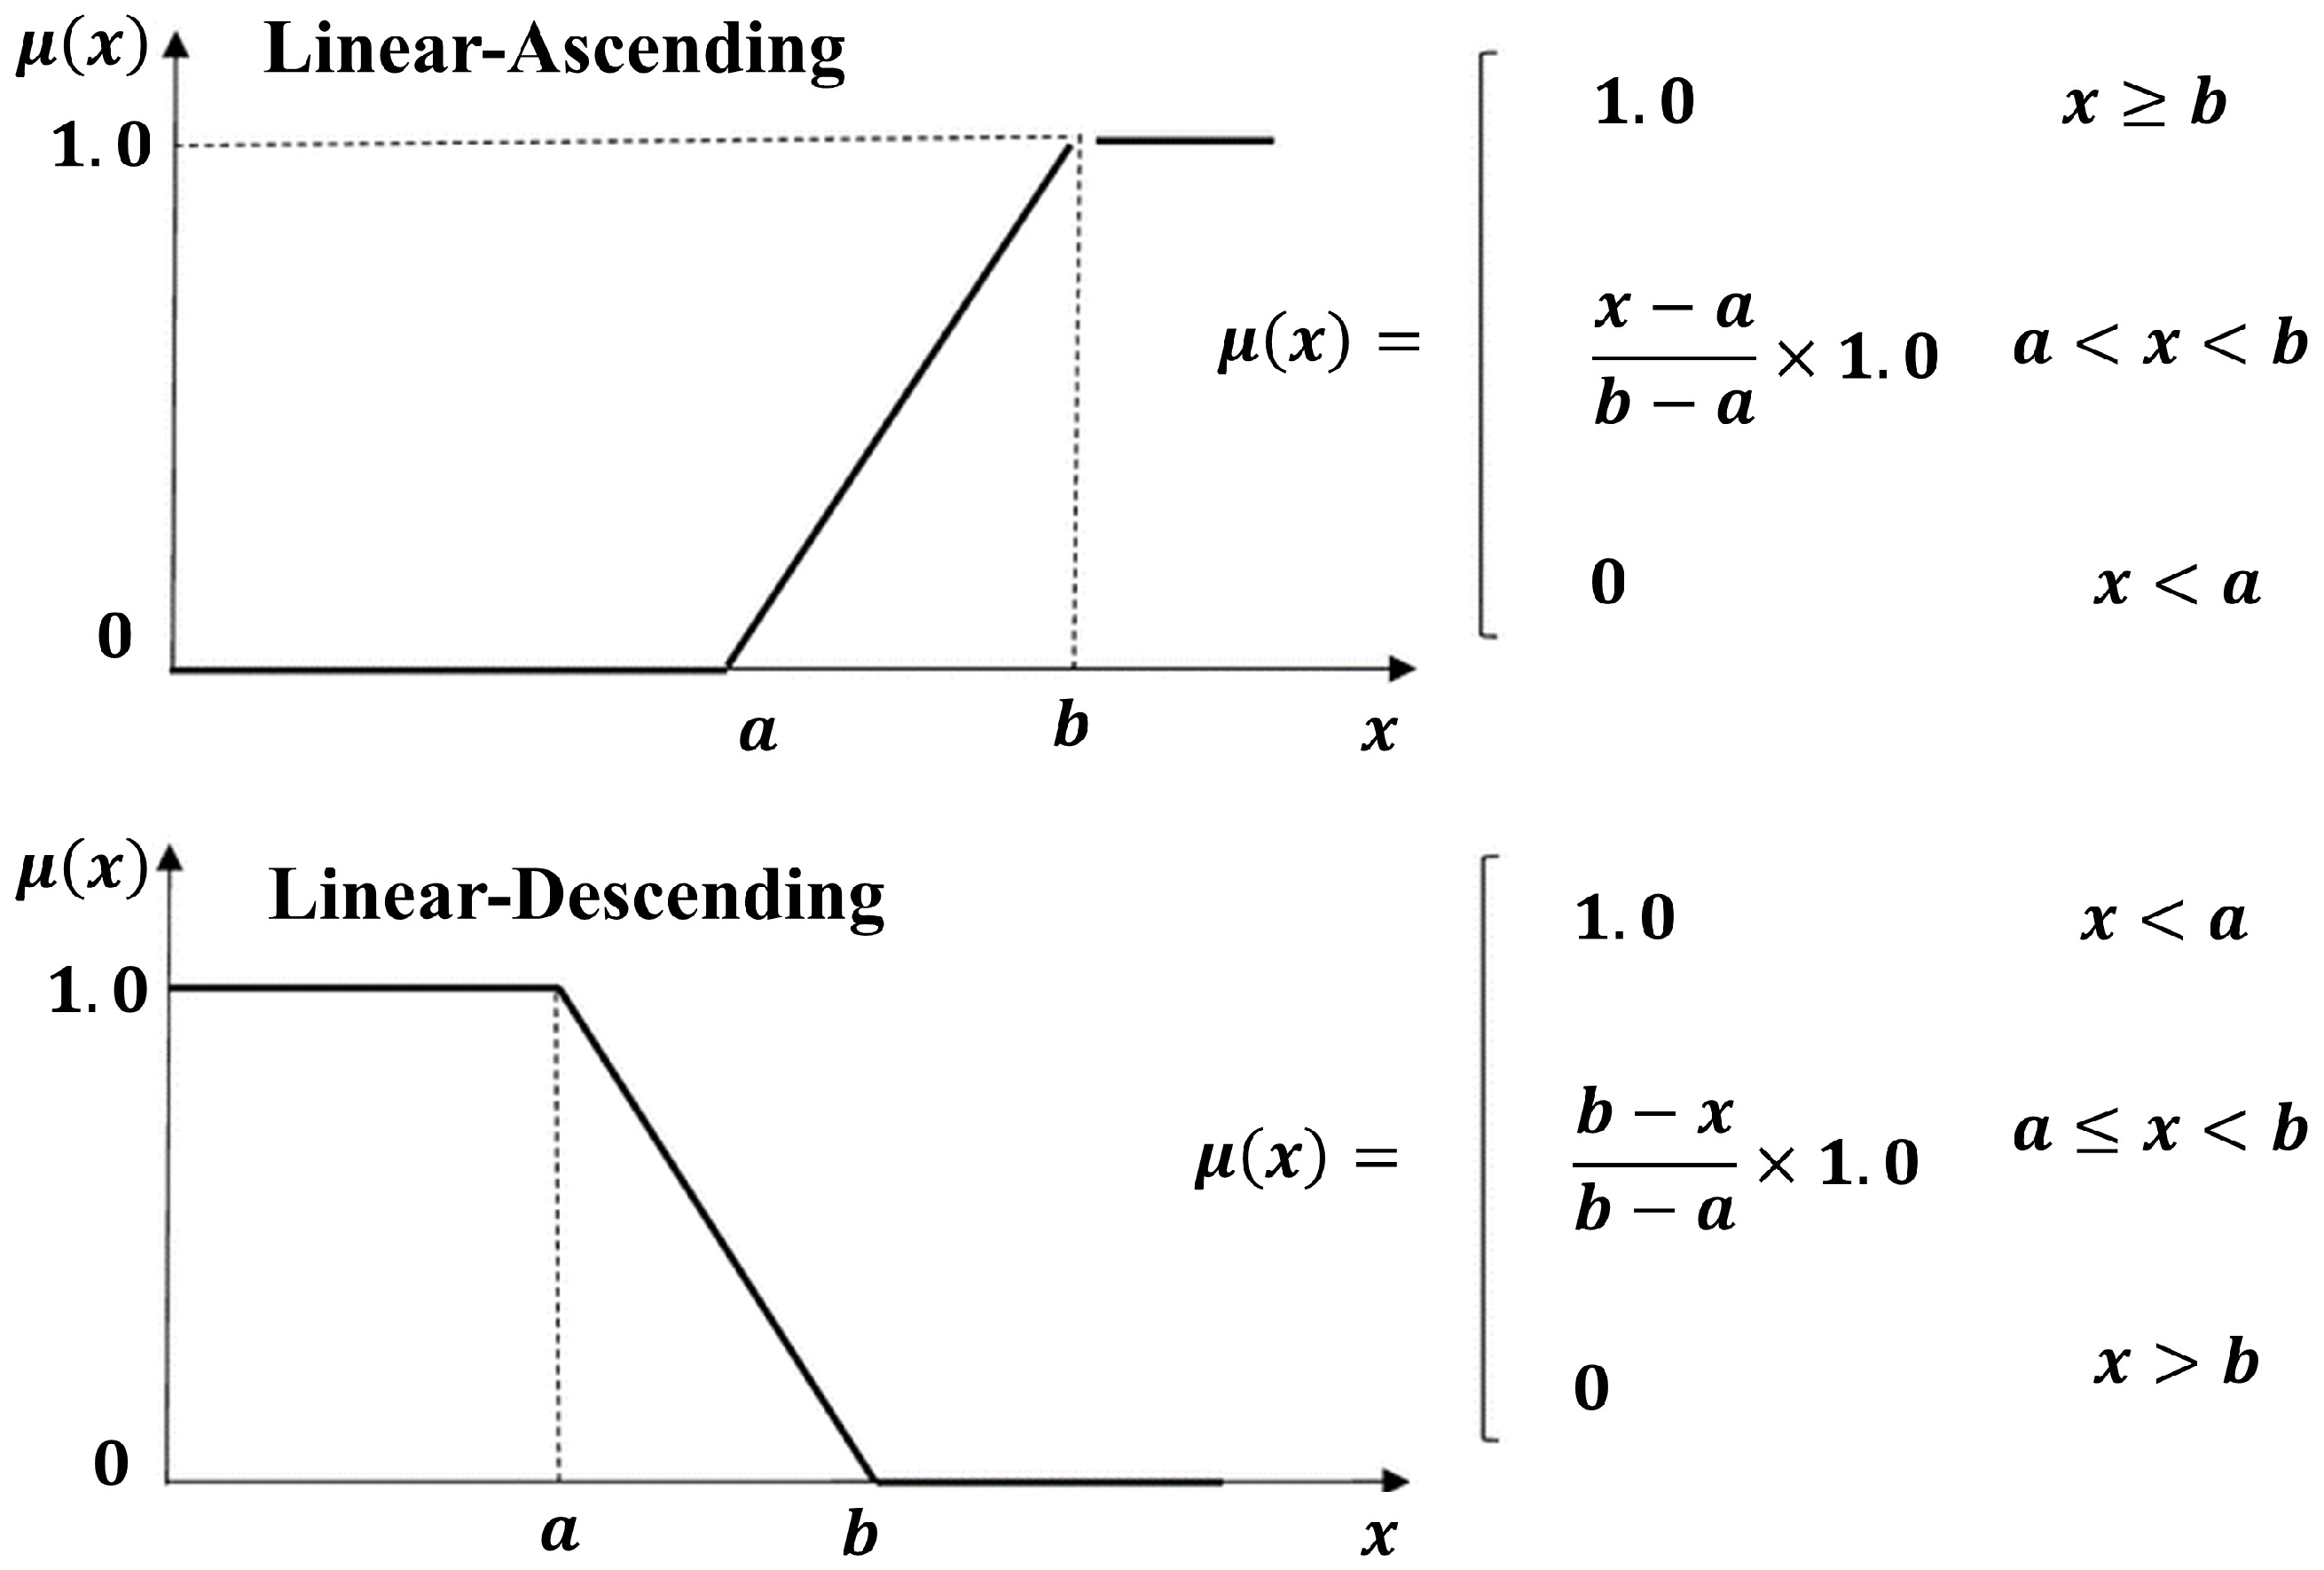
- To identify the membership function of criteria and apply the fuzzification process to each layer that corresponds to it. To determine the weight of each layer, as computed after reaching a consistency ratio that is considered to be adequate.
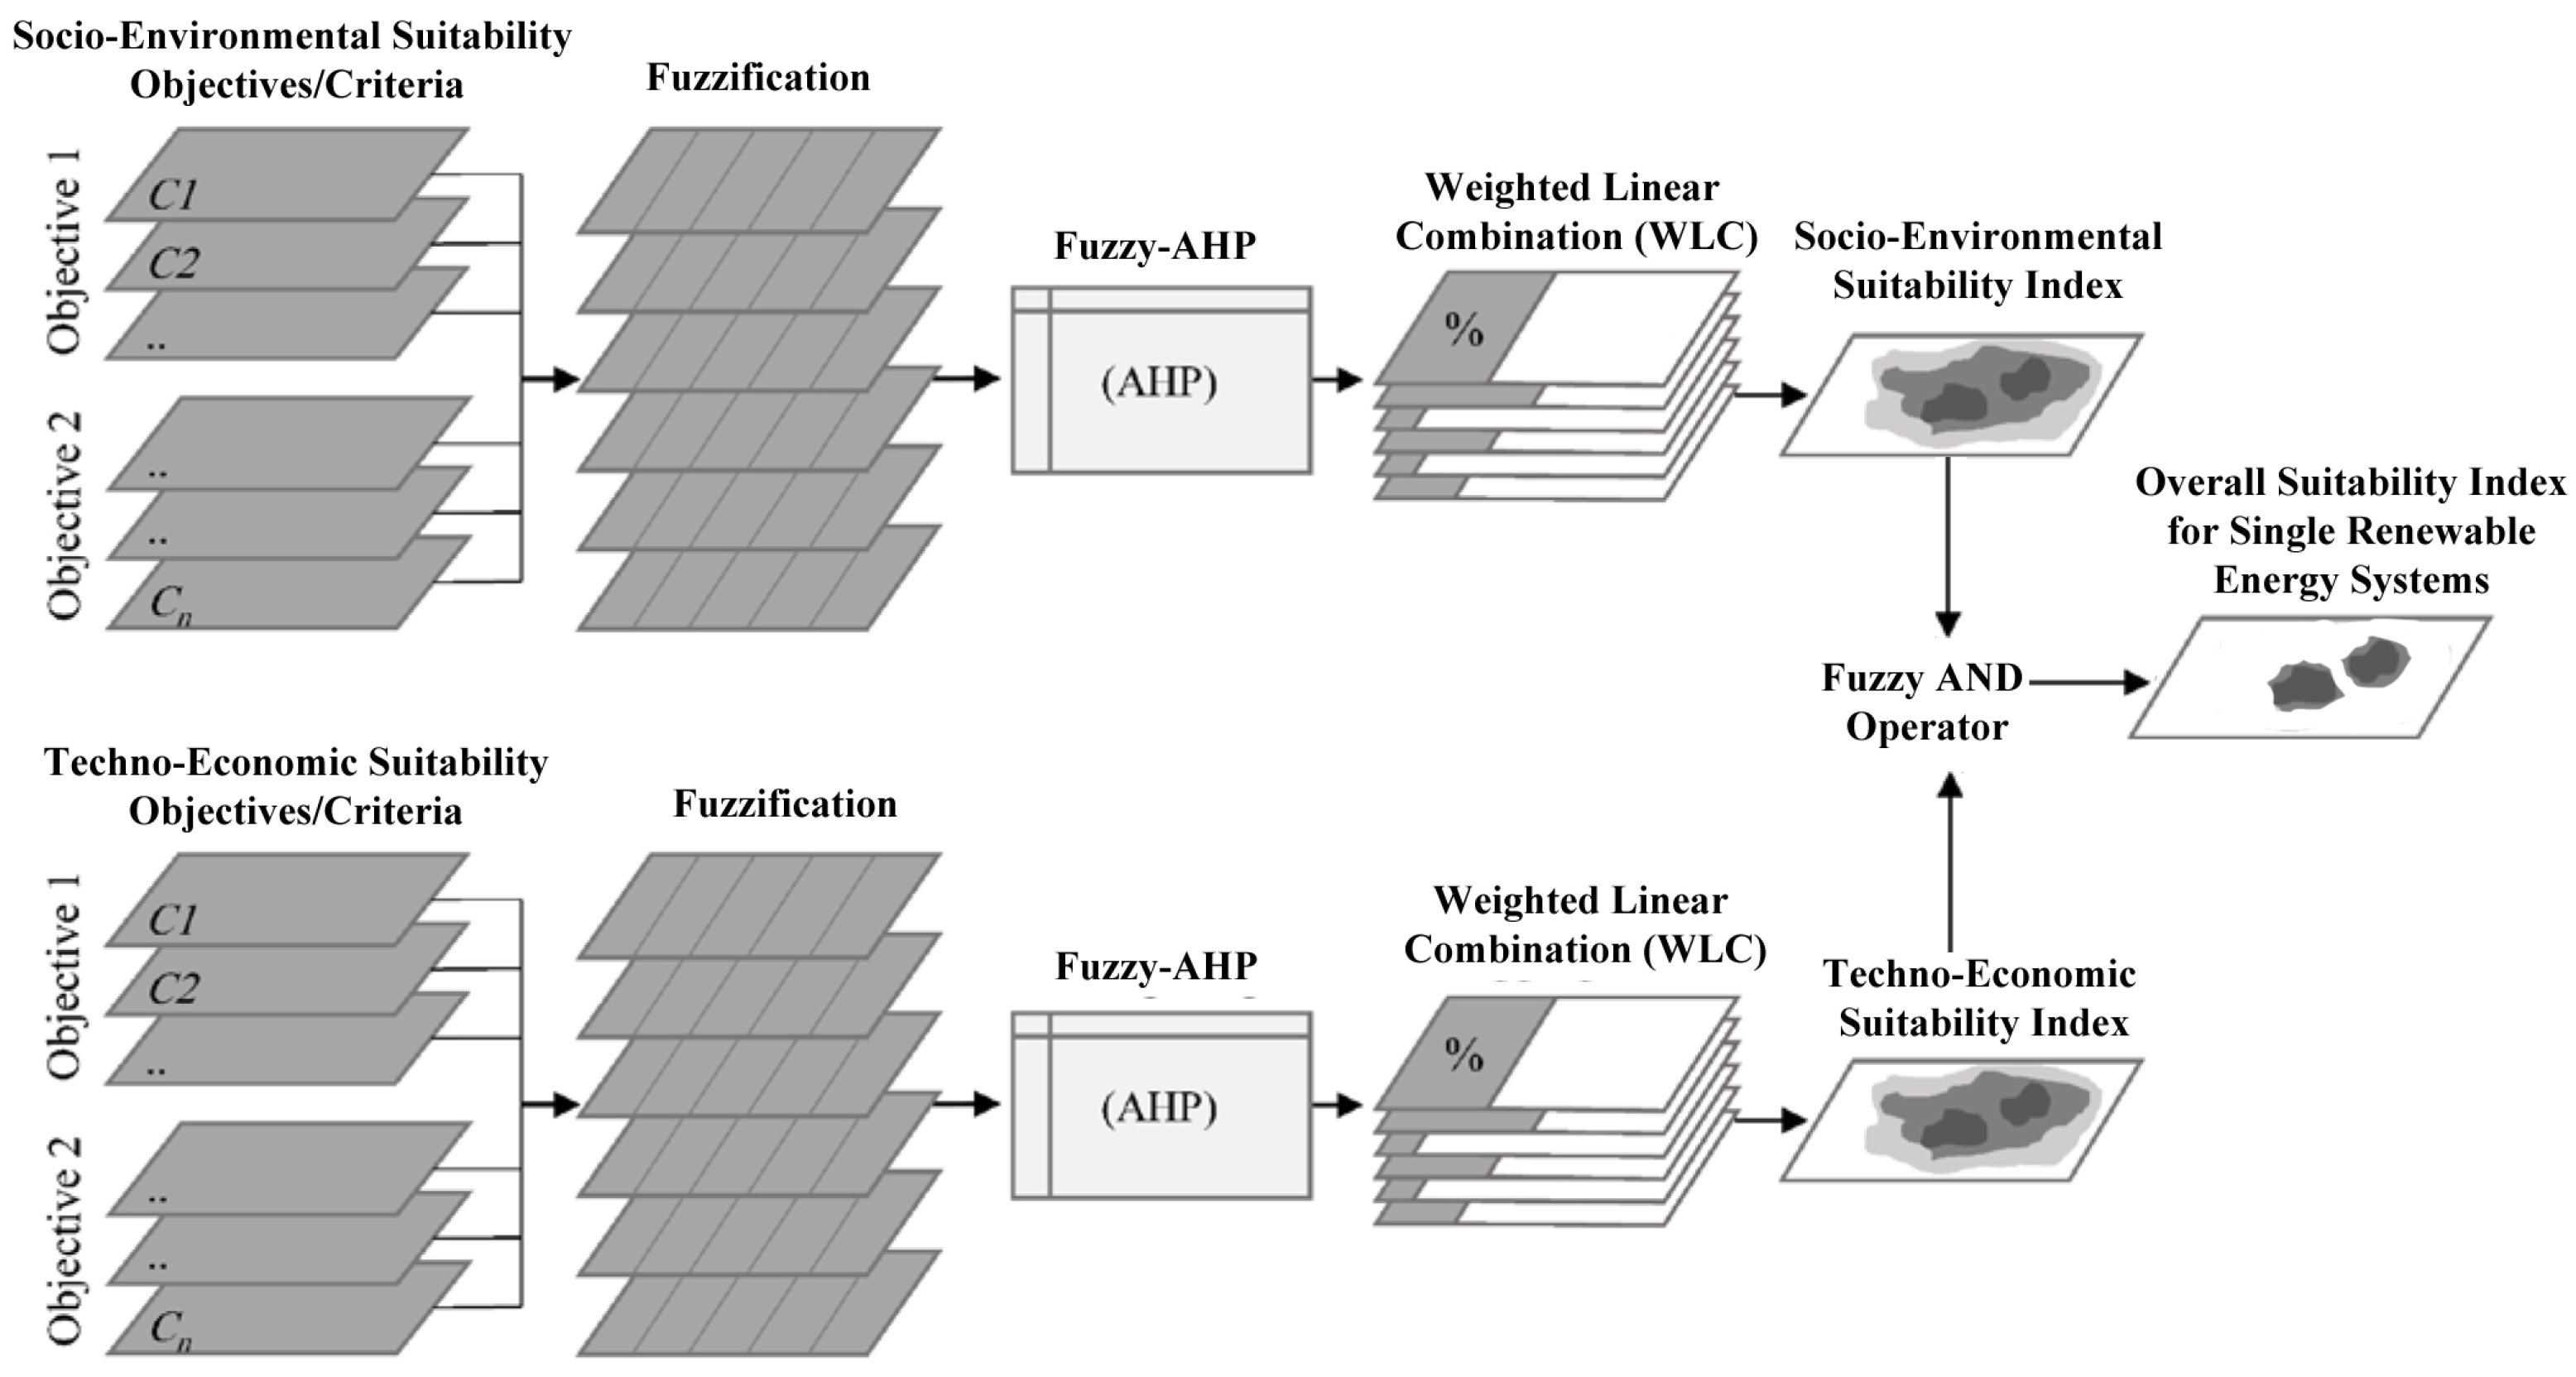
- To determine the different suitability indices for single and hybrid renewable energy systems using Weighted Linear Combination (WLC), fuzzy AND operator and site selection rules.
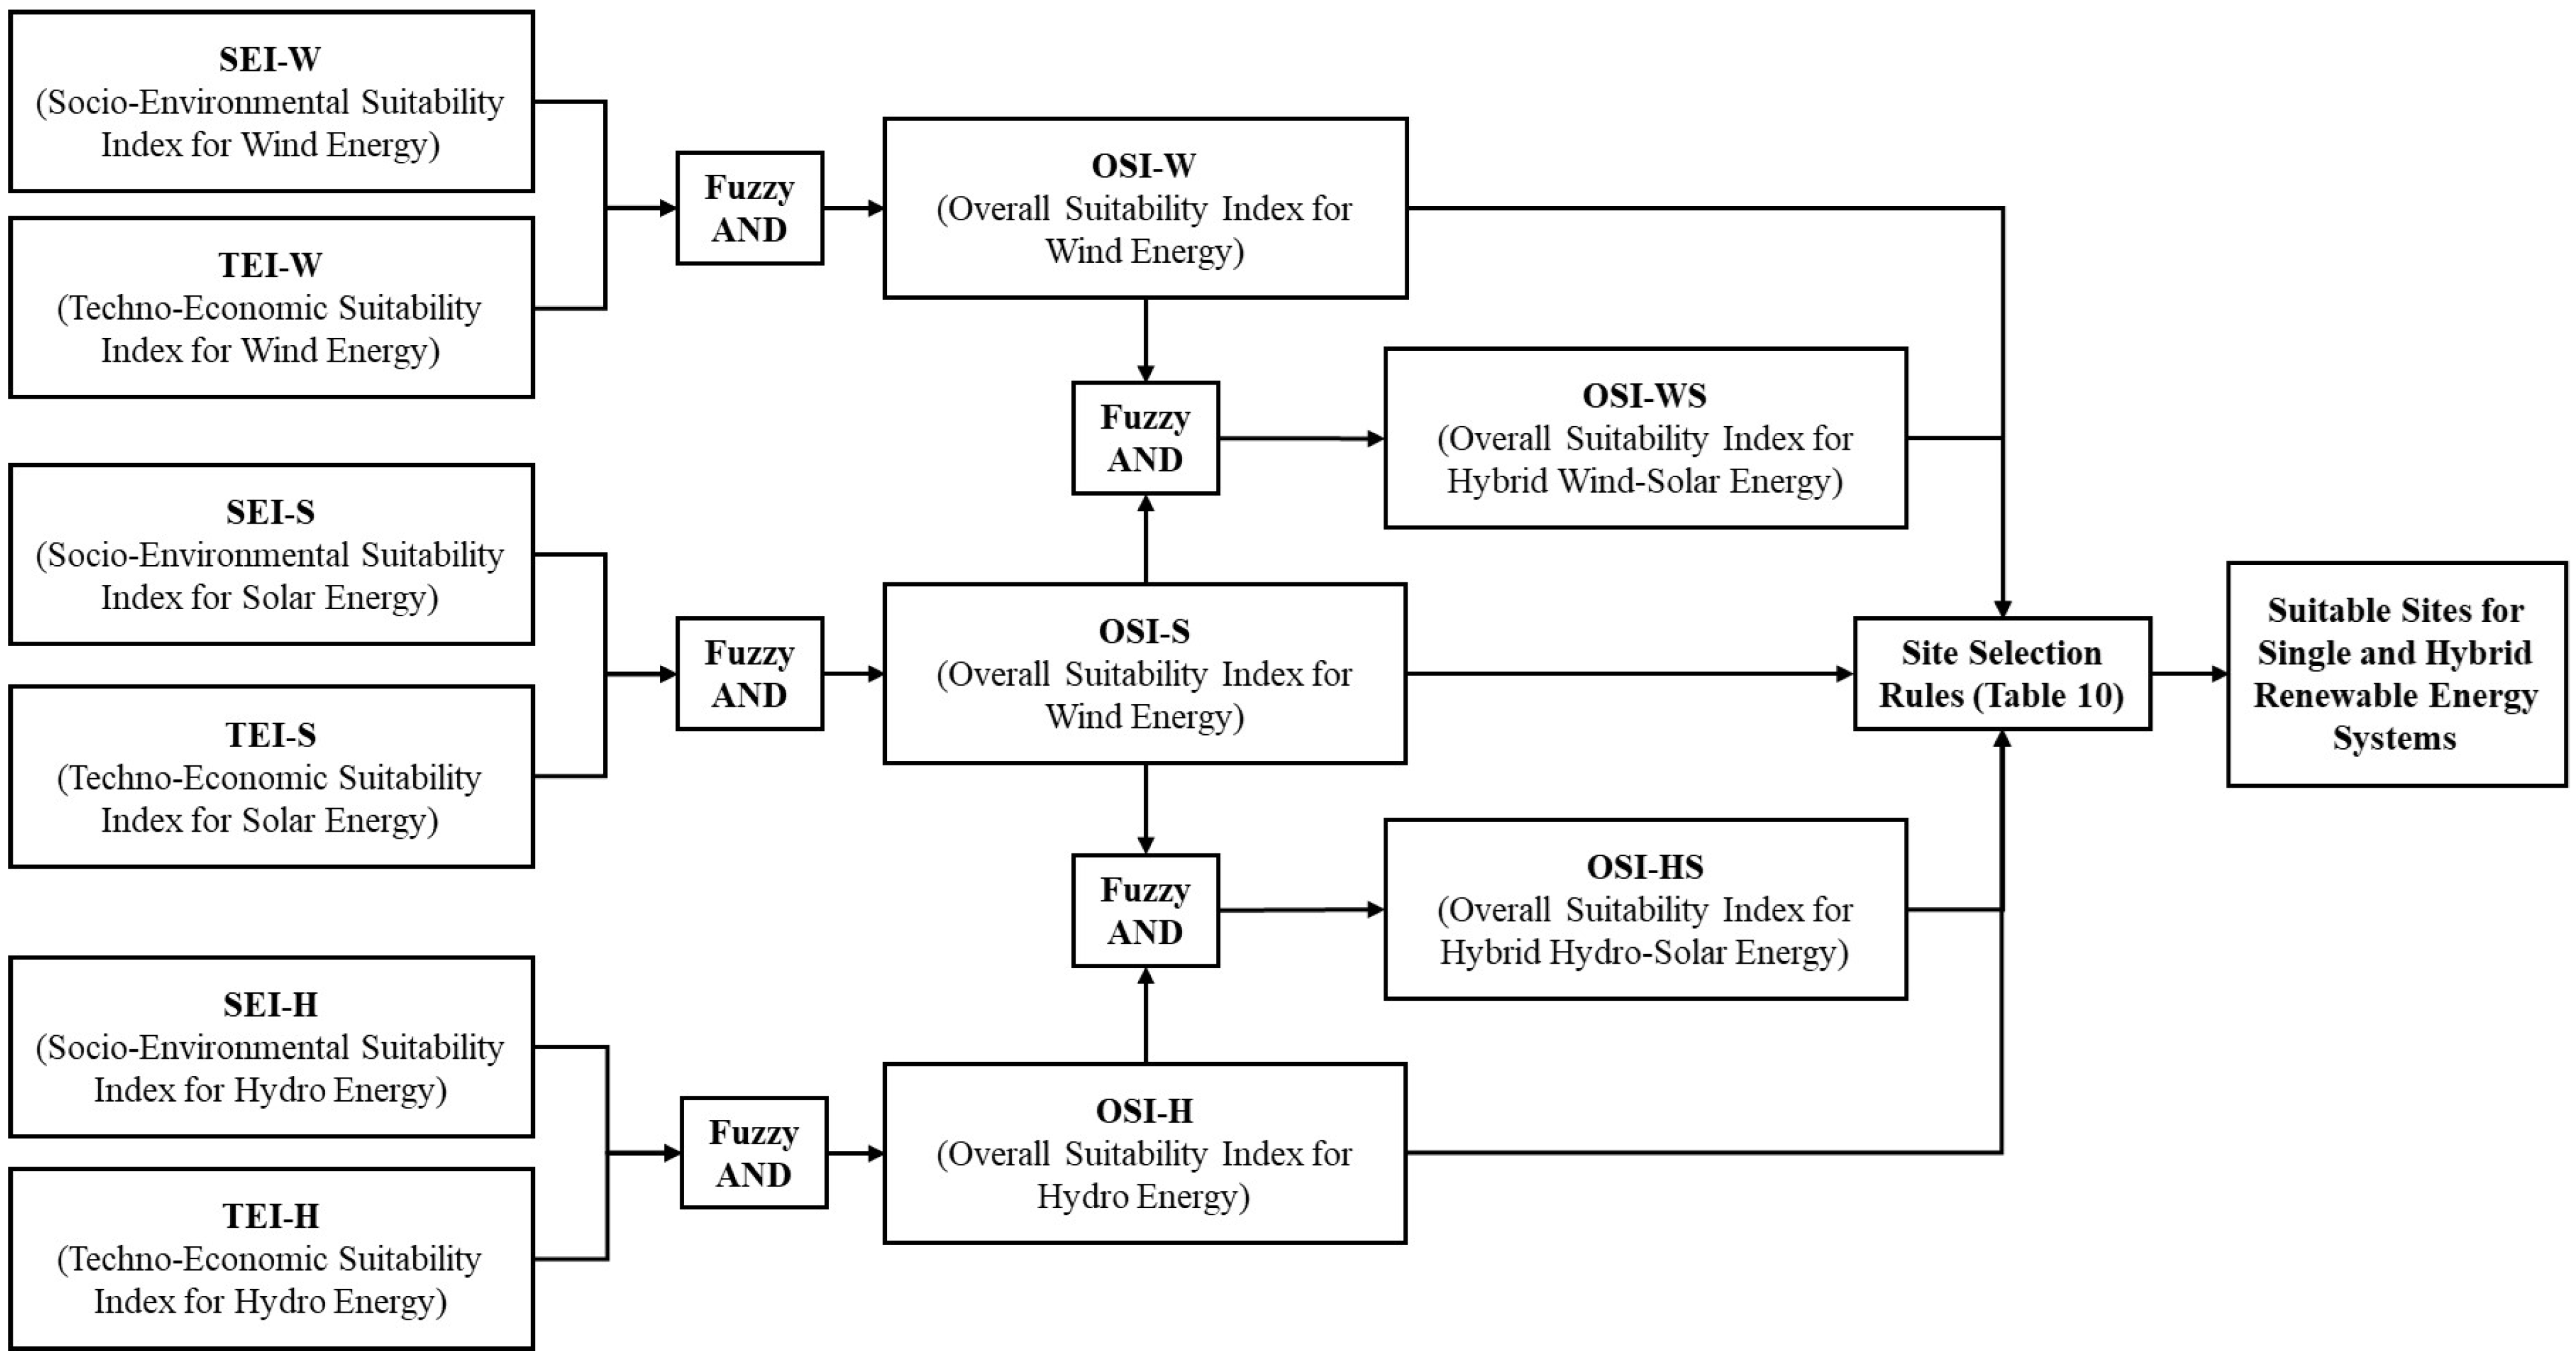
- To provide detailed potential sites for single renewable energy plants such as hydropower, wind and solar-PV systems, as well as potential locations for hybrid hydro–solar and hybrid wind–solar energy systems.
- To develop a strategy for selecting sites for hybrid renewable energy systems that can assist decision-makers and future investors in choosing areas that are feasible from a techno-economic and socio-environmental standpoint.
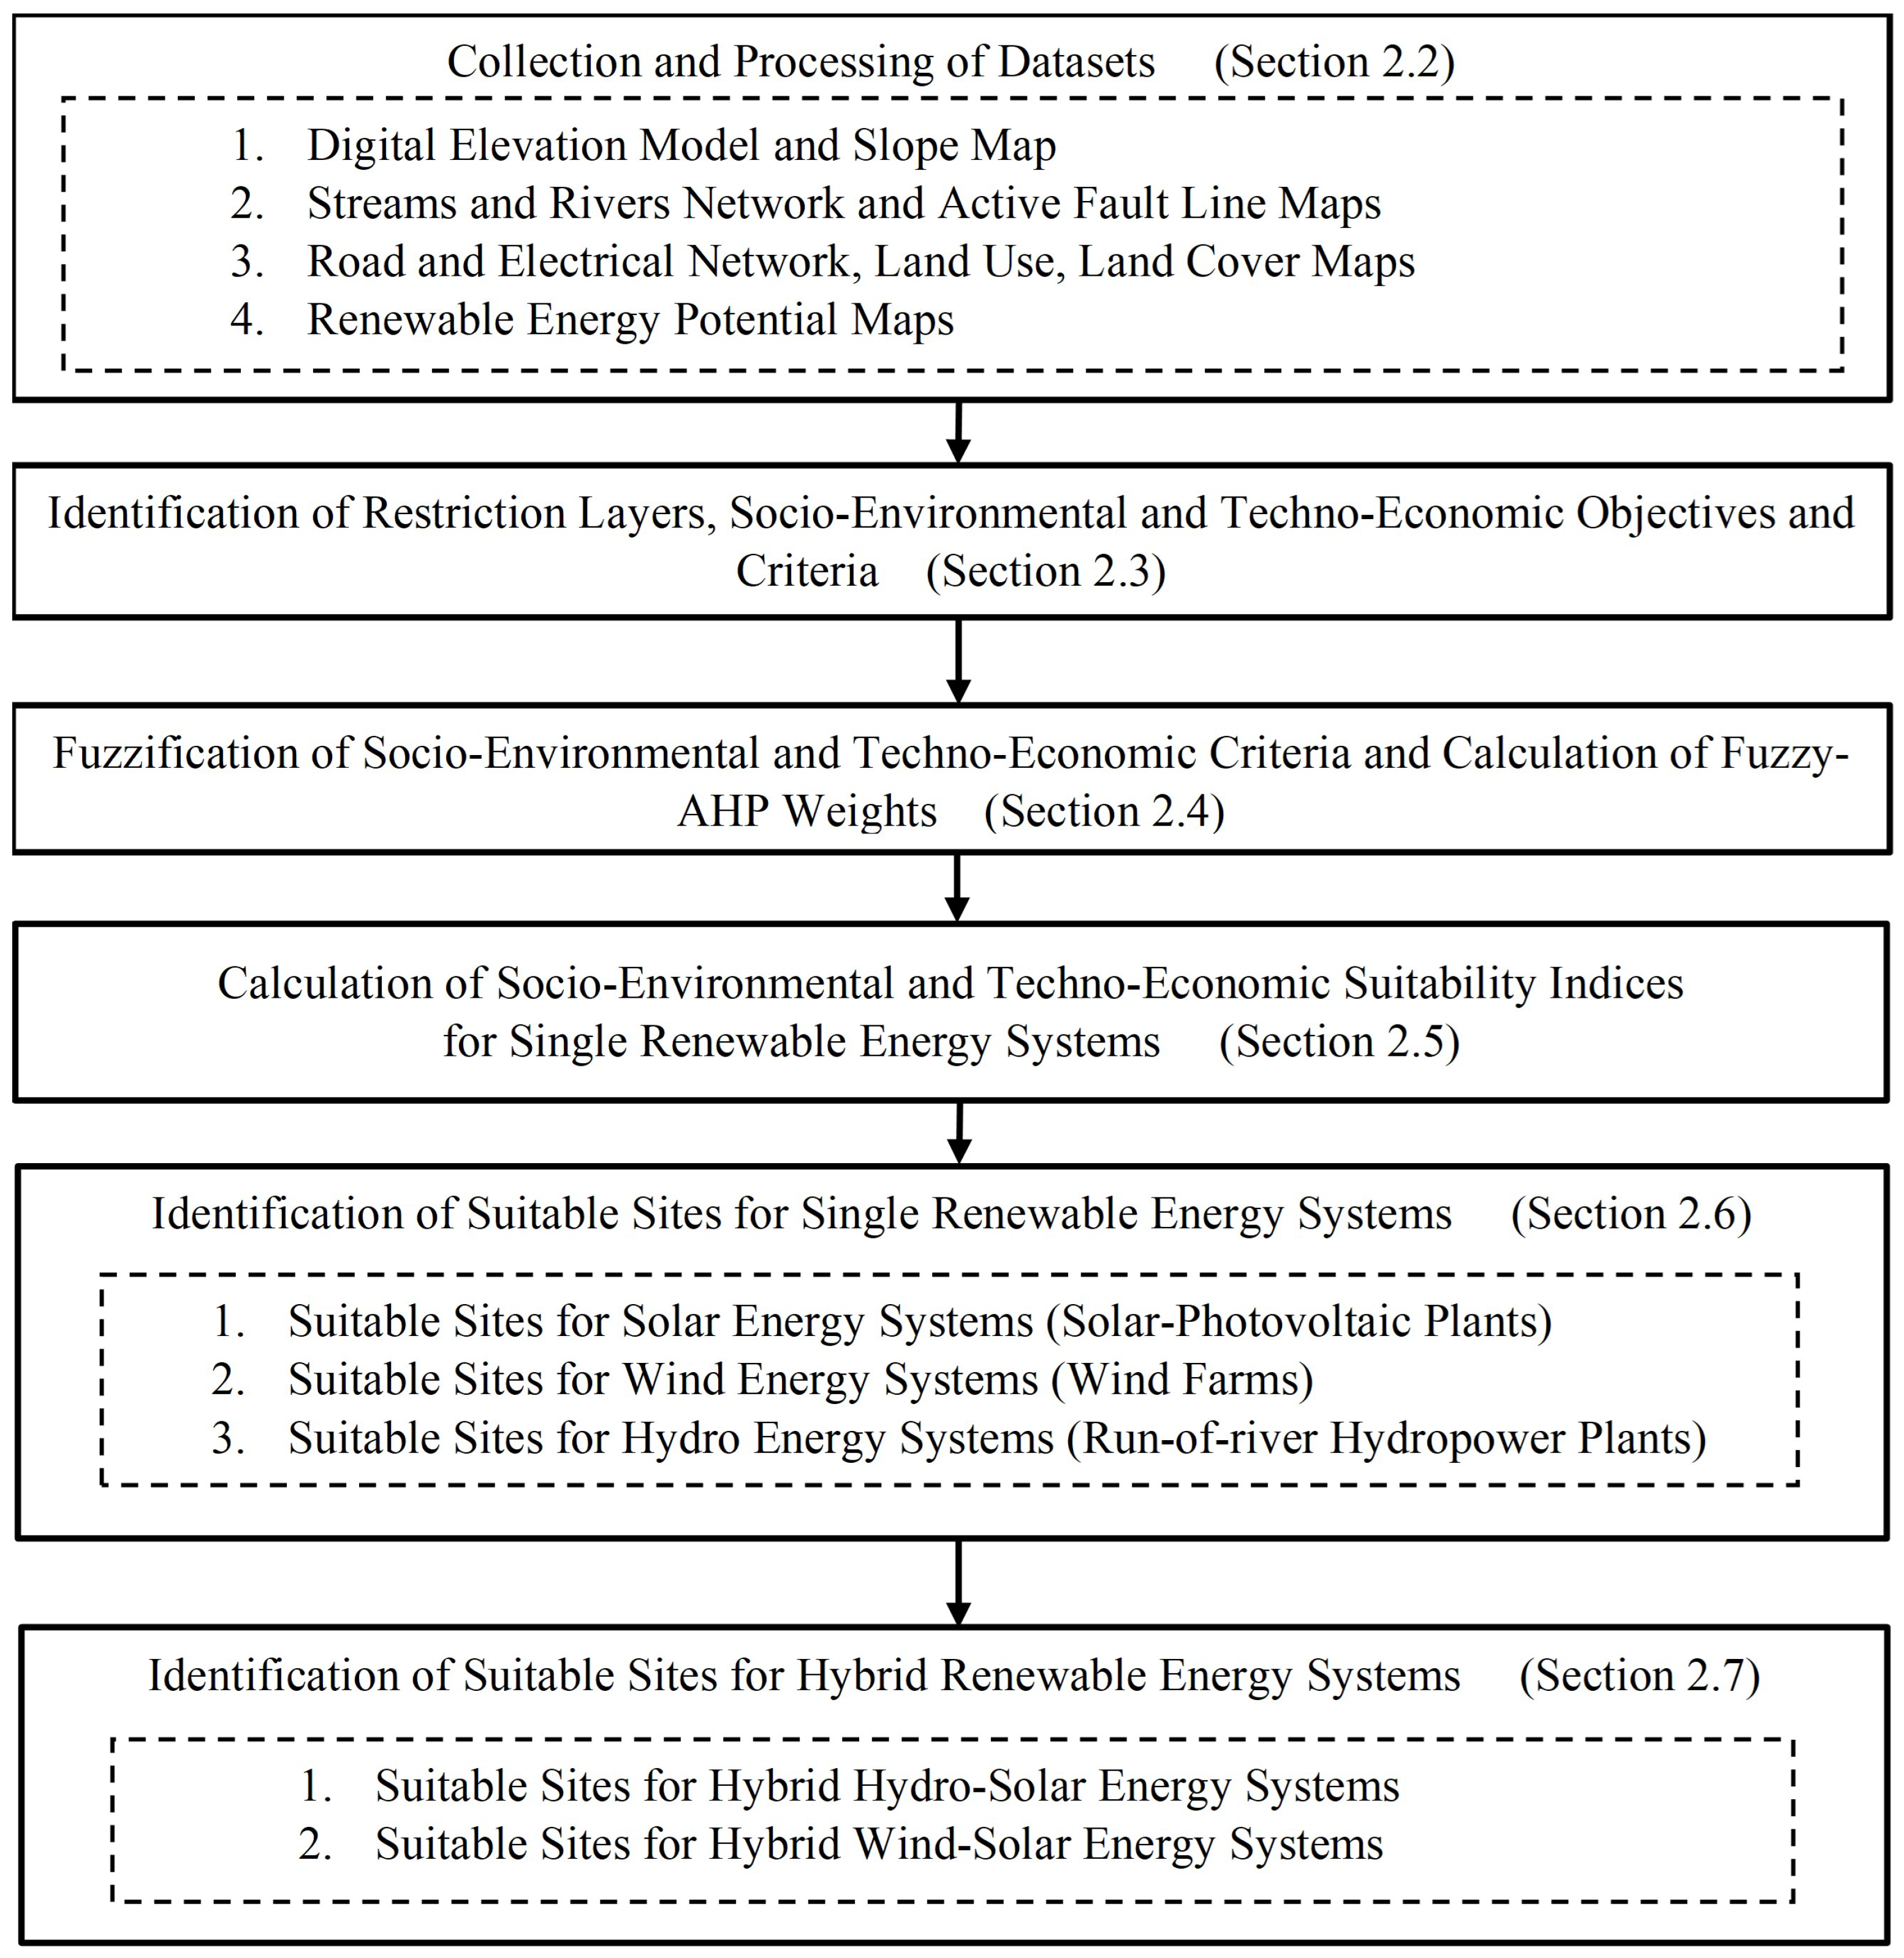
2. Methodology
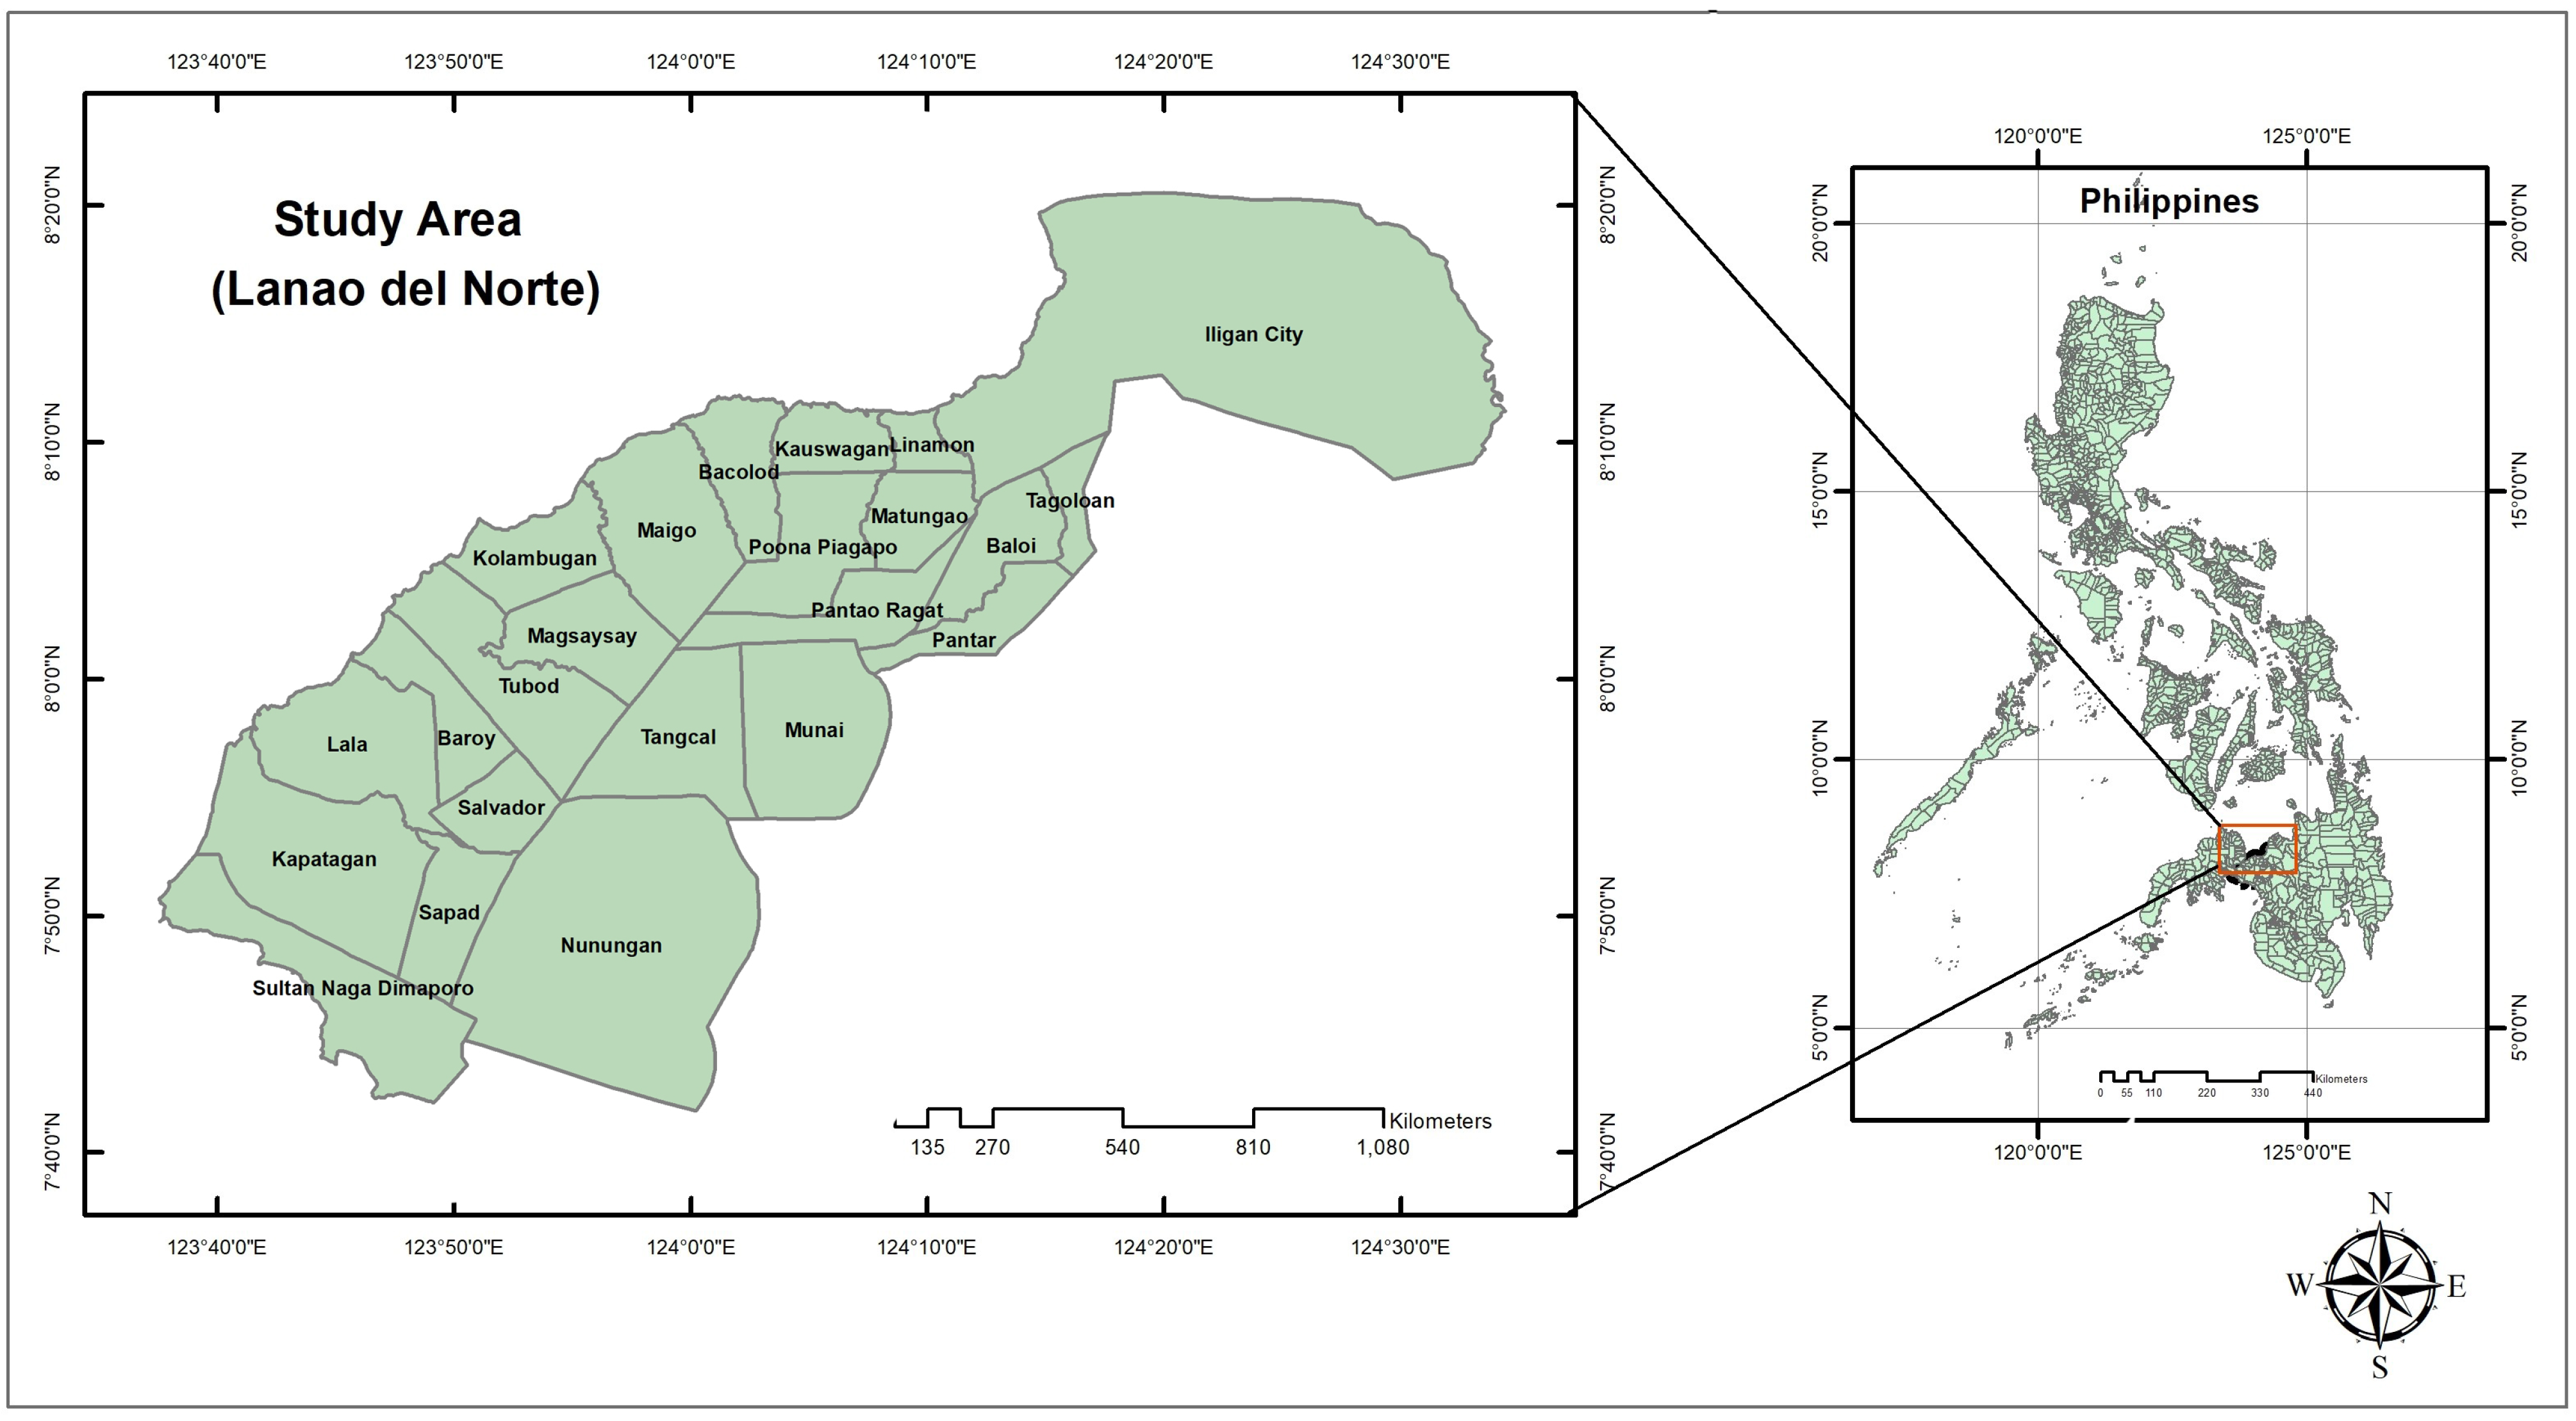
2.1. Study Area
2.2. Collection and Processing of Datasets
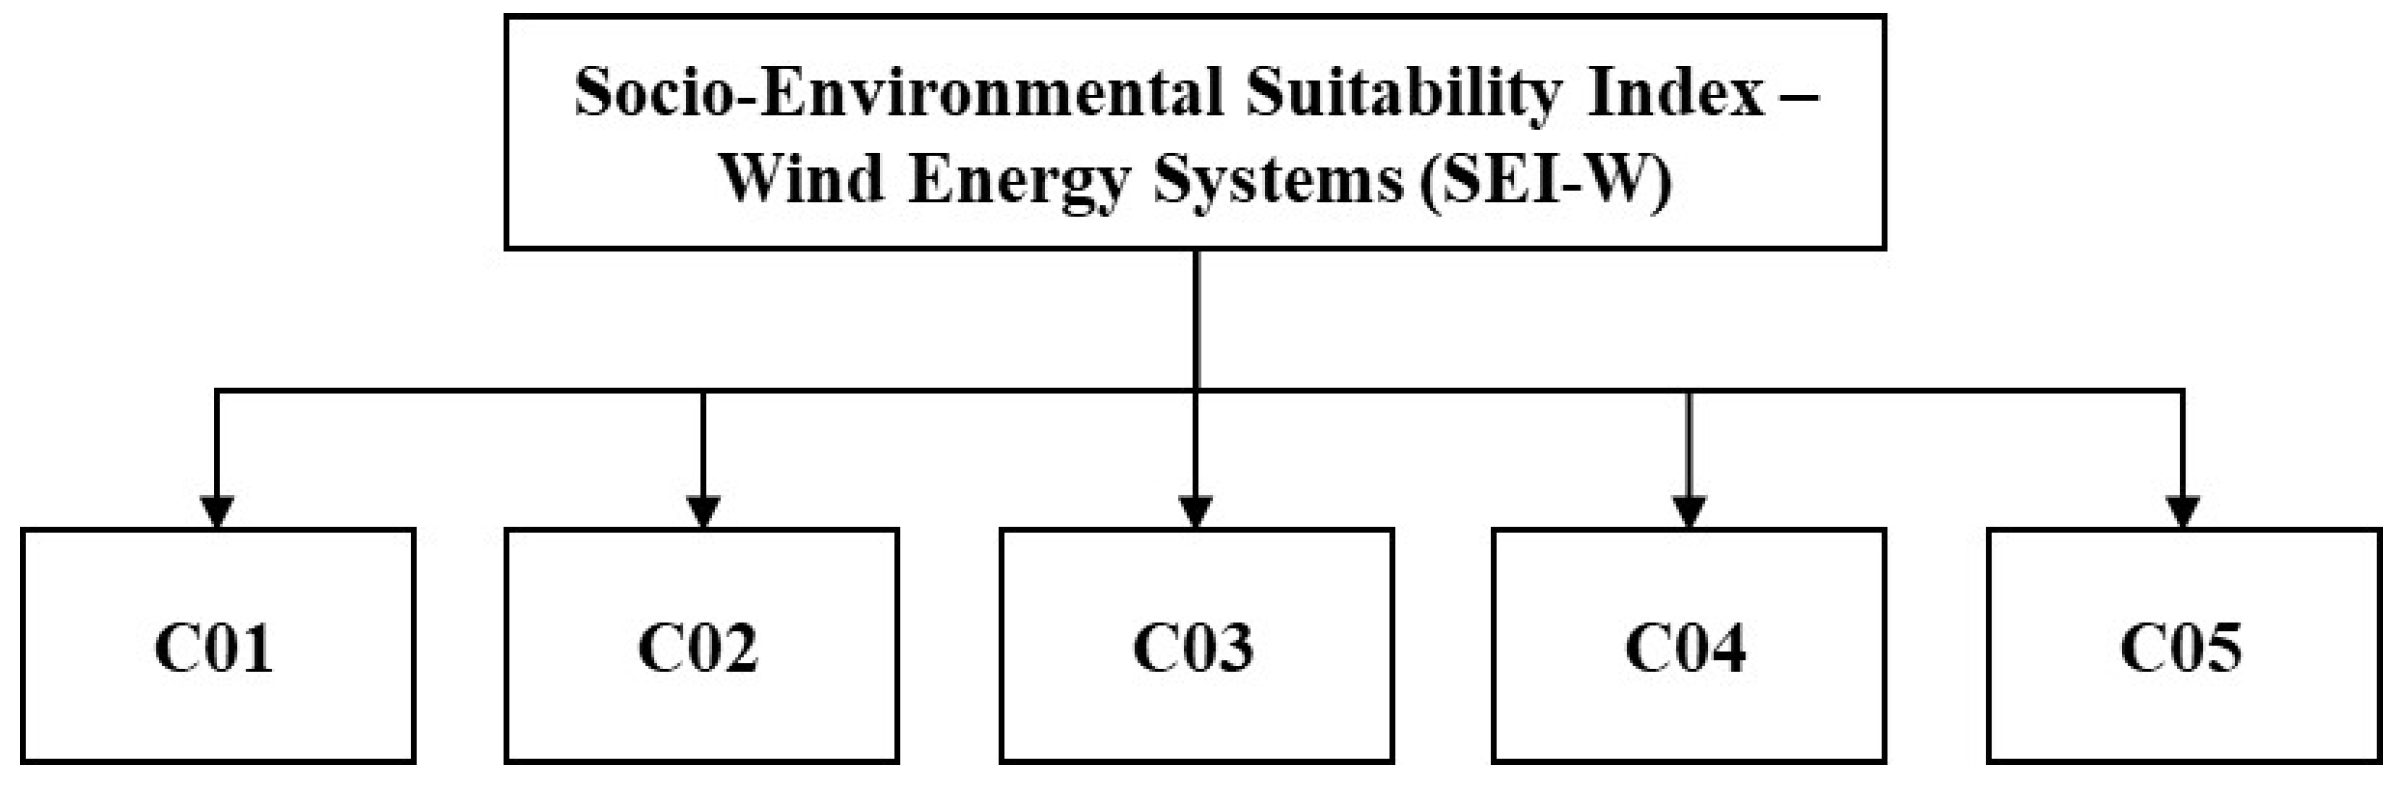
2.3. Identification of Restriction Layers, Socio-Environmental and Techno-Economic Objectives and Criteria
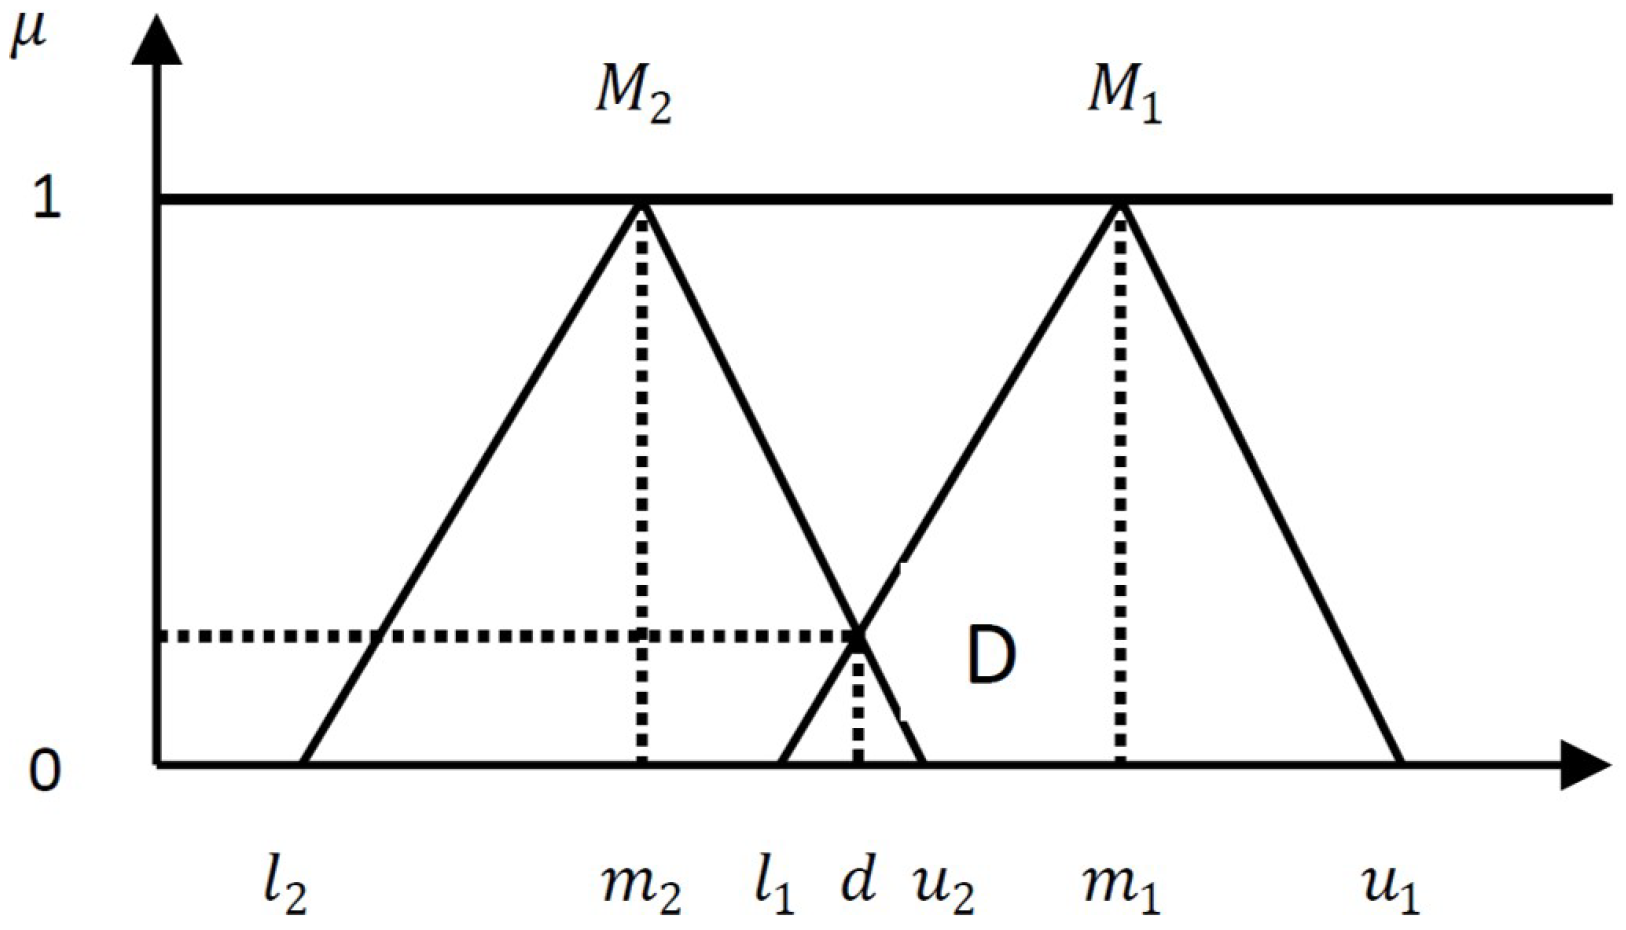
2.4. Fuzzification of Socio-Environmental and Techno-Economic Criteria and Calculation of Fuzzy-AHP Weights
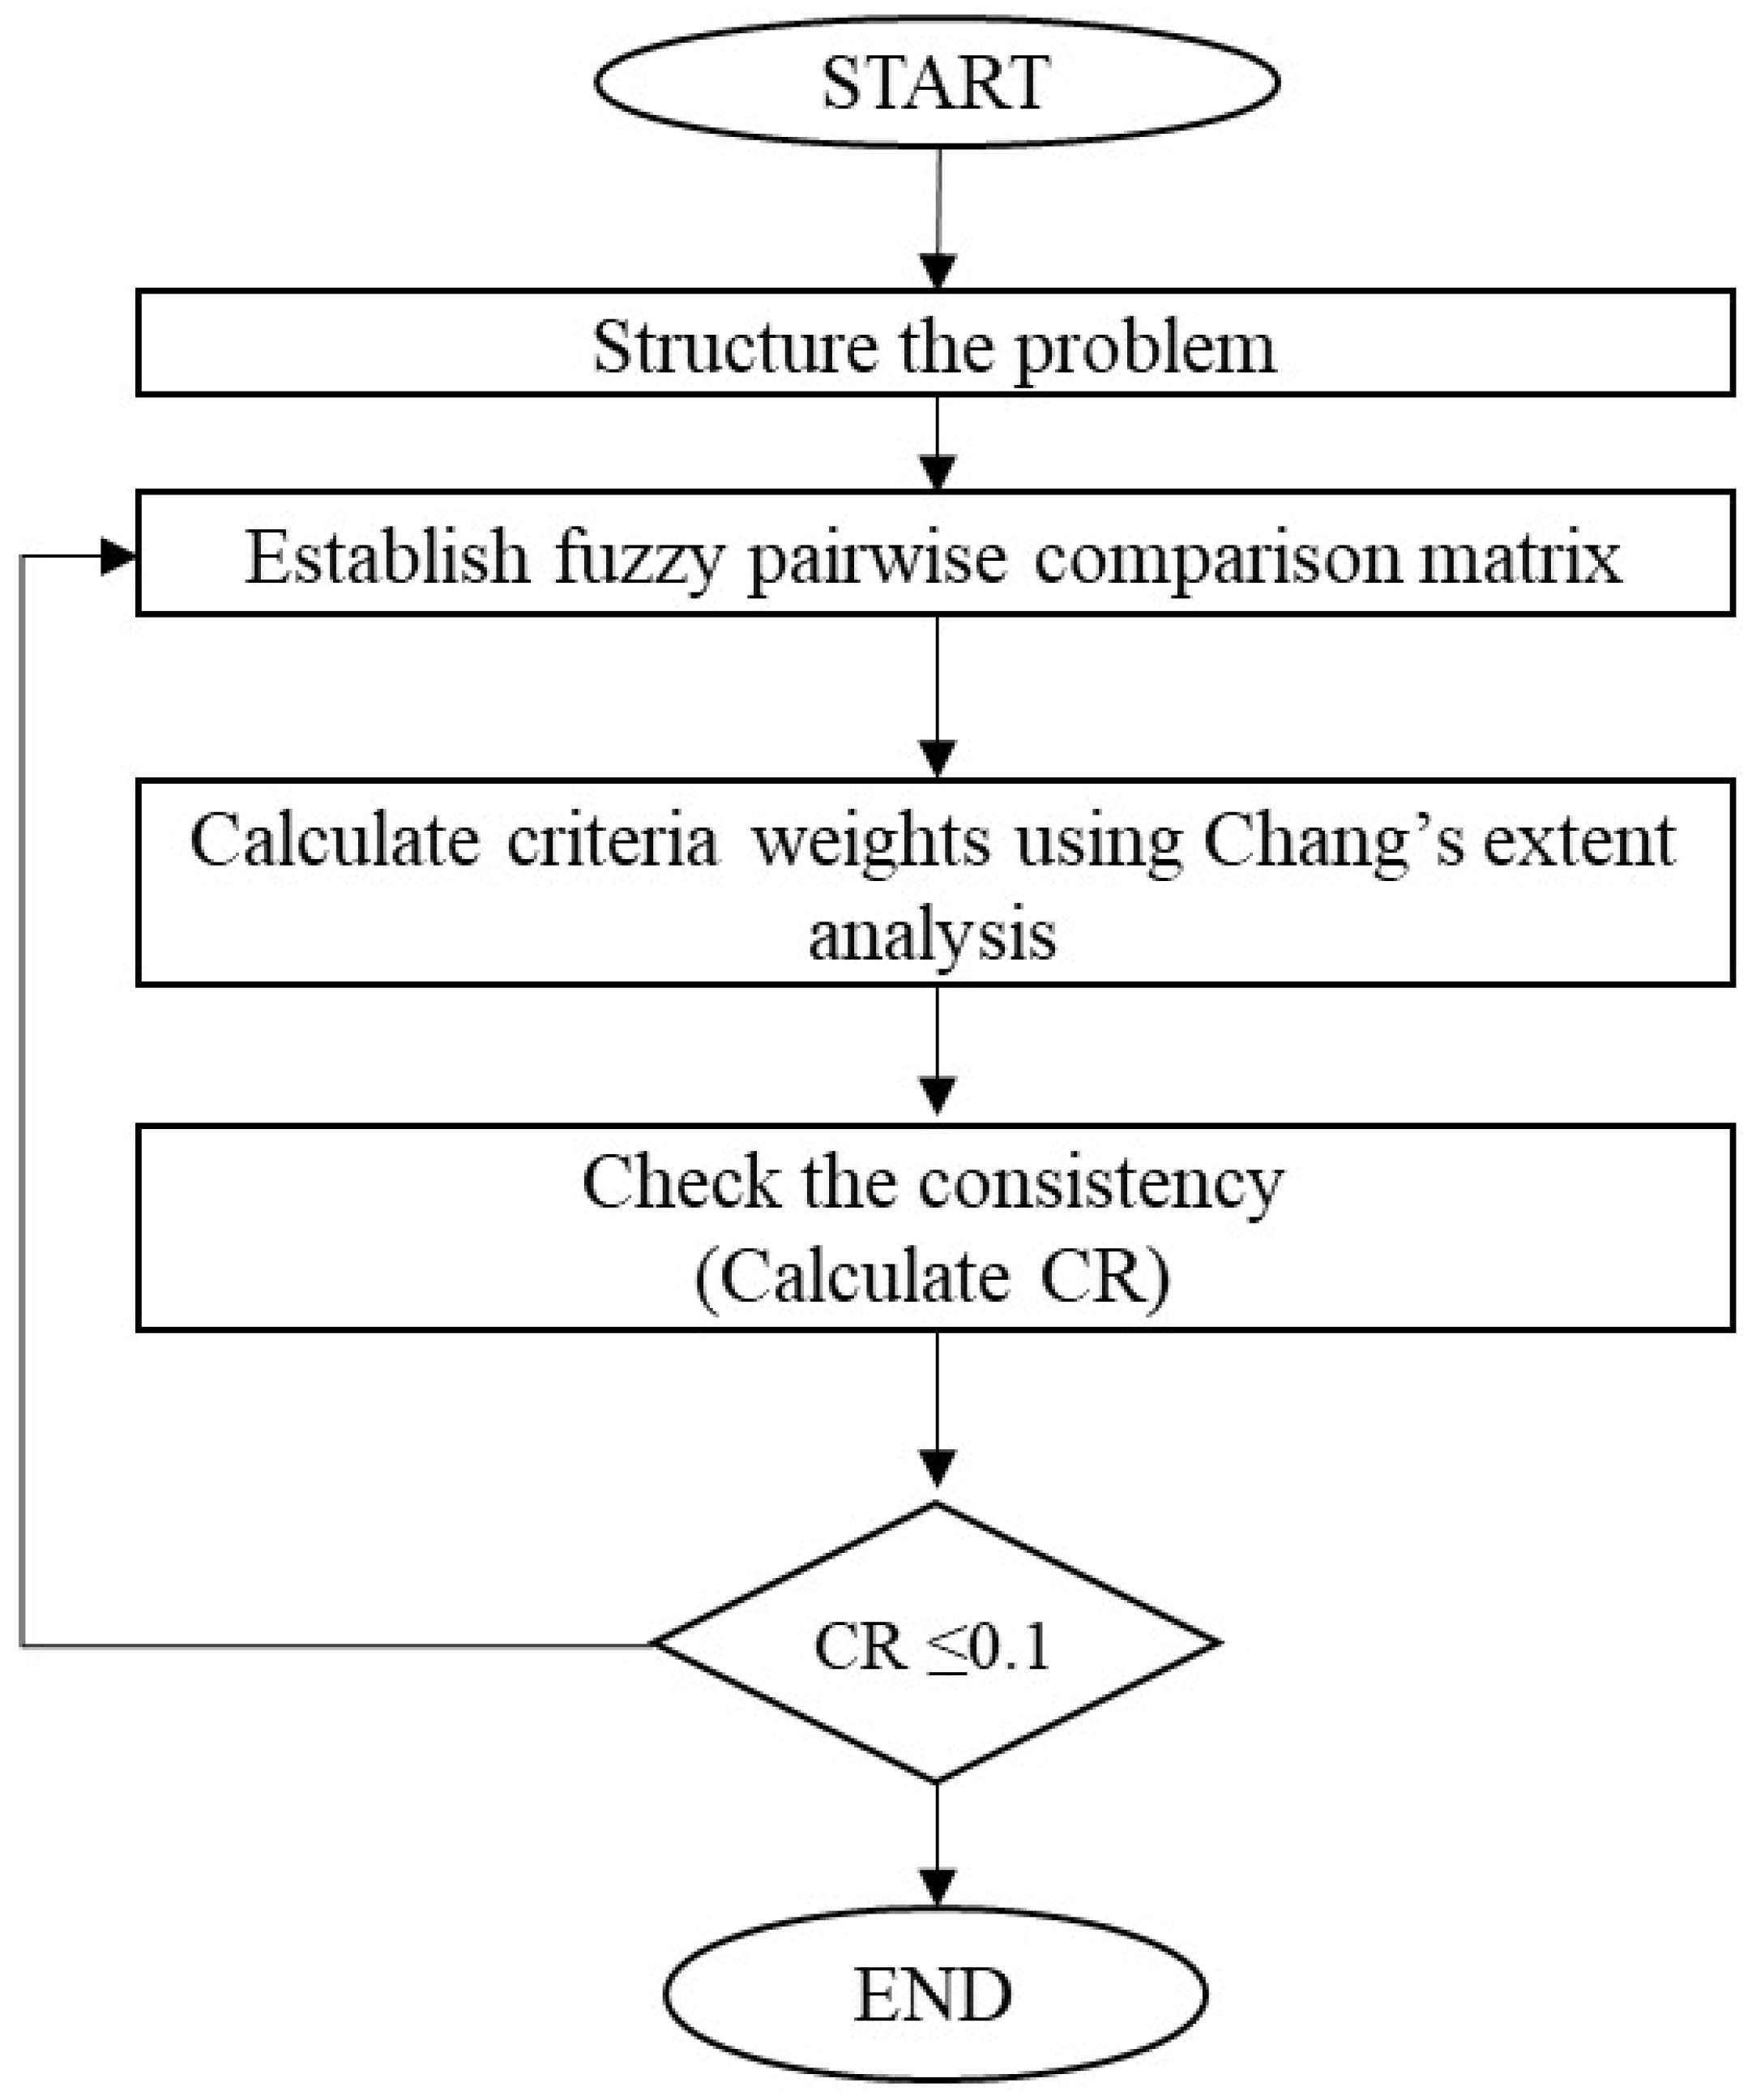
Fuzzy-AHP
2.5. Calculation of Socio-Environmental and Techno-Economic Feasibility Indices for Single Renewable Energy Systems
2.6. Identification of Suitable Sites for Individual Renewable Energy Systems
2.7. Identification of Suitable Sites for Hybrid Renewable Energy Systems
3. Results and Discussion
3.1. Fuzzy-AHP Weights
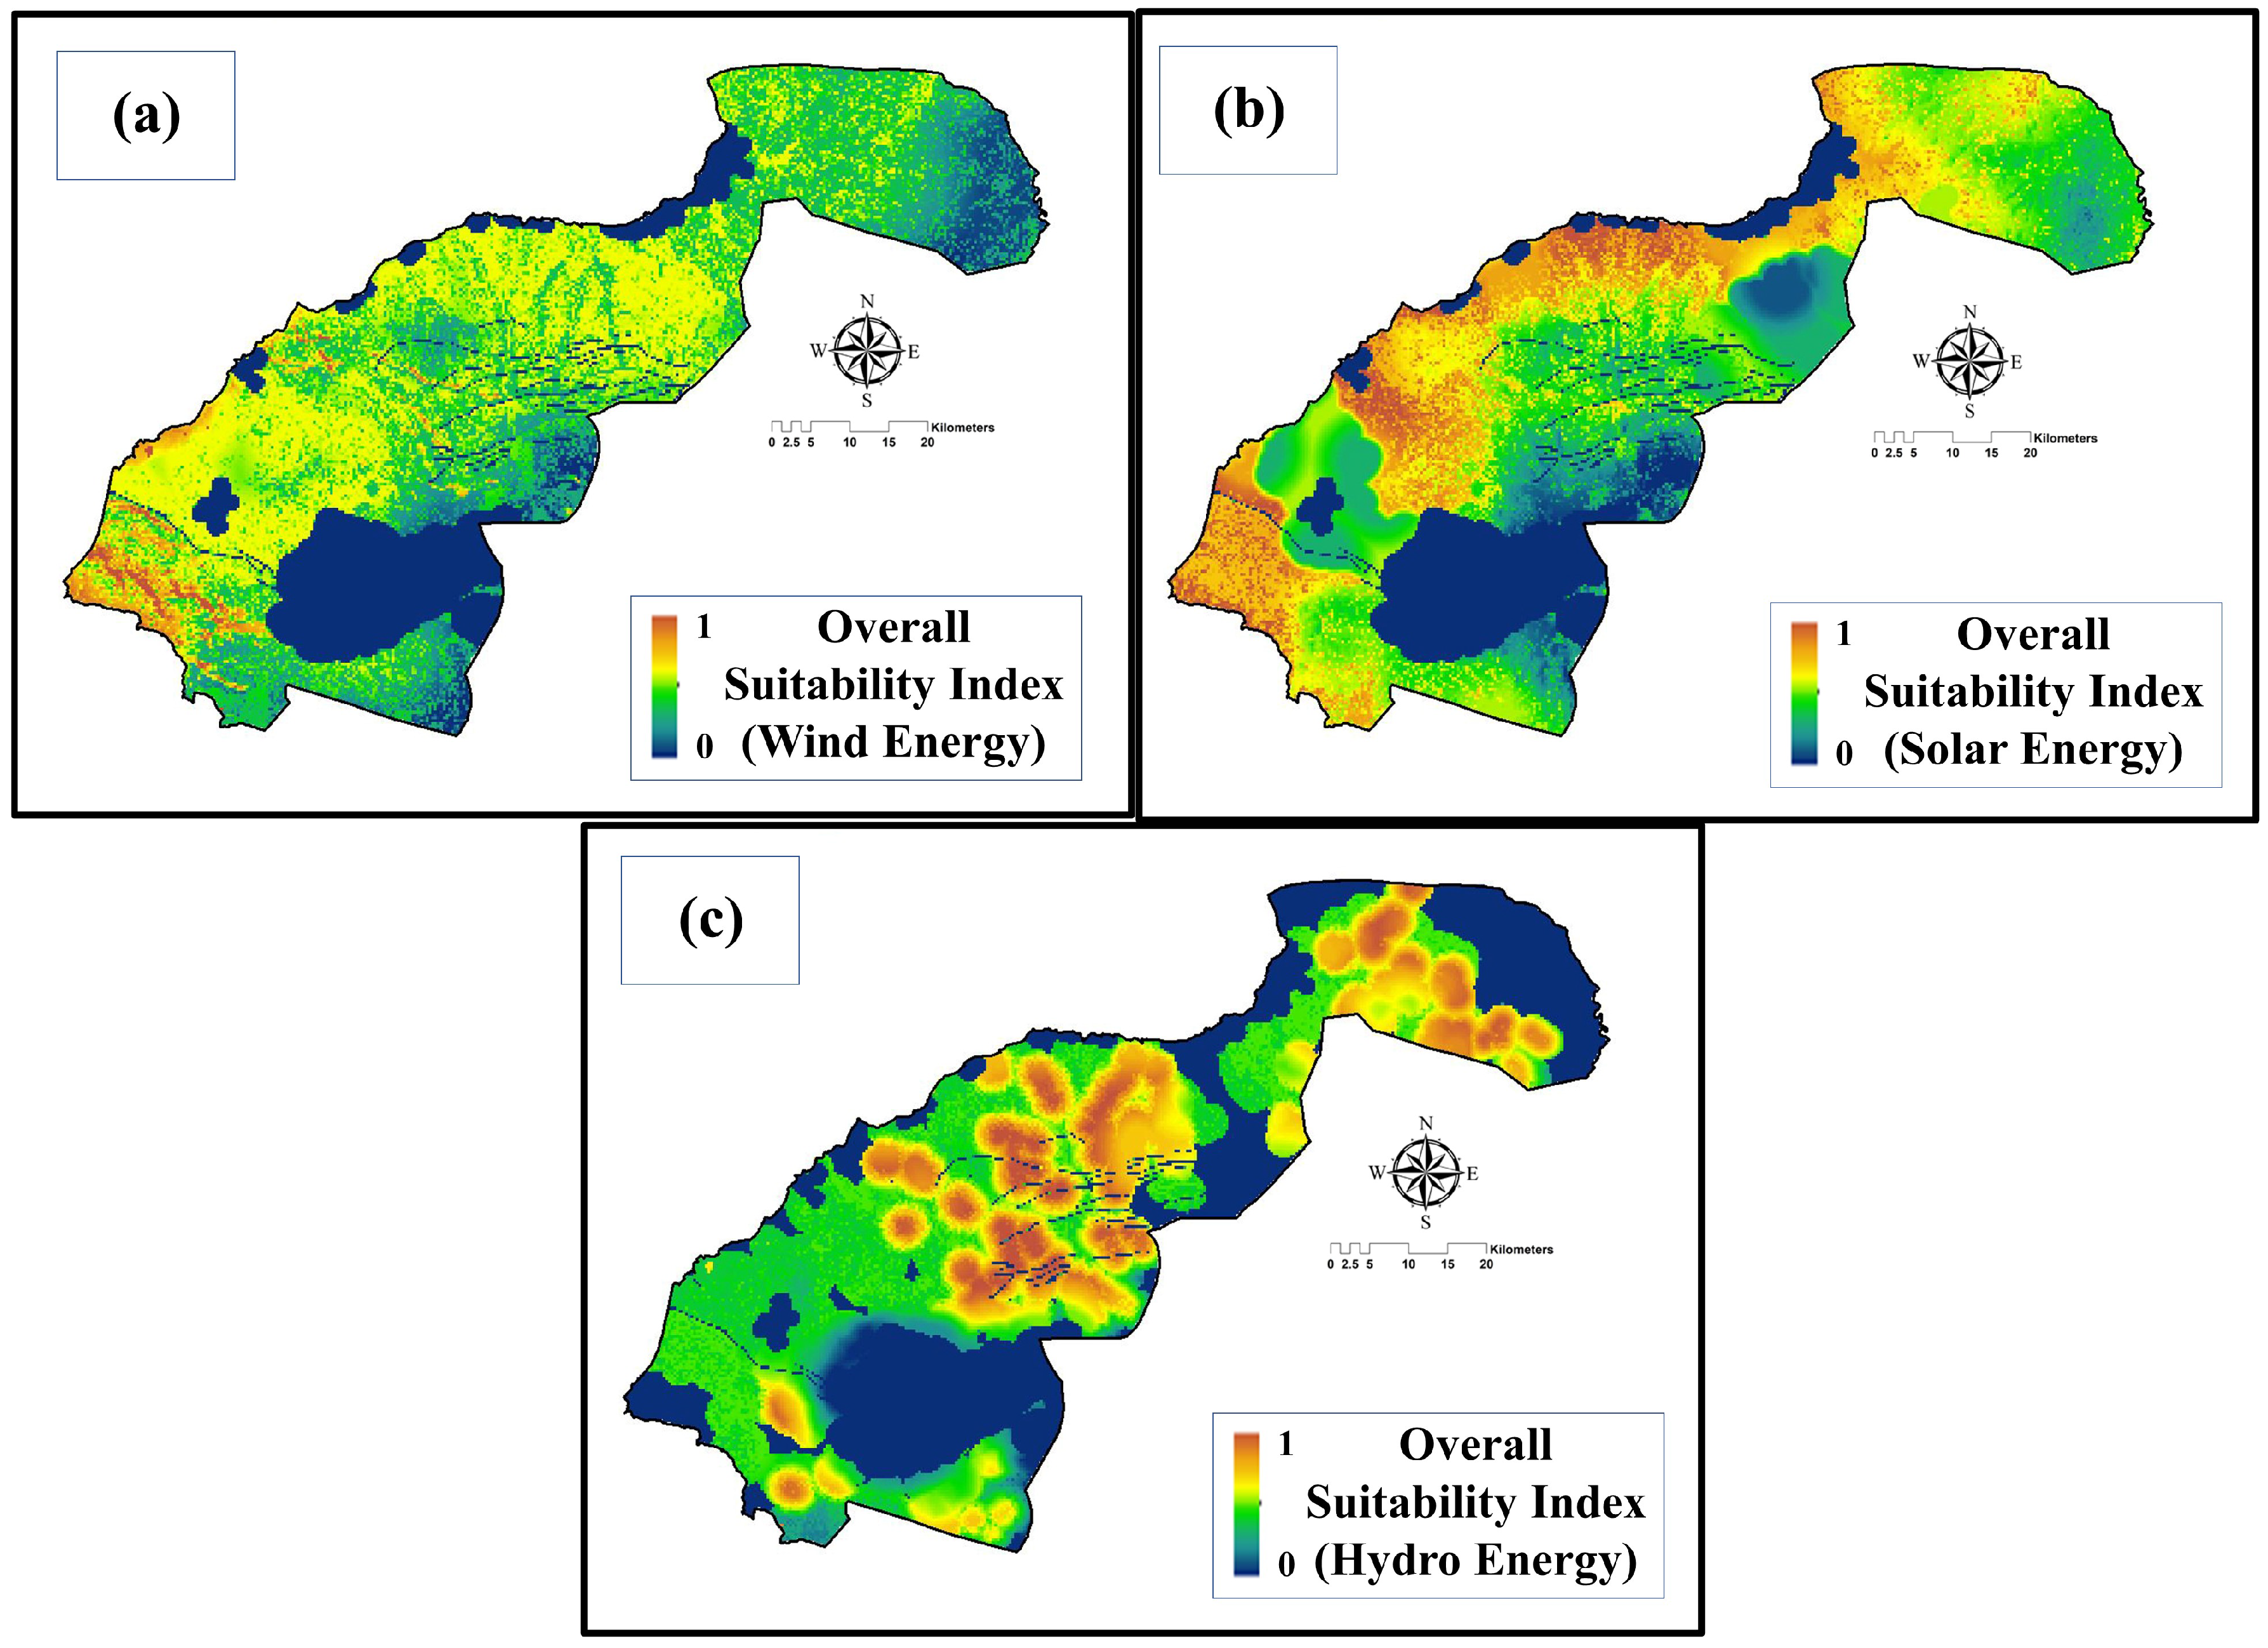
3.2. Suitable Sites for Wind, Solar and Hydro Energy Systems
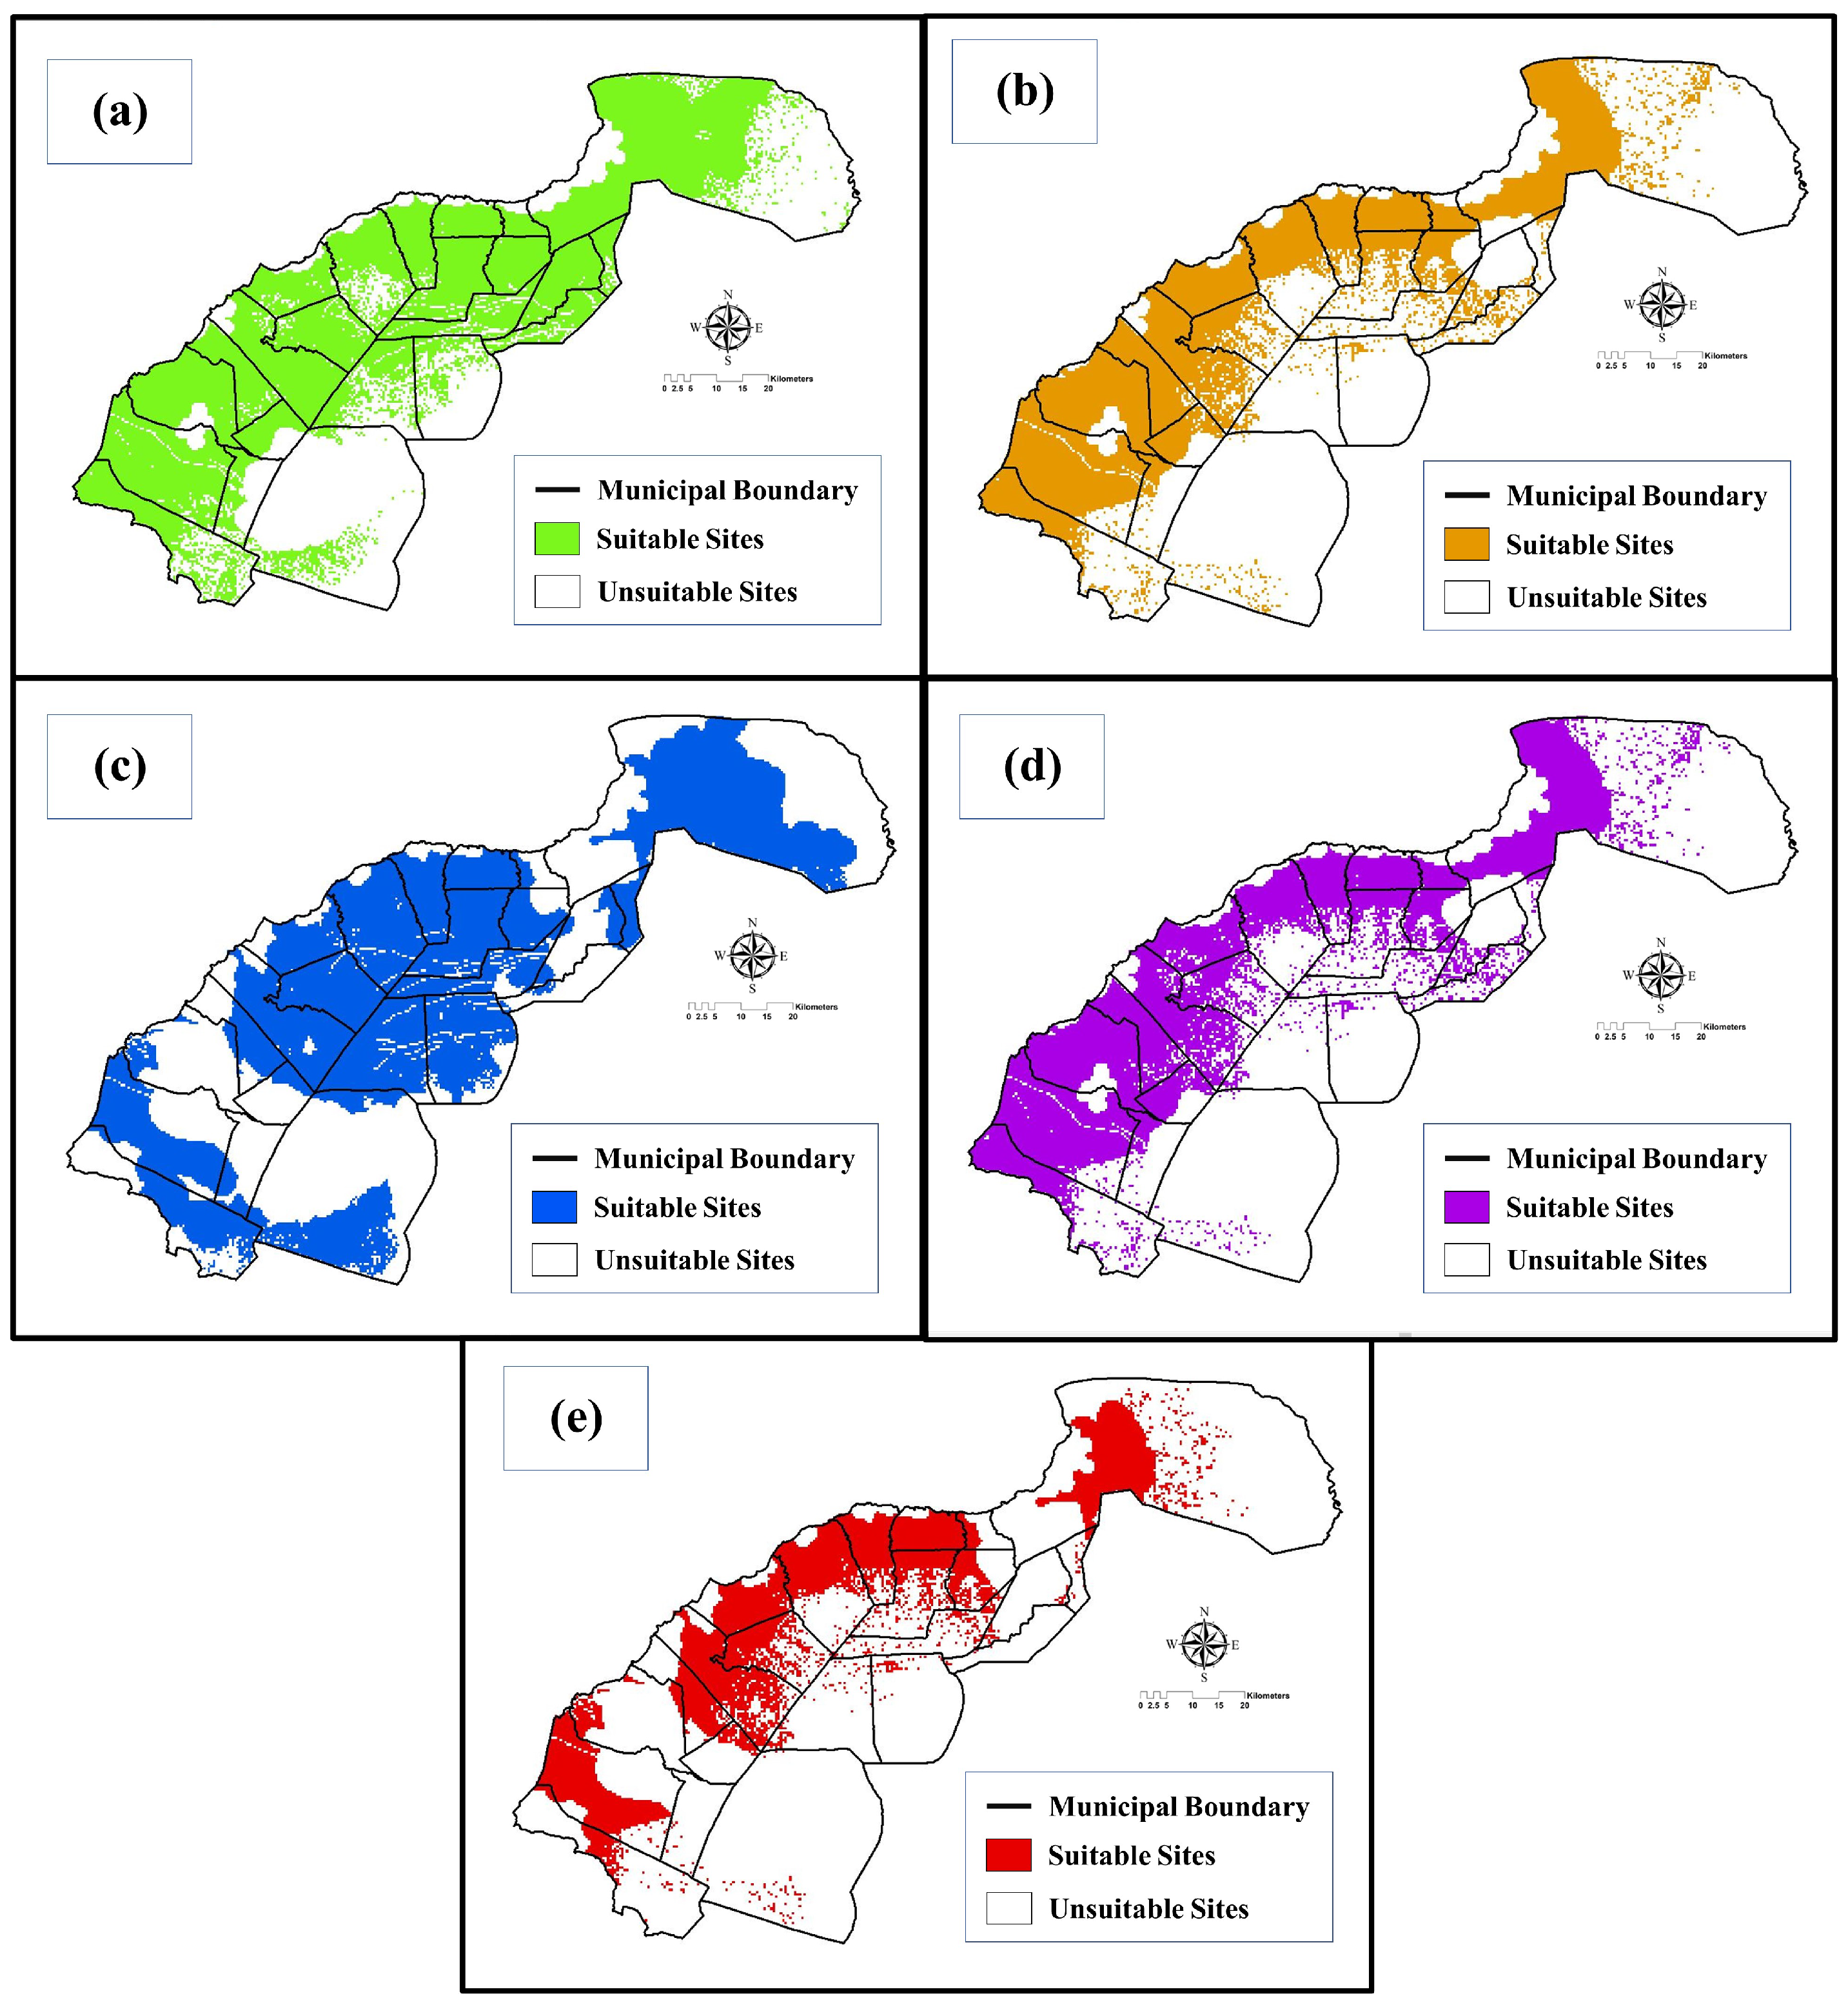
3.3. Suitable Sites for Hybrid Renewable Energy Systems
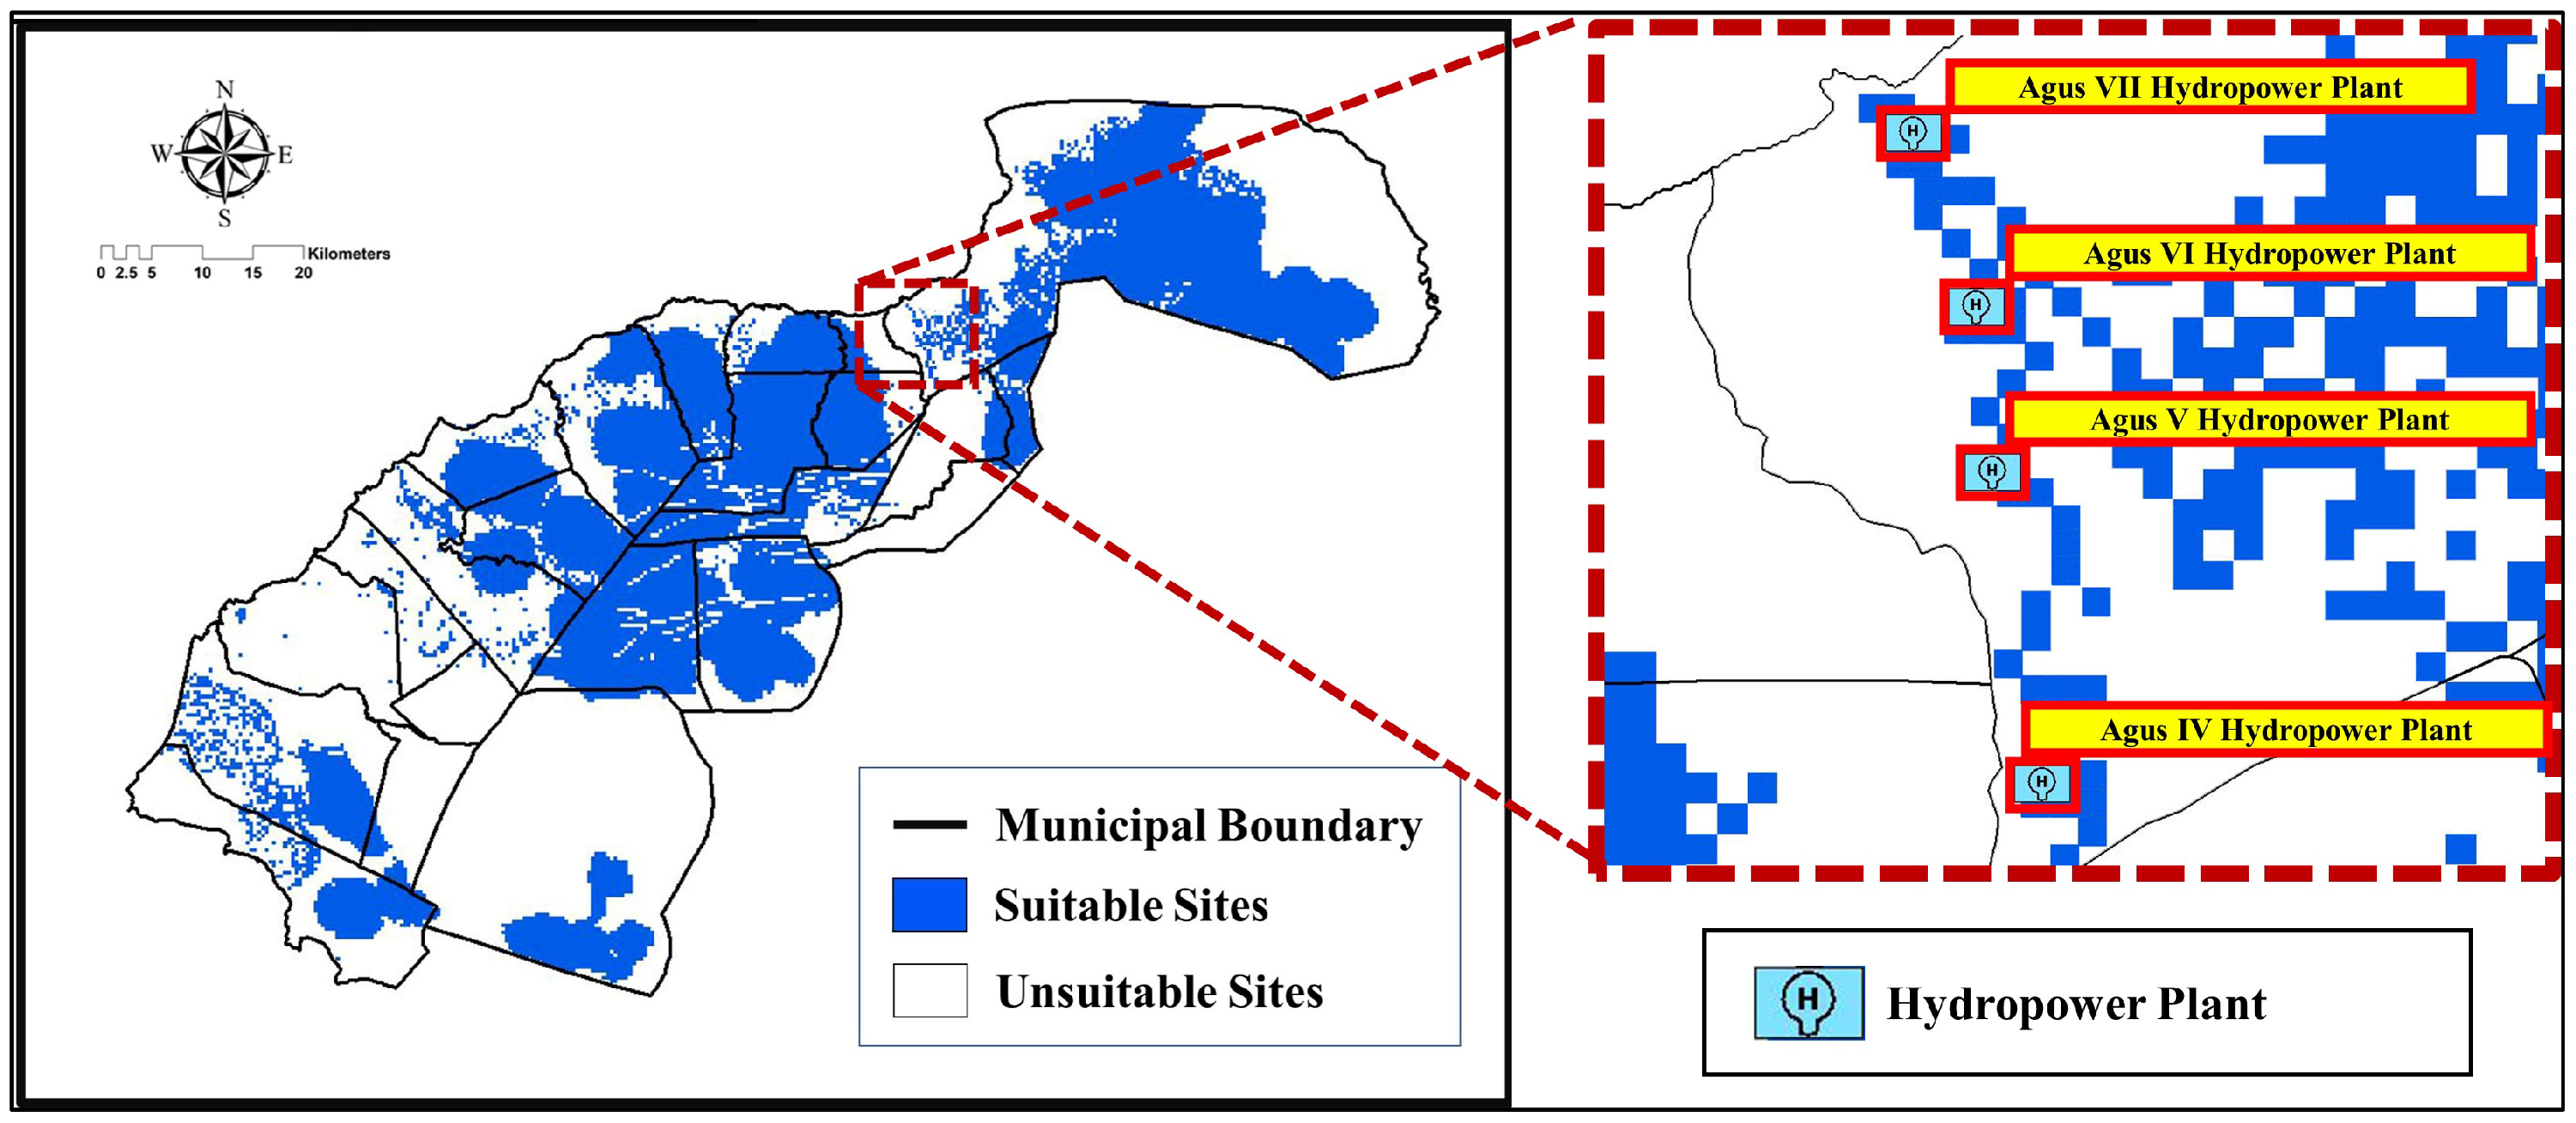
3.4. Model Validation
3.5. Sensitivity Analysis
3.6. Managerial Implications
4. Conclusions
Author Contributions
Funding
Institutional Review Board Statement
Informed Consent Statement
Data Availability Statement
Acknowledgments
Conflicts of Interest
Nomenclature
| AHP | Analytic Hierarchy Process |
| CI | Consistency Index |
| CR | Consistency Ratio |
| FM | Fuzzy Membership |
| GHI | Global Horizontal Irradiance |
| GIS | Geographic Information System |
| MCDM | Multi-Criteria Decision-Making |
| OSI-H | Overall Suitability Index for Hydro Energy |
| OSI-HS | Overall Suitability Index for Hybrid Hydro-Solar Energy |
| OSI-S | Overall Suitability Index for Solar Energy |
| OSI-W | Overall Suitability Index for Wind Energy |
| OSI-WS | Overall Suitability Index for Hybrid Wind–Solar Energy |
| SEI-H | Socio-Environmental Suitability Index for Hydro Energy |
| SEI-S | Socio-Environmental Suitability Index for Solar Energy |
| SEI-W | Socio-Environmental Suitability Index for Wind Energy |
| TEI-H | Techno-Economic Suitability Index for Hydro Energy |
| TEI-S | Techno-Economic Suitability Index for Solar Energy |
| TEI-W | Techno-Economic Suitability Index for Wind Energy |
| TFN | Triangular Fuzzy Number |
| WLC | Weighted Linear Combination |
References
- IRENA. Global Energy Transformation: A Roadmap to 2050; Technical Report 978–92-9260-121-8; International Renewable Energy Agency: Abu Dhabi, United Arab Emirates, 2019. [Google Scholar]
- The World Bank and Asian Development Bank. World Bank and Asian Development Bank—Climate Risk Country Profile:Philippines. Available online: https://www.adb.org/sites/default/files/publication/722241/climate-risk-country-profile-philippines.pdf (accessed on 8 October 2021).
- DOST. Department of Science and Technology: How Reliant Is the Philippines on Renewable Energy? 2018. Available online: https://www.dost.gov.ph/knowledge-resources/news/56-infographics/infographics-2018/1487-how-reliant-is-the-philippines-on-renewable-energy.html (accessed on 20 August 2018).
- DOE. Department of Energy Philippines—EMPOWERED: Renewable Energy Decade Report. Available online: https://www.doe.gov.ph/sites/default/files/pdf/renewable_energy/empowered-re-decade-report-2008-2018.pdf (accessed on 15 July 2021).
- ADB. Asian Development Bank—Philippines: Energy Sector Assessment, Strategy and Road Map. Available online: http://dx.doi.org/10.22617/TCS189616 (accessed on 16 May 2021).
- Supapo, K.R.M.; Lozano, L.; Tabañag, I.D.F.; Querikiol, E.M. A Geospatial Approach to Energy Planning in Aid of Just Energy Transition in Small Island Communities in the Philippines. Appl. Sci. 2021, 11, 11955. [Google Scholar] [CrossRef]
- Kuijpers, M.; den Berkmortel, T.V. Accenture How Geographic Information Systems (GIS) Can Fuel Energy Transition. Available online: https://www.accenture.com/nl-en/blogs/insights/how-geographic-information-systems-gis-can-fuel-energy-transition (accessed on 20 April 2018).
- Choi, Y.J.; Oh, B.C.; Acquah, M.A.; Kim, D.M.; Kim, S.Y. Optimal Operation of a Hybrid Power System as an Island Microgrid in South-Korea. Sustainability 2021, 13, 5022. [Google Scholar] [CrossRef]
- Dawood, F.; Shafiullah, G.; Anda, M. Stand-Alone Microgrid with 100% Renewable Energy: A Case Study with Hybrid Solar PV-Battery-Hydrogen. Sustainability 2020, 12, 2047. [Google Scholar] [CrossRef] [Green Version]
- Kumar, N.M.; Chopra, S.S.; Chand, A.A.; Elavarasan, R.M.; Shafiullah, G. Hybrid Renewable Energy Microgrid for a Residential Community: A Techno-Economic and Environmental Perspective in the Context of the SDG7. Sustainability 2020, 12, 3944. [Google Scholar] [CrossRef]
- Olmedo-González, J.; Ramos-Sánchez, G.; Garduño-Ruiz, E.P.; González-Huerta, R.d.G. Analysis of Stand-Alone Photovoltaic & Marine Current Hybrid System and the Influence on Daily and Seasonal Energy Storage. Energies 2022, 15, 468. [Google Scholar] [CrossRef]
- Canziani, F.; Vargas, R.; Castilla, M.; Miret, J. Reliability and Energy Costs Analysis of a Rural Hybrid Microgrid Using Measured Data and Battery Dynamics: A Case Study in the Coast of Perú. Energies 2021, 14, 6396. [Google Scholar] [CrossRef]
- Nazir, M.I.; Hussain, I.; Ahmad, A.; Khan, I.; Mallik, A. System Modeling and Reliability Assessment of Microgrids: A Review. Sustainability 2022, 14, 126. [Google Scholar] [CrossRef]
- Tarife, R.P.; Tahud, A.P.; Gulben, E.J.G.; Macalisang, H.A.R.C.P.; Ignacio, M.T.T. Application of Geographic Information System (GIS) in Hydropower Resource Assessment: A Case Study in Misamis Occidental, Philippines. Int. J. Environ. Sci. Dev. 2017, 8, 507–511. [Google Scholar] [CrossRef] [Green Version]
- Tahud, A.P.; Estoperez, N.R. Evaluation of Potential Hydropower Sites in Iligan City Using Geographic Information System (GIS). In Proceedings of the International Conference on Sustainable Energy & Environmental Sciences (SEES), Singapore, 22–23 February 2016. [Google Scholar] [CrossRef]
- Aydin, N.Y.; Kentel, E.; Sebnem Duzgun, H. GIS-based site selection methodology for hybrid renewable energy systems: A case study from western Turkey. Energy Convers. Manag. 2013, 70, 90–106. [Google Scholar] [CrossRef]
- Szurek, M.; Blachowski, J.; Nowacka, A. GIS-based method for wind farm location multi-criteria analysis. Min. Sci. 2014, 21, 65–81. [Google Scholar] [CrossRef]
- Noorollahi, Y.; Yousefi, H.; Mohammadi, M. Multi-criteria decision support system for wind farm site selection using GIS. Sustain. Energy Technol. Assess. 2016, 13, 38–50. [Google Scholar] [CrossRef]
- Noorollahi, E.; Fadai, D.; Akbarpour Shirazi, M.; Ghodsipour, S.H. Land Suitability Analysis for Solar Farms Exploitation Using GIS and Fuzzy Analytic Hierarchy Process (FAHP)—A Case Study of Iran. Energies 2016, 9, 643. [Google Scholar] [CrossRef] [Green Version]
- Singh, R.P.; Nachtnebel, H.P. Analytical hierarchy process (AHP) application for reinforcement of hydropower strategy in Nepal. Renew. Sustain. Energy Rev. 2016, 55, 43–58. [Google Scholar] [CrossRef]
- Gigović, L.; Pamučar, D.; Božanić, D.; Ljubojević, S. Application of the GIS-DANP-MABAC multi-criteria model for selecting the location of wind farms: A case study of Vojvodina, Serbia. Renew. Energy 2017, 103, 501–521. [Google Scholar] [CrossRef]
- Díaz-Cuevas, P. GIS-Based Methodology for Evaluating the Wind-Energy Potential of Territories: A Case Study from Andalusia (Spain). Energies 2018, 11, 2789. [Google Scholar] [CrossRef] [Green Version]
- Yousefi, H.; Hafeznia, H.; Yousefi-Sahzabi, A. Spatial Site Selection for Solar Power Plants Using a GIS-Based Boolean-Fuzzy Logic Model: A Case Study of Markazi Province, Iran. Energies 2018, 11, 1648. [Google Scholar] [CrossRef] [Green Version]
- Ghorbani, N.; Makian, H.; Breyer, C. A GIS-based method to identify potential sites for pumped hydro energy storage—Case of Iran. Energy 2019, 169, 854–867. [Google Scholar] [CrossRef]
- Rana, S.C.; Patel, J.N. Selection of best location for small hydro power project using AHP, WPM and TOPSIS methods. ISH J. Hydraul. Eng. 2020, 26, 173–178. [Google Scholar] [CrossRef]
- Albraheem, L.; Alabdulkarim, L. Geospatial Analysis of Solar Energy in Riyadh Using a GIS-AHP-Based Technique. ISPRS Int. J. Geo-Inf. 2021, 10, 291. [Google Scholar] [CrossRef]
- Jafari, M.; Fazloula, R.; Effati, M.; Jamali, A. Providing a GIS-based framework for Run-Of-River hydropower site selection: A model based on sustainable development energy approach. Civ. Eng. Environ. Syst. 2021, 38, 102–126. [Google Scholar] [CrossRef]
- Görtz, J.; Aouad, M.; Wieprecht, S.; Terheiden, K. Assessment of pumped hydropower energy storage potential along rivers and shorelines. Renew. Sustain. Energy Rev. 2022, 165, 112027. [Google Scholar] [CrossRef]
- Zalhaf, A.S.; Elboshy, B.; Kotb, K.M.; Han, Y.; Almaliki, A.H.; Aly, R.M.H.; Elkadeem, M.R. A High-Resolution Wind Farms Suitability Mapping Using GIS and Fuzzy AHP Approach: A National-Level Case Study in Sudan. Sustainability 2022, 14, 358. [Google Scholar] [CrossRef]
- Huang, J.; Huang, X.; Song, N.; Ma, Y.; Wei, D. Evaluation of the Spatial Suitability of Offshore Wind Farm—A Case Study of the Sea Area of Liaoning Province. Sustainability 2022, 14, 449. [Google Scholar] [CrossRef]
- Tarife, R.; Nakanishi, Y.; Chen, Y.; Zhou, Y.; Estoperez, N.; Tahud, A. Optimization of Hybrid Renewable Energy Microgrid for Rural Agricultural Area in Southern Philippines. Energies 2022, 15, 2251. [Google Scholar] [CrossRef]
- DOE Distribution Utility Profile—Iligan Light and Power Inc. (ILPI). Available online: https://www.doe.gov.ph/ducsp/ilpi (accessed on 21 September 2021).
- DOE Distribution Utility Profile—Lanao del Norte Electric Cooperative (LANECO). Available online: https://www.doe.gov.ph/ducsp/laneco (accessed on 21 September 2021).
- ASTER ASTER Global Digital Elevation Map. Available online: https://asterweb.jpl.nasa.gov/gdem.asp (accessed on 30 September 2021).
- Solargis Global Solar Atlas 2.0. Available online: https://solargis.com/maps-and-gis-data/download/philippines (accessed on 25 August 2021).
- Global Wind Atlas Philippines—Wind Speed. Available online: https://globalwindatlas.info/api/gis/country/PHL/wind-speed/50 (accessed on 25 August 2021).
- Phil LiDAR 2 Program PHIL LIDAR 2: Nationwide Detailed Resources Assessment Using LiDAR. Available online: https://dream.upd.edu.ph/about/phil-lidar-2/ (accessed on 14 August 2021).
- PhilGIS Philippines-Lanao del Norte Data. Available online: http://philgis.org/province-page/lanao-del-norte (accessed on 1 August 2021).
- PHIVOLCS Hazard Maps for Lanao Del Norte, Region X (Northern Mindanao). Available online: https://gisweb.phivolcs.dost.gov.ph/gisweb/earthquake-volcano-related-hazard-gis-information (accessed on 25 October 2021).
- OpenStreetMap OpenStreetMap Data for Philippines. Available online: https://download.geofabrik.de/asia/philippines.html (accessed on 1 August 2021).
- DOE Transmission Development Plan 2014–2015 Final Report. Available online: https://www.doe.gov.ph/energy-information-resources?q=transmission-development-plan&withshield=1 (accessed on 21 September 2021).
- Nakata, T.; Kumamoto, T. Land use issues against potential danger of active fault and active fault zones act. Act. Fault Res. 2003, 2003, 13–18. [Google Scholar] [CrossRef]
- Pacheco, B.M. Safety of PH Structures during Quakes. Available online: https://mmda.gov.ph/en/20-faq/297-safety-of-ph-structures-during-quakes.html (accessed on 10 August 2021).
- Latinopoulos, D.; Kechagia, K. A GIS-based multi-criteria evaluation for wind farm site selection. A regional scale application in Greece. Renew. Energy 2015, 78, 550–560. [Google Scholar] [CrossRef]
- Biodiversity Management Bureau. In Guidebook to Protected Areas of the Philippines; Biodiversity Management Bureau—Department of Environment and Natural Resources. 2015. Available online: https://www.denr.gov.ph/images/DENR_Publications/PA_Guidebook_Complete.pdf (accessed on 7 March 2021).
- Congress of the Philippines. Republic Act No. 7586—National Integrated Protected Areas System Act of 1992. 1992. Available online: https://www.officialgazette.gov.ph/1992/06/01/republic-act-no-7586/ (accessed on 7 March 2021).
- Voivontas, D.; Assimacopoulos, D.; Mourelatos, A.; Corominas, J. Evaluation of Renewable Energy potential using a GIS decision support system. Renew. Energy 1998, 13, 333–344. [Google Scholar] [CrossRef]
- Vagiona, D.G.; Kamilakis, M. Sustainable Site Selection for Offshore Wind Farms in the South Aegean—Greece. Sustainability 2018, 10, 749. [Google Scholar] [CrossRef] [Green Version]
- Yue, C.D.; Wang, S.S. GIS-based evaluation of multifarious local renewable energy sources: A case study of the Chigu area of southwestern Taiwan. Energy Policy 2006, 34, 730–742. [Google Scholar] [CrossRef]
- Vrînceanu, A.; Grigorescu, I.; Dumitrașcu, M.; Mocanu, I.; Dumitrică, C.; Micu, D.; Kucsicsa, G.; Mitrică, B. Impacts of Photovoltaic Farms on the Environment in the Romanian Plain. Energies 2019, 12, 2533. [Google Scholar] [CrossRef] [Green Version]
- Rojanamon, P.; Chaisomphob, T.; Bureekul, T. Application of geographical information system to site selection of small run-of-river hydropower project by considering engineering/economic/environmental criteria and social impact. Renew. Sustain. Energy Rev. 2009, 13, 2336–2348. [Google Scholar] [CrossRef]
- Yi, C.S.; Lee, J.H.; Shim, M.P. Site location analysis for small hydropower using geo-spatial information system. Renew. Energy 2010, 35, 852–861. [Google Scholar] [CrossRef]
- Nebey, A.H.; Taye, B.Z.; Workineh, T.G. Site Suitability Analysis of Solar PV Power Generation in South Gondar, Amhara Region. J. Energy 2020, 2020, 3519257. [Google Scholar] [CrossRef]
- Martínez-Martínez, Y.; Dewulf, J.; Casas-Ledón, Y. GIS-based site suitability analysis and ecosystem services approach for supporting renewable energy development in south-central Chile. Renew. Energy 2022, 182, 363–376. [Google Scholar] [CrossRef]
- Sunarso, A.; Ibrahim-Bathis, K.; Murti, S.A.; Budiarto, I.; Ruiz, H.S. GIS-Based Assessment of the Technical and Economic Feasibility of Utility-Scale Solar PV Plants: Case Study in West Kalimantan Province. Sustainability 2020, 12, 6283. [Google Scholar] [CrossRef]
- Halder, B.; Banik, P.; Almohamad, H.; Al Dughairi, A.A.; Al-Mutiry, M.; Al Shahrani, H.F.; Abdo, H.G. Land Suitability Investigation for Solar Power Plant Using GIS, AHP and Multi-Criteria Decision Approach: A Case of Megacity Kolkata, West Bengal, India. Sustainability 2022, 14, 1276. [Google Scholar] [CrossRef]
- Supriyasilp, T.; Pongput, K.; Boonyasirikul, T. Hydropower development priority using MCDM method. Energy Policy 2009, 37, 1866–1875. [Google Scholar] [CrossRef]
- Bolli, C. A GIS-based Multi-Criteria Analysis for Suitability Assessment of Micro Hydropower Stations: A Case Study from Suriname. Master’s Thesis, University of Salzburg, Salzburg, Austria, 2017. Available online: http://unigis.sbg.ac.at/files_en/Mastertheses/Full/104199.pdf (accessed on 7 March 2021).
- Al Garni, H.Z.; Awasthi, A. Solar PV power plant site selection using a GIS-AHP based approach with application in Saudi Arabia. Appl. Energy 2017, 206, 1225–1240. [Google Scholar] [CrossRef]
- McBratney, A.; Odeh, I.O. Application of fuzzy sets in soil science: Fuzzy logic, fuzzy measurements and fuzzy decisions. Geoderma 1997, 77, 85–113. [Google Scholar] [CrossRef]
- van Laarhoven, P.; Pedrycz, W. A fuzzy extension of Saaty’s priority theory. Fuzzy Sets Syst. 1983, 11, 229–241. [Google Scholar] [CrossRef]
- Chang, D.Y. Applications of the extent analysis method on Fuzzy AHP. Eur. J. Oper. Res. 1996, 95, 649–655. [Google Scholar] [CrossRef]
- Saaty, T.L. Analytic Hierarchy Process. In Encyclopedia of Biostatistics; John Wiley & Sons, Ltd.: Hoboken, NJ, USA, 2005. [Google Scholar] [CrossRef]
- Liu, Y.; Eckert, C.M.; Earl, C. A review of Fuzzy AHP methods for decision-making with subjective judgements. Expert Syst. Appl. 2020, 161, 113738. [Google Scholar] [CrossRef]
- Aliyev, R.; Temizkan, H.; Aliyev, R. Fuzzy Analytic Hierarchy Process-Based Multi-Criteria Decision Making for Universities Ranking. Symmetry 2020, 12, 1351. [Google Scholar] [CrossRef]


| Renewable Energy System Considered | ||||||||
|---|---|---|---|---|---|---|---|---|
| Authors | Year | Hybrid | Hybrid | Technique | Criteria Considered | |||
| Wind | Solar | Hydro | Wind–Solar | Hydro-Solar | ||||
| Aydin et al. [16] | 2013 | X | X | X | GIS-Fuzzy-OWA | Economic and environmental | ||
| Szurek et al. [17] | 2014 | X | GIS-AHP | Technical and socio-environmental | ||||
| Noorollahi et al. [18] | 2016 | X | GIS-KLMM | Technical | ||||
| Noorollahi et al. [19] | 2016 | X | GIS-Fuzzy-AHP | Techno-economic | ||||
| Singh et al. [20] | 2016 | X | GIS-AHP | Techno-economic and socio-environmental | ||||
| Gigovic et al. [21] | 2017 | X | GIS-DANP -MABAC | Technical and environmental | ||||
| Díaz-Cuevas [22] | 2018 | X | GIS-AHP | Techno-economic and environmental | ||||
| Yousefi et al. [23] | 2018 | X | GIS-Boolean-Fuzzy | Techno-economic and environmental | ||||
| Ghorbani et al. [24] | 2019 | X | GIS-TOPSIS | Techno-economic | ||||
| Rana et al. [25] | 2020 | X | GIS-AHP-WPM -TOPSIS | Techno-economic | ||||
| Albraheem et al. [26] | 2021 | X | GIS-AHP | Techno-economic | ||||
| Jafari et al. [27] | 2021 | X | GIS-BWM | Techno-economic | ||||
| Görtz et al. [28] | 2022 | X | GIS | Technical | ||||
| Zalhaf et al. [29] | 2022 | X | GIS-Fuzzy-AHP | Technical and environmental | ||||
| Huang et al. [30] | 2022 | X | GIS-AHP | Techno-economic and socio-environmental | ||||
| This study | 2022 | X | X | X | X | X | GIS-Fuzzy-AHP | Techno-economic and socio-environmental |
| Restriction Layer | Criteria | References |
|---|---|---|
| R01—Distance from active fault kines | Less than 100 m | [42,43] |
| R02—Distance from protected areas and ancestral domains | Less than 1 km | [44,45,46] |
| R03—Distance from urban areas | Less than 2 km | [18,47] |
| R04—Distance from streams/rivers * | Greater than 2 km | [24,28] |
| Socio-Environmental Suitability Objectives | Criteria | References |
|---|---|---|
| C01—Distance from airports | Greater than 3 km | [18,21,29] |
| C02—Distance from protected and conservation areas | Greater than 2 km | [17,18,30] |
| C03—Distance from urban areas | Greater than 2 km | [22,29,48] |
| C04—Distance from rural settlements | Greater than 1 km | [18,22,30] |
| C05—Distance from coastlines | Greater than 400 m | [22,29,48] |
| Socio-Environmental Suitability Objectives | Criteria | References |
|---|---|---|
| C06—Distance from coastline | Greater than 100 m | [16,49] |
| C07—Distance from airports | Greater than 3 km | [16,49] |
| C08—Distance from lakes and wetlands | Greater than 2.5 km | [16,23,50] |
| C09—Distance from agricultural areas | Greater than 1 km | [19,23,26] |
| Socio-Environmental Suitability Objectives | Criteria | References |
|---|---|---|
| C10—Distance from protected and conservation areas | Greater than 1 km | [27,51,52] |
| C11—Distance from urban areas | Greater than 3 km | [25,27] |
| C12—Distance from agricultural areas | Greater than 1 km | [25,27,52] |
| C13—Distance from residential areas | Greater than 1 km | [20,27,51,52] |
| Techno-Economic Suitability Objectives | Criteria | References |
|---|---|---|
| C14—Wind Speed | Greater than 4.5 m/s | [22,29,48] |
| C15—Slope | Lesser than 30% | [17,22,29,48] |
| C16—Distance from transmission lines | Lesser than 10 km | [16,29,48] |
| C17—Distance from main roads | Lesser than 10 km | [16,22,29,48] |
| Techno-Economic Suitability Objectives | Criteria | References |
|---|---|---|
| C18—Solar energy generation | Greater than 4 kWh/m (yearly) | [16,19,26,53] |
| C19—Slope | Lesser than 3% | [23,53,54,55] |
| C20—Distance from transmission lines | Lesser than 10 km | [23,26,53,55] |
| C21—Distance from main and minor roads | Lesser than 10 km | [19,53,55,56] |
| Techno-Economic Suitability Objectives | Criteria | References |
|---|---|---|
| C22—Slope | Greater than 2° | [27,51,57] |
| C23—Distance from transmission network | Lesser than 20 km | [25,27,57,58] |
| C24—Distance from main and minor roads | Lesser than 10 km | [25,58,59] |
| C25—Distance from site with identified energy potential | Lesser than 3 km | [25,27,57,58] |
| Suitability Criteria | FM Type | a-Value | b-Value |
|---|---|---|---|
| Wind (Socio-Environmental) | |||
| C01—Distance from airports | Linear-Ascending | 3 km | 6 km |
| C02—Distance from protected and conservation areas | Linear-Ascending | 2 km | 8 km |
| C03—Distance from urban areas | Linear-Ascending | 2 km | 6 km |
| C04—Distance from rural settlements | Linear-Ascending | 1 km | 7 km |
| C05—Distance from coastlines | Linear-Ascending | 400 m | 1 km |
| Solar (Socio-Environmental) | |||
| C06—Distance from coastline | Linear-Ascending | 100 m | 1 km |
| C07—Distance from airports | Linear-Ascending | 3 km | 6 km |
| C08—Distance from lakes and wetlands | Linear-Ascending | 2.5 km | 6 km |
| C09—Distance from agricultural areas | Linear-Ascending | 1 km | 2 km |
| Hydropower (Socio-Environmental) | |||
| C10—Distance from protected and conservation areas | Linear-Ascending | 1 km | 6 km |
| C11—Distance from urban areas | Linear-Ascending | 3 km | 8 km |
| C12—Distance from agricultural areas | Linear-Ascending | 1 km | 5 km |
| C13—Distance from residential areas | Linear-Ascending | 1 km | 5 km |
| Wind (Techno-Economic) | |||
| C14—Wind Speed | Linear-Ascending | 4.5 m/s | 8 m/s |
| C15—Slope | Linear-Descending | 10% | 30% |
| C16—Distance from transmission lines | Linear-Descending | 5 km | 10 km |
| C17—Distance from main roads | Linear-Descending | 2 km | 10 km |
| Solar (Techno-Economic) | |||
| C18—Solar energy generation | Linear-Ascending | 4 kWh/m | 5 kWh/m |
| C19—Slope | Linear-Descending | 1% | 3% |
| C20—Distance from transmission lines | Linear-Descending | 3 km | 10 km |
| C21—Distance from urban areas | Linear-Descending | 3 km | 10 km |
| Hydropower (Techno-Economic) | |||
| C22—Slope | Linear-Ascending | 2° | 10° |
| C23—Distance from transmission network | Linear-Descending | 3 km | 10 km |
| C24—Distance from major and minor roads | Linear-Descending | 3 km | 10 km |
| C25—Distance from site with identified energy potential | Linear-Descending | 500 m | 3 km |
| Linguistic Scales for Importance | Triangular Fuzzy Number (TFN) | Triangular Fuzzy Reciprocal Numbers |
|---|---|---|
| Equally Important (EI) | (1,1,1) | (1,1,1) |
| Intermediate 1 (IM1) | (1,2,3) | (1/3,1/2,1) |
| Moderately Important (MI) | (2,3,4) | (1/4,1/3,1/2) |
| Intermediate 2 (IM2) | (3,4,5) | (1/5, 1/4, 1/3) |
| Important (I) | (4,5,6) | (1/6,1/5,1/4) |
| Intermediate 3 (IM3) | (5,6,7) | (1/7,1/6/1/5) |
| Very Important (VI) | (6,7,8) | (1/8,1/7,1/6) |
| Intermediate 4 (IM4) | (7,8,9) | (1/9,1/8,1/7) |
| Absolutely Important (AI) | (9,9,9) | (1/9,1/9,1/9) |
| Suitability Index Value—SI1 (SEI-W/SEI-S/SEI-H) | Suitability Index Value—SI2 (TEI-W/TEI-W/WPI) | Resulting Index Value Individual (OSI-W/OSI-S/OSI-H) Hybrid (OSI-WS/OSI-HS) | Decision |
|---|---|---|---|
| 0 ≤ < 0.5 | 0 ≤ < 0.5 | 0 | Reject (Unsuitable) |
| 0.5 ≤ < 1.0 | 0 ≤ < 0.5 | 0 | Reject (Unsuitable) |
| 0 ≤ ≤ 0.5 | 0.5 ≤ ≤ 1.0 | 0 | Reject (Unsuitable) |
| 0.5 ≤ ≤ 1.0 | 0.5 ≤ ≤ 1.0 | minimum[,] | Accept (Suitable) |
| Suitability Criteria | Calculated Weight |
|---|---|
| Wind (Socio-Environmental) | |
| C01—Distance from airports | 4.60% |
| C02—Distance from protected and conservation areas | 37.83% |
| C03—Distance from urban areas | 9.82% |
| C04—Distance from rural settlements | 13.14% |
| C05—Distance from coastlines | 34.61% |
| Solar (Socio-Environmental) | |
| C06—Distance from coastline | 10.31% |
| C07—Distance from airports | 18.75% |
| C08—Distance from lakes and wetlands | 23.98% |
| C09—Distance from agricultural areas | 46.96% |
| Hydro (Socio-Environmental) | |
| C10—Distance from protected and conservation areas | 45.80% |
| C11—Distance from urban areas | 8.83% |
| C12—Distance from agricultural areas to | 28.31% |
| C13—Distance from residential areas | 17.06% |
| Suitability Criteria | Calculated Weight |
|---|---|
| Wind (Techno-Economic) | |
| C14—Wind speed | 52.16% |
| C15—Slope | 20.91% |
| C16—Distance from transmission lines | 19.00% |
| C17—Distance from main roads | 7.93% |
| Solar (Techno-Economic) | |
| C18—Solar energy generation | 51.17% |
| C19—Slope | 25.91% |
| C20—Distance from transmission lines | 17.08% |
| C21—Distance from urban areas | 5.84% |
| Hydro (Techno-Economic) | |
| C22—Slope | 10.05% |
| C23—Distance from transmission network | 17.06% |
| C24—Distance from major and minor roads | 23.36% |
| C25—Distance from site with identified energy potential | 49.53% |
| Municipality/City | Wind (km) | Solar (km) | Hydro (km) | Wind–Solar (km) | Hydro–Solar (km) |
|---|---|---|---|---|---|
| Bacolod | 0 | 46.89 | 43.84 | 0 | 37.23 |
| Baloi | 0 | 2.48 | 10.74 | 0 | 0 |
| Baroy | 4.13 | 50.36 | 5.09 | 2.97 | 4.60 |
| Iligan City | 0 | 333.56 | 316.31 | 0 | 203.26 |
| Kapatagan | 58.25 | 119.62 | 68.71 | 50.35 | 50.27 |
| Kauswagan | 0 | 40.74 | 30.39 | 0 | 30.34 |
| Kolambugan | 8.00 | 63.87 | 35.30 | 8.00 | 35.26 |
| Lala | 17.05 | 29.13 | 2.79 | 8.13 | 1.40 |
| Linamon | 0 | 17.13 | 7.38 | 0 | 7.38 |
| Magsaysay | 4.97 | 59.59 | 66.45 | 3.17 | 46.28 |
| Maigo | 0 | 75.22 | 77.66 | 0 | 44.07 |
| Matungao | 0 | 26.52 | 38.69 | 0 | 24.50 |
| Munai | 1.06 | 8.01 | 97.87 | 0 | 3.38 |
| Nunungan | 0 | 31.23 | 61.28 | 0 | 18.76 |
| Pantao Ragat | 0 | 8.29 | 47.08 | 0 | 7.01 |
| Pantar | 0 | 5.50 | 2.07 | 0 | 0.61 |
| Poona Piagapo | 0 | 43.22 | 81.60 | 0 | 41.58 |
| Salvador | 0 | 19.94 | 0.90 | 0 | 0.90 |
| Sapad | 3.25 | 10.97 | 7.44 | 1.26 | 2.01 |
| Sultan Naga Dimaporo | 49.29 | 123.63 | 43.61 | 47.48 | 34.61 |
| Tagoloan | 0 | 1.90 | 21.62 | 0 | 1.90 |
| Tangcal | 4.46 | 9.35 | 104.38 | 0 | 6.40 |
| Tubod | 5.47 | 103.59 | 34.79 | 4.84 | 27.26 |
| Total | 155.93 | 1230.73 | 1206.00 | 126.20 | 629.02 |
| Renewable Energy System Type | Suitable Area Fuzzy-AHP Weights (km2) | Suitable Area Equal Weights (km2) |
|---|---|---|
| Wind | 155.93 | 1762.66 |
| Solar | 1230.73 | 1149.14 |
| Hydro | 1206.00 | 1610.22 |
| Wind–Solar | 126.20 | 1116.76 |
| Hydro-Solar | 629.02 | 750.12 |
Disclaimer/Publisher’s Note: The statements, opinions and data contained in all publications are solely those of the individual author(s) and contributor(s) and not of MDPI and/or the editor(s). MDPI and/or the editor(s) disclaim responsibility for any injury to people or property resulting from any ideas, methods, instructions or products referred to in the content. |
© 2023 by the authors. Licensee MDPI, Basel, Switzerland. This article is an open access article distributed under the terms and conditions of the Creative Commons Attribution (CC BY) license (https://creativecommons.org/licenses/by/4.0/).
Share and Cite
Tarife, R.; Nakanishi, Y.; Zhou, Y.; Estoperez, N.; Tahud, A. Integrated GIS and Fuzzy-AHP Framework for Suitability Analysis of Hybrid Renewable Energy Systems: A Case in Southern Philippines. Sustainability 2023, 15, 2372. https://doi.org/10.3390/su15032372
Tarife R, Nakanishi Y, Zhou Y, Estoperez N, Tahud A. Integrated GIS and Fuzzy-AHP Framework for Suitability Analysis of Hybrid Renewable Energy Systems: A Case in Southern Philippines. Sustainability. 2023; 15(3):2372. https://doi.org/10.3390/su15032372
Chicago/Turabian StyleTarife, Rovick, Yosuke Nakanishi, Yicheng Zhou, Noel Estoperez, and Anacita Tahud. 2023. "Integrated GIS and Fuzzy-AHP Framework for Suitability Analysis of Hybrid Renewable Energy Systems: A Case in Southern Philippines" Sustainability 15, no. 3: 2372. https://doi.org/10.3390/su15032372