Article

Properties of Soil-Based Flowable Fill under Drying–Wetting and Freeze–Thaw Actions

1
Economics and Technology Research Institute, Jiangsu Electric Power Co., Ltd., Nanjing 211103, China
2
School of Civil Engineering, Southeast University, Nanjing 210096, China
*
Author to whom correspondence should be addressed.
Sustainability 2023, 15(3), 2390; https://doi.org/10.3390/su15032390
Submission received: 5 January 2023 / Revised: 13 January 2023 / Accepted: 18 January 2023 / Published: 28 January 2023
(This article belongs to the Special Issue Sustainable Geotechnical Treatment Technology)

Abstract

:
Flowable fills are a type of fill material with many construction applications, including transportation engineering, building engineering, water conservancy constructions, etc. Flowable fills usually consist of cementing agents, water, and aggregates such as soils or other waste or cheap materials. Flowable fills have the characteristics of high flowability, self-leveling, self-compacting, high and adjustable strength, and the ability to adopt waste and cheap materials. In this study, a waste soil-based flowable fill was investigated under drying–wetting and freeze–thaw actions. Under six drying–wetting cycles, flowable fill specimens underwent a continuous reduction in strength, accompanying the mass losses and the changes in micro-structures. The level of strength reduction increased with decreased addition of Portland cement and increased addition of water. After six drying–wetting cycles, the specimens showed a 27–51% strength reduction as compared to their counterparts with no drying–wetting actions. Under freeze–thaw cycles, the specimens also showed noticeable but insignificant degradation. After six freeze–thaw cycles, the level of strength reduction ranged from 9–20%. Most of the strength reduction occurred during the first three cycles. Based on the test data, an empirical model was proposed to predict the strength reduction under drying–wetting cycles. The results proved that flowable fills may undergo a relatively large reduction in their engineering performance under adverse environments, especially drying–wetting actions. The implications of the results for construction are also discussed in the paper.

1. Introduction

Flowable fills are a type of filling material consisting mainly of solid aggregates, cementitious materials, and water [1]. They have high flowability before hardening, and a certain level of strength after hardening. Flowable fills can be widely used as fill materials for various types of construction projects [2,3,4]. The typical compositions of flowable fill vary in different countries and regions. For example, in China’s engineering practice in recent years, the research and application of flowable fills using Portland cement as a curing agent and waste soils as raw materials are very common. In engineering practice in the United States, flowable fills based on fly ash and/or sand aggregates are used in a wide range of applications [4,5]. This is mainly due to factors such as the costs of materials in each region, the types of waste output, the type of technology adopted, etc. Flowable fills generally have the characteristics of high flowability, self-leveling, self-compacting, high and adjustable strength, and the ability to adopt waste and cheap materials.
In most types of flowable fills, mineral materials are the main components. The CLSMs (controlled low-strength materials) commonly used in the United States are mainly composed of fine aggregates and coarse aggregates for concrete (i.e., sand and gravel materials). Fine aggregates and coarse aggregates that do not meet the standards for concrete can also be considered [6,7]. For example, silty sand containing no more than 20% silt can be used for CLSMs. In CLSMs, the use of cohesive soil often brings problems such as insufficient stirring, stickiness, excessive water consumption, material shrinkage, and uncontrollable strength [8]. In China and many other countries, a large amount of waste soils of various compositions are produced in construction development. The utilization of these waste soils can bring economic and environmental benefits [9,10,11,12].
A significant advantage of flowable fill is that it can absorb many types of waste with huge output. In addition to waste soils, the waste materials that can be used include industrial wastes, such as fly ash, cement kiln dust, foundry sand, slag, paper mill wastes [13,14,15,16,17,18], municipal wastes [19,20], mining wastes [21,22], and construction and demolition wastes [23,24]. Among these materials, the output of fly ash is high, and the use of fly ash can bring many technical advantages to flowable fills [25,26]. Fly ash can increase flowability and strength and reduce the bleeding, shrinkage, and permeability of flowable fills. In a typical CSLM mixture, fly ash accounts for about 15% of the total mass. The waste or non-standard materials used as raw materials for flowable fills need to be tested as to whether they meet technical requirements and environmental protection specifications.
Flowable fills are required to meet engineering properties through proportioning design. These engineering properties include flowability, volume stability, curing time, strength, deformation, permeability, light weight, etc. Some special requirements, such as durability under drying–wetting or freeze–thaw cycles, thermal conductivity, electrical conductivity, pH, chemical corrosion resistance, etc., should also be met through the proportioning design if required. Due to the complex and diverse sources of raw materials, the proportioning design can first select a mix ratio from the literature and past experiences, and then adjust iteratively until the design requirements are met. The strength of the flowable fill should meet the needs of specific engineering applications. According to the literature, most of the unconfined compressive strengths are in the <2 MPa range for most of the flowable fills [27]. This range can meet the strength needs of most engineering projects. In addition, on some occasions, the strength of the flowable fill should not be too high, such as under pipeline backfill, municipal road filling, or other conditions. This is because it is necessary to consider the need for excavation and maintenance in these conditions, and some temporary and short-term projects need to consider the convenience of later demolition. Generally speaking, filled materials with a strength lower than 0.7 MPa can be excavated manually, and filled materials with a strength lower than 2.1 MPa can be excavated by machinery such as a backhoe [6]. In addition, the difficulty of excavation is also related to the amount of gravels in raw materials. A flowable fill with more gravels is more difficult to excavate.
Flowable fills can be used in various applications. On some occasions, flowable fills may encounter negative or extreme conditions, such as drying–wetting and freeze–thaw actions. It has been reported that strength and other mechanical and physical properties of flowable fills may be evidently reduced under these conditions. As for the drying–wetting actions, the strength of flowable fills and other cemented soils can be reduced with an increasing number of drying–wetting cycles [28,29,30,31]. The strength change shows fast reduction in the first few cycles and tends to flatten afterwards [28,29,31]. The reduction in strength also accompanies the changes to other properties, such as mass loss and swelling [30,32,33]. It is reported that the strength reduction and degradation of flowable fills due to the drying–wetting actions is mainly due to factors such as mass loss, changes in the micro-fabric, and crack development [30,34]. Empirical models have been proposed that account for the strength reduction in drying–wetting cycles using non-linear relationships [28,29]. For, example, a degradation index has been proposed that accounts for the strength reduction for lightweight cellular cemented construction materials (cemented materials with preformed foam inside) [28]. The degradation index is solely related to initial soaked strength.
As for the freeze–thaw actions, the strength decreases sharply after the first few freeze–thaw cycles then exhibits little change afterwards, as reported in most literature [35,36,37]. However, it has also been reported that cement-treated soil specimens display a wide range of performance changes due to freeze–thaw [38]. Specimens prepared at higher water content exhibited more damage after freeze–thaw exposure compared to the dryer mix design. However, in general, the freeze–thaw resistance of soil can be greatly improved by the addition of cementing agents [39,40,41]. The reduction in strength also accompanies changes to other properties, such as mass loss and the increase in hydraulic conductivity [32,33,42,43]. A major reason could be that the freeze–thaw of pore water can lead to a volume change in material pore structures, causing mass loss and the development of cracks [34,37,44]. Predictive models have been proposed for strength reduction in freeze–thaw cycles [36,45].
For normal construction projects using flowable fills, the effects of drying–wetting and freeze–thaw actions are not considered. However, it can be seen from the aforementioned papers that material degradation of cemented soil due to drying–wetting and freeze–thaw may be considerable. The large amount of water in flowable fills may lead to worse conditions as compared to other types of cemented soil. Most of the aforementioned papers related to drying–wetting and freeze–thaw actions are related to cemented soils, but not to flowable fills. Some studies regarding the drying–wetting or freeze–thaw effect on flowable fills did not use waste soils as raw materials, which was different from what was used in this study [32,33]. Therefore, this study will provide a detailed experimental investigation on the durability of flowable fills under drying–wetting and freeze–thaw cycles. The flowable fill used in the study is based on wasted soil generated from a local construction site. The implications of the results in this paper for construction are also discussed. According to the authors’ knowledge, the properties and degradation of soil-based flowable fills under drying–wetting and freeze–thaw actions have not been fully studied in the past.

2. Materials and Methods

2.1. Materials

The flowable fill tested in this study was prepared by mixing soil, water, and Portland cement together. The soil was obtained from a construction site in Nantong, Jiangsu Province, China. The natural moisture content was 19.2%, the dry density was 1.25 g/cm3, and the specific gravity of the soil particles was 2.49. The soil was a silty sand, according to soil classification. The particle size distribution is given in Figure 1. Portland cement and tape water were used for the test.

2.2. Specimen Preparation

The specimens were prepared by mixing soil, water, and Portland cement together according to the pre-designed mixing ratios. Water and Portland cement were first mixed to obtain the cement slurry. The cement slurry was then used to mix the soil so that the flowable fill could be obtained. This procedure mimicked the flowable fill preparation method used on the construction site adopted by the authors’ team. The specimens were cylindrically shape, 50 mm in diameter, and 100 mm in height. The specimens were cured at a temperature of 20 °C and >95% relative humidity for 28 days.

2.3. Drying–Wetting and Freeze–Thaw Actions

After 28 days of curing, the specimens underwent 0–6 cycles of either drying–wetting or freeze–thaw action. The drying–wetting cycles were carried out based on the following procedure:
  • The specimens were submerged in clean water at 20 °C for 5 h;
  • The specimens were then moved to an oven at 65 °C for 18 h to dry, then transferred to room temperature to complete a drying–wetting cycle;
  • Steps 1 and 2 were repeated for the specimens that required more than one drying–wetting cycle.
The freeze–thaw cycles were carried out based on the following procedure:
  • The specimens were placed in a −15 °C refrigerator for 12 h to freeze them;
  • The specimens were then moved to a curing box at 20 °C temperature and >95% relative humidity for 12 h to thaw;
  • Steps 1 and 2 were repeated for the specimens that required more than one freeze–thaw cycle.
For the procedures, given above, of conducting drying–wetting and freeze–thaw tests, we consulted “Test code for hydraulic concrete (SL/T 352-2020)” and other similar experimental studies.

2.4. Testing Methods

Unconfined compressive tests, mass loss measurement, and SEM imaging were carried out on the flowable fill specimens to investigate the degradation effects of drying–wetting and freeze–thaw actions. In the unconfined compressive test, the testing apparatus was Xinweite YYW-II. The strain rate during the test was 1.0 mm/min. The mass loss was measured using an electronic weighing balance. The SEM apparatus used here was JEOL JSM-6390A.

2.5. Testing Programme

The testing program for drying–wetting and freeze–thaw experiments is given in Table 1 and Table 2, respectively. The water/soil (w/s) ratio ranged from 0.5–0.6, and the cement/soil (c/s) ratio ranged from 0.1–0.15 in both series of tests. It should be noted that soil mass here refers to dry soil particles. During the specimen preparation process, the natural moisture content was measured in order to calculate how much more water needed to be added. For each mixing ratio, 4 specimens were prepared to test under 0, 1, 3, and 6 repetitions of either drying–wetting or freeze–thaw cycles.

3. Results

3.1. Performances after Drying–Wetting Cycles

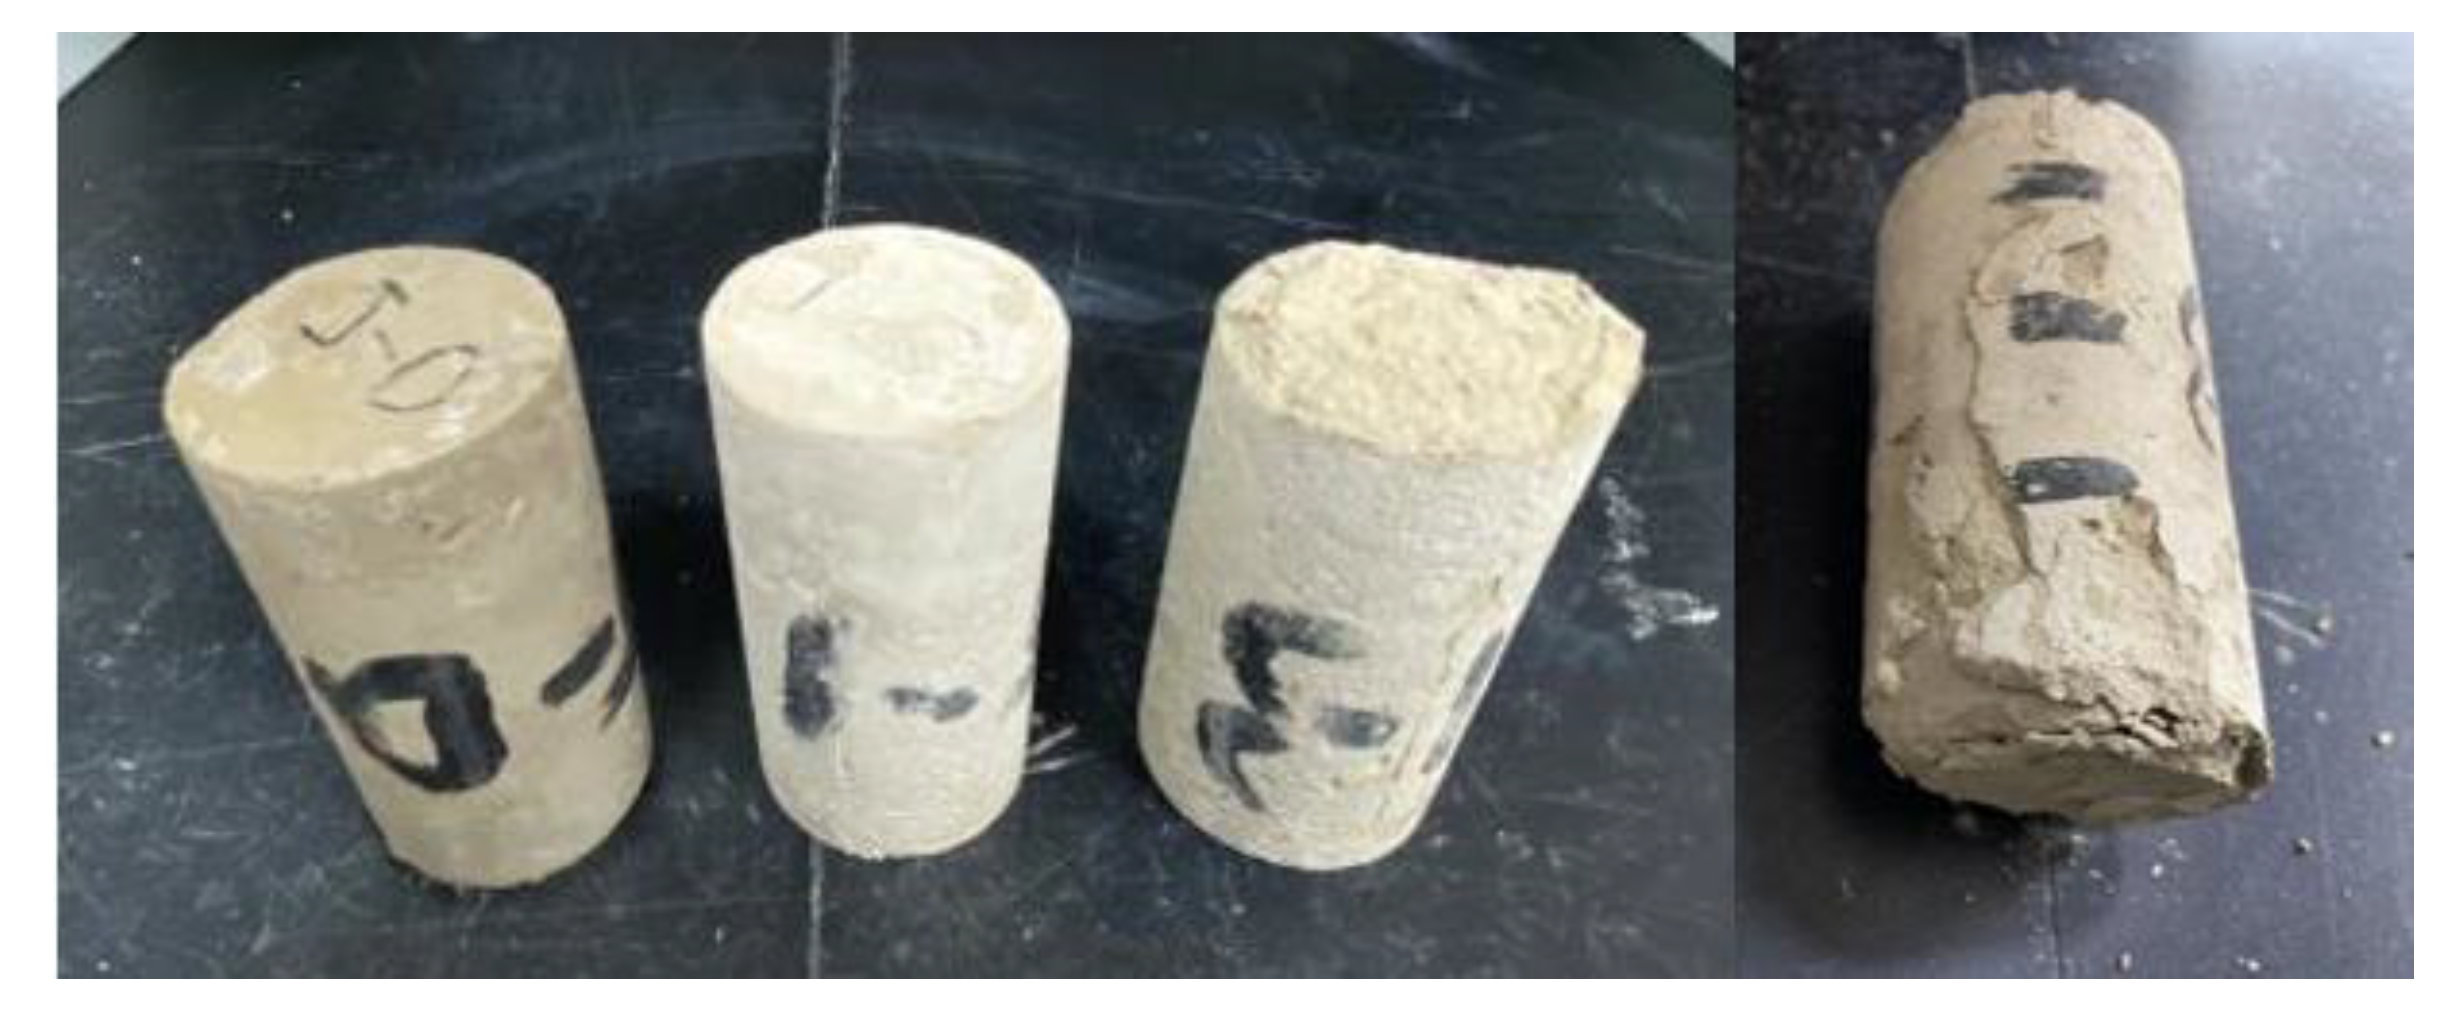
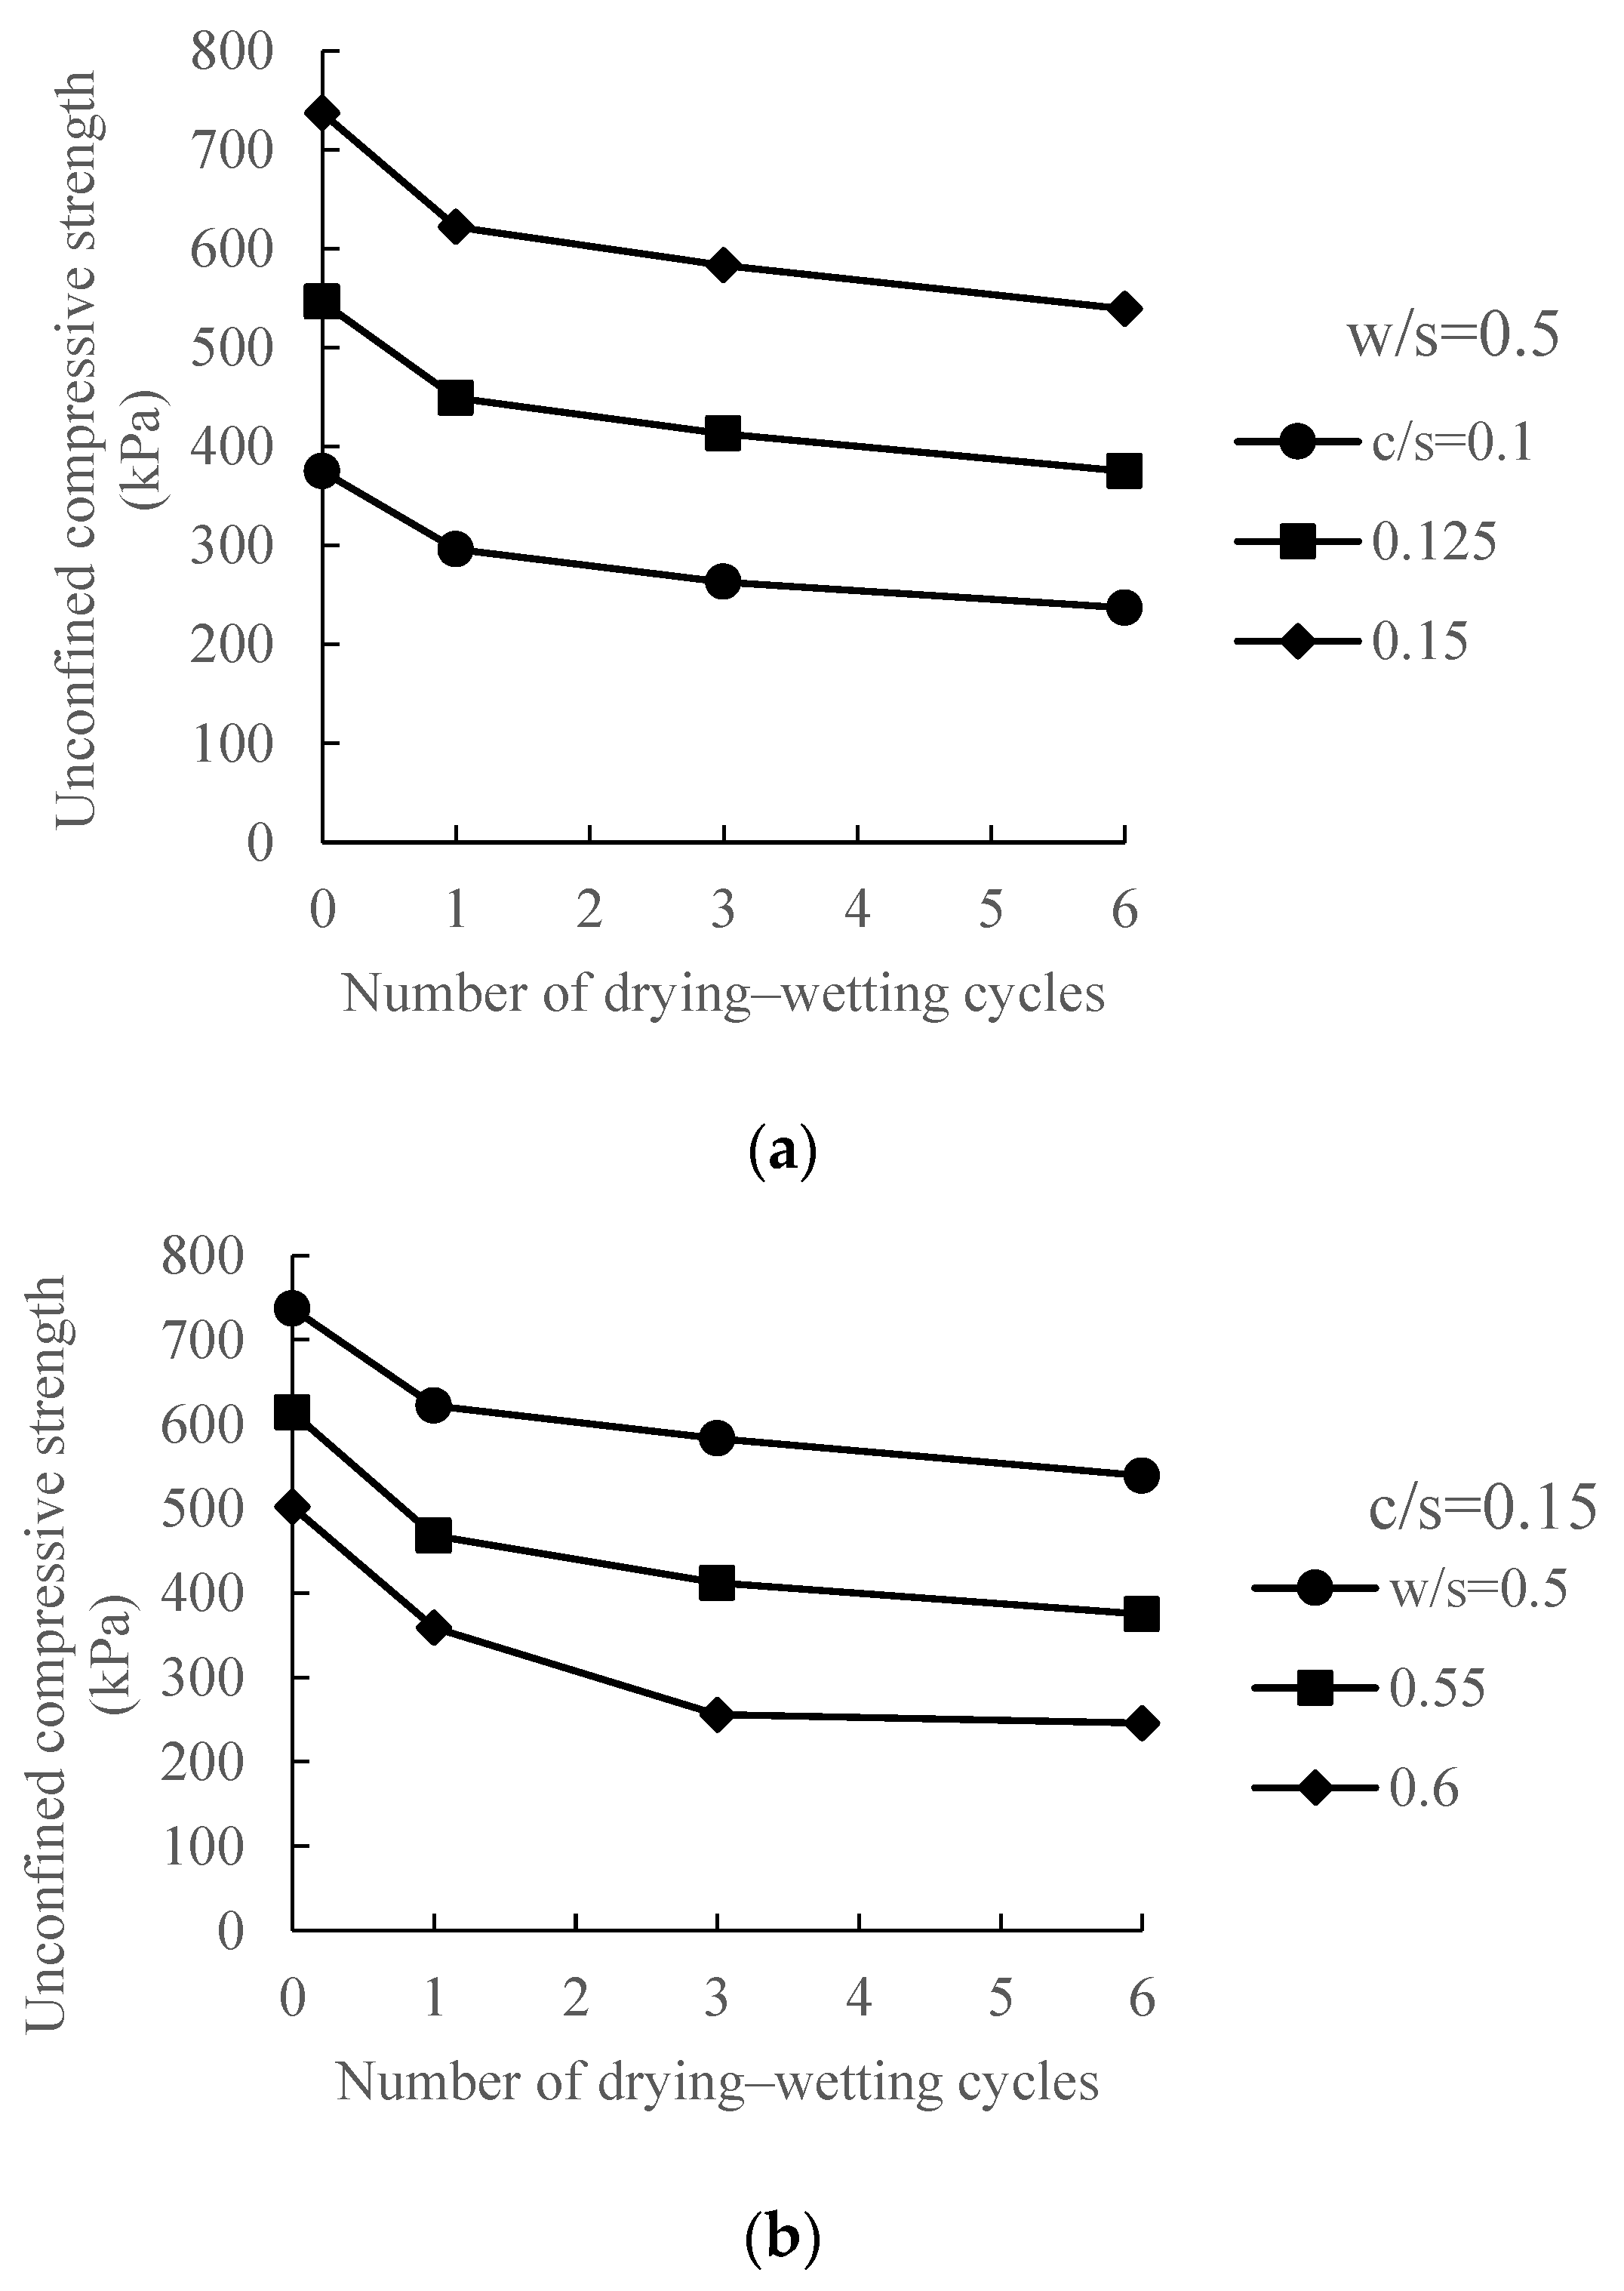
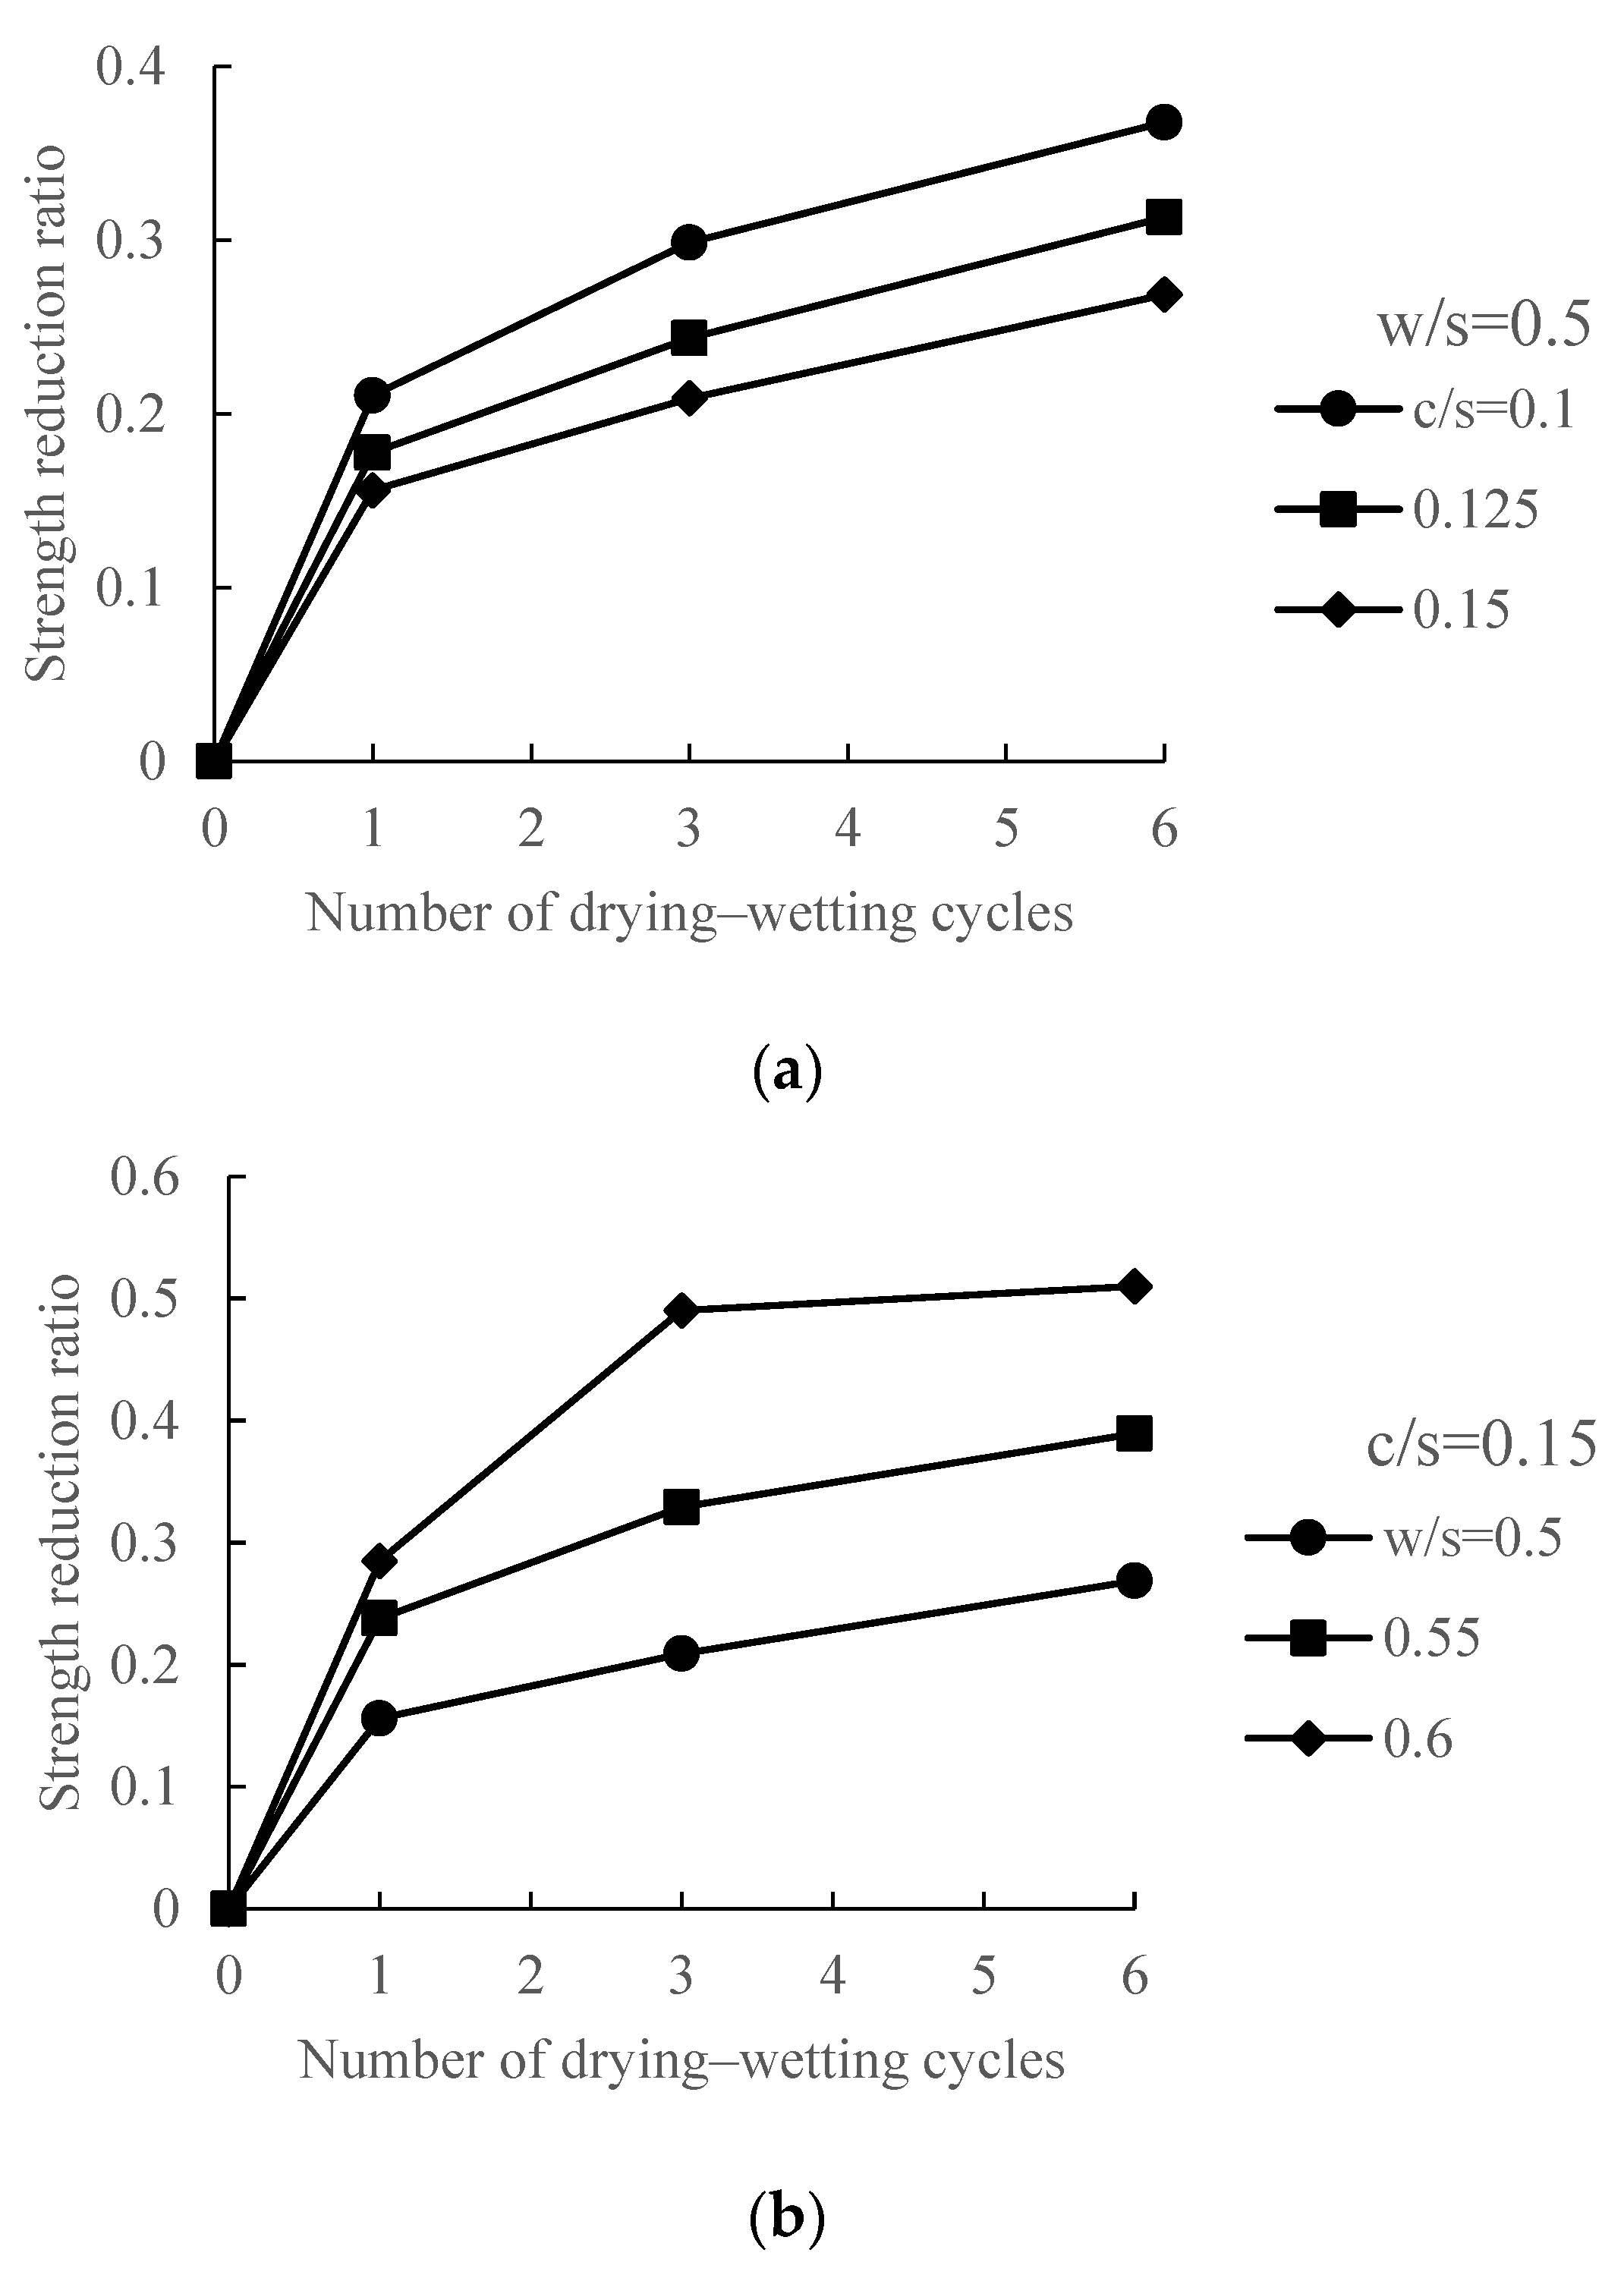
Flowable fill specimens degraded seriously after six cycles of drying–wetting actions, as can be seen in Figure 2. The specimens underwent continuous reduction in strength, accompanying the mass losses and the changes in micro-structures. Detailed results are given here. Figure 3 provides the variations in strength due to the drying–wetting cycles. For the specimens that did not undergo any drying–wetting cycles, the unconfined compressive strength ranged from 375–737 kPa. The strength increased with the addition of Portland cement, and with the decreased addition of water. Due to the continued drying–wetting cycles, the strength gradually reduced. The strength reduction ratio, which is defined as the percentage of strength reduction as compared to that without any drying–wetting cycles, is give in Figure 4. After six drying–wetting cycles, the specimens showed a 27–51% strength reduction as compared to their counterparts with no drying–wetting actions. This level of strength reduction cannot be neglected if the flowable fills are used in drying–wetting cycle environments, especially in heavy load-bearing conditions such as highway embankments. The level of strength reduction increased with decreased addition of Portland cement and increased addition of water. Another noticeable feature in the strength variation is that the strength reduction in terms of the percentages was the largest during the first drying–wetting cycle, and the trend gradually reduced with further cycles. This may imply that the long-term strength could become stable after a certain number of drying–wetting cycles. Similar results were found in other publications [28,29,31].
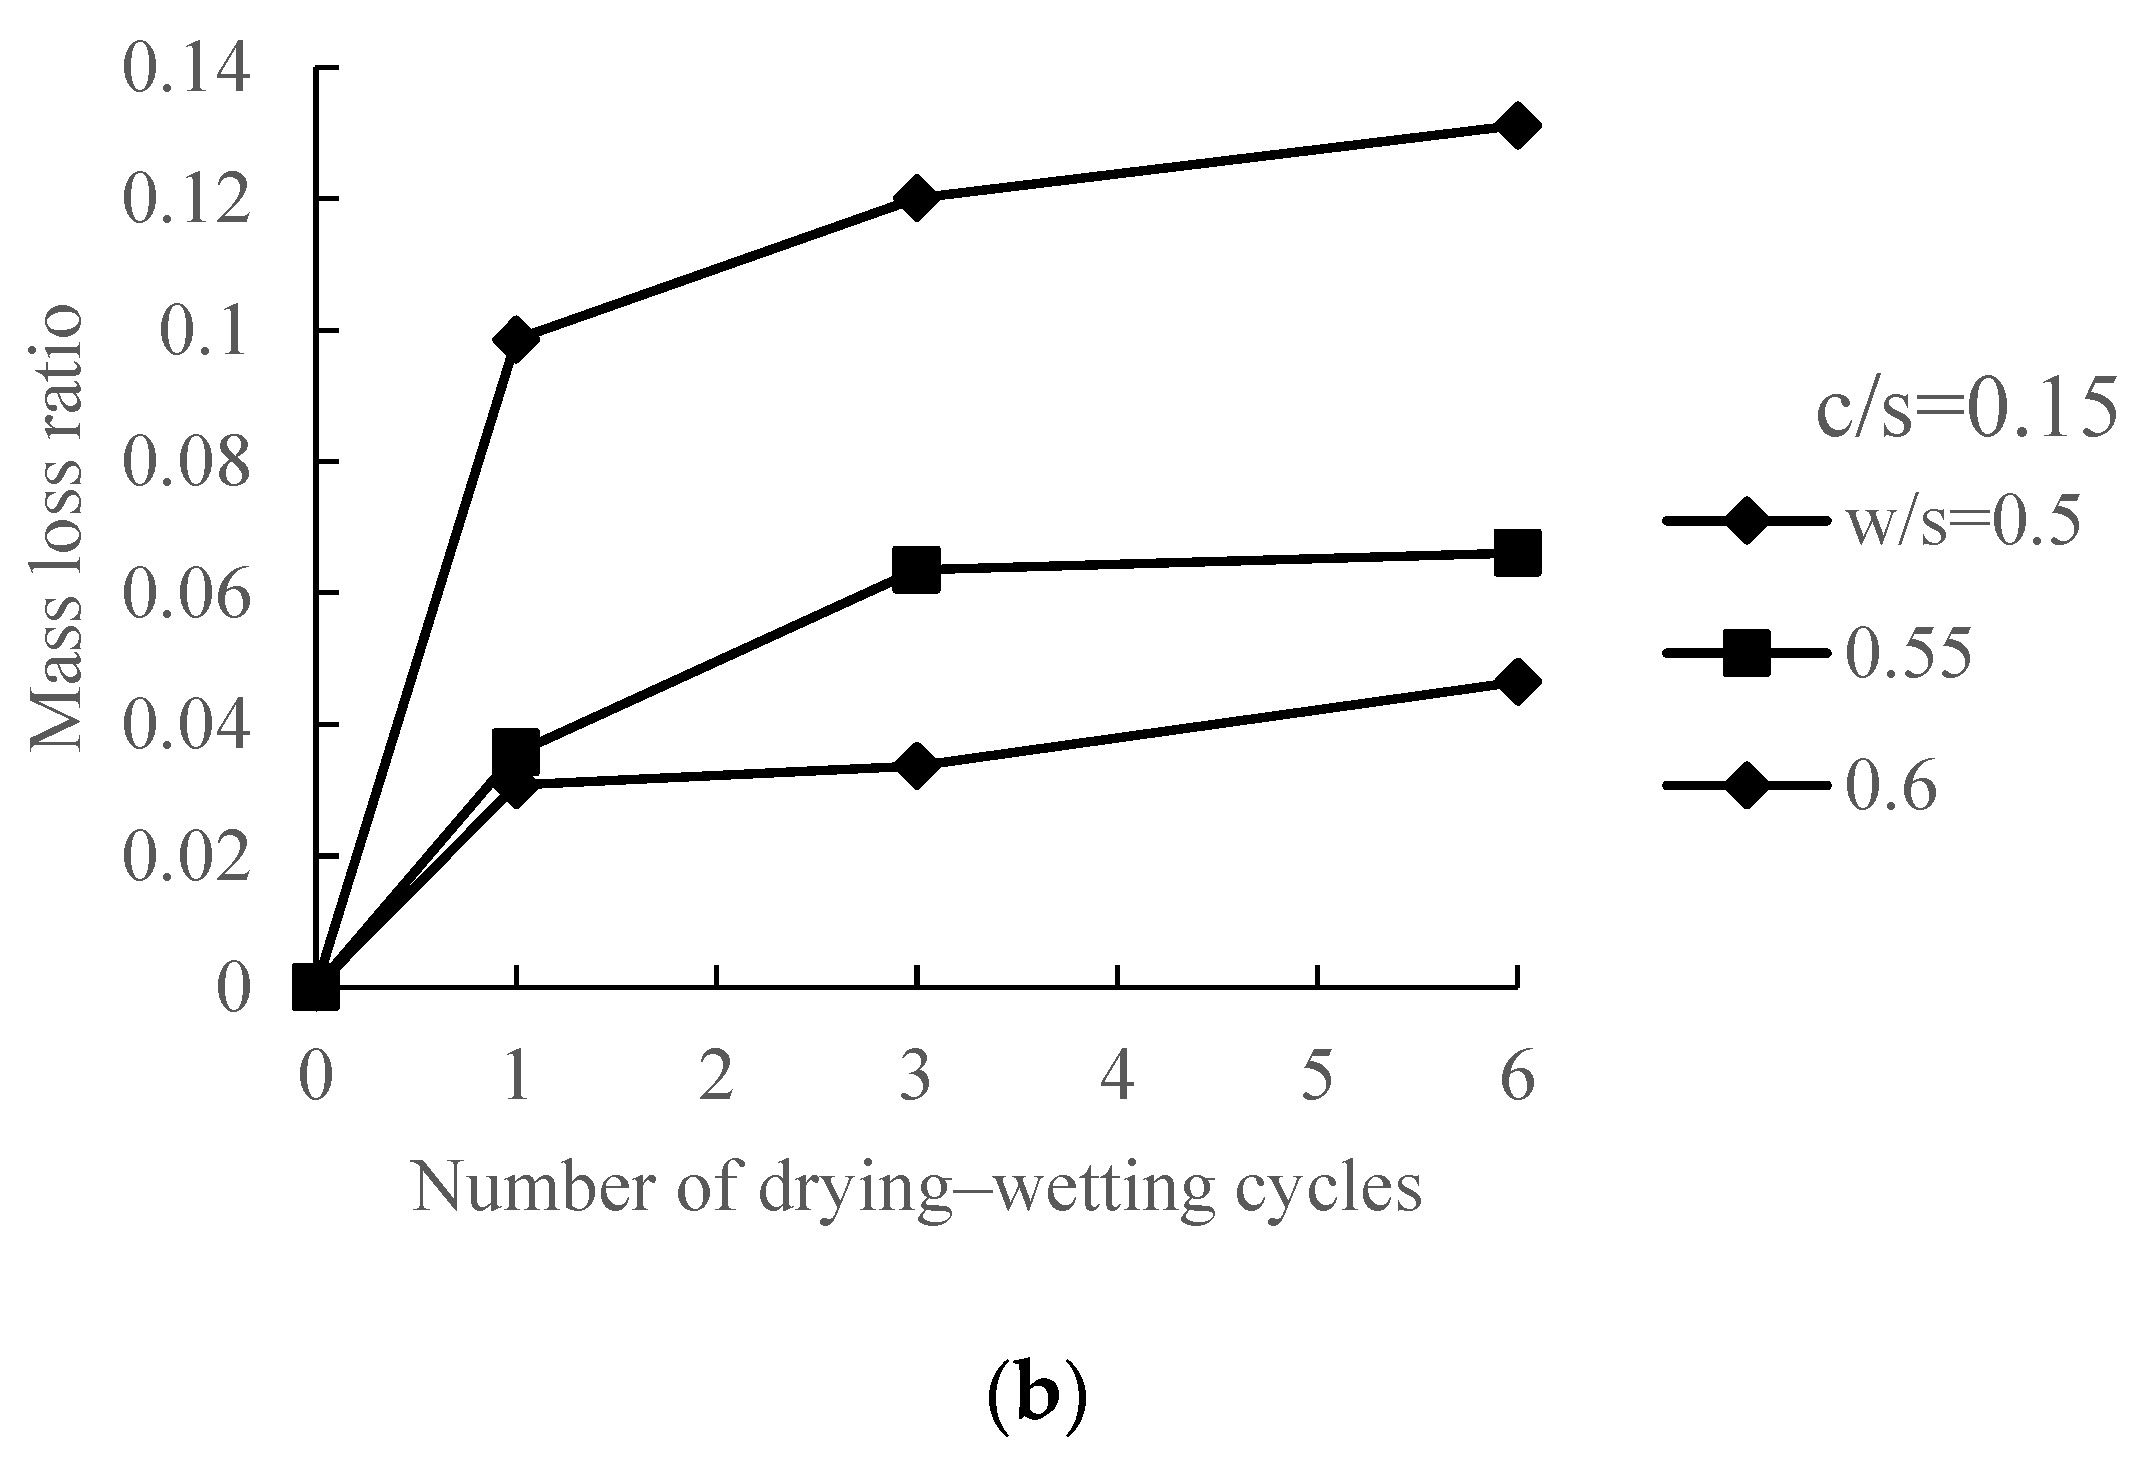
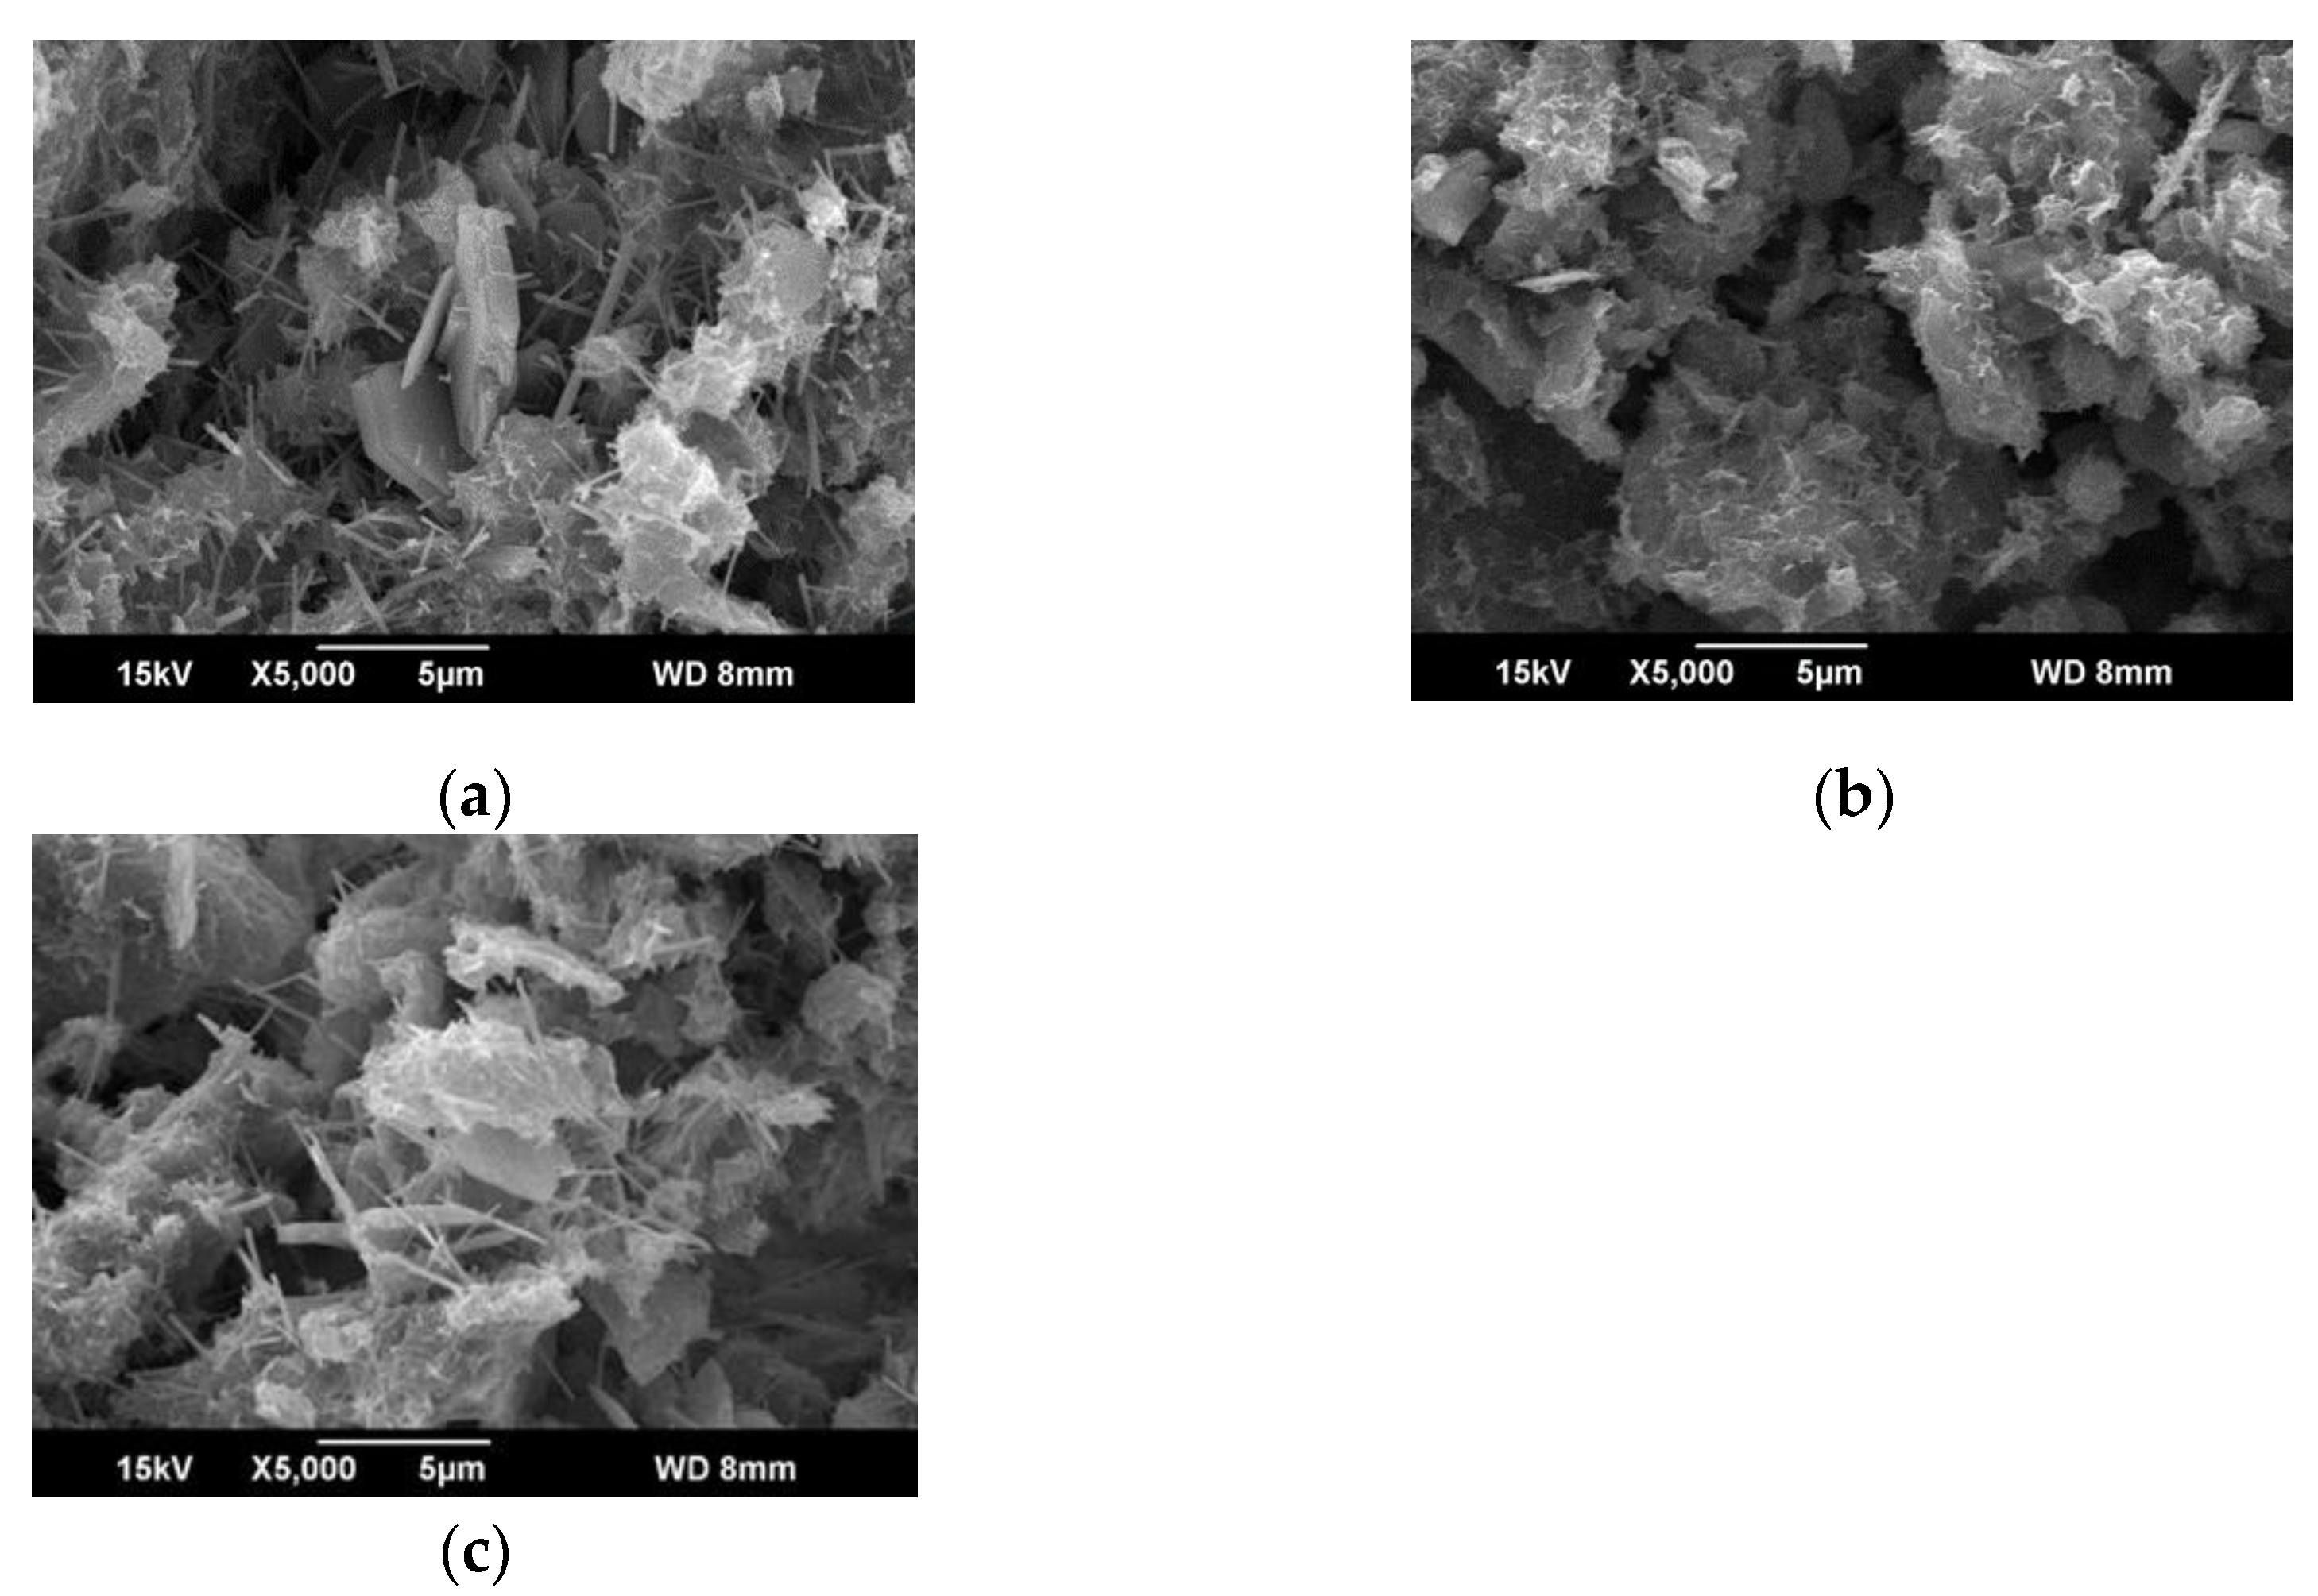
The results of mass loss are given in Figure 5. It can be seen that the variations of mass loss followed a similar trend compared to the strength data. The mass loss was at its largest during the first drying–wetting cycle, and the trend gradually decreased with further cycles. The mass loss decreased with the increased addition of Portland cement and decreased addition of water. The mass loss accompanied the change in the micro-structure of the material. As can be seen in the SEM image in Figure 6, there seems to have been an increase in the pore spaces after the drying–wetting cycles.

3.2. Performances after Freeze–Thaw Cycles

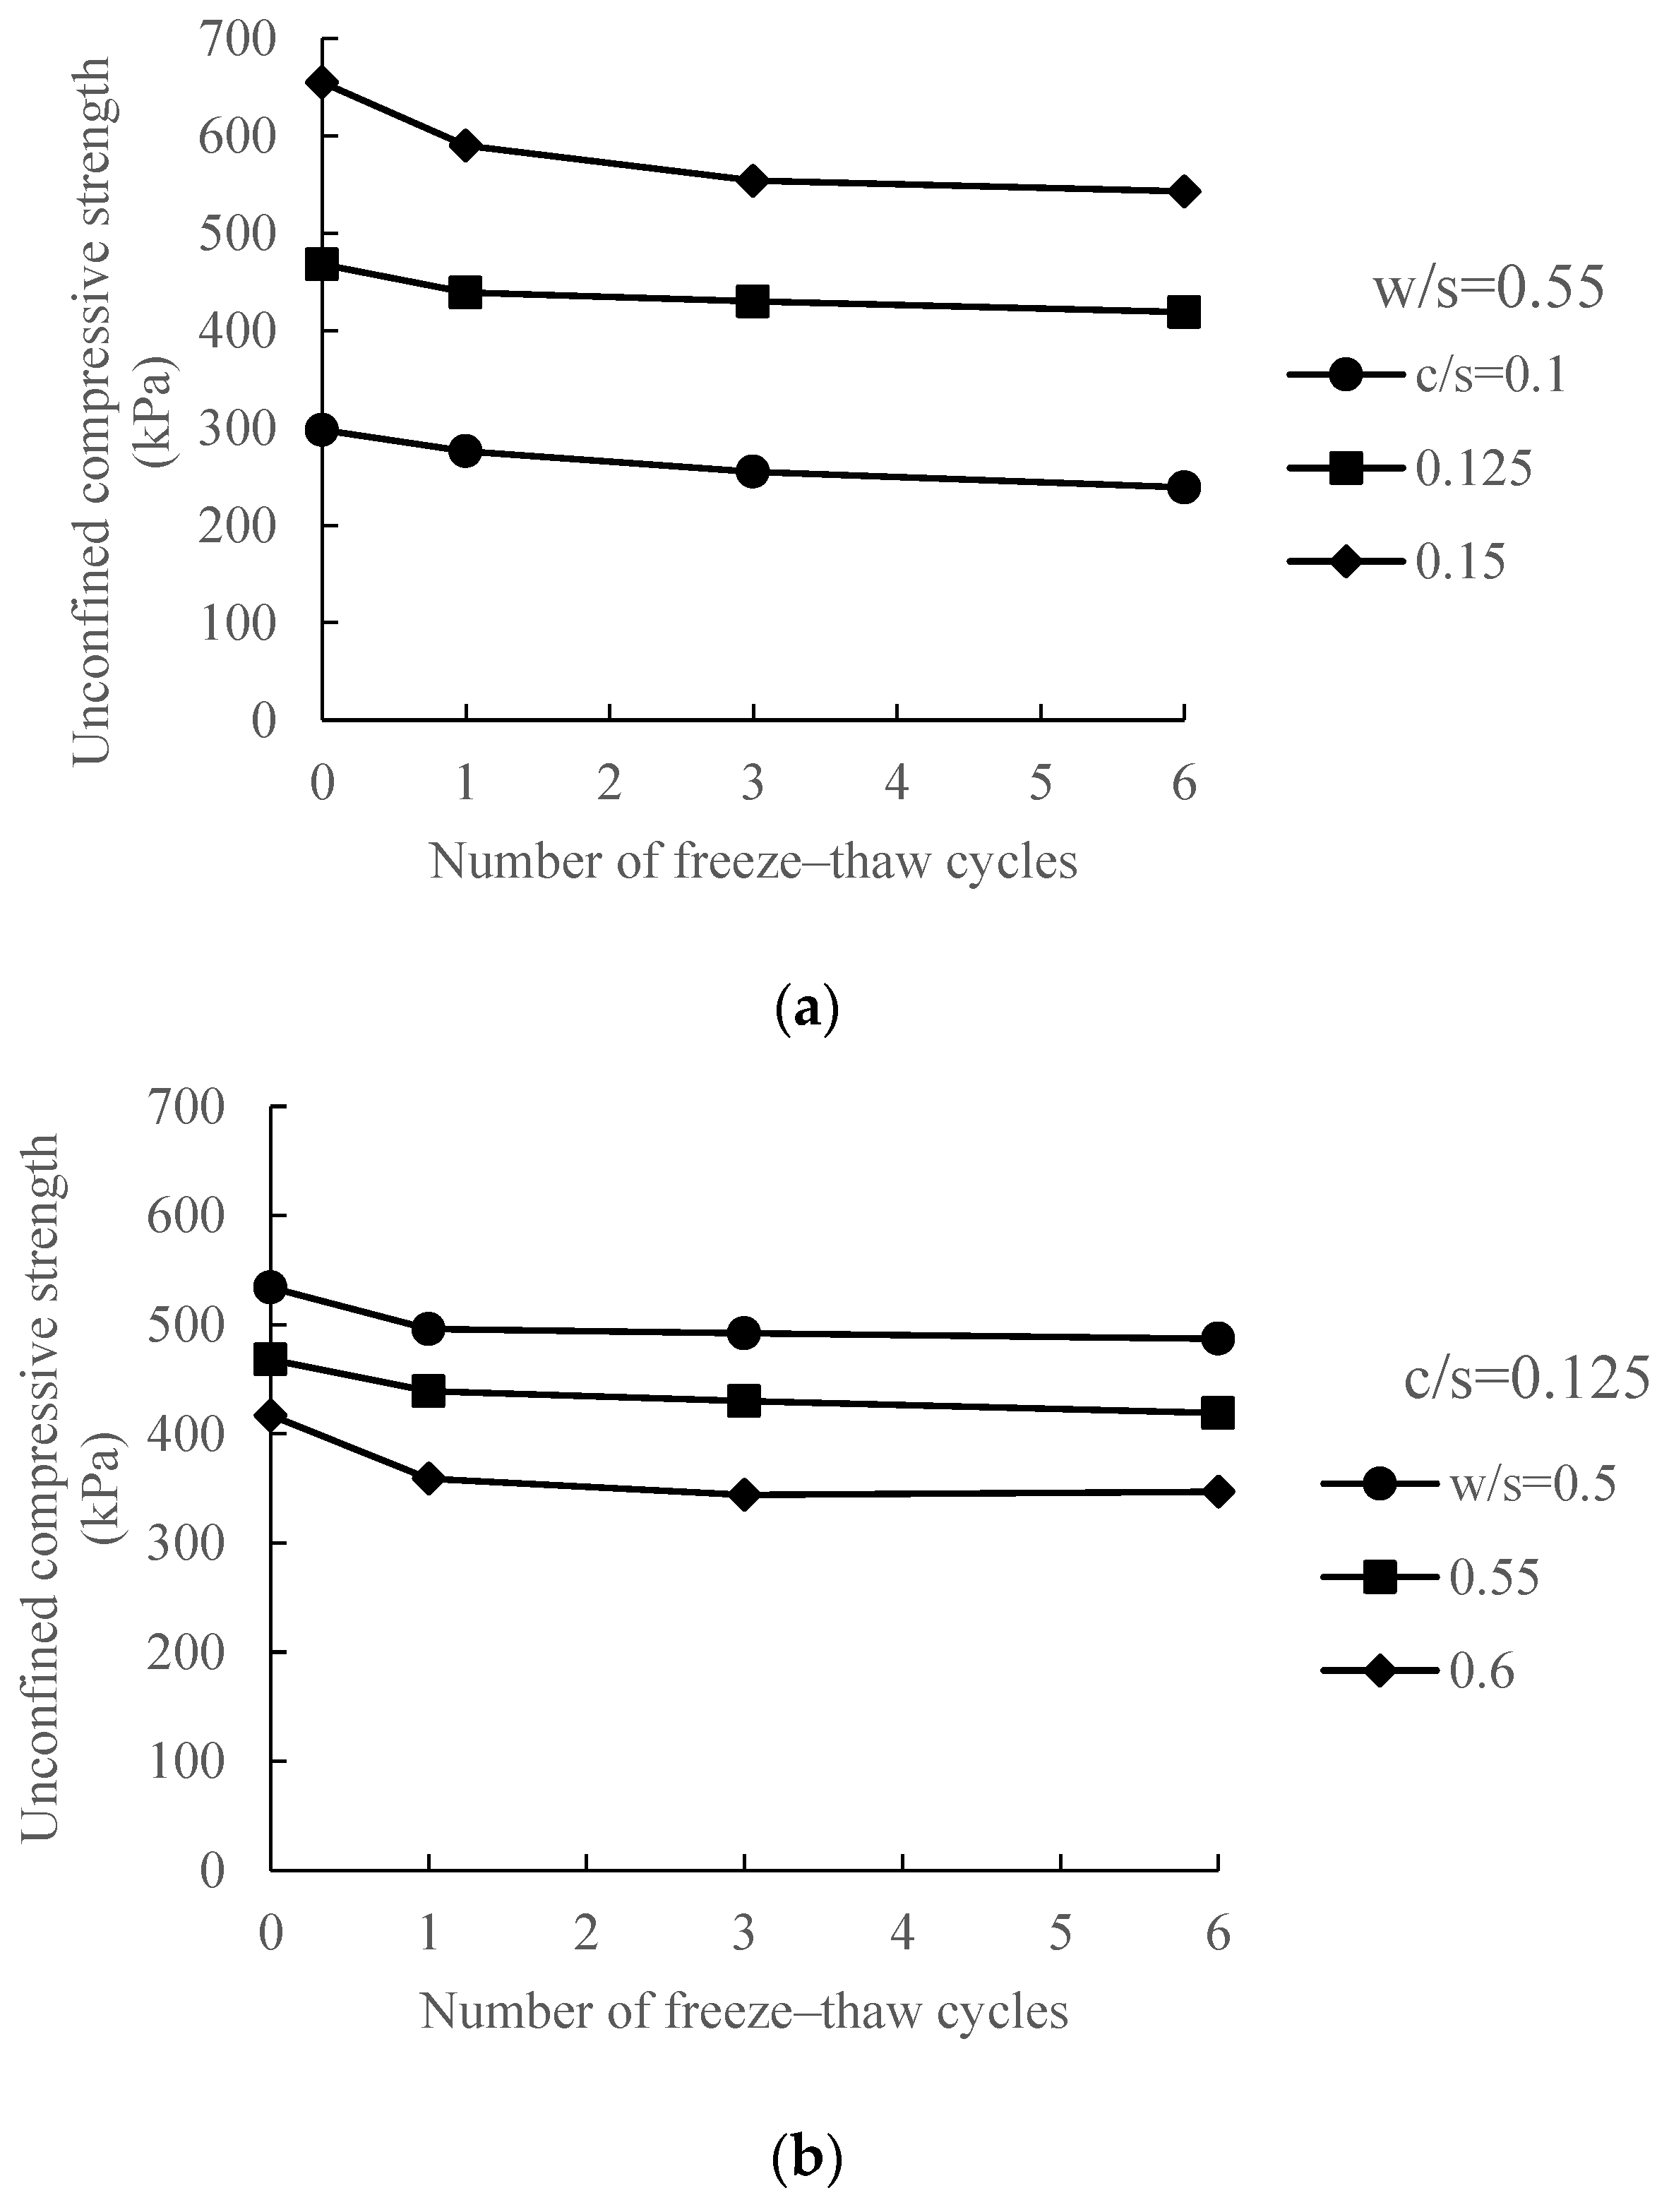
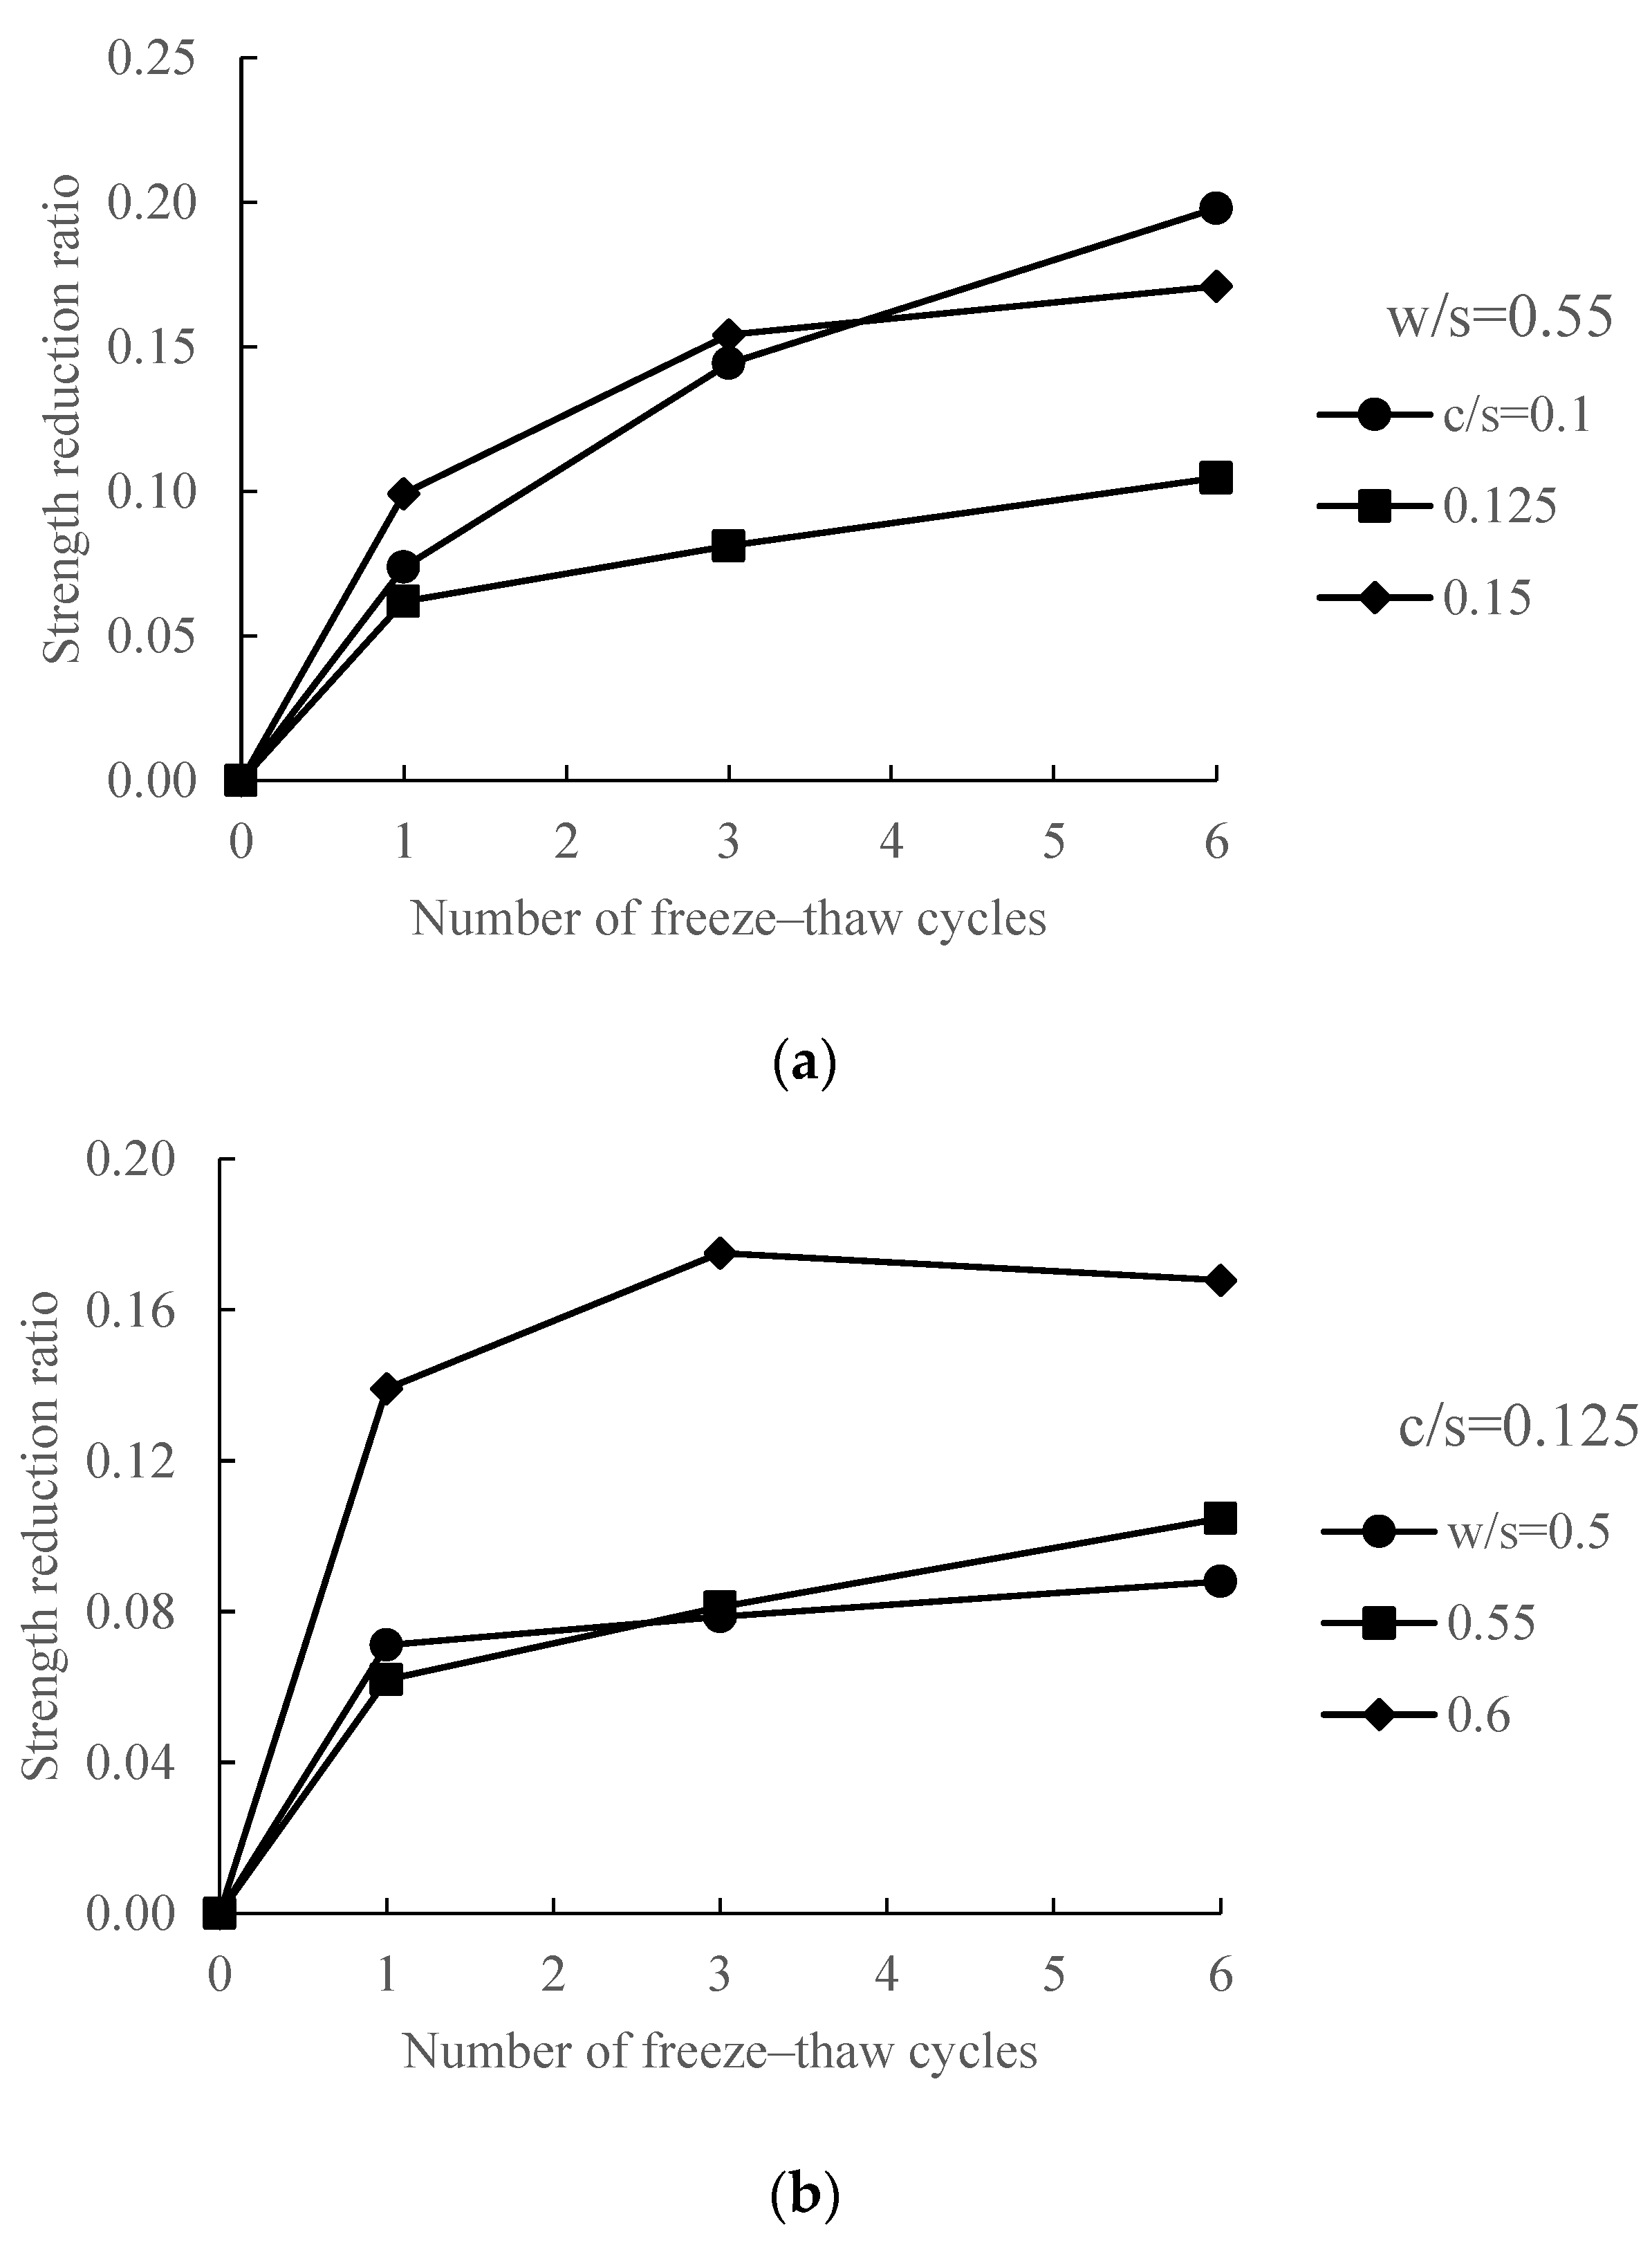
Under freeze–thaw cycles, the specimens showed noticeable, but not significant, degradation, as can be seen in Figure 7. The degradation effects of freeze–thaw cycles seemed less serious as compared to the effects of drying–wetting actions. The variation in strength is shown in Figure 8. For the specimens without any drying–wetting cycles, the unconfined compressive strength ranged from 298–655 kPa. After six freeze–thaw cycles, the level of strength reduction ranged from 9–20%, as shown in Figure 9. The magnitude of strength reduction was the largest in the first cycle, and gradually became weak with more cycles. For most of the test groups, the strength reduction was complete or almost complete after the first three cycles, and the strength showed minimal changes afterwards. At each level of freeze–thaw action, the strength increased with increased Portland cement addition and decreased water addition, as shown in Figure 8. However, in terms of the strength reduction level, the effects of Portland cement and the amount of water are not clear (Figure 9).
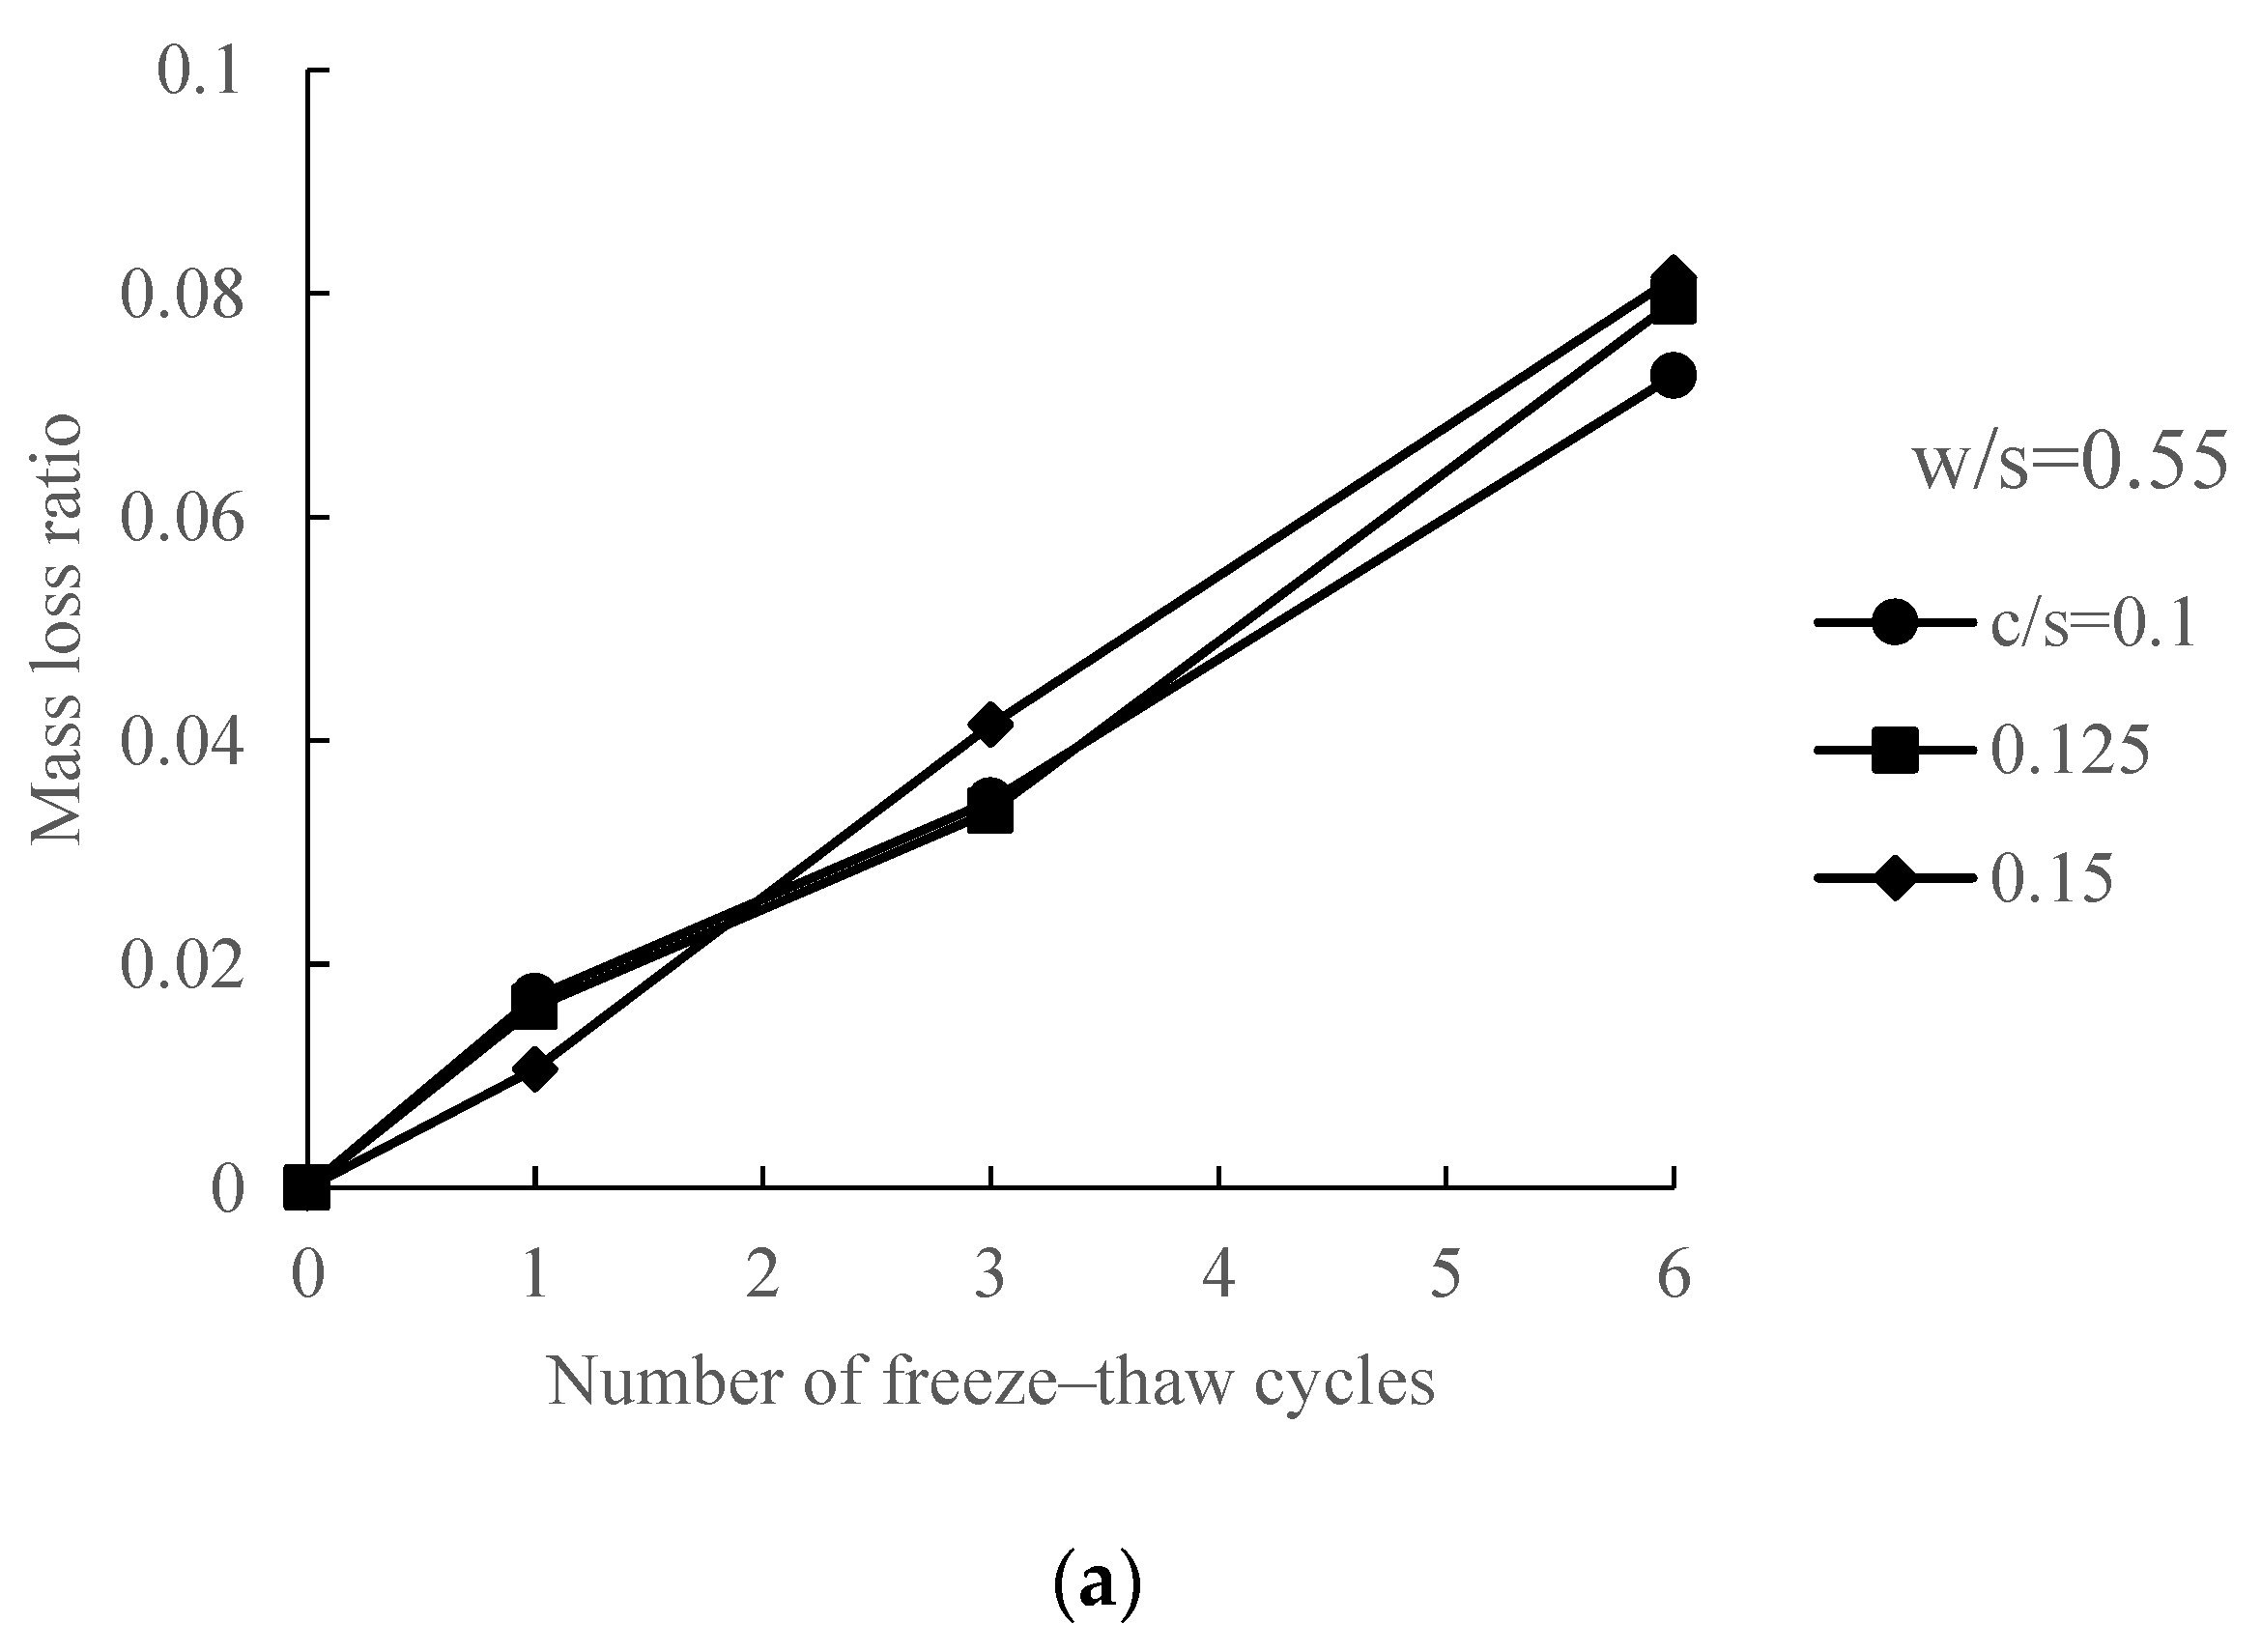
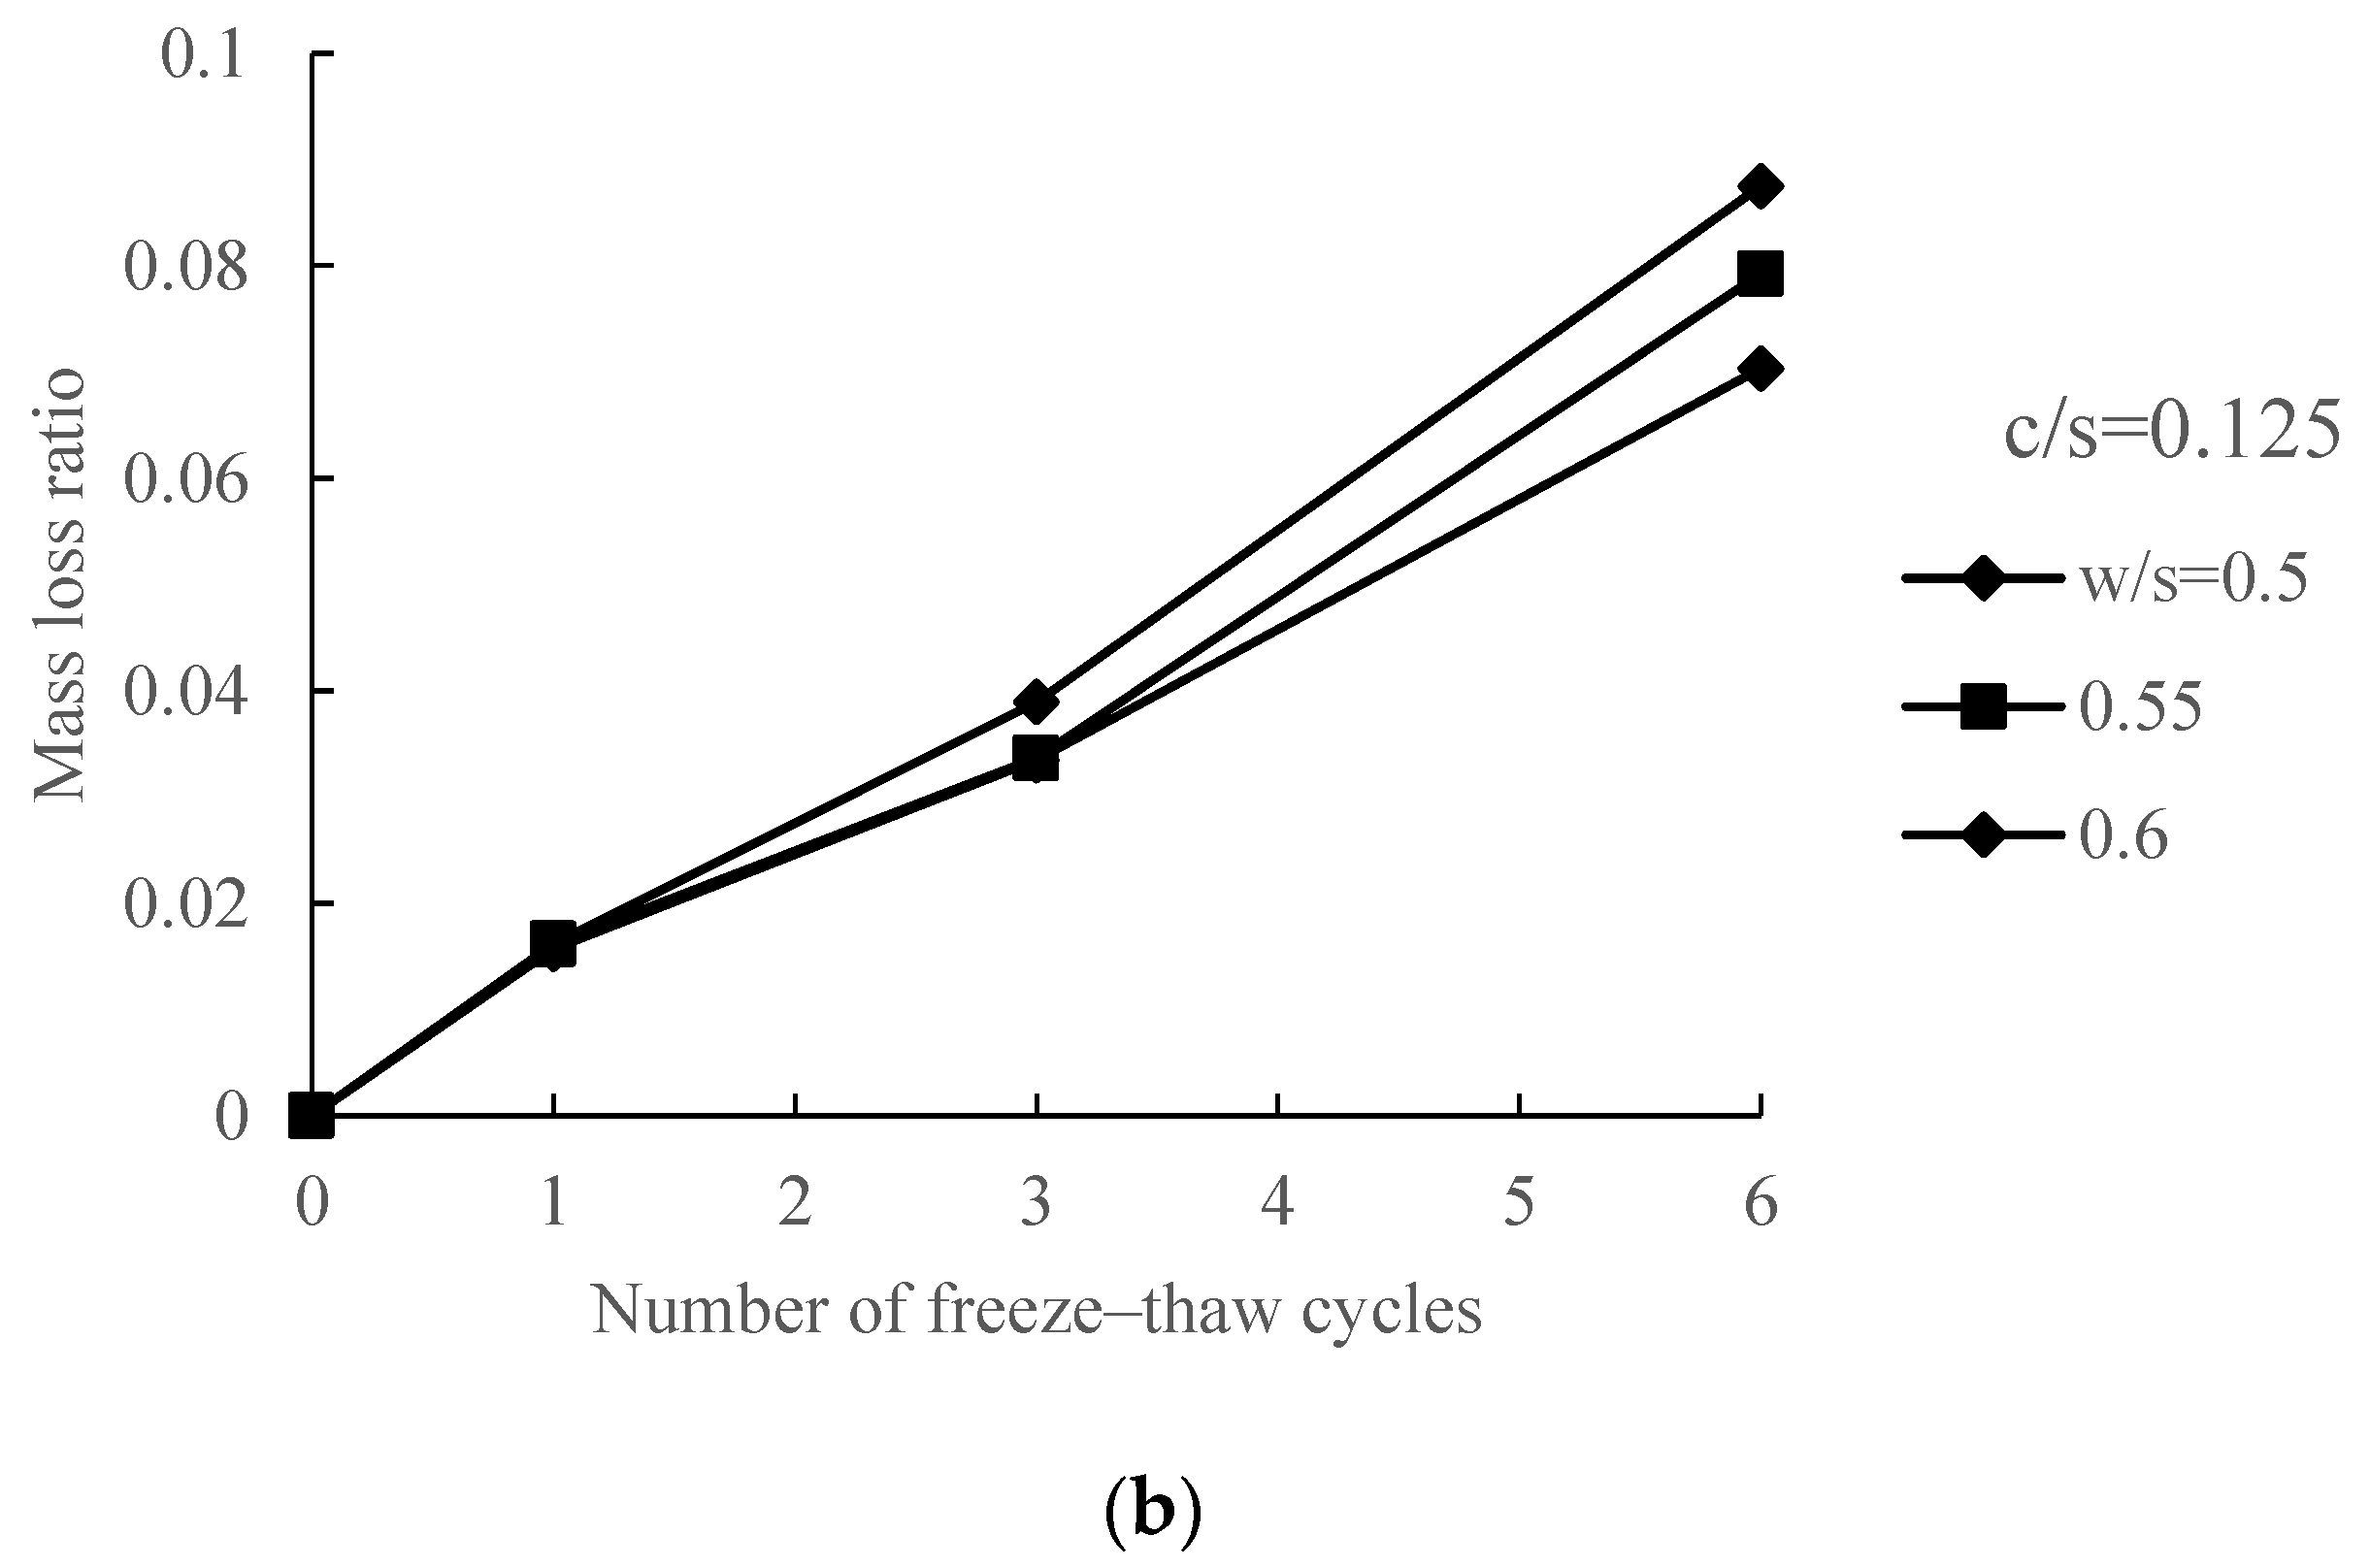
The mass loss is shown in Figure 10. All the test groups showed linear increase in mass loss with more freeze–thaw cycles, regardless of the amounts of water or Portland cement. The SEM images also showed an increase in the pore spaces and changes in pore structures (Figure 6).

4. Discussion

4.1. Mechanisms of Drying–Wetting and Freeze–Thaw Actions

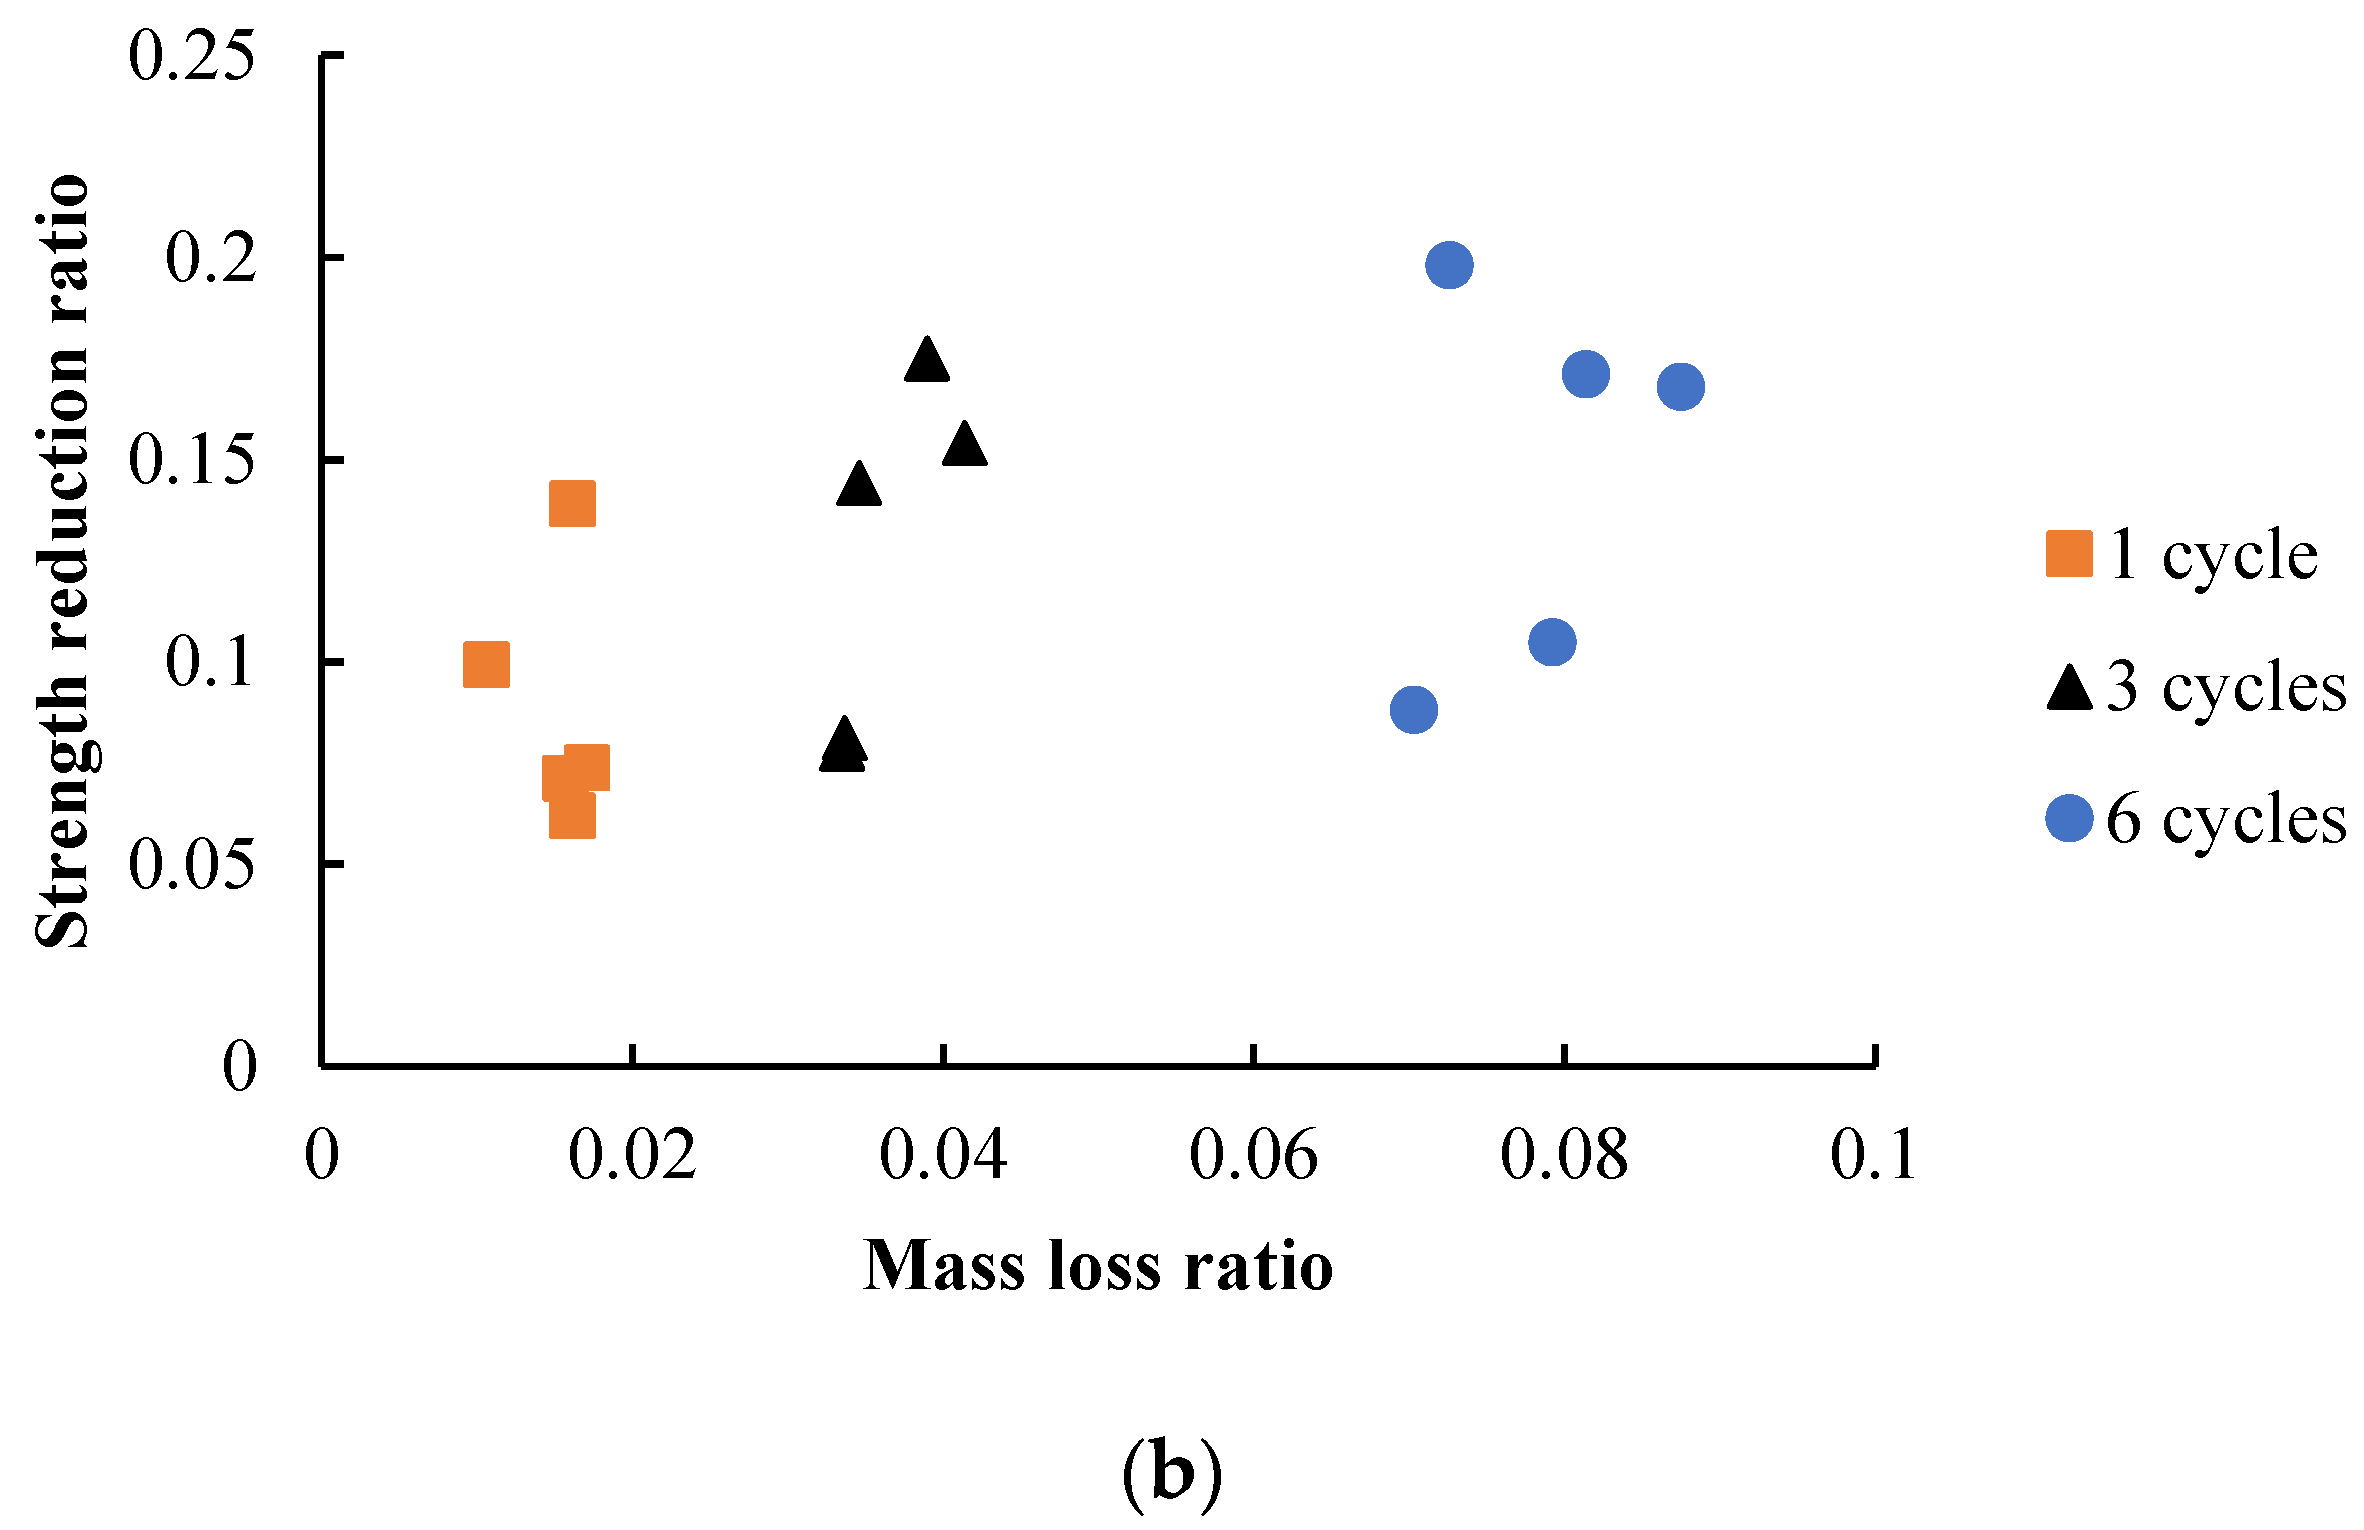
It has been reported that the degradation of cemented soils due to drying–wetting or freeze–thaw actions could be a result of the loss of solid materials, changes in the micro-structure, or the development of cracks [30,34,37,44]. It was also evidenced in this study that the reduction in strength due to drying–wetting or freeze–thaw actions accompanied the mass loss and the changes in the pore structure. It can be seen in Figure 11 that the strength reduction generally positively correlated to the mass loss in both drying–wetting and freeze–thaw conditions. Compared to other types of cemented soils, flowable fills have especially high water content due to the requirement of flowability. The high water content may lead to a more serious degradation in adverse environments. It is shown in Figure 5b that the strength reduced more greatly with a higher water–soil ratio. Some of the specimens lost more than half of their initial strength after six cycles of drying–wetting actions. Therefore, the effects of drying–wetting and freeze–thaw actions on the degradation of flowable fills cannot be neglected, especially in the drying–wetting conditions.

4.2. Prediction of Strength Reduction and Degradation

It can be seen in Figure 8 that, during freeze–thaw actions, most of the strength reduction takes place during the first three cycles for most of the specimens. However, as for the specimens under the drying–wetting actions, the strength reduction seemed to still be ongoing after six cycles (Figure 3). The long-term performance of the material could be problematic. Therefore, an empirical model is proposed here to predict the long-term strength of flowable fills under drying–wetting cycles. It can be seen in Figure 4 that the strength reduction in all groups of tests follows similar trends, but with different levels of variation. Thus, it may be possible to use the strength reduction in the first cycle to predict those after several drying–wetting cycles. The strength reduction ratio, R1, in the first cycle of drying–wetting is:
R 1 = 1 q u 1 q u 0
in which, qu0 and qu1 are the unconfined compressive strength with no drying–wetting and with one cycle of drying–wetting, respectively. Using this parameter, the strength reduction ratio after N drying–wetting cycles can be predicted using
R N = R 1 N 0.3
Thus, the strength after N drying–wetting cycles is
q u N = ( 1 R N ) q u 0
or
q u N = ( 1 R 1 N 0.3 ) q u 0
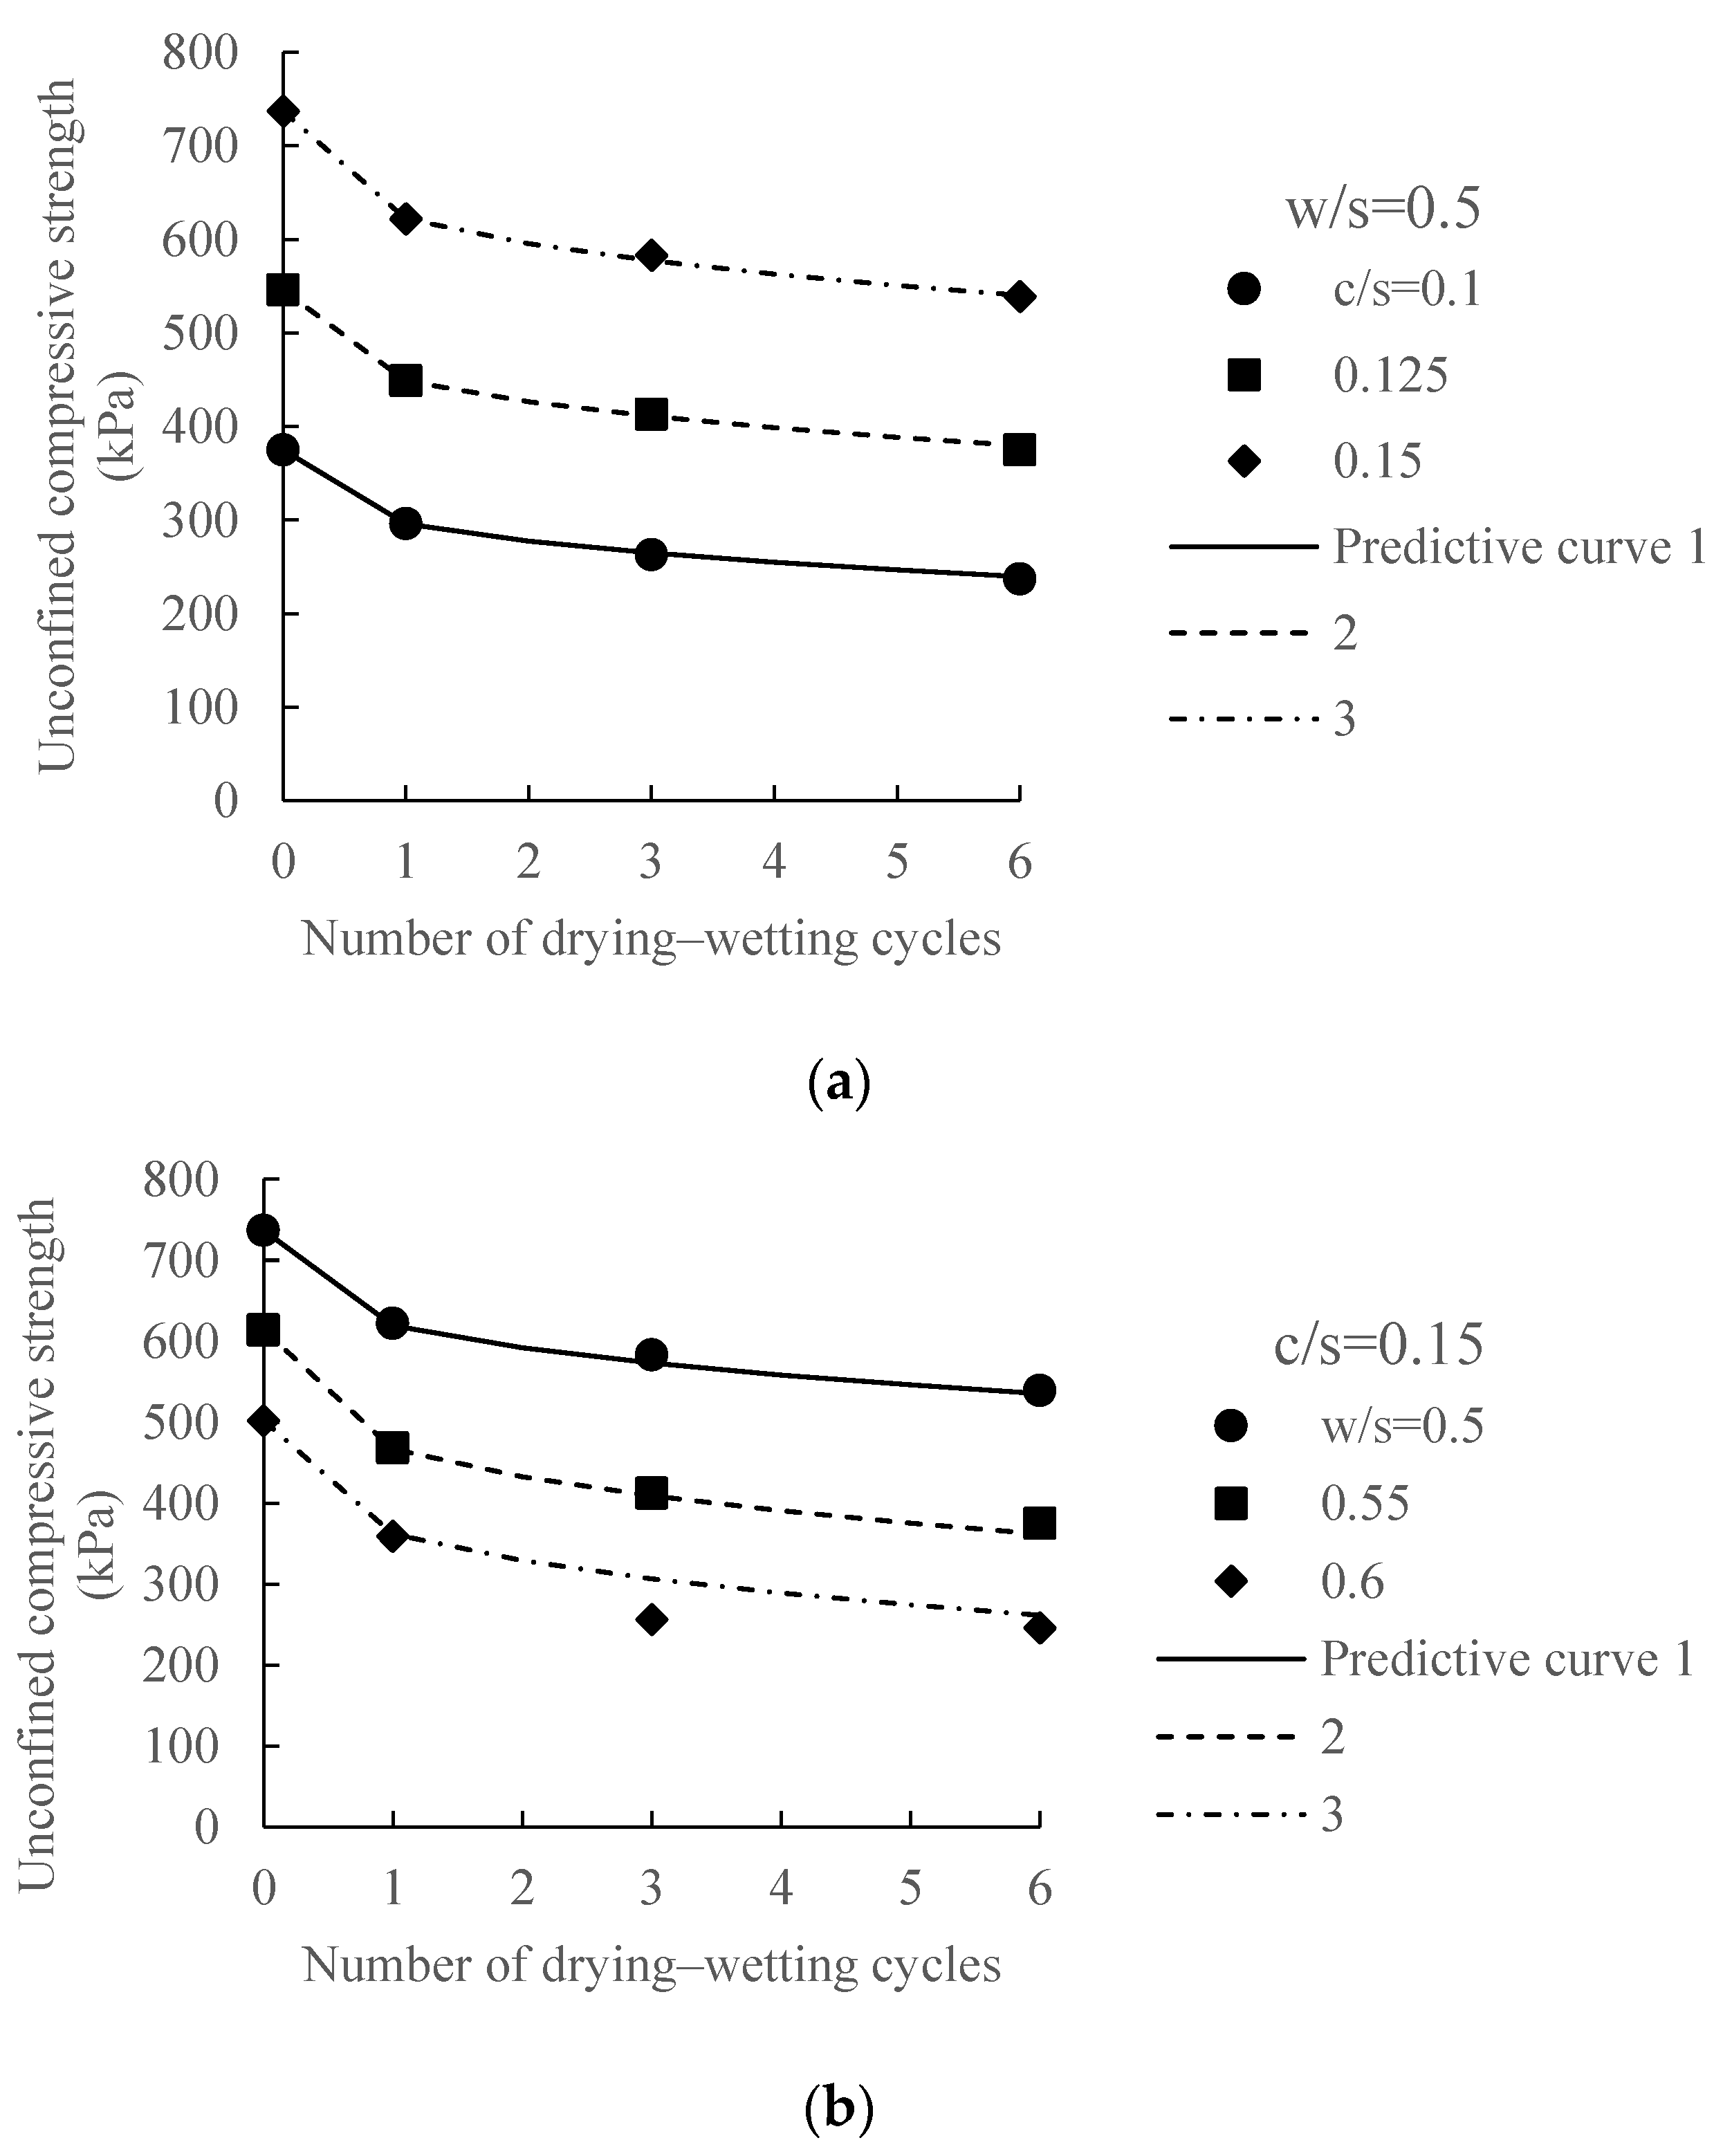
The test data on strength and the predictive results are comparatively presented in Figure 12. The prediction curves are in agreement with the test results at most of the data points. The square deviation, R2, is 97.3%. Therefore, the above empirical model can be used to predict the strength variation during drying–wetting cycles for flowable fills with initial unconfined compressive strength of 375–737 kPa.
As compared to the performances with the drying–wetting cycles, the flowable fill with the freeze–thaw cycles showed different behavior. First, the level of strength reduction reached as high as 20%, which was far lower than that with the drying–wetting cycles. Second, the strength reduction trends seemed not to be closely related to w/s and c/s ratios (Figure 9). On the other hand, the mass loss showed a loosely linear trend according to the number of cycles (Figure 10). The mass loss was around 8% after six freeze–thaw cycles. Therefore, instead of using strength reduction data, we can use the relationship between mass loss and the number of cycles to predict the degradation and long-term performance during freeze–thaw cycles.

4.3. Practical Implications

Flowable fills can be used for versatile construction applications, including highway embankment fills, retaining wall backfills, foundation pit backfills, etc. The use of flowable fills can bring about not only technological advantages, but also merits in terms of environmental friendliness. The environmental and ecological advantages of using flowable fills are briefly summarized here.
  • Flowable fills can utilize waste soils generated from the same construction site or from nearby projects. This greatly reduces the cost of both waste soil disposal and conventional earth or rockfill transportation. The related gasoline consumption can be avoided. The land spaces and potential contaminants related to disposal of waste soils can also be saved.
  • The strength of flowable fills can be adjusted for various applications. For highway embankments, the flowable fills with relatively high strength can improve the stability of embankment slopes. Therefore, the embankment slopes can be designed at a higher angle to save land spaces. This feature is especially important for highway widening projects and construction in urban areas with limited land resources.
  • Conventional earth or rockfills for constructions are not environmentally friendly. The exploitation of earth or rock resources is harmful to natural environments. Earth or rockfills need mechanical compactions to meet quality requirements, which is also time-consuming and requires high energy consumption. The use of flowable fills in lieu of these conventional fill materials can mitigate these problems.
  • The use of Portland cement in flowable fills leads to extra costs, and there are carbon emissions related to the production of Portland cement. However, some industrial wastes with large outputs can be used to replace Portland cement in flowable fills. The waste materials with cementing effects involve fly ash, bottom ash, cement kiln dust, etc. [13,14,15,16]. Flowable fills are an alternative solution to the reuse of these industrial wastes.
However, as demonstrated in this study, flowable fills may degrade in some adverse environments, especially under drying–wetting actions. This implies that special measures should be taken if flowable fills are used in these environments. Our concerns related to the use of flowable fills are listed here.
  • Radical drying–wetting cycles in flowable fills should be prevented. Measures that can be adopted involve using water-resistant front plates, water resistance sheets, or drainage systems. The addition of low-permeable ingredients in the flowable fill, such as bentonite and diatomaceous, may also reduce the effects of drying–wetting on the flowable fills [6].
  • In cold regions with seasonally frozen grounds, strength reduction due to the freeze–thaw cycles may be considered, especially for heavy load-bearing structures such as highway embankments.
  • Experimental results presented in this study may be used as references if the degradation of flowable fills in drying–wetting or freeze–thaw actions need to be considered. The empirical model for strength reduction given above can also be utilized for long-term strength prediction under the drying–wetting cycles.
A field trial was carried out by the authors’ team using the same type of flowable fill in 2020. It was a backfill project on top of an open-cut tunnel. There was a concrete layer covering the flowable fill. In general, the technical performance of the flowable fill met the construction requirements during its two years of service. However, the time duration from the start of the field trial until now was too short to assess long-term durability. Further results will be reported in subsequent studies.

5. Conclusions

In this study, a waste soil-based flowable fill was investigated under drying–wetting and freeze–thaw actions. The following conclusions can be drawn.
  • Under six drying–wetting cycles, flowable fill specimens underwent continuous reductions in strength, accompanying the mass losses and the changes in micro-structures. The level of strength reduction decreased with increased addition of Portland cement and decreased addition of water. After six drying–wetting cycles, the specimens showed a 27–51% strength reduction as compared to their counterparts with no drying–wetting actions.
  • Under freeze–thaw cycles, the specimens showed noticeable but insignificant degradation. After six freeze–thaw cycles, the level of strength reduction ranged from 9 -20%. For most the test groups, the strength reduction completed or almost completed within the first three cycles, and showed minimal changes in strength afterwards.
  • The flowable fill specimens under continuous drying–wetting cycles showed gradual and more gentle changes in the strength reduction with further cycles. Based on this variation pattern, an empirical model was proposed to predict the strength reduction under drying–wetting cycles. The prediction results are in agreement with the test data for most of the test groups.
  • The use of flowable fills can bring about not only technological advantages, but also environmental benefits. However, precautions should be taken during radical drying–wetting cycle conditions in order to prevent the degradation of the material.

Author Contributions

Conceptualization, Z.H. and T.T.; methodology, Z.H. and T.T.; writing—review and editing, Z.H., T.T., H.L., and W.Q.; project administration and funding acquisition, Z.H. All authors have read and agreed to the published version of the manuscript.

Funding

This research was funded by Research on the Application of Cemented Soil Fill in the Construction of Power Transmission and Transformation Projects of State Grid Jiangsu Electric Power Co., Ltd., Economics and Technology Research Institute, grant number SGJSJY00SJJS2100054.

Institutional Review Board Statement

Not applicable.

Informed Consent Statement

Not applicable.

Data Availability Statement

Data are available in a publicly accessible repository. The data presented in this study are openly available.

Conflicts of Interest

The authors declare no conflict of interest. The funders had no role in the design of the study.

References

  1. Ling, T.-C.; Kaliyavaradhan, S.K.; Poon, C.S. Global perspective on application of controlled low-strength material (CLSM) for trench backfilling–An overview. Constr. Build. Mater. 2018, 15, 535–548. [Google Scholar] [CrossRef]
  2. Sargand, S. The Design and Construction of culverts using Controlled Low Strength Material–Controlled Density Fill (CLSM–CDF) Backfill. In Structural Performance of Flexible Pipes, Proceedings of the First National Conference on Flexible Pipes, Columbus, OH, USA, 21–23 October 1990; Brewer, W., Ed.; CRC Press: Boca Raton, FL, USA, 1990. [Google Scholar]
  3. Riviera, P.P.; Bertagnoli, G.; Choorackal, E.; Santagata, E. Controlled low-strength materials for pavement foundations in highway tunnels: Feasibility study and recommendations. Mater. Struct. 2019, 52, 1–16. [Google Scholar] [CrossRef]
  4. Qian, J.; Hu, Y.; Zhang, J.; Xiao, W.; Ling, J. Evaluation the performance of controlled low strength material made of excess excavated soil. J. Clean. Prod. 2019, 214, 79–88. [Google Scholar] [CrossRef]
  5. Okuyucu, O.; Jayawickrama, P.; Senadheera, S. Mechanical properties of steel fiber–reinforced self-consolidating controlled low-strength material for pavement base layers. J. Mater. Civ. Eng. 2019, 31, 04019177. [Google Scholar] [CrossRef]
  6. ACI Committee 229. ACI 229R-13. Report on Controlled Low-Strength Materials; American Concrete Institute: Farmington Hills, MI, USA, 2013. [Google Scholar]
  7. Kim, Y.-S.; Do, T.M.; Kim, H.-K.; Kang, G. Utilization of excavated soil in coal ash-based controlled low strength material (CLSM). Constr. Build. Mater. 2016, 124, 598–605. [Google Scholar] [CrossRef]
  8. Finney, A.J.; Shorey, E.F.; Anderson, J. Use of native soil in place of aggregate in controlled low strength material (CLSM). In Pipelines 2008—Pipeline Asset Management: Maximizing Performance of our Pipeline Infrastructure; American Society of Civil Engineers: Reston, VA, USA, 2008; pp. 1–13. [Google Scholar]
  9. Wu, H.; Yin, J.; Bai, S. Experimental Investigation of Utilizing Industrial Waste and Byproduct Materials in Controlled Low Strength Materials (CLSM). Adv. Mat. Res. 2013, 639–640, 299–303. [Google Scholar] [CrossRef]
  10. Zhang, J.; Wang, J.; Li, X.; Zhou, T.; Guo, Y. Rapid-hardening controlled low strength materials made of recycled fine aggregate from construction and demolition waste. Constr. Build. Mater. 2018, 173, 81–89. [Google Scholar] [CrossRef]
  11. Zhang, X.; Yu, R.; Chen, J. Preparation and properties of controlled compacting filling material based on admixture technique. Emerg. Mater. Res. 2018, 7, 47–51. [Google Scholar] [CrossRef]
  12. Guangyin, Z.; Haiyan, Z.; Tiantao, Z.; Youcai, Z. Performance appraisal of controlled low-strength material using sewage sludge and refuse incineration bottom ash. Chin. J. Chem. Eng. 2012, 20, 80–88. [Google Scholar]
  13. Naganathan, S.; Razak, H.A.; Hamid, S.N.A. Properties of controlled low-strength material made using industrial waste incineration bottom ash and quarry dust. Mater. Des. 2012, 33, 56–63. [Google Scholar] [CrossRef] [Green Version]
  14. Le, D.-H.; Nguyen, K.-H. An assessment of eco-friendly controlled low-strength material. Procedia Eng. 2016, 142, 260–267. [Google Scholar] [CrossRef]
  15. Lachemi, M.; Hossain, K.; Shehata, M.; Thaha, W. Controlled low strength materials incorporating cement kiln dust from various sources. Cem. Concr. Compos. 2008, 30, 381–392. [Google Scholar] [CrossRef]
  16. Siddique, R. Utilization of waste materials and by-products in producing controlled low-strength materials. Resour. Conserv. Recycl. 2010, 54, 1–8. [Google Scholar] [CrossRef]
  17. Wu, H.; Huang, B.; Shu, X.; Yin, J. Utilization of solid wastes/byproducts from paper mills in Controlled Low Strength Material (CLSM). Constr. Build. Mater. 2016, 118, 155–163. [Google Scholar] [CrossRef]
  18. Bassani, M.; Bertola, M.; Bianchi, M.; Canonico, F.; Marian, M. Environmental assessment and geomechanical properties of controlled low-strength materials with recycled and alternative components for cements and aggregates. Cem. Concr. Compos. 2017, 80, 143–156. [Google Scholar] [CrossRef]
  19. Yan, D.Y.S.; Tang, I.Y.; Lo, I.M.C. Development of controlled low-strength material derived from beneficial reuse of bottom ash and sediment for green construction. Constr. Build. Mater. 2014, 64, 201–207. [Google Scholar] [CrossRef]
  20. Kuo, W.T.; Wang, H.Y.; Shu, C.Y.; Su, D.S. Engineering properties of controlled low-strength materials containing waste oyster shells. Constr. Build. Mater. 2013, 46, 128–133. [Google Scholar] [CrossRef] [Green Version]
  21. Bouzalakos, S.; Dudeney, A.W.L.; Cheeseman, C.R. Controlled low-strength materials containing waste precipitates from mineral processing. Miner. Eng. 2008, 21, 252–263. [Google Scholar] [CrossRef]
  22. Mneina, A.; Soliman, A.M.; Ahmed, A.; El Naggar, M.H. Engineering properties of Controlled Low-Strength Materials containing Treated Oil Sand Waste. Constr. Build. Mater. 2018, 159, 277–285. [Google Scholar] [CrossRef]
  23. Etxeberria, M.; Ainchil, J.; Pérez, M.E.; González, A. Use of recycled fine aggregates for Control Low Strength Materials (CLSMs) production. Constr. Build. Mater. 2013, 44, 142–148. [Google Scholar] [CrossRef]
  24. Angulo, S.C.; Ulsen, C.; John, V.M.; Kahn, H.; Cincotto, M.A. Chemical–mineralogical characterization of C&D waste recycled aggregates from São Paulo, Brazil. Waste Manag. 2009, 29, 721–730. [Google Scholar] [PubMed]
  25. Türkel, S. Strength properties of fly ash based controlled low strength materials. J. Hazard. Mater. 2007, 147, 1015–1019. [Google Scholar] [CrossRef] [PubMed]
  26. Nataraja, M.; Nalanda, Y. Performance of industrial by-products in controlled low-strength materials (CLSM). Waste Manag. 2008, 28, 1168–1181. [Google Scholar] [CrossRef] [PubMed]
  27. Alizadeh, V. Influence of cementing paste volume on properties of controlled low strength materials. J. Mater. Civ. Eng. 2018, 30, 04017305. [Google Scholar] [CrossRef]
  28. Neramitkornburi, A.; Horpibulsuk, S.; Shen, S.L.; Chinkulkijniwat, A.; Arulrajah, A.; Disfani, M.M. Durability against wetting–drying cycles of sustainable Lightweight Cellular Cemented construction material comprising clay and fly ash wastes. Constr. Build. Mater. 2015, 77, 41–49. [Google Scholar] [CrossRef]
  29. Ye, H.; Chu, C.; Xu, L.; Guo, K.; Li, D. Experimental studies on drying-wetting cycle characteristics of expansive soils improved by industrial wastes. Adv. Civ. Eng. 2018, 2018, 2321361. [Google Scholar] [CrossRef] [Green Version]
  30. Stoltz, G.; Cuisinier, O.; Masrouri, F. Weathering of a lime-treated clayey soil by drying and wetting cycles. Eng. Geol. 2014, 181, 281–289. [Google Scholar] [CrossRef]
  31. Jian-Hua, W.; Yu-Qin, G. Study on the Strength Degradation Mechanism of Cement-Soils Resulting from Dry-Wet Cycles. Chi. Railw. Sci. 2006, 27, 23–27. [Google Scholar]
  32. Lachemi, M.; Hossain, K.M.; Shehata, M.; Thaha, W. Characteristics of controlled low-strength materials incorporating cement kiln dust. Can. J. Civil Eng. 2007, 34, 485–495. [Google Scholar] [CrossRef]
  33. Achtemichuk, S.; Hubbard, J.; Sluce, R.; Shehata, M.H. The utilization of recycled concrete aggregate to produce controlled low-strength materials without using Portland cement. Cem. Concr. Compos. 2009, 31, 564–569. [Google Scholar] [CrossRef]
  34. Pan, T. Mechanical Properties and Crack Development Characteristics of Cement-Solidified Mud Soil under Dry-Wet-Freeze-Thaw Cycles. J. Chin. Ceram. Soc. 2021, 40, 34–40. [Google Scholar]
  35. Shibi, T.; Kamei, T. Effect of freeze–thaw cycles on the strength and physical properties of cement-stabilised soil containing recycled bassanite and coal ash. Cold Reg. Sci. Technol. 2014, 106, 36–45. [Google Scholar] [CrossRef]
  36. Ding, M.; Zhang, F.; Ling, X.; Lin, B. Effects of freeze-thaw cycles on mechanical properties of polypropylene Fiber and cement stabilized clay. Cold Reg. Sci. Technol. 2018, 154, 155–165. [Google Scholar] [CrossRef]
  37. Tianliang, W.; Jiankum, L.; Liyun, P.; Yahu, T. Research on the Mechanical Properties of the Cement-Modified Soil under the Action of Freezing and Thawing Cycle. Chi. Railw. Sci. 2010, 31, 7–13. [Google Scholar]
  38. Jamshidi, R.J.; Lake, C.B.; Gunning, P.; Hills, C.D. The effect of freeze/thaw cycles on the performance and microstructure of cement-treated soils. J. Mater. Civ. Eng. 2016, 28, 04016162. [Google Scholar] [CrossRef] [Green Version]
  39. Liu, J.; Wang, T.; Tian, Y. Experimental study of the dynamic properties of cement-and lime-modified clay soils subjected to freeze–thaw cycles. Cold Reg. Sci. Technol. 2010, 61, 29–33. [Google Scholar] [CrossRef]
  40. Qian, J.; Shu, X.; Dong, Q.; Ling, J.; Huang, B. Laboratory characterization of controlled low-strength materials. Mater. Des. 2015, 65, 806–813. [Google Scholar] [CrossRef]
  41. Bao-Kuan, N.; Si-Li, C.; Bin, L. Influence of freezing and thawing cycles on mechanical properties of cemented soil. Low Temp. Phys. 2004, 2004, 10–12. [Google Scholar]
  42. Lake, C.B.; Yousif, M.A.-M.; Jamshidi, R.J. Examining freeze/thaw effects on performance and morphology of a lightly cemented soil. Cold Reg. Sci. Technol. 2017, 134, 33–44. [Google Scholar] [CrossRef]
  43. Sili, C.; Jianjun, S.; Tao, Y.; Jie, H. Effect of Freezing-thawing Cycle on the Mechanical Behaviors of Cemented Soil. J. Pet. Sci. Eng. 2014, 22, 343–349. [Google Scholar]
  44. Aldaood, A.; Bouasker, M.; Al-Mukhtar, M. Impact of freeze–thaw cycles on mechanical behaviour of lime stabilized gypseous soils. Cold Reg. Sci. Technol. 2014, 99, 38–45. [Google Scholar] [CrossRef]
  45. Wentai, P.; Xiangdong, S. Effect of freeze-thaw cycles on the mechanical properties of hydromulch. Highway 2012, 9, 20–32. [Google Scholar]
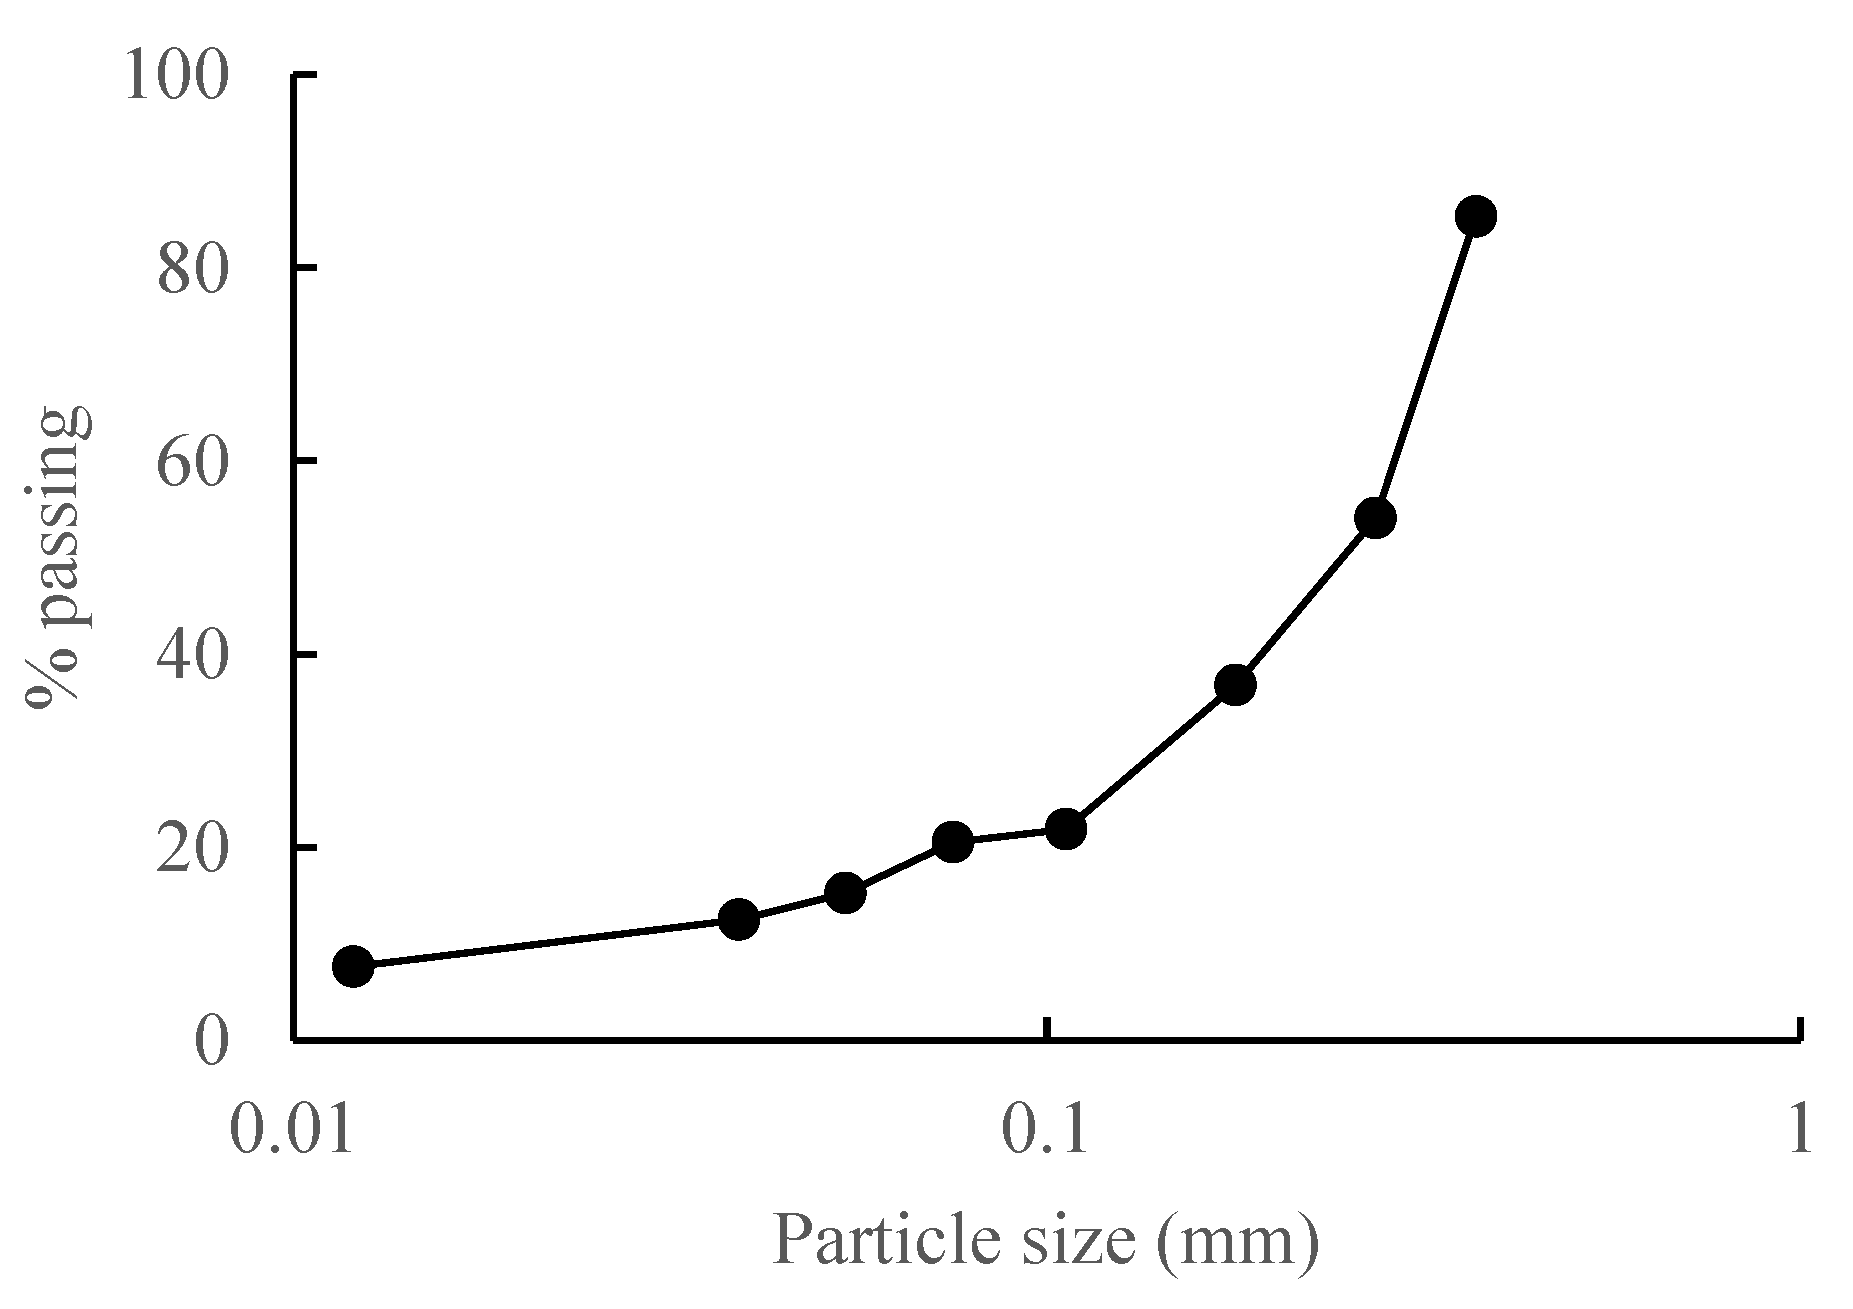
Figure 1. Particle size distribution of the raw soil.
Sustainability 15 02390 g001
Figure 2. Photographs of the specimens (c/s = 0.15, w/s = 0.5) under 0, 1, 3, and 6 drying–wetting cycles (from left to right).
Sustainability 15 02390 g002
Figure 3. Unconfined compressive strengths under different drying–wetting cycles; (a) specimens with various c/s ratios; (b) specimens with various w/s ratios.
Sustainability 15 02390 g003
Figure 4. Strength reduction ratio under different drying–wetting cycles; (a) specimens with various c/s ratios; (b) specimens with various w/s ratios.
Sustainability 15 02390 g004
Figure 5. Mass losses under different drying–wetting cycles; (a) specimens with various c/s ratios; (b) specimens with various w/s ratios.
Sustainability 15 02390 g005aSustainability 15 02390 g005b
Figure 6. SEM images. (a) Specimen without drying–wetting or freeze–thaw cycles; (b) specimen with six drying–wetting cycles; (c) specimen with six freeze–thaw cycles.
Sustainability 15 02390 g006
Figure 7. Photographs of the specimens (c/s = 0.15, w/s = 0.55) under 0 and 6 drying–wetting cycles (from left to right).
Sustainability 15 02390 g007
Figure 8. Unconfined compressive strengths under different freeze–thaw cycles; (a) specimens with various c/s ratios; (b) specimens with various w/s ratios.
Sustainability 15 02390 g008
Figure 9. Strength reduction ratio under different freeze–thaw cycles; (a) specimens with various c/s ratios; (b) specimens with various w/s ratios.
Sustainability 15 02390 g009
Figure 10. Mass losses under different freeze–thaw cycles; (a) specimens with various c/s ratios; (b) specimens with various w/s ratios.
Sustainability 15 02390 g010aSustainability 15 02390 g010b
Figure 11. Strength reduction ratio against mass loss ratio. (a) Drying–wetting tests; (b) freeze–thaw tests.
Sustainability 15 02390 g011aSustainability 15 02390 g011b
Figure 12. Predictive results of strength reduction ratios against test data. (a) Specimens with various c/s ratios; (b) specimens with various w/s ratios.
Sustainability 15 02390 g012
Table 1. Testing program of drying–wetting experiments.
Test No.Water/Soil (w/s) RatioCement/Soil (c/s) RatioNumber of Drying–Wetting Cycles
10.50.10, 1, 3, 6
20.50.1250, 1, 3, 6
30.50.150, 1, 3, 6
40.550.150, 1, 3, 6
50.60.150, 1, 3, 6
Table 2. Testing program of freeze–thaw experiments.
Test No.Water/Soil (w/s) RatioCement/Soil (c/s) RatioNumber of Freeze–Thaw Cycles
60.550.10, 1, 3, 6
70.550.1250, 1, 3, 6
80.550.150, 1, 3, 6
90.50.1250, 1, 3, 6
100.60.1250, 1, 3, 6
Disclaimer/Publisher’s Note: The statements, opinions and data contained in all publications are solely those of the individual author(s) and contributor(s) and not of MDPI and/or the editor(s). MDPI and/or the editor(s) disclaim responsibility for any injury to people or property resulting from any ideas, methods, instructions or products referred to in the content.