Article

When the Trawl Ban Is a Good Option: Opportunities to Restore Fish Biomass and Size Structure in a Mediterranean Fisheries Restricted Area

by
Carlo Pipitone
1,†,
Davide Agnetta
2,3,†,
Arturo Zenone
4,†,
Vincenzo Maximiliano Giacalone
5,*,
Fabio Badalamenti
1,3,
Fabio Fiorentino
4,6,
Paola Rinelli
7,
Mauro Sinopoli
4,
Tomás Vega Fernández
8 and
Giovanni D’Anna
9
1
CNR-IAS, Lungomare Cristoforo Colombo 4521, 90149 Palermo, Italy
2
OGS, Via Beirut 2, 34151 Trieste, Italy
3
NBFC, National Biodiversity Future Center, 90133 Palermo, Italy
4
Stazione Zoologica Anton Dohrn, Lungomare Cristoforo Colombo 4521, 90149 Palermo, Italy
5
CNR-IAS, Via del Mare 3, 91021 Campobello di Mazara, Italy
6
CNR-IRBIM, Via Luigi Vaccara 61, 91026 Mazara del Vallo, Italy
7
CNR-IRBIM, Via San Ranieri 86, 98122 Messina, Italy
8
Stazione Zoologica Anton Dohrn, Villa Comunale, 80121 Napoli, Italy
9
CNR-IAS, Via Giovanni da Verrazzano 17, 91014 Castellammare del Golfo, Italy
*
Author to whom correspondence should be addressed.
These authors contributed equally to this work.
Sustainability 2023, 15(3), 2425; https://doi.org/10.3390/su15032425
Submission received: 25 October 2022 / Revised: 19 January 2023 / Accepted: 26 January 2023 / Published: 29 January 2023

Abstract

:
This paper reports the results of a 15-year trawl ban imposed in 1990 in the Gulf of Castellammare (GCAST: NW Sicily, central Mediterranean Sea) and its effects on the biomass and size structure of demersal finfish and shellfish and on the proportion of different commercial categories of fish. Data were collected by experimental trawl surveys conducted in the GCAST and in two trawled areas before and after 1990. The biomass of the total assemblage and of a number of selected species was significantly higher in the GCAST after the ban. Highly commercial species had the largest increase in the same gulf after the ban, particularly at the depths used by artisanal fishermen. The results from size-based indicators were not as clear-cut as those from biomass though. Although the length frequency distributions obtained in the GCAST were significantly different from the other gulfs, in several cases, the values of the size indicators were higher in the trawled gulfs. Our results suggest that, at the temporal and spatial scale adopted, trawl bans may drive full biomass recovery but only partial size structure recovery of the fish populations subject to trawl exclusion, at least in the Mediterranean. The trawl ban in the Gulf of Castellammare provides an example of an effective ecosystem-based fisheries management tool that offers the potential for fish stock rebuilding and for the economic sustainability of artisanal, small-scale fisheries.

1. Introduction

Fishing activities and, in particular, bottom trawling directly and indirectly affect fish assemblages and cause a number of undesirable consequences on fish populations such as reduced biomass, truncated size structures, and disrupted food webs, with a large part of world stocks falling in the range between fully exploited to depleted [1,2,3,4,5,6]. Fisheries management aiming at sustainable yields through approaches based on catch quota and control of fishing effort have proved generally effective when applied to monospecific fisheries [7,8] and even then, stock collapses have occurred with dramatic consequences [9]. Multispecies fisheries, which dominate in warm-temperate and tropical regions, are more complex to manage due to the high number of species involved, the variety of their ecological and biological traits, and the complex interactions with habitats and environmental parameters. An ecosystem-based approach addressing the fish assemblage as a whole as well as the habitat has been often invoked, especially in areas characterized by conflicting human activities—including but not limited to fishing—that would benefit by a spatial approach [10,11]. Models as well as empirical observation suggest that multispecies fisheries may benefit from partial or total protection in terms of increased biomass [12,13,14,15], better structured size distributions with a higher abundance of larger fish [16] (‘filling-in effect’ in Baskett & Barnett, [17]), increased resilience to overfishing for overexploited low-mobility species and for underexploited highly mobile species [18], increased and less variable catches in surrounding areas [19,20], increased yield reliability under different management scenarios [21], better economic performance of outside fisheries at determinate management conditions [22], and export of adult biomass [13,23,24].
Marine protected areas (MPAs) sensu lato are widespread tools for the conservation and enhancement of living marine resources. Several types of MPAs exist, ranging from no-take reserves to partially protected areas (PPAs) that allow some nondestructive fishing activities [24,25], each of them is widely applied with different levels of success [26]. PPAs and multiple-use MPAs have been advocated as effective large-scope management tools, sometimes even more effective than fully protected MPAs in that they address more widely the different ecosystem services while considering also human activities and sustainable resource use [27]. Sciberras et al. [28] observed that while PPAs (such as no-trawl areas) may produce less strong effects than no-take areas, they still have the advantage of offering an effective management option where the institution of fully protected areas is not socio-economically viable. PPAs based on the ban of towed fishing gears have been created in tropical (southeastern Asia: [29]), warm-temperate (Mediterranean: Pipitone et al. [30]), and temperate (North Sea: Pastoors et al. [31]) areas, where they have generally yielded very encouraging results in terms of fish stock enhancement. Furthermore, coastal small-scale fisheries, which represent a widespread and important socio-economic sector in most temperate and tropical areas and are generally considered a sustainable activity [32], may vastly benefit from their inclusion in MPAs’ and PPAs’ management plans [33,34,35].
PPAs have been realized in the Mediterranean in the form of spatial fishery restrictions of various sizes and with different objectives [30]. The Gulf of Castellammare (NW Sicily) makes up a case study as a no-trawl area where a year-round trawl ban has been in place since 1990 while artisanal and recreational fishing are permitted [36]. The main effects of trawl exclusion on demersal fish and invertebrates in the Gulf after the first few years have been investigated, including those on fish biomass [36] and size spectra [37], the food web [38,39,40,41], fish growth and condition factor [42,43,44], stock dynamics of commercial species [45], and benthic communities [46,47]. However, as regards the effects on fish biomass, published data are spatially and temporally limited, and those on fish size have been scarcely addressed to date.
The general objective of the present study was to evaluate the effects of the trawl ban on the shelf demersal assemblage in the Gulf of Castellammare (GCAST) no-trawl area. To attain this objective, we used fisheries-independent surveys and compared (1) the biomass of the total demersal assemblage and of selected species before and after 1990 (i.e., the starting year of the ban) in the GCAST and in two areas open to trawlers, namely, the Gulfs of Termini Imerese (GTERM) and Sant’Agata (GSANT); (2) the proportion of different commercial categories of fish in GCAST before and after 1990, with the purpose of inferring the potentialities of the artisanal fishery inside the no-trawl area and to inform future management measures; and (3) the size structure of selected species in GCAST and in the two trawled gulfs after 1990.
The following hypotheses based on the effects expected from the trawl ban were tested:
Hypothesis (H1).
The demersal biomass in the GCAST after 1990 is higher than in the GCAST before 1990 and than in the GTERM and the GSANT after 1990, and is similar in the three gulfs before 1990, and in the GTERM and the GSANT before vs. after 1990;
Hypothesis (H2).
The proportion of highly commercial demersal species in the GCAST is higher after 1990;
Hypothesis (H3).
The size structures of demersal species in the GCAST after 1990 are different and with larger median size and an increased proportion of larger individuals than in the GTERM and the GSANT.

2. Materials and Methods

2.1. Study Area

The study area includes the GCAST, where a trawl ban was imposed in 1990, and two areas open to trawling, the GTERM and the GSANT, all located on the coast of northern Sicily (central Mediterranean Sea) (Figure 1). The three gulfs are characterized by a large, gently sloping central soft-bottom portion bordered by rocky promontories on the sides and share similar hydrological and oceanographic conditions [46]. The approximate distances between the centers of the gulfs are 73 km (GCAST to GTERM) and 60 km (GTERM to GSANT) as the crow flies. The trawl ban area in the GCAST extends for 200 km2 from the shoreline to about 500 m depth. Inside this area, artisanal (set and drifting gears) and recreational fishing are permitted. Outside the trawl ban area as well as in the GTERM and the GSANT, trawling is permitted at depths greater than 50 m but prohibited within 1.5 nautical miles from the coast according to the depth, in conformity with EC Regulation 1967/2006 and subsequent amendments.

2.2. Sampling Design and Data Collection

Experimental trawl surveys were carried out in each gulf before (1985–1987, when all gulfs were trawled) and after 1990 (2004–2005, when GCAST was untrawled). A stratified random sampling design was adopted with each gulf divided into three depth strata (A: 10–50 m, B: 51–100 m, C: 101–200 m).
The bottom otter-trawl net used in the surveys had the following main specifications: headline 31.3 m, ground rope 41 m, stretched mesh at the cod end 35 mm. Trawl hauls were conducted at an average speed of 2.7 knots and lasted 60 min in all cases except in the GCAST after 1990, when higher catches were expected and a 30 min tow duration was adopted.
The total catch of each haul was identified at species level. Nineteen species (six cephalopods, one crustacean, and twelve fishes: Table 1) were selected as target species based on their different bio-ecological traits, more specifically: macrohabitat (benthic and benthopelagic species), and life span (short-lived, medium-lived, and long-lived species, considering their average life span as reported by Relini et al. [48] and Maiorano et al. [49]). The decision of analyzing biomass and/or size was based on species’ abundance and frequency of occurrence in the samples across surveys.
Three commercial categories were assigned to all species collected in the GCAST before and after 1990 (n = 210; Supplementary Materials Table S1) based on retail prices in the Gulf of Castellammare coastal towns: highly commercial (HC: ≥ €15/kg, n = 59), moderately commercial (MC: < €15/kg, n = 71) and noncommercial (NC: discarded species, n = 80).

2.2.1. Biomass

Biomass data were collected in the three gulfs before and after 1990. The swept area method [50] was used to estimate an index of biomass at sea (kg/km2). The trawl net wingspread adopted to calculate the swept area was estimated by the following equation:
Ws = −3.2999 + 0.00487 × TrW + 7.4283 × OBoS + 0.0482 × FlV,
where Ws = wing spread (m), TrW = length of trawl warps (m), OBoS = otter boards size (m2), and FlV = floats volume (dm3) [51]. Biomass data (kg/km2) were standardized to 30 min tows and expressed as mean values for the total trawlable assemblage (= total catch), for each of ten target species, and for each commercial category.

2.2.2. Size

Length data were collected in the three gulfs in autumn 2004 and spring 2005. All individuals belonging to fourteen target species (Table 1) were measured at the lowest 0.5 cm (deep-water rose shrimp at the lowest 1 mm) as dorsal mantle length (ML, cephalopods), carapace length from eye socket to dorsal posterior carapace margin (CL, deep-water rose shrimp), and total length (TL, fishes). The size structure of each selected species was described by its length frequency distribution (LFD) and by the following length-based indices [52,53,54]:
  • Lm, median length;
  • L95, the 95% percentile of each LFD;
  • L2/3, the percentage of individuals larger than 2/3 of the maximum length recorded in the samples.
L95 and L2/3 are sensitive to the abundance of large-sized individuals and are considered robust indicators of the effect of fishing on fish populations, more so if used jointly [52,54,55].

2.3. Data Analysis

2.3.1. Biomass

  • Total trawlable assemblage
To test the effect of the trawl ban on the biomass (kg/km2) of the total trawlable assemblage, a BACI (before-after-control-impact) with a multiple controls asymmetrical experimental design [56,57] was adopted with three factors: Time, fixed, with two levels (before-1990 and after-1990); Status, fixed, with two levels (Trawled and Untrawled); and Locality, random and nested within Status, with two levels under the group Trawled (GTERM and GSANT) and one level under the group Untrawled (GCAST). Thirty-two replicates randomly selected from a dataset of about 500 hauls were considered for each combination of Time/Locality (n = 204). A PERMANOVA on square root transformed data was computed through restricted permutations of residuals under a reduced model [58]. Significant terms relevant to the hypothesis were investigated through post hoc pair-wise tests using the PERMANOVA t-test and 9999 permutations.
  • Target species
The same experimental design used for the total assemblage biomass was used for the analysis of biomass data of the ten target species, drawn from the same dataset. In this case the number of replicates depended on the actual occurrence of the species in the depth strata (Table 2). Square root transformed biomass data were analyzed using the Primer and PERMANOVA+ software [59,60]. Significant terms relevant to the hypothesis were investigated through post hoc pair-wise tests using the PERMANOVA t-test and 9999 permutations.
  • Commercial categories
A two-way ANOVA was used to test the effect of the trawl ban on the biomass of the three commercial categories (HC, MC, NC) in GCAST. A symmetrical experimental design was adopted with two factors: Time, fixed, with two levels (before-1990 and after-1990) and Stratum, random, with three levels (A, B, C). The depth strata were tested since the artisanal fisheries are more active in the less deep (i.e., A and B) strata. A Cochran’s C test was used a priori to test the homogeneity of variances while the Student–Newman–Keuls (SNK) test was used to make pair-wise comparisons among sample means. The analyses were completed using the “GAD” package within the R and R-studio open source softwares [61,62,63].
The results of all tests are presented as Supplementary Material (Supplementary Materials Tables S2–S4).

2.3.2. Size

A two-sample Kolmogorov–Smirnov test was applied to each couple of areas (GCAST vs. GTERM, GCAST vs. GSANT, and GTERM vs. GSANT) in order to test the differences between LFD shapes in the three gulfs. The test was run using the "Stats" package within the R and R-studio open source softwares [61,62].

3. Results

3.1. Biomass

  • Total trawlable assemblage
The total after-1990 biomass in the GCAST was always higher (6.2- to 11.6-fold) than in any other location and time (Table 3). As shown in Supplementary Materials Table S2, the total biomass was similar in the three gulfs before 1990 and in the GTERM and the GSANT before vs. after 1990.
  • Target species
The after-1990 GCAST biomass values of seven out of ten target species were higher than in all other Time/Locality combinations (Table 4) even though not always significantly (Supplementary Materials Table S3). The three species with slightly higher biomass in the GTERM or the GSANT before or after 1990 were horned octopus, common octopus, and deep-water rose shrimp. The highest relative increase in the after-1990 GCAST compared to all other localities and periods was observed in annular seabream, hake, red mullet, axillary seabream, and pandora.
  • Commercial categories in GCAST
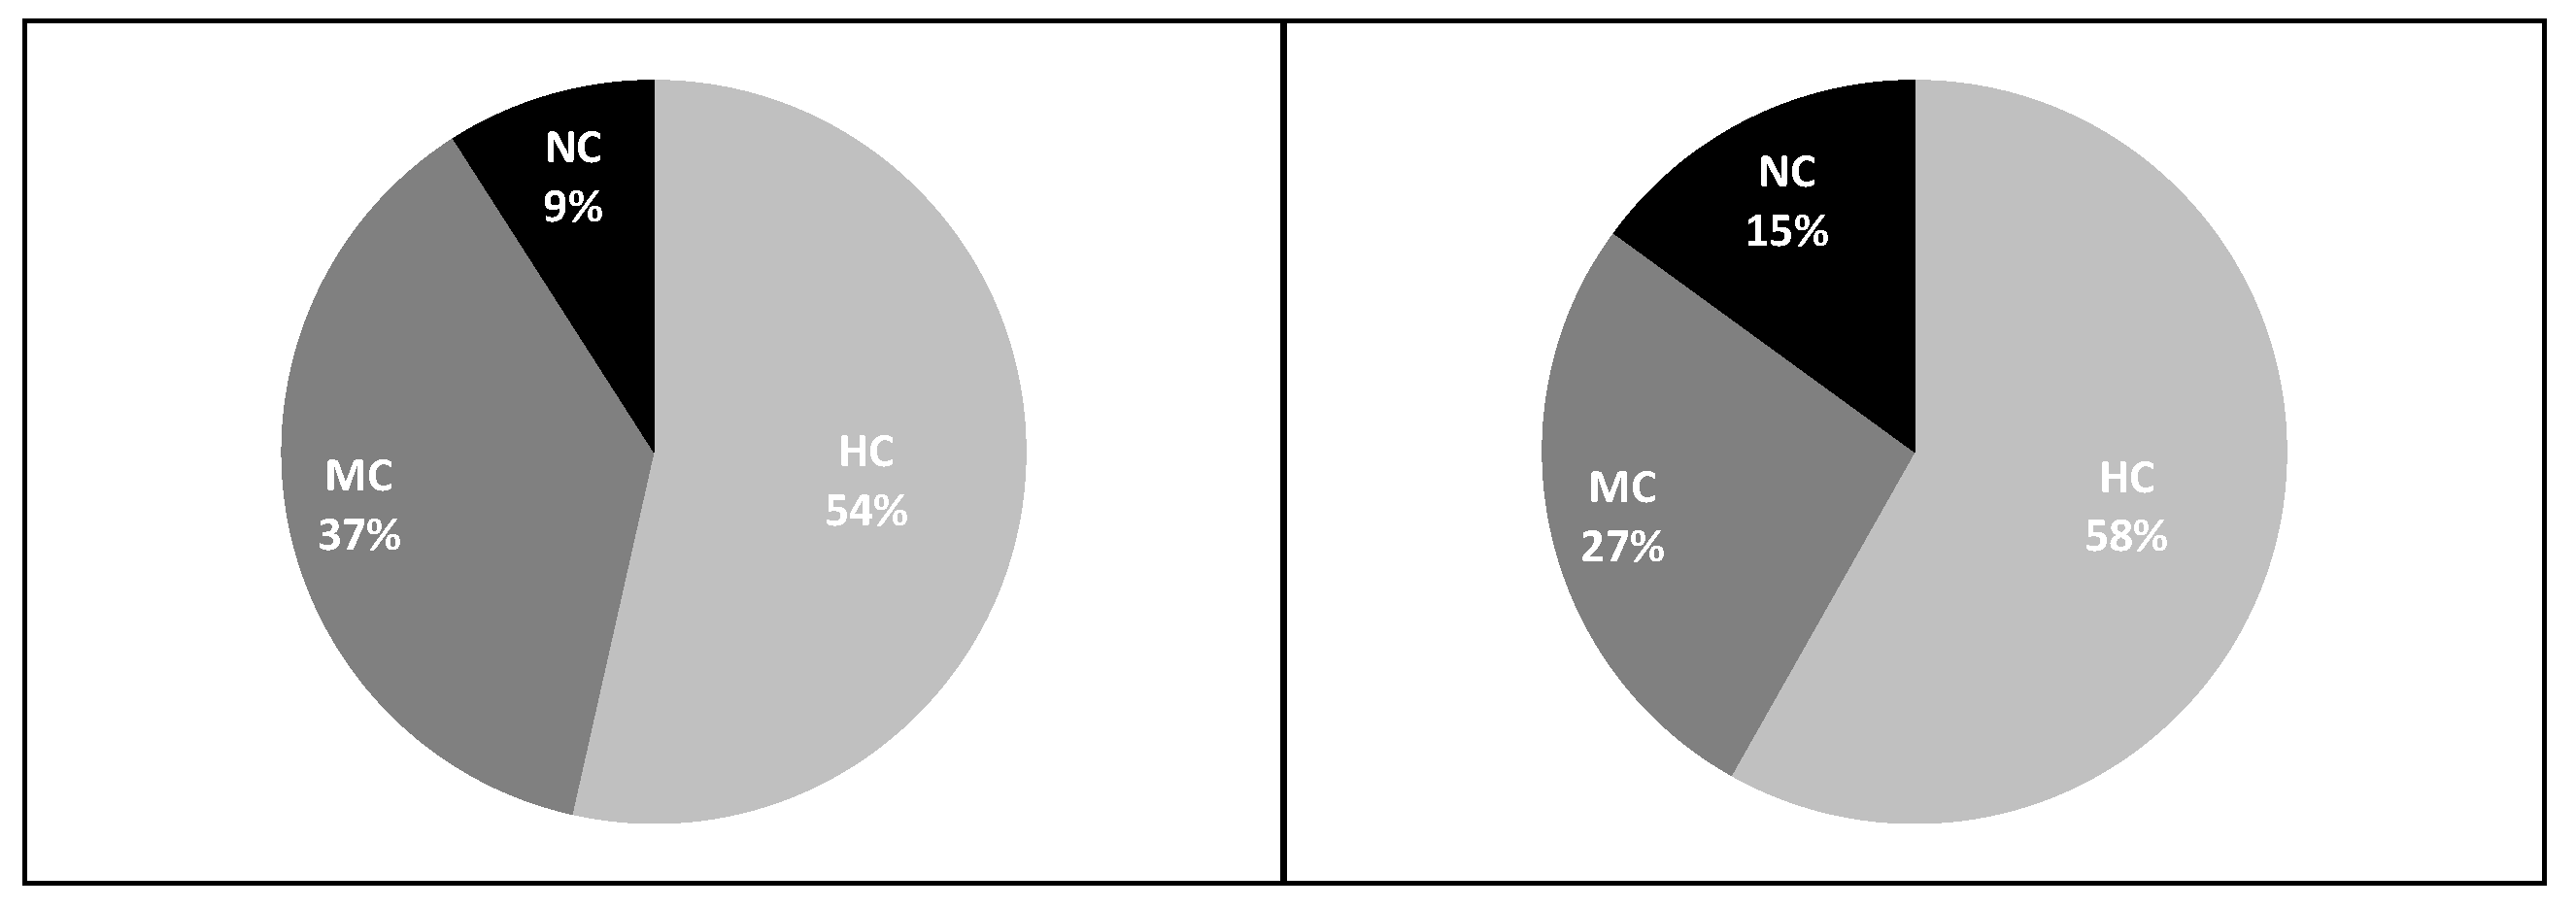
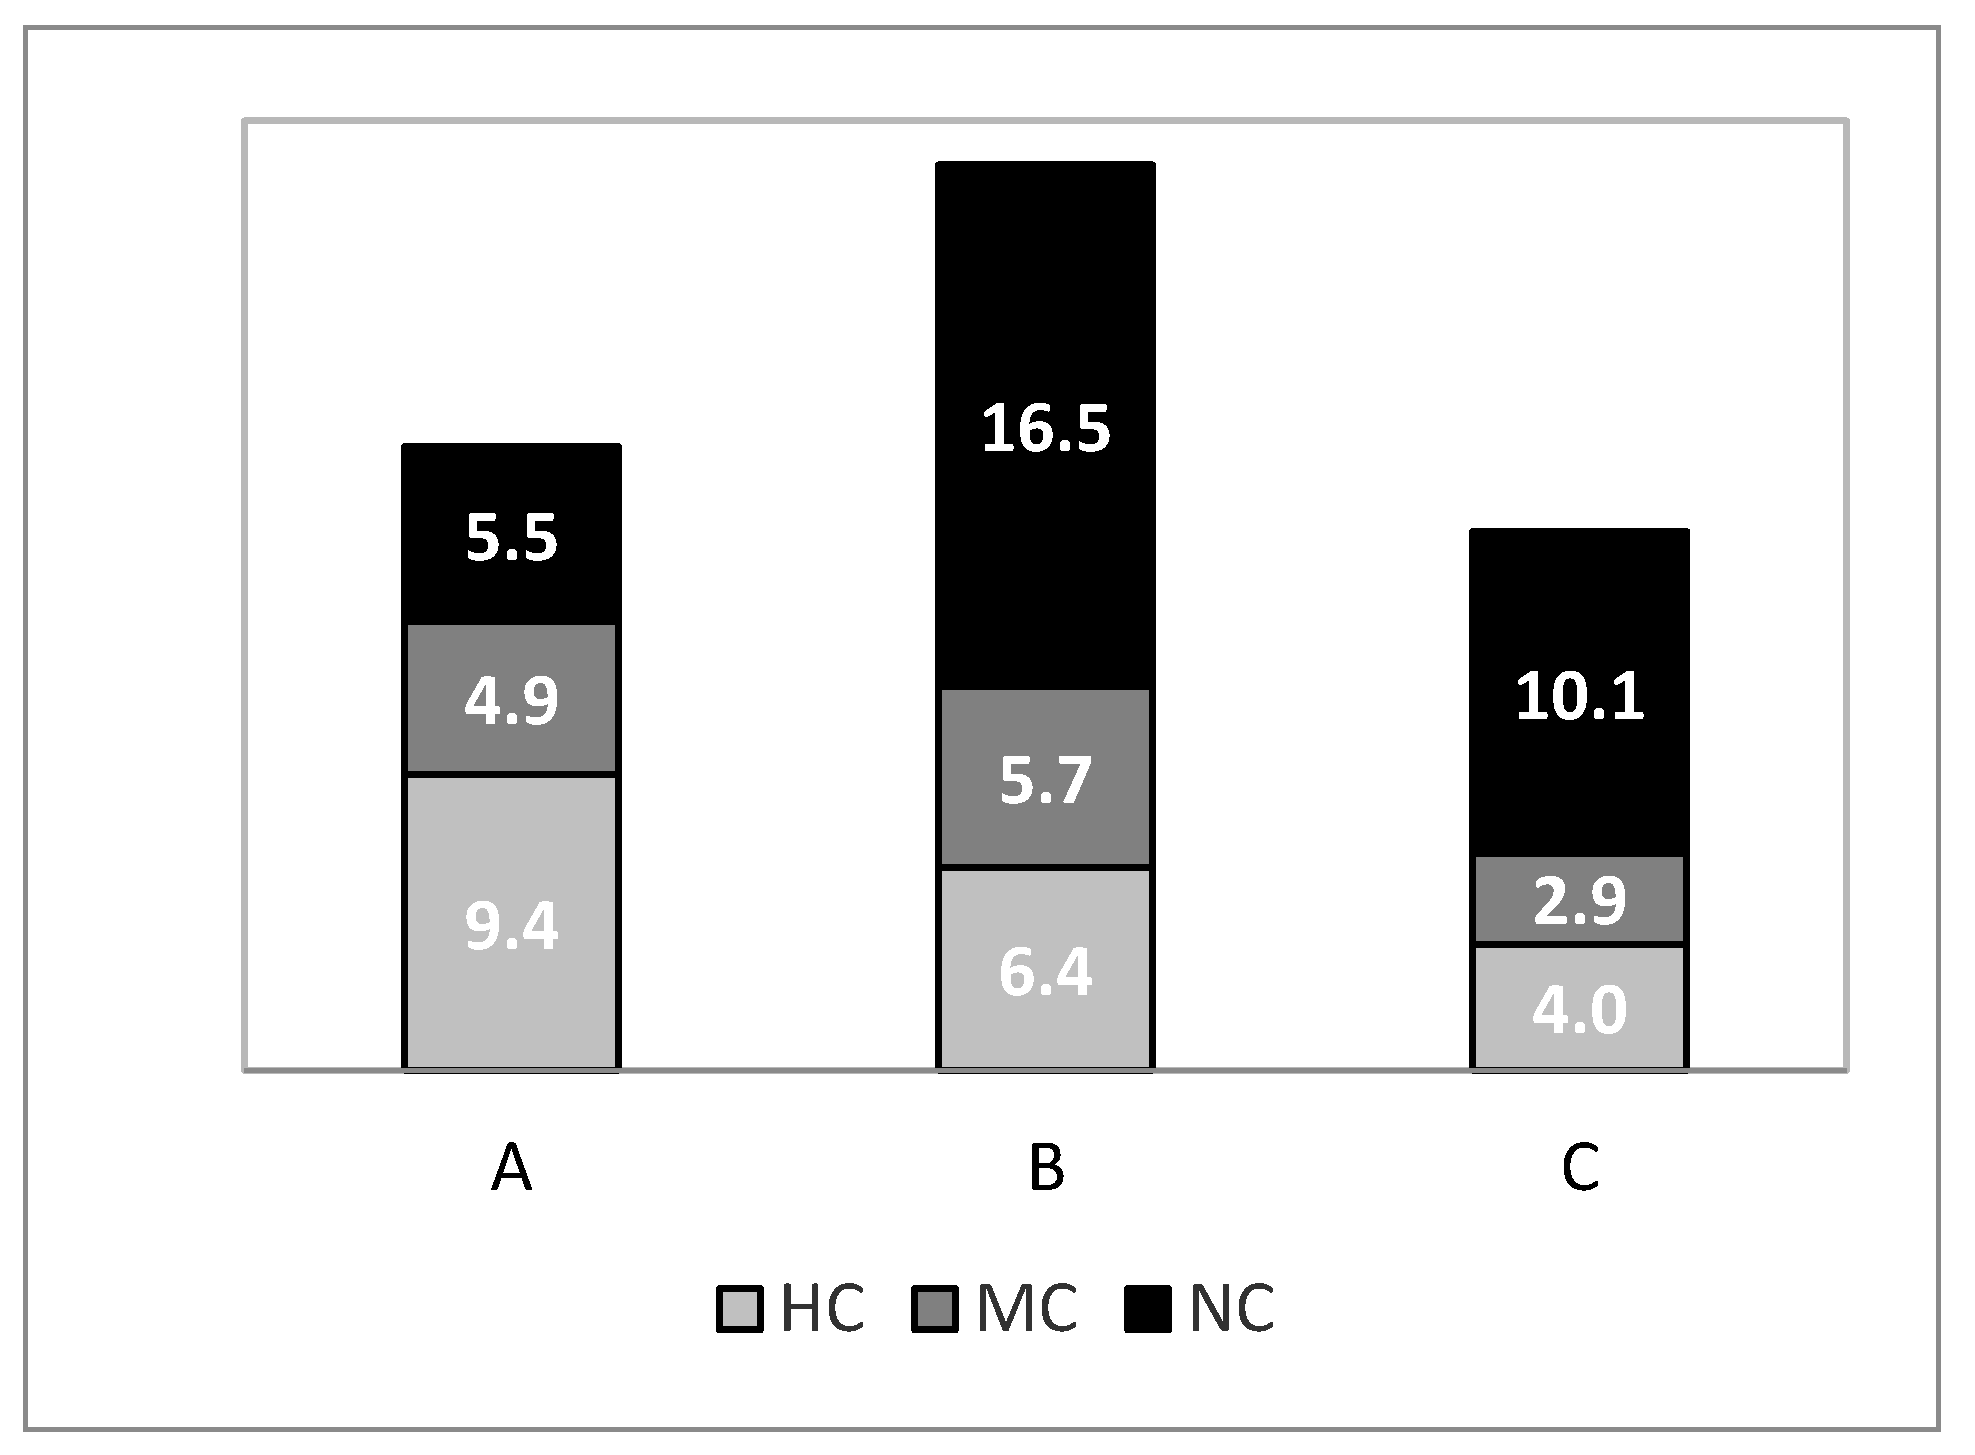
The relative contribution of HC species to the total biomass of the GCAST was higher than that of the MC and NC species in both sampling periods (Figure 2). After 1990, the proportion of MC species decreased while that of the NC and HC species increased (Figure 2). The analysis of the biomass of the three commercial categories in each depth stratum shows that, as a consequence of the overall biomass increase, the biomass of each category also increased significantly after 1990 (Table 5 and Table S4). As regards the increase of each category, while before 1990 they had similar biomass values in the three strata, after 1990, the HC and MC species had significantly higher values in strata A and B than in C, while NC species had the highest biomass in stratum B and the lowest in A, with an intermediate value in C (Table 5 and Table S4). The largest increase for the HC species as described by the after-1990/before-1990 ratio was recorded in stratum A, while the largest increase for the MC and NC species was recorded in stratum B (Figure 3).

3.2. Size

  • Length frequency distributions
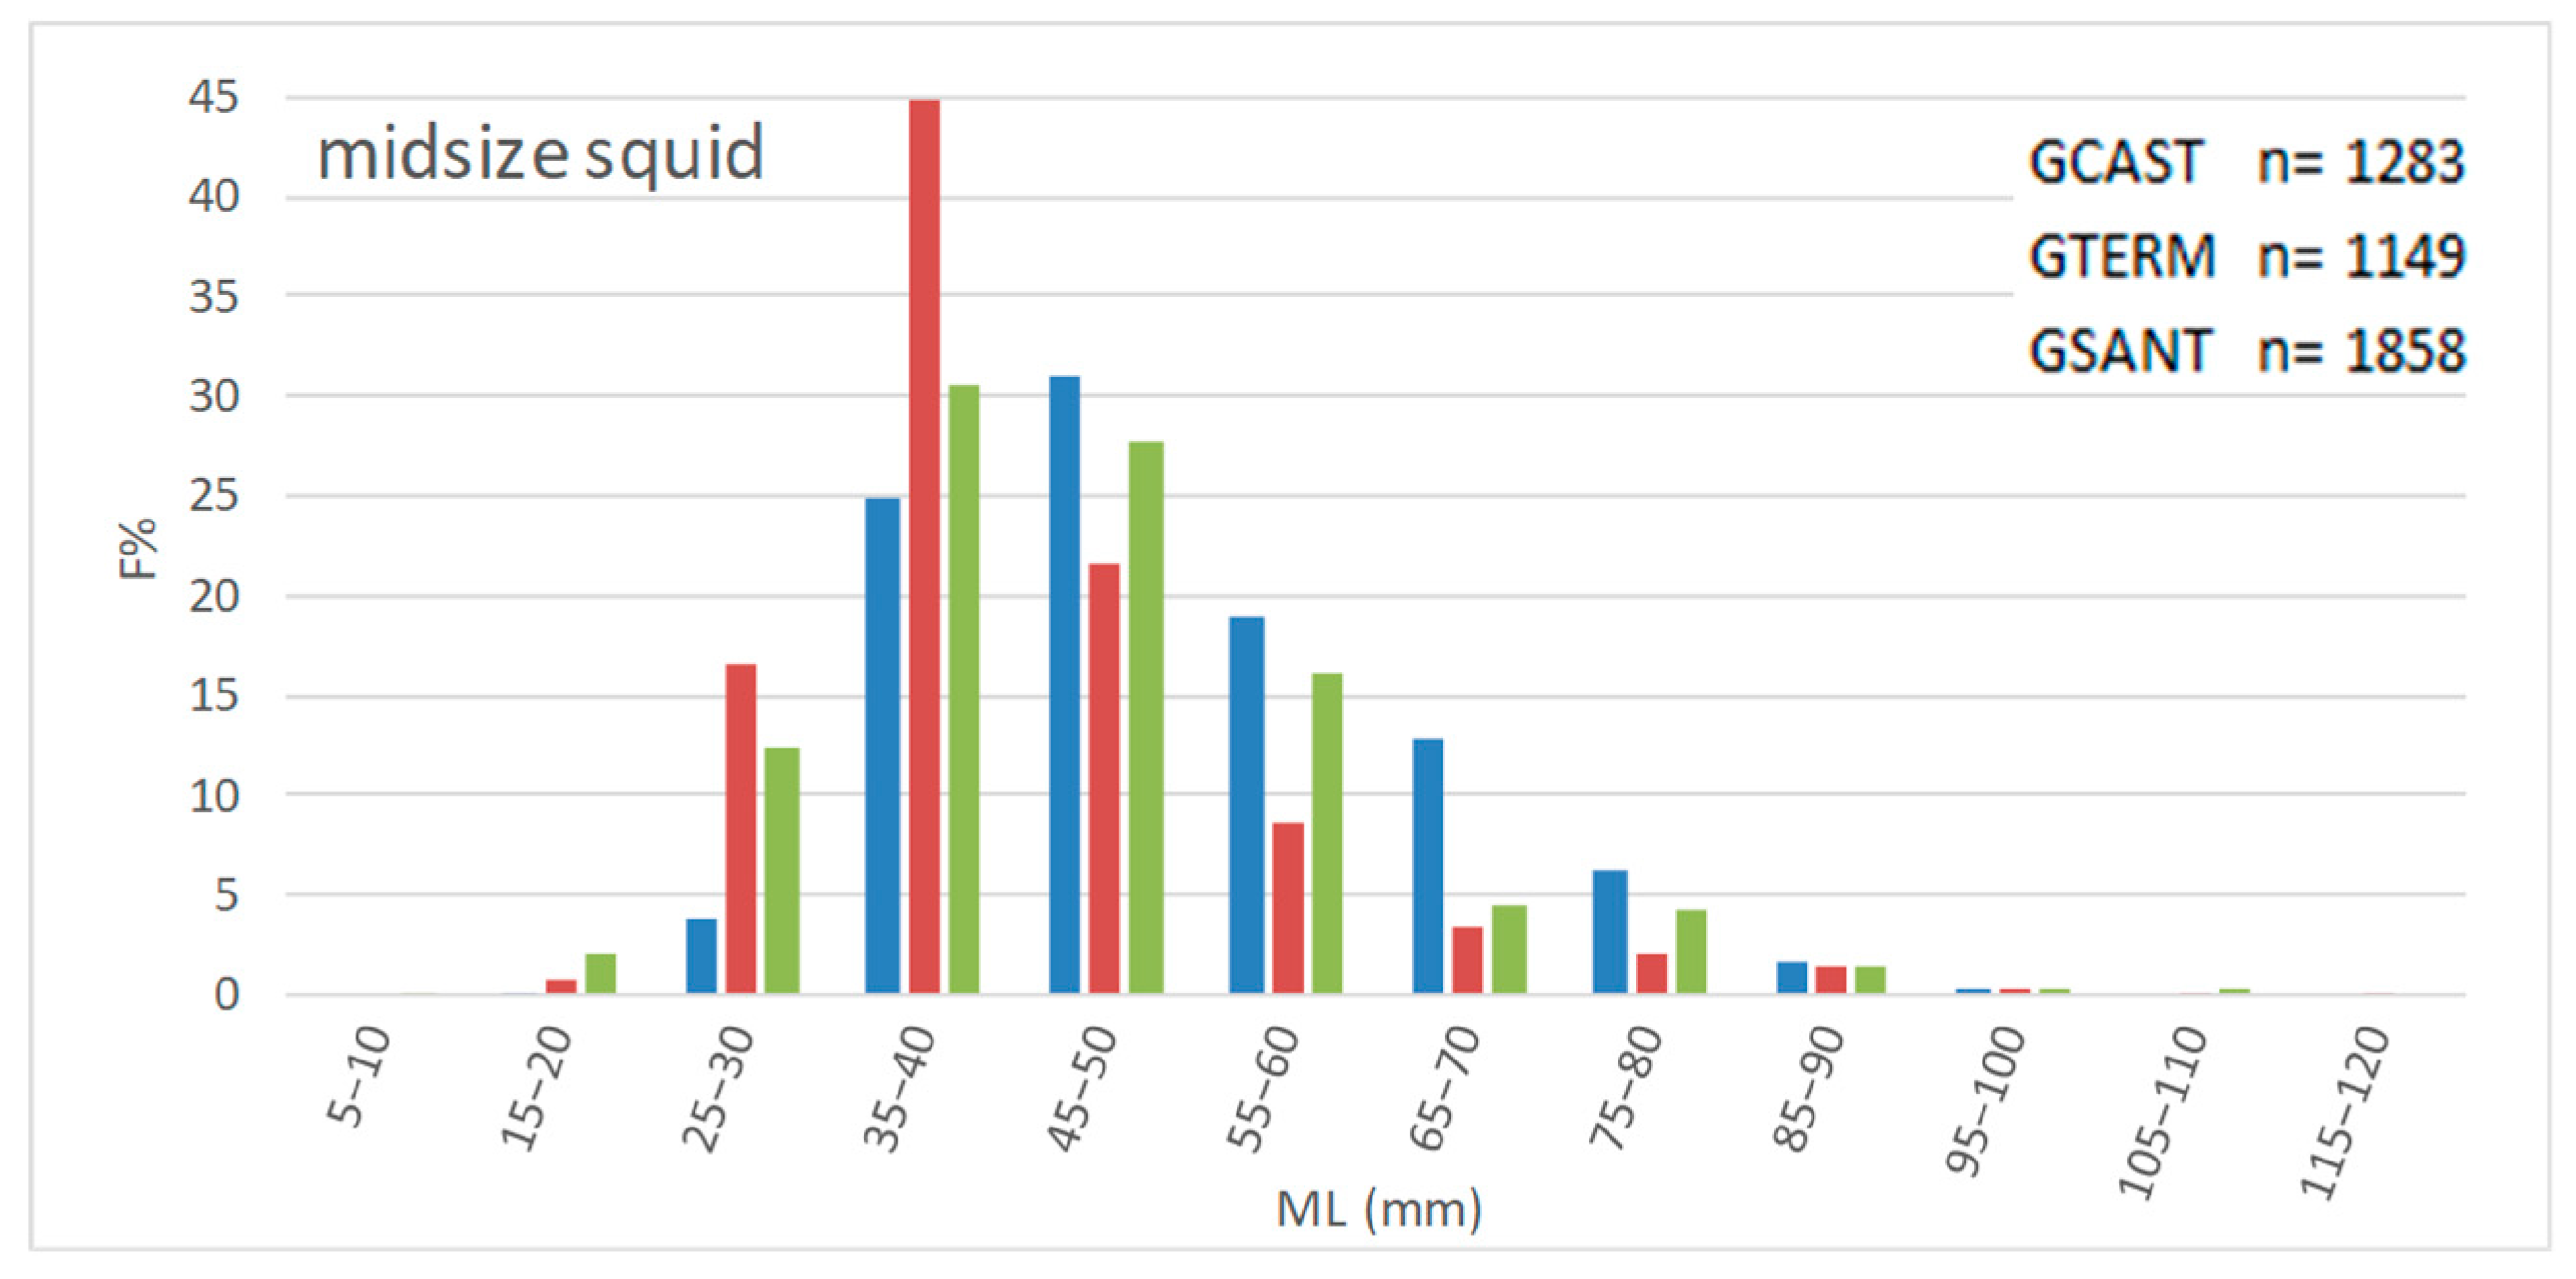
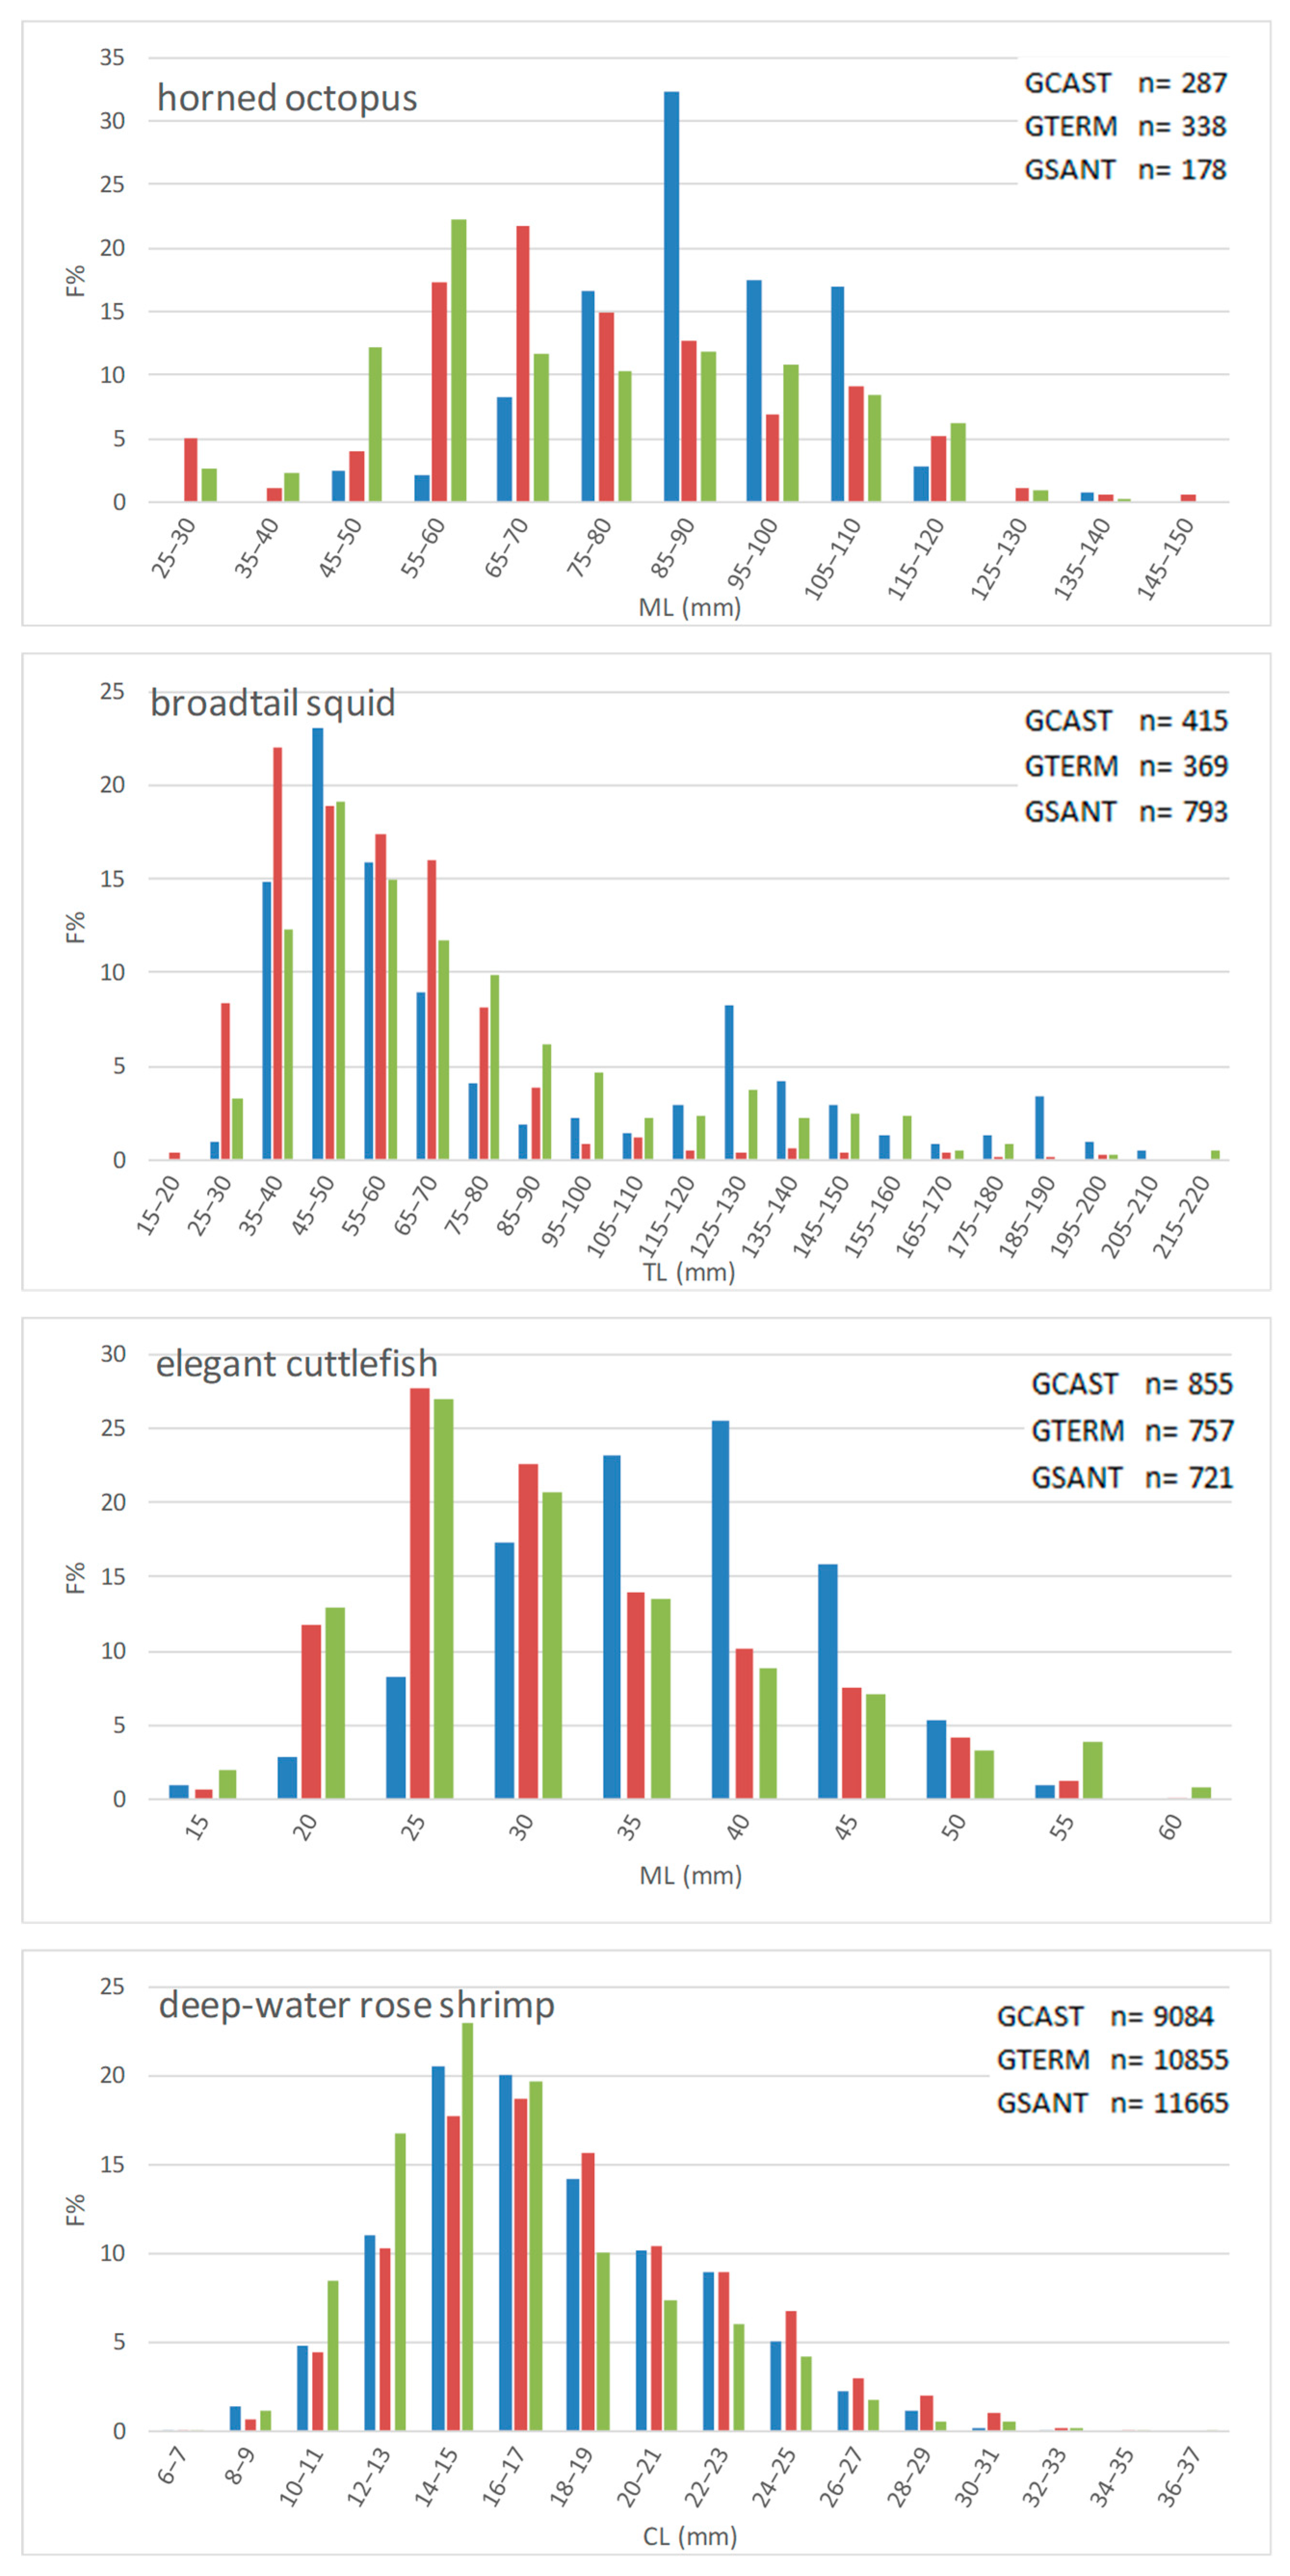
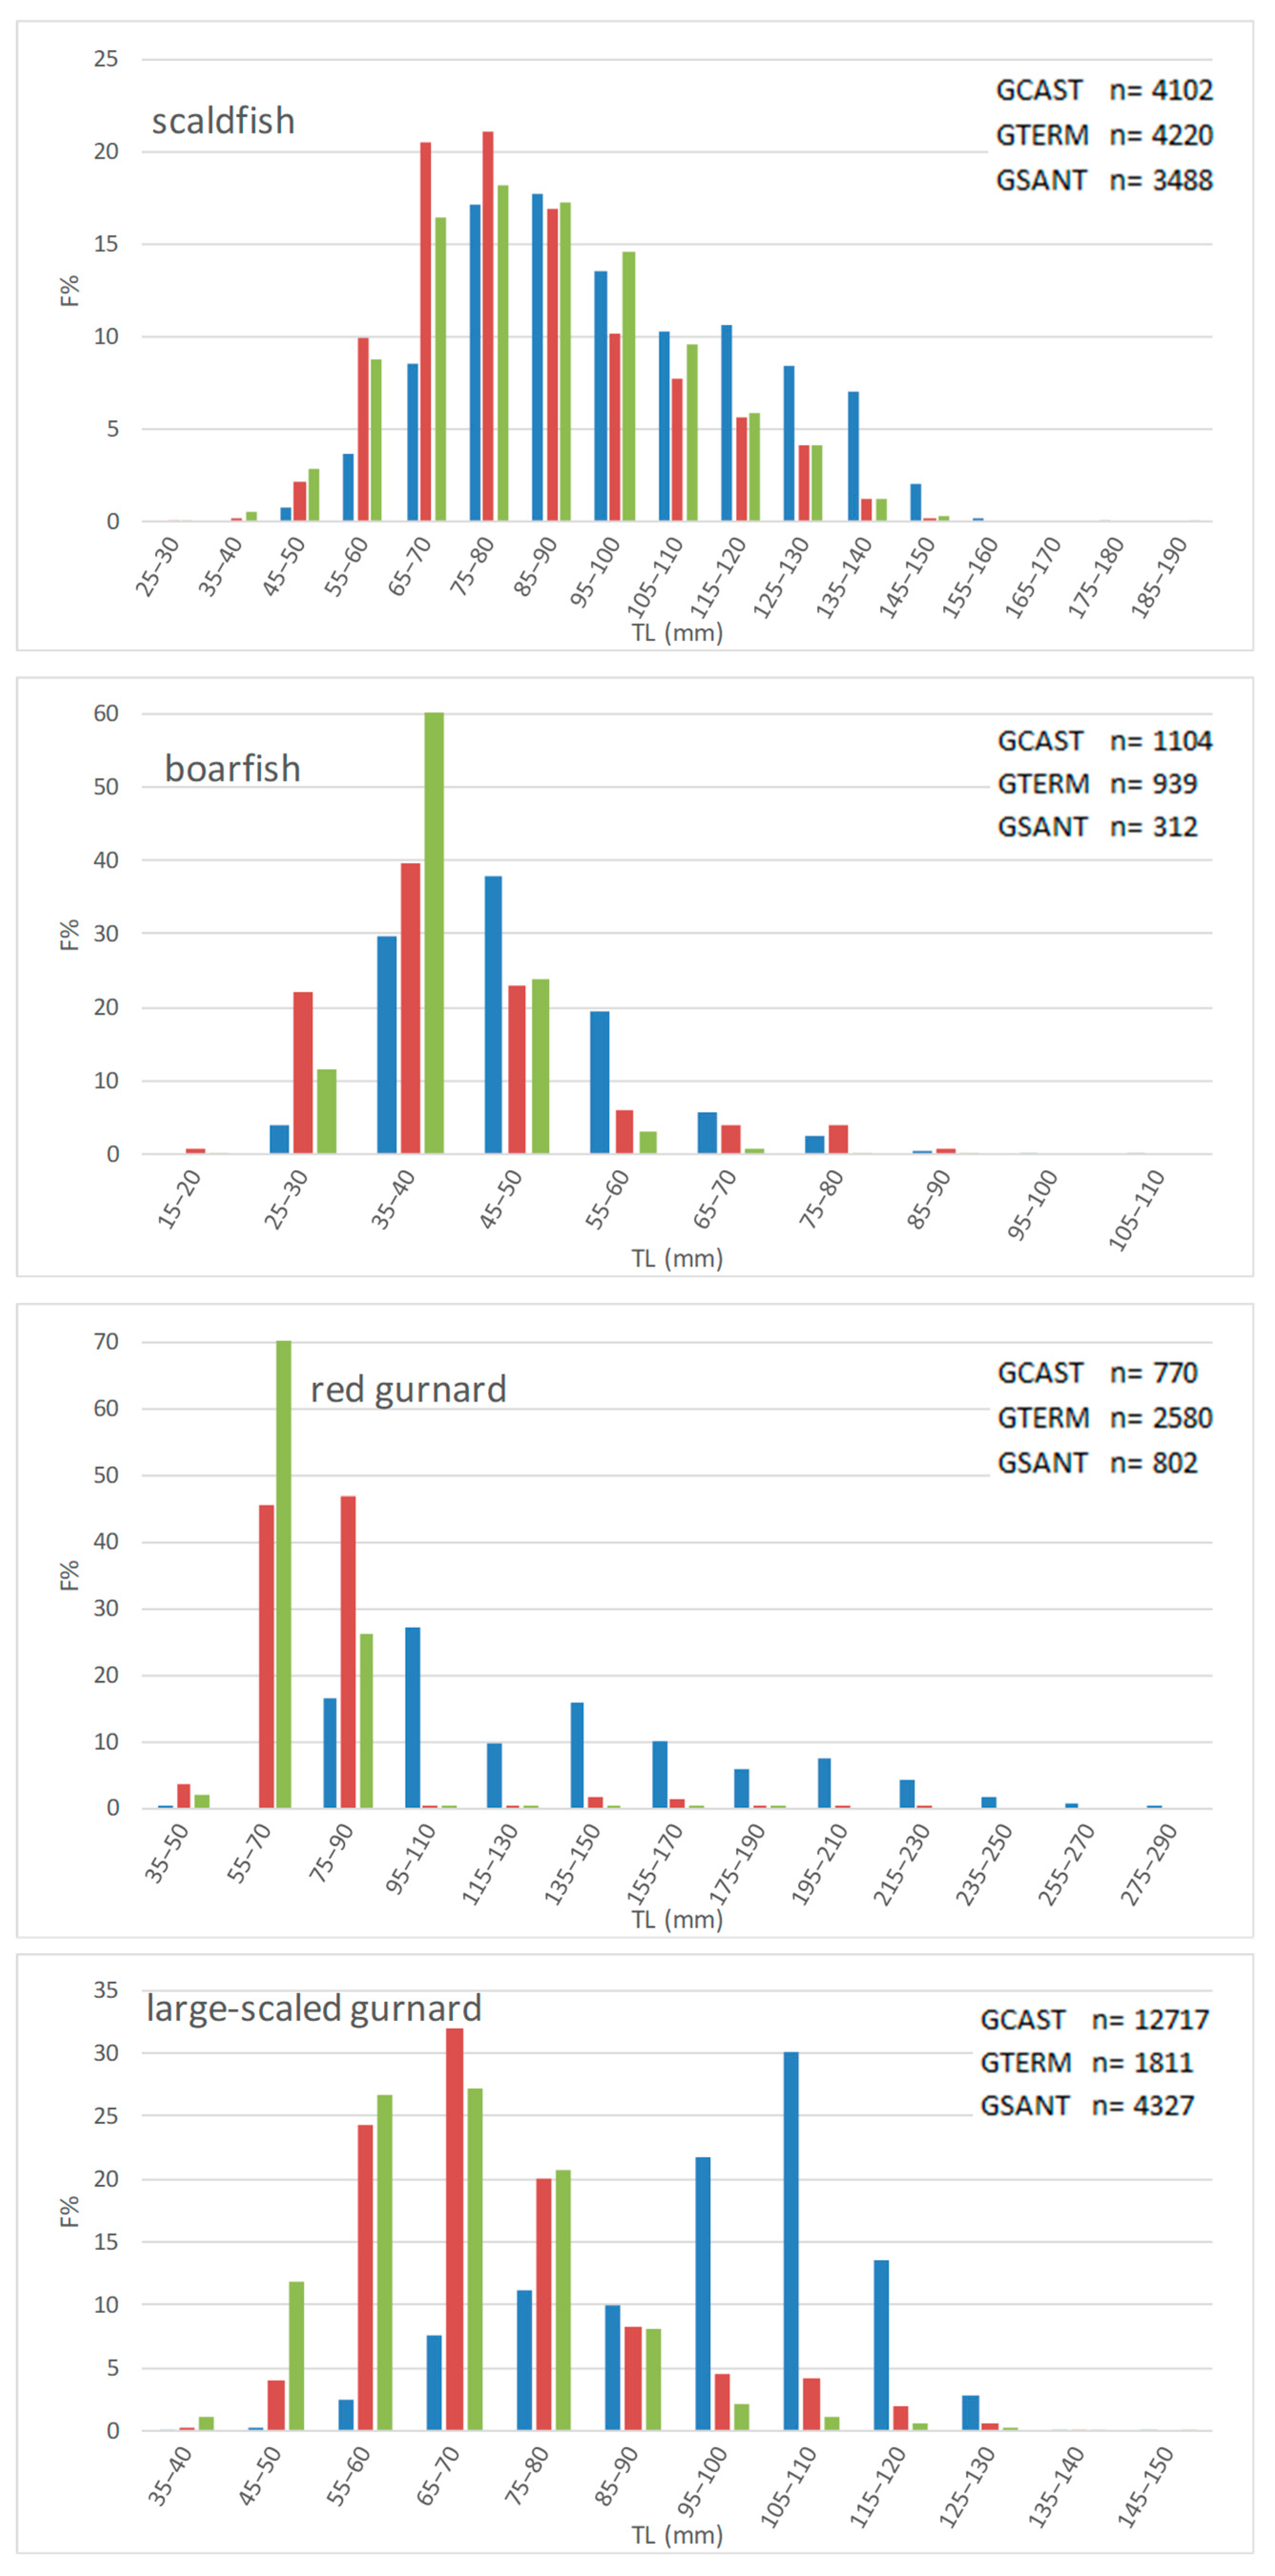
The LFD shapes recorded in 2004–2005 in the three gulfs were significantly different for all species in each possible pair of gulfs (K-S tests: p < 0.001, except horned octopus in GTERM vs. GSANT, pandora in GTERM vs. GSANT, and broadtail squid in GCAST vs. GTERM, all p < 0.01), with the only exception of elegant cuttlefish in GTERM vs. GSANT (p > 0.8) (Figure 4).
  • Length-based indices
The length-based indices help to characterize and synthetize the observed size structures and are reported in Table 6. Lm was higher in the GCAST for all species except broadtail squid (highest in the GTERM), and deep-water rose shrimp (highest in the GSANT). L95 was higher in the GCAST for seven species, the exceptions were midsize squid (highest in the GTERM), horned octopus (highest in the GSANT), elegant cuttlefish (highest in the GTERM), deep-water rose shrimp (highest in the GSANT), boarfish (highest in the GSANT), red mullet (highest in the GCAST and the GSANT), and picarel (highest in the GSANT). L2/3 was higher in the GCAST for nine species; the exceptions were scaldfish (highest in the GCAST and the GSANT), boarfish (highest in the GSANT), red mullet (highest in the GSANT), pandora (highest in the GTERM), and greater forkbeard (highest in the GSANT).

4. Discussion

Spatial measures such as the trawl ban in the GCAST represent an application of a multispecies spatial approach that matches the principles of ecosystem-based fisheries management. Spatially explicit management has the potential to preserve ecosystem resilience and allow sustainable fishing and protection of habitats, community structure, and ecosystem functions [64,65]. Although fisheries-induced impacts may have evolutionary components that are hardly reversible, leading in some cases to the lack of recovery after protection [66], most of the partial or absent effectiveness observed in some cases has been explained mainly with unsuccessful habitat protection, lack of compliance, mismanagement issues, inappropriate planning, unexpected fish stock redistribution, modifications of fishing pressure, and impact from recreational fishing or fisheries-unrelated human activities [67,68,69,70,71,72,73].
Overall, the use of fishery reserves (sensu Auster & Shackell [74]) and, more generally, of partially protected areas as management tools has been enthusiastically fostered and the evidence of their potential in an ecosystem-based approach has been steadily growing [75,76,77,78], although a high variability in their effectiveness—see examples above—should be acknowledged. The Mediterranean Sea, an area historically exploited by coastal and offshore fisheries [79], provides several examples of the successful use of trawl bans and other area-based management tools [30], some of which date back to more than one century ago such as the trawl ban imposed in 1896 in northern Sicily, leading to an increase of catches and an enhancement of the economic condition of a vast number of artisanal fishermen [75].
Our study has provided evidence that a year-round trawl ban imposed on the soft bottoms of the continental shelf in a warm-temperate region such as the Mediterranean may lead to a remarkable enhancement of the demersal fish assemblage. The effect is clearer for biomass but less defined for the size structure of the affected populations.

4.1. Biomass

  • Total trawlable assemblage
The total biomass of the demersal fish assemblage in the GCAST underwent an increase after the 1990 trawl ban, confirming our first hypothesis. An increase in finfish and shellfish biomass is the most commonly observed effect of fishing exclusions in coastal and offshore ecosystems [12]. The increase of the total biomass observed in the GCAST should be considered a clear sign of ecosystem recovery after a multidecadal intense fishing impact on the area [80].
The similarity between the before-1990 biomass value in the GCAST and the before- and after-1990 values in the two trawled gulfs shows that in the absence of the trawl ban, the three areas shared a similar amount of trawlable resources. The postban biomass increase in the GCAST had already been observed as early as 1994 [36], although supported by a much smaller dataset and a weaker statistical design than in the present work. Similar evidence of biomass increase was recorded in a few other trawl exclusion areas in the Mediterranean [52], the Atlantic Ocean [24,81,82,83,84], and the Pacific Ocean [73], even though only a few studies [69,85] have considered the effect of protection on the whole trawlable assemblage rather than on a few target species.
  • Target species
Considering the ten target species, they reflected, to a large extent, the same general trend of increased biomass observed for the total trawlable assemblage in the GCAST after the ban. Red mullet in particular has undergone a dramatic increase [36,45] and has possibly contributed to the recovery of two of its main predators, white grouper Epinephelus aeneus and anglerfish [86]. The biomass of red mullet, pandora, annular seabream, and axillary seabream increased also in a no-trawl area in the NW Aegean Sea [52]. Likewise, positive effects of a trawl ban on the recruitment of hake, along with some evidence of spillover to adjacent fishing grounds, were recorded from another small no-trawl area located off the Catalan coast [87].
The general postban biomass increase observed in the GCAST did not involve all target species though. The biomass of horned octopus and deep-water rose shrimp was similar in the after-1990 GCAST and in some of the other Time/Locality combinations; while that of common octopus was higher after 1990 but only in the GCAST. Cephalopods are short-lived, fast growing, rapid-turnover species, and as such, they are expected to suffer from intense fishing less than slower growing, longer living species as most demersal finfish are [88,89]. This might explain the observed biomass values of the first two species but not the increased biomass of common octopus and common cuttlefish in the after-1990 GCAST. Environmental factors have been suggested to impact cephalopods even more than anthropogenic factors such as fishing [89,90], so unknown, complex interactions between co-occurring natural and human impacts, as well as possible predation release due to the after-1990 increase of fish biomass in the GCAST might have driven the observed trends.
Deep-water rose shrimp is another fast growing, short-lived species and a prey for a number of fishes [48,91]. Its short life span associated with low biomass of predators could justify the high biomass values recorded in the trawled areas, while the increase of potential predators such as anglerfish and hake and the intense fishing pressure exerted on the shelf break outside the trawl ban area, where most of the population lives (pers. observ.) could have hampered a larger increase in the GCAST, where, nonetheless, protection triggered a biomass increase after the ban.
  • Commercial categories in the GCAST
The biomass of highly commercial species (i.e., generally large-sized, long-living demersal finfish) is supposed to increase as a result of protection, while that of noncommercial species is expected to remain unchanged or even to increase in exploited assemblages, due to the selective pressure exerted on larger, more valuable species [2,92]. Our second hypothesis was based on this postulate and was largely confirmed by our findings. The percentage contribution of HC and NC species to the total survey catch in the GCAST has slightly increased after the ban, while the MC species have remarkably decreased. Larger biomass of noncommercial species was also reported from a no-trawl area in the NW Aegean when compared to areas with medium and high level of fishing pressure [52]. These results might be due to the long-term protection allowed to soft-bottom shelf communities in the GCAST and the NW Aegean: in the absence of trawling impact, the benthic and nekto-benthic fish assemblages have recovered, so also the smaller, noncommercial fishes living in those habitats could rebuild and thrive.
The increased and larger biomass of HC species, coupled with a lower biomass of NC species at lower depths (stratum A) offers potential economic advantages to artisanal fishermen in the GCAST, who operate largely within the -100 m isobath (pers. observ.). Trawl bans in coastal areas may provide an increase of income to artisanal fishermen [29] [34] because of fish biomass increase and among-fleets conflict reduction [80], and an opportunity to expand the fishing areas in the absence of competing trawlers [35], especially when coupled with economic incentives meant to keep a low trawling intensity also on adjacent grounds [93].

4.2. Size

Fish populations are expected to contain more abundant older and larger fish and have a wider, less contracted size distribution when subject to full or partial protection [17,94]. A reduction of fishing pressure can also lead to the survival and increased abundance of large females, which are able to produce more and better eggs and to contribute to higher recruitment [95], and provide the conditions for a recovery from overexploitation, as suggested by Fiorentino et al. [45] for red mullet in the Gulf of Castellammare.
To assess the effect of the trawl ban on the size structure of demersal fish populations, we compared LFDs and some size-based indices in the GCAST and in two trawled areas comparing length data collected 15 years after the start of the ban. Overall, our third hypothesis has been partially confirmed by data.
LFDs were different in all possible pairs of gulfs, showing differences for each species not only between the GCAST and each of the GTERM and the GSANT but also between the two trawled gulfs—except for elegant cuttlefish in GTERM vs. GSANT. The size-based indices displayed different trends in the three gulfs although values were generally higher in the no-trawl area. Lm was higher in the GCAST for all species except broadtail squid and deep-water rose shrimp, whereas L95 and L2/3 were higher in the GCAST for seven and nine species out of fourteen, respectively, indicating a presence of large individuals of some species in the trawled gulfs. As regards the last two indices, the observed situation is not easy to interpret but it does not seem to be directly related to bio-ecological traits, since species with different life span and different habitat had higher values in the trawled gulfs. It is not unlikely that not only fishing pressure, but possibly also unknown site-specific variables or density-dependent effects may have affected the demographic structure of the fished populations. A complex interaction between resource availability and density-dependence [81,96] may have played a role in the growth performance of some species in our study areas, as well as the pressure exerted by artisanal fishermen targeting a small number of benthic and bentho-pelagic species—especially red mullet, pandora and cephalopods—using size-selective fishing gear [35,97].

5. Conclusions

Our survey data collected in three areas along the coast of northern Sicily demonstrate that a trawl exclusion may lead to a significant increase in demersal biomass and in a higher proportion of highly commercial species in the shallower grounds exploited by artisanal fishermen. Less clear results were obtained from the analysis of length data, although there is a general indication of larger sizes for some of the studied species in the no-trawl area. Overall, the Gulf of Castellammare case study sheds light on the recovery mechanisms after a strong reduction of fishing pressure in a warm-temperate shelf ecosystem and represents an addition to the adoption of an ecosystem-based fisheries management approach in the Mediterranean [10].
The trawl ban in the Gulf of Castellammare represents also a powerful and very promising tool for the management of coastal fishery resources within the Common Fishery Policy (Reg. EU 1380/2013) and a way to attain the objectives set for European waters by the Marine Strategy Framework Directive (2008/56/EC).
The specific situation observed in the Gulf of Castellammare (including the extremely low biomass of sharks and rays and the boost of mesopredators (pers. observ.)), suggests that the Gulf might still be at an early stage of recovery. Further research is needed to investigate the evolution of the fish and benthic assemblages and of the seabed habitats in the Gulf of Castellammare in order to evaluate the long-term consequences of the trawl ban on the ecosystem and on the performances of the artisanal fishery.

Supplementary Materials

The following supporting information can be downloaded at: https://www.mdpi.com/article/10.3390/su15032425/s1, Table S1. List of species collected during the trawl surveys made in GCAST from 1985 to 2005, and their commercial category. HC: highly commercial; MC: moderately commercial; NC: noncommercial. In grey: target species selected in the paper, Table S2. Results of 3-factor PERMANOVA analysis on square root transformed biomass data of the total trawlable assemblage (a). Post hoc pair-wise tests are reported; significant tests in bold (b), Table S3. Results of 3-factor PERMANOVA analyses on square root transformed biomass data of target species (a). Post hoc pair-wise tests are reported when the interaction TimexStatus is significant; significant tests in bold (b), Table S4. Results of two-way ANOVA on biomass data of commercial categories in GCAST (a), and results of the SNK test for the TimexStratum interaction (b). HC: highly commercial; MC: moderately commercial; NC: noncommercial; Stratum A: 10–50 m; Stratum B: 51–100 m; Stratum C: 101–200 m; *** p < 0.001; ** p < 0.01; * p < 0.05; ns: nonsignificant.

Author Contributions

Conceptualization, C.P. and G.D.; Data curation, D.A., V.M.G., G.D. and P.R.; Formal analysis, A.Z., T.V.F. and G.D.; Writing—original draft, C.P.; Writing—review and editing, D.A., A.Z., V.M.G., F.B., F.F., P.R., M.S., T.V.F. and G.D. All authors have read and agreed to the published version of the manuscript.

Funding

This research was funded by Italian Ministry of Merchant Navy: National Plan for Fisheries and Aquaculture; European Commission DG XIV: 97/063; European Commission 5th F.P.: QLK5-CT1999-01271; Italian Ministry of Education, University and Research: 63/2004.

Institutional Review Board Statement

Not applicable.

Data Availability Statement

The data presented in this study are partly available in synoptic form in the following public repository items: https://doi.org/10.5281/zenodo.4471447; https://doi.org/10.5281/zenodo.4454808; https://doi.org/10.5281/zenodo.4454700; https://doi.org/10.5281/zenodo.1199558.

Acknowledgments

The authors offer heartfelt thanks to the people who contributed to data entry and samples collection and processing: Marilena Coppola, Giuseppe Di Stefano, Francesco Perdichizzi, and Gianfranco Scotti.

Conflicts of Interest

The authors declare no conflict of interest.

References

  1. Botsford, L.W.; Castilla, J.C.; Peterson, C.H. The management of fisheries and marine ecosystems. Science 1997, 277, 509–515. [Google Scholar] [CrossRef] [Green Version]
  2. Colloca, F.; Cardinale, M.; Maynou, F.; Giannoulaki, M.; Scarcella, G.; Jenko, K.; Bellido, J.M.; Fiorentino, F. Rebuilding Mediterranean fisheries: A new paradigm for ecological sustainability. Fish Fish. 2013, 14, 80–109. [Google Scholar] [CrossRef]
  3. Hsieh, C.H.; Yamauchi, A.; Nakazawa, T.; Wang, W.F. Fishing effects on age and spatial structures undermine population stability of fishes. Aquat. Sci. 2010, 72, 165–178. [Google Scholar] [CrossRef]
  4. Jennings, S.; Reynolds, J.D. Body size, exploitation and conservation of marine organisms. In Body Size: The Structure and Function of Aquatic Ecosystems; Hildrew, A.G., Raffaelli, D.G., Edmonds-Brown, R., Eds.; Cambridge University Press: Cambridge, UK, 2007; pp. 266–285. [Google Scholar]
  5. Kaiser, M.J.; Jennings, S. Ecosystem Effects of Fishing. In Handbook of Fish Biology and Fisheries; Hart, P.J.B., Reynolds, J.D., Eds.; Blackwell Science Ltd.: Malden, MA, USA, 2008; pp. 342–366. [Google Scholar]
  6. Pauly, D.; Christensen, V.; Dalsgaard, J.; Froese, R.; Torres, F., Jr. Fishing down marine food webs. Science 1998, 279, 860–863. [Google Scholar] [CrossRef] [PubMed]
  7. Hastings, A.; Gaines, S.D.; Costello, C. Marine reserves solve an important bycatch problem in fisheries. Proc. Natl. Acad. Sci. USA 2017, 114, 8927–8934. [Google Scholar] [CrossRef] [PubMed] [Green Version]
  8. Melnychuk, M.C.; Kurota, H.; Mace, P.M.; Pons, M.; Minto, C.; Osio, G.C.; Jensen, O.P.; de Moor, C.L.; Parma, A.M.; Little, L.R.; et al. Identifying management actions that promote sustainable fisheries. Nat. Sustain. 2021, 4, 440–449. [Google Scholar] [CrossRef]
  9. Rice, J.C. Every which way but up: The sad story of Atlantic groundfish, featuring Northern cod and North Sea cod. Bull. Mar. Sci. 2006, 78, 429–465. [Google Scholar]
  10. Coll, M.; Cury, P.; Azzurro, E.; Bariche, M.; Bayadas, G.; Bellido, J.M.; Chaboud, C.; Claudet, J.; El-Sayed, A.; Gascuel, D.; et al. The scientific strategy needed to promote a regional ecosystem-based approach to fisheries in the Mediterranean and Black Seas. Rev. Fish Biol. Fish. 2013, 23, 415–434. [Google Scholar] [CrossRef]
  11. Stelzenmüller, V.; Breen, P.; Stamford, T.; Thomsen, F.; Badalamenti, F.; Borja, A.; Buhl-Mortensen, L.; Carlstom, J.; D’Anna, G.; Dankers, N.; et al. Monitoring and evaluation of spatially managed areas: A generic framework for implementation of ecosystem based marine management and its application. Mar. Policy 2013, 37, 149–164. [Google Scholar] [CrossRef]
  12. Goñi, R.; Badalamenti, F.; Tupper, M. Effects of marine protected areas on local fisheries: Evidence from empirical studies. In Marine Protected Areas—A Multidisciplinary Approach; Claudet, J., Ed.; Cambridge University Press: Cambridge, UK, 2011; pp. 72–98. [Google Scholar]
  13. Pérez-Ruzafa, A.; Martin, E.; Marcos, C.; Zamarro, J.M.; Stobart, B.; Harmelin Vivien, M.; Polti, S.; Planes, S.; Garcia Charton, J.A.; Gonzalez-Wanguemert, M. Modelling spatial and temporal scales for spill-over and biomass exportation from MPAs and their potential for fisheries enhancement. J. Nat. Conserv. 2008, 16, 234–255. [Google Scholar] [CrossRef]
  14. Sala, E.; Mayorga, J.; Bradley, D.; Cabral, R.B.; Atwood, T.B.; Auber, A.; Cheung, W.; Costello, C.; Ferretti, F.; Friedlander, A.M.; et al. Protecting the global ocean for biodiversity, food and climate. Nature 2021, 592, 7854. [Google Scholar] [CrossRef] [PubMed]
  15. Ward, T.J.; Heinemann, D.; Evans, N. The Role of Marine Reserves as Fisheries Management Tools. A Review of Concepts, Evidence and International Experience; Bureau of Rural Sciences, Department of Agriculture, Fisheries and Forestry: Canberra, Australia, 2001; p. 192. [Google Scholar]
  16. Hixon, M.A.; Johnson, D.W.; Sogard, S.M. BOFFFFs: On the importance of conserving old-growth age structure in fishery populations. ICES J. Mar. Sci. 2014, 71, 2171–2185. [Google Scholar] [CrossRef] [Green Version]
  17. Baskett, M.L.; Barnett, L.A.K. The ecological and evolutionary consequences of marine reserves. Annu. Rev. Ecol. Evol. Syst. 2015, 46, 49–73. [Google Scholar] [CrossRef] [Green Version]
  18. Apostolaki, P.; Milner-Gulland, E.J.; McAllister, M.K.; Kirkwood, G.P. Modelling the effects of establishing a marine reserve for mobile fish species. Can. J. Fish. Aquat. Sci. 2002, 59, 405–415. [Google Scholar] [CrossRef] [Green Version]
  19. Russo, T.; D’Andrea, L.; Franceschini, S.; Accadia, P.; Cucco, A.; Garofalo, G.; Gristine, M.; Parisi, A.; Quattrocchi, G.; Sabatella, R.F.; et al. Simulating the Effects of Alternative Management Measures of Trawl Fisheries in the Central Mediterranean Sea: Application of a Multi-Species Bio-economic Modeling Approach. Front. Mar. Sci. 2019, 6, 542. [Google Scholar] [CrossRef]
  20. Sladek Nowlis, J.; Roberts, C.M. Fisheries benefits and optimal design of marine reserves. Fish. Bull. 1999, 97, 604–616. [Google Scholar]
  21. Barnes, B.; Sidhu, H. The impact of marine closed areas on fishing yield under a variety of management strategies and stock depletion levels. Ecol. Model. 2013, 269, 113–125. [Google Scholar] [CrossRef]
  22. Yamazaki, S.; Grafton, Q.R.; Kompas, T.; Jennings, S. Biomass management targets and the conservation and economic benefits of marine reserves. Fish Fisher. 2014, 15, 196–208. [Google Scholar] [CrossRef]
  23. Fernández-Chacón, A.; Moland, E.; Heiberg Espeland, S.; Moland Olsen, E. Demographic effects of full vs. partial protection from harvesting: Inference from an empirical before–after control-impact study on Atlantic cod. J. Appl. Ecol. 2015, 52, 1206–1215. [Google Scholar] [CrossRef]
  24. Murawski, S.A.; Wigley, S.E.; Fogarty, M.J.; Rago, P.J.; Mountain, D.G. Effort distribution and catch patterns adjacent to temperate MPAs. ICES J. Mar. Sci. 2005, 62, 1150–1167. [Google Scholar] [CrossRef] [Green Version]
  25. Gubbay, S. Marine Protected Areas in the Context of Marine Spatial Planning: Discussing the Links; WWF: Godalming, UK, 2004; p. 22. Available online: http://assets.wwf.org.uk/downloads/mpas_marinespacialplanning.pdf (accessed on 11 July 2022).
  26. Fraschetti, S.; Pipitone, C.; Mazaris, A.D.; Rilov, G.; Badalamenti, F.; Bevilacqua, S.; Claudet, J.; Caric, H.; Dahl, K.; D’Anna, G.; et al. Light and shade in marine conservation across European and contiguous seas. Front. Mar. Sci. 2018, 5, 420. [Google Scholar] [CrossRef]
  27. Agardy, T. Justified ambivalence about MPA effectiveness. ICES J. Mar. Sci. 2018, 75, 1183–1185. [Google Scholar] [CrossRef] [Green Version]
  28. Sciberras, M.; Jenkins, S.R.; Mant, R.; Kaiser, M.J.; Hawkins, S.J.; Pullin, A.S. Evaluating the relative conservation value of fully and partially protected marine areas. Fish Fisher. 2015, 16, 58–77. [Google Scholar] [CrossRef]
  29. Bailey, C. Lessons from Indonesia’s 1980 trawler ban. Mar. Policy 1997, 21, 225–235. [Google Scholar] [CrossRef] [Green Version]
  30. Pipitone, C.; Badalamenti, F.; Vega Fernández, T.; D’Anna, G. Spatial Management of Fisheries in the Mediterranean Sea: Problematic Issues and a Few Success Stories. In Marine Managed Areas and Fisheries; Johnson, M.L., Sandell, J., Lesser, M., Eds.; Advances in Marine Biology; Academic Press: Oxford, UK, 2014; Volume 69, pp. 371–402. [Google Scholar]
  31. Pastoors, M.A.; Rijnsdorp, A.D.; van Beek, F.A. Effects of a partially closed area in the North Sea (“plaice box”) on stock development of plaice. ICES J. Mar. Sci. 2000, 57, 1014–1022. [Google Scholar] [CrossRef] [Green Version]
  32. FAO. The State of World Fisheries and Aquaculture 2020. Sustainability in Action; FAO: Rome, Italy, 2020; p. 206. [Google Scholar]
  33. Guidetti, P.; Bussotti, S.; Pizzolante, F.; Ciccolella, A. Assessing the potential of an artisanal fishing co-management in the Marine Protected Area of Torre Guaceto (southern Adriatic Sea, SE Italy). Fish. Res. 2010, 101, 180–187. [Google Scholar] [CrossRef]
  34. Whitmarsh, D.; James, C.; Pickering, H.; Pipitone, C.; Badalamenti, F.; D’Anna, G. Economic effects of fisheries exclusion zones: A Sicilian case study. Mar. Res. Econ. 2002, 17, 239–250. [Google Scholar] [CrossRef]
  35. Whitmarsh, D.; Pipitone, C.; Badalamenti, F.; D’Anna, G. The economic sustainability of artisanal fisheries: The case of the trawl ban in the Gulf of Castellammare, NW Sicily. Mar. Policy 2003, 27, 489–497. [Google Scholar] [CrossRef]
  36. Pipitone, C.; Badalamenti, F.; D’Anna, G.; Patti, B. Fish biomass increase after a four-year trawl ban in the Gulf of Castellammare (NW Sicily, Mediterranean Sea). Fish. Res. 2000, 48, 23–30. [Google Scholar] [CrossRef]
  37. Sweeting, C.J.; Badalamenti, F.; D’Anna, G.; Pipitone, C.; Polunin, N.V.C. Steeper biomass spectra of demersal fish communities after trawler exclusion in Sicily. ICES J. Mar. Sci. 2009, 66, 195–202. [Google Scholar] [CrossRef] [Green Version]
  38. Badalamenti, F.; Sweeting, C.J.; Polunin, N.V.C.; Pinnegar, J.; D’Anna, G.; Pipitone, C. Limited trophodynamics effects of trawling on three Mediterranean fishes. Mar. Biol. 2008, 154, 765–773. [Google Scholar] [CrossRef]
  39. Fanelli, E.; Badalamenti, F.; D’Anna, G.; Pipitone, C. Diet and trophic level of scaldfish Arnoglossus laterna in the southern Tyrrhenian Sea (western Mediterranean): Contrasting trawled versus untrawled areas. J. Mar. Biol. Ass. UK 2009, 89, 817–828. [Google Scholar] [CrossRef] [Green Version]
  40. Fanelli, E.; Badalamenti, F.; D’Anna, G.; Pipitone, C.; Romano, C. Trophodynamic effects of trawling on the feeding ecology of pandora, Pagellus erythrinus, off the northern Sicily coast (Mediterranean Sea). Mar. Freshw. Res. 2010, 61, 408–417. [Google Scholar] [CrossRef]
  41. Sinopoli, M.; Fanelli, E.; D’Anna, G.; Badalamenti, F.; Pipitone, C. Assessing the effects of a trawling ban on diet and trophic level of hake, Merluccius merluccius, in the southern Tyrrhenian Sea. Sci. Mar. 2012, 76, 677–690. [Google Scholar] [CrossRef] [Green Version]
  42. Giacalone, V.M.; D’Anna, G.; Badalamenti, F.; Pipitone, C. Weight-length relationships and condition factor trends for thirty-eight fish species in trawled and untrawled areas off the coast of northern Sicily (central Mediterranean Sea). J. Appl. Ichtyol. 2010, 26, 954–957. [Google Scholar] [CrossRef]
  43. Sieli, G.; Badalucco, C.; Di Stefano, G.; Rizzo, P.; D’Anna, G.; Fiorentino, F. Biology of red mullet, Mullus barbatus (L. 1758), in the Gulf of Castellammare (NW Sicily, Mediterranean Sea) subject to a trawling ban. J. Appl. Ichtyol. 2011, 27, 1218–1225. [Google Scholar] [CrossRef]
  44. Sinopoli, M.; Pipitone, C.; Badalamenti, F.; D’Anna, G.; Fiorentino, F.; Gristina, M.; Lauria, V.; Rizzo, P.; Milisenda, G. Effects of a trawling ban on the growth of young-of-the-year European hake, Merluccius merluccius in a Mediterranean fishing exclusion zone. Reg. Stud. Mar. Sci. 2022, 50, 102151. [Google Scholar] [CrossRef]
  45. Fiorentino, F.; Badalamenti, F.; D’Anna, G.; Garofalo, G.; Gianguzza, P.; Gristina, M.; Pipitone, C.; Rizzo, P.; Fortibuoni, T. Changes in spawning-stock structure and recruitment pattern of red mullet, Mullus barbatus, after a trawl ban in the Gulf of Castellammare (central Mediterranean Sea). ICES J. Mar. Sci. 2008, 65, 1175–1183. [Google Scholar] [CrossRef]
  46. Fanelli, E.; Cartes, J.E.; Badalamenti, F.; D’Anna, G.; Pipitone, C.; Azzurro, E.; Rumolo, P.; Sprovieri, M. Meso-scale variability of coastal suprabenthic communities in the southern Tyrrhenian Sea (western Mediterranean). Est. Coast. Mar. Sci. 2011, 91, 351–360. [Google Scholar] [CrossRef]
  47. Romano, C.; Fanelli, E.; D’Anna, G.; Pipitone, C.; Vizzini, S.; Mazzola, A.; Badalamenti, F. Spatial variability of soft-bottom macrobenthic communities in northern Sicily (Western Mediterranean): Contrasting trawled vs. untrawled areas. Mar. Environ. Res. 2016, 122, 113–125. [Google Scholar] [CrossRef] [PubMed]
  48. Relini, G.; Bertrand, J.; Zamboni, A. (Eds.) Synthesis of the Knowledge on Bottom Fishery Resources in Central Mediterranean (Italy and Corsica); SIBM: Genova, Italy, 1999; Volume 6, (Suppl. 1), p. 868. [Google Scholar]
  49. Maiorano, P.; Sabatella, R.F.; Marzocchi, B.M. (Eds.) Annuario Sullo Stato delle Risorse e Sulle Strutture Produttive dei Mari Italiani; CNR, CoNISMa, COISPA, CIBM, NISEA, Consorzio Rete Mare: Ancona, Italy, 2019; p. 432. [Google Scholar]
  50. Sparre, R.; Venema, S.C. Introduction to tropical fish stock assessment. Part 1. Manual. FAO Fish. Tech. Pap. 1998, 306, 407. [Google Scholar]
  51. Fiorentini, L.; Cosimi, G.; Sala, A.; Palumbo, V. Characteristic and performance of the fishing gears used for demersal stock assessment in Italy. Biol. Mar. Medit. 1994, 1, 115–134. [Google Scholar]
  52. Dimarchopoulou, D.; Dogrammatzi, A.; Karachle, P.K.; Tsikliras, A.C. Spatial fishing restrictions benefit demersal stocks in the northeastern Mediterranean Sea. Sci. Rep. 2018, 8, 5967. [Google Scholar] [CrossRef] [PubMed] [Green Version]
  53. Probst, W.N.; Stelzenmüller, V.; Fock, H.O. Using cross-correlations to assess the relationship between time-lagged pressure and state indicators: An exemplary analysis of North Sea fish population indicators. ICES J. Mar. Sci. 2012, 69, 670–681. [Google Scholar] [CrossRef] [Green Version]
  54. Trenkel, V.M.; Rochet, M.J. Combining time trends in multiple metrics for identifying persistent changes in population processes or environmental stressors. J. Appl. Ecol. 2010, 47, 751–758. [Google Scholar] [CrossRef]
  55. Shin, Y.J.; Rochet, M.-J.; Jennings, S.; Field, J.G.; Gislason, H. Using size-based indicators to evaluate the ecosystem effects of fishing. ICES J. Mar. Sci. 2005, 62, 384–396. [Google Scholar] [CrossRef] [Green Version]
  56. Green, R.H. Sampling Design and Statistical Methods for Environmental Biologists; John Wiley and Sons: Hoboken, NJ, USA, 1979; p. 272. [Google Scholar]
  57. Schwarz, C.J. Analysis of BACI experiments. In Course Notes for Beginning and Intermediate Statistics; Simon Fraser University: Burnaby, BC, Canada, 2014; Available online: https://www.coursehero.com/file/14392359/R-part013/ (accessed on 4 November 2019).
  58. Anderson, M.J.; ter Braak, C.J.F. Permutation tests for multi-factorial analysis of variance. J. Stat. Comput. Simul. 2003, 73, 85–113. [Google Scholar] [CrossRef]
  59. Anderson, M.J.; Gorley, R.N.; Clarke, K.R. PERMANOVA+ for PRIMER: Guide to Software and Statistical Methods; PRIMER-E: Plymouth, UK, 2008; p. 214. [Google Scholar]
  60. Clarke, K.R.; Gorley, R.N. PRIMER v6: User Manual/Tutorial; PRIMER-E: Plymouth, UK, 2006; p. 192. [Google Scholar]
  61. R Core Team. R: A Language and Environment for Statistical Computing; R Foundation for Statistical Computing: Vienna, Austria, 2022. [Google Scholar]
  62. RStudio Team. RStudio: Integrated Development for R; RStudio, PBC: Boston, MA, USA, 2022. [Google Scholar]
  63. Sandrini-Neto, A.L.; Camargo, M.G. GAD: General ANOVA Designs; Centro de Estudos do Mar da Universidade Federal do Parana: Pontal do Parana, Brazil, 2022. [Google Scholar]
  64. Francis, R.C.; Hixon, M.A.; Clarke, M.E.; Murawski, S.A.; Ralston, S. Ten commandments for ecosystem-based fisheries scientists. Fisheries 2007, 32, 217–233. [Google Scholar] [CrossRef]
  65. Pikitch, E.K.; Santora, C.; Babcock, E.A.; Bakun, A.; Bonfil, R.; Conover, D.O.; Dayton, P.; Doukakis, P.; Fluharty, D.; Heneman, B.; et al. Ecosystem-Based Fishery Management. Science 2004, 305, 346–347. [Google Scholar] [CrossRef]
  66. Jorgensen, C.; Enberg, K.; Dunlop, E.S.; Arlinghaus, R.; Boukal, D.S.; Brander, K.; Ernande, B.; Gardmark, A.; Johnston, F.; Matsumura, S.; et al. Managing evolving fish stocks. Science 2007, 318, 1247–1248. [Google Scholar] [CrossRef] [Green Version]
  67. Agardy, T.; Notarbartolo di Sciara, G.; Christie, P. Mind the gap: Addressing the shortcomings of marine protected areas through large scale marine spatial planning. Mar. Policy 2011, 35, 226–232. [Google Scholar] [CrossRef]
  68. Frank, K.T.; Shackell, N.L.; Simon, J.E. An evaluation of the Emerald/Western Bank juvenile haddock closed area. ICES J. Mar. Sci. 2000, 57, 1023–1034. [Google Scholar] [CrossRef]
  69. Mak, Y.K.Y.; Tao, L.S.R.; Ho, V.C.M.; Dudgeon, D.; Cheung, W.W.L.; Leung, K.M.Y. Initial recovery of demersal fish communities in coastal waters of Hong Kong, South China, following a trawl ban. Rev. Fish Biol. Fish. 2021, 31, 989–1007. [Google Scholar] [CrossRef]
  70. Mullowney, D.R.J.; Morris, C.J.; Dawe, E.G.; Skanes, K.R. Impacts of a bottom trawling exclusion zone on Snow Crab abundance and fish harvester behavior in the Labrador Sea, Canada. Mar. Policy 2012, 36, 567–575. [Google Scholar] [CrossRef]
  71. Pranovi, F.; Monti, M.A.; Caccin, A.; Brigolin, D.; Zucchetta, M. Permanent trawl fishery closures in the Mediterranean Sea: An effective management strategy? Mar. Policy 2015, 60, 272–279. [Google Scholar] [CrossRef] [Green Version]
  72. Sherwood, G.D.; Grabowski, J.H. A comparison of cod life-history parameters inside and outside of four year-round groundfish closed areas in New England, USA. ICES J. Mar. Sci. 2016, 73, 316–328. [Google Scholar] [CrossRef] [Green Version]
  73. Tao, L.S.R.; Mak, Y.K.Y.; Ho, V.C.M.; Sham, R.C.T.; Hui, T.T.Y.; Lau, D.C.P.; Leung, K.M.Y. Improvements of Population Fitness and Trophic Status of a Benthic Predatory Fish Following a Trawling Ban. Front. Mar. Sci. 2021, 8, 835. [Google Scholar] [CrossRef]
  74. Auster, P.J.; Shackell, N.L. Fishery reserves. In Northwest Atlantic Groundfish: Perspectives on a Fishery Collapse; Boreman, J.G., Nakashima, B.S., Wilson, J.A., Kendall, R.L., Eds.; American Fisheries Society: Bethesda, MD, USA, 1997; pp. 159–166. [Google Scholar]
  75. Badalamenti, F.; Pipitone, C.; Fiorentino, F.; D’Anna, G. The trawling ban in Hong Kong’s inshore waters—A round of applause and a plea to learn from others’ mistakes. Mar. Poll. Bull. 2012, 64, 1513–1514. [Google Scholar] [CrossRef]
  76. Lauck, T.; Clark, C.W.; Mangel, M.; Munro, G.R. Implementing the precautionary principle in fisheries management through marine reserves. Ecol. Appl. 1998, 8, 72–78. [Google Scholar] [CrossRef]
  77. Mesnildrey, L.; Gascuel, D.; Le Pape, O. Integrating Marine Protected Areas in fisheries management systems: Some criteria for ecological efficiency. Aquat. Living Resour. 2013, 26, 159–170. [Google Scholar] [CrossRef]
  78. Polunin, N.V.C. Marine Protected Areas, Fish and Fisheries. In Handbook of Fish Biology and Fisheries; Hart, P.J.B., Reynolds, J.D., Eds.; Blackwell Science Ltd.: Malden, MA, USA, 2008; pp. 293–318. [Google Scholar]
  79. D’Arienzo, V.; Di Salvia, B. (Eds.) Pesci, Barche, Pescatori Nell’area Mediterranea dal Medioevo All’età Contemporanea; Franco Angeli: Milano, Italy, 2010; p. 638. [Google Scholar]
  80. Arculeo, M.; D’Anna, G.; Riggio, S. Valutazione delle risorse demersali nell’ area compresa fra Capo Gallo e Capo San Vito (Sicilia nord-occidentale): Risultati delle campagne condotte nel 1985. Atti Semin. Pesca Acquac. Roma C.N.R. E Min. Mar. Merc. 1988, 3, 1413–1451. [Google Scholar]
  81. Florin, A.B.; Bergstrom, U.; Ustups, D.; Lundstrom, K.; Jonsson, P.R. Effects of a large northern European no-take zone on flatfish populations. J. Fish Biol. 2013, 83, 939–962. [Google Scholar] [CrossRef]
  82. Jaworski, A.; Solmundsson, J.; Ragnarsson, S.A. The effect of area closures on the demersal fish community off the east coast of Iceland. ICES J. Mar. Sci. 2006, 63, 897–911. [Google Scholar] [CrossRef] [Green Version]
  83. Kincaid, K.; Rose, G. Effects of closing bottom trawling on fisheries, biodiversity, and fishing communities in a boreal marine ecosystem: The Hawke Box off Labrador, Canada. Can. J. Fish. Aquat. Sci. 2017, 74, 1490–1502. [Google Scholar] [CrossRef] [Green Version]
  84. Murawski, S.A. Rebuilding depleted fish stocks: The good, the bad, and, mostly, the ugly. ICES J. Mar. Sci. 2010, 67, 1830–1840. [Google Scholar] [CrossRef] [Green Version]
  85. Tuset, V.M.; Farré, M.; Fernandez-Arcaya, U.; Balcells, M.; Lombarte, A.; Recasens, L. Effects of a fishing closure area on the structure and diversity of a continental shelf fish assemblage in the NW Mediterranean Sea. Reg. Stud. Mar. Sci. 2021, 43, 101700. [Google Scholar] [CrossRef]
  86. Agnetta, D.; Badalamenti, F.; D’Anna, G.; Sinopoli, M.; Andaloro, F.; Vizzini, S.; Pipitone, C. Sizing up the role of predators on an overpopulation of Mullus barbatus in Mediterranean no-trawl areas. Fish. Res. 2019, 213, 196–203. [Google Scholar] [CrossRef]
  87. Sala-Coromina, J.; Garcia, J.A.; Martin, P.; Fernandez-Arcaya, U.; Recasens, L. European hake (Merluccius merluccius, Linnaeus 1758) spillover analysis using VMS and landings data in a no-take zone in the northern Catalan coast (NW Mediterranean). Fish. Res. 2021, 237, 105870. [Google Scholar] [CrossRef]
  88. Jennings, S.; Greenstreet, S.P.R.; Reynolds, J.D. Structural change in an exploited fish community: A consequence of differential fishing effects on species with contrasting life histories. J. Anim. Ecol. 1999, 68, 617–627. [Google Scholar] [CrossRef]
  89. Quetglas, A.; Rueda, L.; Alvarez Berastegui, D.; Guijarro, B.; Massuti, E. Contrasting Responses to Harvesting and Environmental Drivers of Fast and Slow Life History Species. PLoS ONE 2016, 11, e0148770. [Google Scholar] [CrossRef] [Green Version]
  90. Caddy, J.F.; Rodhouse, P.G. Cephalopod and groundfish landings: Evidence for ecological change in global fisheries? Rev. Fish Biol. Fish. 1998, 8, 431–444. [Google Scholar] [CrossRef]
  91. Sobrino, I.; Silva, C.; Sbrana, M.; Kapiris, K. A review of the biology and fisheries of the deep water rose shrimp, Parapenaeus longirostris, in European Atlantic and Mediterranean waters (Decapoda, Dendrobranchiata, Penaeidae). Crustaceana 2005, 78, 1153–1184. [Google Scholar] [CrossRef]
  92. Rochet, M.J.; Trenkel, V.M. Which community indicators can measure the impact of fishing? A review and proposals. Can. J. Fish. Aquat. Sci. 2003, 60, 86–99. [Google Scholar] [CrossRef]
  93. Stefanoni, S.; D’Anna, G.; Pipitone, C.; Badalamenti, F. Analisi economica delle politiche di gestione della pesca nel Golfo di Castellammare. In La Valutazione delle Risorse Ambientali. Approcci Multidisciplinari al Golfo di Castellammare; Pipitone, V., Cognata, A., Eds.; Franco Angeli: Milano, Italy, 2008; pp. 178–201. [Google Scholar]
  94. Jennings, S.; Blanchard, J.L. Fish abundance with no fishing: Predictions based on macroecological theory. J. Animal Ecol. 2004, 73, 632–642. [Google Scholar] [CrossRef]
  95. Edwards, C.T.T.; Plaganyi, E.E. Protecting old fish through spatial management: Is there a benefit for sustainable exploitation? J. Appl. Ecol. 2011, 48, 853–863. [Google Scholar] [CrossRef]
  96. Gårdmark, A.; Jonzén, N.; Mangel, M. Density-dependent body growth reduces the potential of marine reserves to enhance yields. J. Appl. Ecol. 2006, 43, 61–69. [Google Scholar] [CrossRef]
  97. Vega Fernández, T.; Zenone, A. Socio-economic characterization of the small-scale fishery in and around the trawl-exclusion area of the Gulf of Castellammare. In Proceedings of the Regional Conference on Building a Future for Sustainable Small-Scale Fisheries in the Mediterranean and the Black Sea, Algiers, Algeria, 7–9 March 2016; Srour, A., Carlson, A., Nastasi, A., Carmignac, C., Bourdenet, D., Pierraccini, J., Sessa, M., Ferri, N., Eds.; Fisheries and Aquaculture Proceedings. FAO: Rome, Italy, 2018; pp. 74–90. [Google Scholar]
Figure 1. Study area: the Gulfs of Castellammare (GCAST), Termini Imerese (GTERM) and Sant’Agata (GSANT). The black contours indicate the surveyed areas. The dotted line in GCAST indicates the outer limit of the no-trawl area.
Sustainability 15 02425 g001
Figure 2. Percentage contribution of commercial categories to the total biomass in the Gulf of Castellammare in the before-1990 (left) and after-1990 (right) periods. HC, MC, NC: highly commercial, moderately commercial, and noncommercial species.
Sustainability 15 02425 g002
Figure 3. Biomass increase (after-1990/before-1990 ratio) of commercial categories in the Gulf of Castellammare. HC, MC, NC: highly commercial, moderately commercial and noncommercial species. A, B, C: depth strata (10–50, 51–100, 101–200 m, respectively).
Sustainability 15 02425 g003
Figure 4. Length frequency distributions of fourteen target species in the three gulfs in 2004–2005. ML: dorsal mantle length; CL: carapace length; TL: total length. Blue bars: GCAST, red bars: GSANT, green bars: GTERM.
Sustainability 15 02425 g004aSustainability 15 02425 g004bSustainability 15 02425 g004cSustainability 15 02425 g004dSustainability 15 02425 g004e
Table 1. List of target species selected for the collection of biomass and size data and their bio-ecological traits. B: biomass; S: size; Be: benthic; BePel: benthopelagic; LL: long-lived; ML: medium-lived; SL: short-lived.
GroupSpeciesCommon NameBiomass/SizeEcology/Biology
CephalopodAlloteuthis mediamidsize squidSBePel/SL
CephalopodEledone cirrhosahorned octopusB/SBe/SL
CephalopodIllex coindetiibroadtail squidSBePel/SL
CephalopodOctopus vulgariscommon octopusBBe/SL
CephalopodSepia eleganselegant cuttlefishSBe/SL
CephalopodSepia officinaliscommon cuttlefishBBe/SL
CrustaceanParapenaeus longirostrisdeep-water rose shrimpB/SBePel/SL
FishArnoglossus laternascaldfishSBe/ML
FishCapros aperboarfishSBePel/ML
FishChelidonichthys cuculusred gurnardSBe/ML
FishDiplodus annularisannular seabreamBBePel/ML
FishLepidotrigla cavillonelarge-scaled gurnardSBe/ML
FishLophius budegassaanglerfishBBe/LL
FishMerluccius merlucciushakeB/SBePel/LL
FishMullus barbatusred mulletB/SBePel/ML
FishPagellus acarneaxillary seabreamBBePel/ML
FishPagellus erythrinuspandoraB/SBePel/ML
FishPhycis blennoidesgreater forkbeardSBe/LL
FishSpicara flexuosumpicarelSBePel/ML
Table 2. Number of replicates of target species considered for each combination of TimexLocality, and depth strata in which each species occurred.
StrataReplicates
Horned octopusB-C22
Common octopusA-B-C32
Common cuttlefishA-B20
Deep-water rose shrimpC12
Annular seabreamA-B20
AnglerfishA-B-C32
HakeA-B-C32
Red mulletA-B20
Axillary seabreamA-B-C32
PandoraA-B20
Table 3. Mean biomass (kg/km2) of the total trawlable assemblage in the before-1990 and after-1990 periods in the three gulfs. s.d.: standard deviation.
Before-1990s.d.After-1990s.d.
GCAST203.1±54.121265.6±866.81
GTERM108.7±43.15130.7±49.39
GSANT139.9±53.59132.0±90.06
Table 4. Mean biomass (kg/km2) of selected target species in the before-1990 and after-1990 periods in the three gulfs. In italics: standard deviation. GCAST: Gulf of Castellammare; GTERM: Gulf of Termini Imerese; GSANT: Gulf of Sant’Agata.
GCASTGTERMGSANT
Before-1990After-1990Before-1990After-1990Before-1990After-1990
Horned octopus 10.117.911.218.711.79.1
±12.27±24.66±15.24±14.43±12.35±9.36
Common octopus6.224.422.42.927.45.0
±15.14±33.23±24.87±12.25±27.11±16.13
Common cuttlefish1.712.34.71.85.35.0
±2.86±1.53±7.52±3.00±5.00±6.40
Deep-water rose shrimp4.525.027.724.713.318.4
±7.27±16.04±27.70±15.07±13.53±10.01
Annular seabream14.3143.74.410.33.32.6
±20.95±218.66±4.35±30.33±4.05±4.83
Anglerfish5.634.36.73.412.62.8
±8.73±40.86±8.25±5.26±11.78±5.48
Hake45.4138.815.421.817.723.9
±52.41±98.36±20.82±23.36±17.01±16.18
Red mullet47.1313.418.95.931.622.8
±77.16±425.13±24.72±10.29±45.84±69.10
Axillary seabream15.686.38.70.67.00.5
±51.43±157.26±15.07±1.90±12.46±1.25
Pandora11.6128.21.69.97.318.0
±12.26±130.51±3.24±10.69±7.65±15.48
Table 5. Mean biomass (kg/km2) of commercial categories in the before-1990 and after-1990 periods in the Gulf of Castellammare. HC, MC, NC: highly commercial, moderately commercial and noncommercial species. A, B, C: depth strata (10–50, 51–100, 101–200 m, respectively). In italics: standard deviation.
Before-1990After-1990
HCMCNCHCMCNC
A145.1101.222.51356.8491.5124.0
±90.4±143.5±16.1±1088.7±521.7±99.6
B124.984.020.6802.2478.8339.8
±81.7±60.0±15.7±592.5±249.7±163.0
C95.570.218.8382.4201.3191.0
±49.6±65.8±20.1±290.3±116.3±101.5
Table 6. Length-based indices of fourteen target species in the three gulfs in 2004–2005. GCAST: Gulf of Castellammare; GTERM: Gulf of Termini Imerese; GSANT: Gulf of Sant’Agata. Lm, median length; L95, the 95% percentile of each length frequency distribution; L2/3, the percentage of individuals larger than 2/3 of the maximum length recorded in the samples. The highest values for each species are in bold font.
Lm (mm)L95 (mm)L2/3 (%)
GCASTGTERMGSANTGCASTGTERMGSANTGCASTGTERMGSANT
midsize squid5247427778671562
horned octopus927277111117121382719
broadtail squid626858183153911152
elegant cuttlefish383232515351471513
deep-water rose shrimp161618111117121382719
scaldfish97888214212712724624
boarfish4842427251743211
red gurnard132727722381901612
large-scaled gurnard10268721219210861311
hake1278787262192203700
red mullet12312211717216617241115
pandora16811714226821121262116
greater forkbeard12710810323217217191015
picarel128122122172177178392221
Disclaimer/Publisher’s Note: The statements, opinions and data contained in all publications are solely those of the individual author(s) and contributor(s) and not of MDPI and/or the editor(s). MDPI and/or the editor(s) disclaim responsibility for any injury to people or property resulting from any ideas, methods, instructions or products referred to in the content.