Article

Characteristics of Atmospheric Pollution in a Chinese Megacity: Insights from Three Different Functional Areas

1
Yangtze River Delta Urban Wetland Ecosystem National Field Scientific Observation and Research Station, School of Environmental and Geological Sciences, Shanghai Normal University, Shanghai 200234, China
2
State Environmental Protection Key Laboratory of Formation and Prevention of Urban Air Pollution Complex, Shanghai Academy of Environment Sciences, Shanghai 200233, China
3
Shanghai Key Laboratory of Atmospheric Particle Pollution and Prevention (LAP3), Shanghai 200438, China
4
Zhejiang Provincial Key Laboratory of Organic Pollution Process and Control, College of Environmental and Resource Sciences, Zhejiang University, Hangzhou 310058, China
*
Author to whom correspondence should be addressed.
Sustainability 2023, 15(3), 2429; https://doi.org/10.3390/su15032429
Submission received: 15 December 2022 / Revised: 12 January 2023 / Accepted: 19 January 2023 / Published: 29 January 2023
(This article belongs to the Special Issue Aerosols and Air Pollution)

Abstract

:
The most important atmospheric pollutants include PM2.5, PM10, SO2, NO2, CO and O3. Characteristics of atmospheric pollution were investigated by analyzing daily and hourly concentrations of the six key pollutants in three different functional areas (urban, suburban, and rural) of Shanghai during 2019–2021. Results show that O3, exceeding PM2.5, has become the primary pollutant determining air quality in Shanghai. The frequency of O3 as a primary pollutant ranged from 40% in an urban area to 71% in a rural area, which was much higher than that of PM2.5 (14–21%). NO2 and SO2, precursors of PM2.5, presented a clear weekend effect, whereas PM2.5 at weekends seems higher than that on weekdays. In the warm season, O3 at weekends was higher than that on weekdays in the three different functional areas, whereas no significant difference was observed between O3 on weekdays and at weekends in the cold season. Potential source contribution function analysis indicated that air pollution in Shanghai was impacted by inter-regional and intra-regional transport. The potential source areas of PM2.5 and O3 were different, which brought challenges to the coordinated control of PM2.5 and O3 in Shanghai. This study emphasizes the prominent O3 pollution in Shanghai, and argues that the prevention and control of O3 pollution requires regional joint prevention and control strategy.

1. Introduction

The most important components of atmospheric pollutants include nitrogen oxides (NOx), carbon monoxide (CO), sulfur dioxide (SO2), PM2.5, PM10 and ozone (O3), which are the basic parameters for evaluating air quality [1]. Short-lived chemicals in the atmosphere, such as O3 and aerosol, pose adverse effects to human health. According to the State of Global Air 2019 [2], premature deaths attributed to exposure to air pollution exceeded traffic accidents every year. Air pollution ranked fourth among health risk factors in China, next to dietary risk, hypertension and smoking [2]. Therefore, the World Health Organization (WHO) tightened the annual guidance value of PM2.5 in 2021 based on the new evidence of a cohort study on the health effects of low PM2.5 levels, which was reduced from 10 μg/m3 to 5 μg/m3 [3,4]. At the same time, these chemicals are important atmospheric components that affect climate change after long-lived greenhouse gases (CO2, N2O, etc.). O3 is a greenhouse gas in the troposphere, which causes climate warming. Aerosol absorbs and scatters short-wave and long-wave radiation, and acts as a cloud condensation nucleus, which affects cloud radiation characteristics, cloud life history and precipitation characteristics (aerosol–cloud interaction), thus leading to climate change. Anthropogenic emissions of SO2 could lead to the formation of sulfate aerosol, which leads to negative effective radiative forcing through aerosol–radiation and aerosol–cloud interaction [5].
In China, PM2.5 was incorporated into the national ambient air quality standard (GB 3095-2012) for the first time in 2012. Then, the Chinese government implemented the Air Pollution Prevention and Control Action Plan from 2013 to 2017, followed by the Three-Year Action Plan for the Blue Sky Protection Campaign during 2018–2020. The annual average PM2.5 concentration of 337 Chinese cities decreased to 33 μg/m3 in 2020 (Data source: China National Environmental Monitoring Centre, http://www.cnemc.cn/jcbg/zghjzkgb/ (accessed on 1 January 2022)), which satisfied the national ambient air quality standard of PM2.5 (35 μg/m3) for the first time. However, the average annual concentration of PM2.5 in urban areas of China has a heavy disparity from the 2021 guidance value of WHO (5 μg/m3), which implied that urban residents still suffered potential health risks caused by air pollution. To keep the trend of continuous improvement of air quality in the long term is still a challenge for China, especially in densely populated urban areas.
Shanghai, the leading city of the Yangzi River Delta (YRD), has a population of 25 million. Investigations focusing on air pollution have been extensively conducted in Shanghai, including chemical compositions of fine particles [6,7,8], particle size distribution [9,10,11], source apportionment [12,13,14], assessment of health risks [15,16,17], impact of COVID-19 on air quality [18,19,20], etc. The air pollution characteristics of different functional areas in Shanghai could be significantly different [21,22]. Thus, a study focusing on the characteristics of air pollution in different functional areas based on updated data in mega cities is still desirable, and it helps to provide a scientific basis for accurate strategy of further air quality improvement.
In the present work, the characteristics of air pollution in three different functional areas, representative of urban, suburban, and rural areas in Shanghai, were explored based on the latest three-year dataset. The primary pollutants determining the air quality of different functional areas were compared. Temporal variation (monthly, daily and weekdays verse weekends) of atmospheric particulate matters and trace gases were discussed. The impacts of regional pollution transportation were explored using a potential source contribution function method. Different types of pollution cases are discussed in depth. This study tracked the latest characteristics of air pollution, and provided reference for the prevention and control of air pollution in Shanghai.

2. Methods

2.1. Site Description

Three typical sites located at Qingpu (QP) District, Xuhui (XH) District and Chongming (CM) District in Shanghai were selected, which were representative of suburban, urban, and rural areas, respectively (Figure 1). The suburbs and urban areas of Shanghai are divided by the outer ring road (Figure 1). QP District, located at the westernmost end of Shanghai, is the only administrative region in Shanghai that borders Jiangsu Province in the west and Zhejiang Province in the south. Due to its unique geographical location, QP is positioned as the hub of the integrated development of the Yangtze River Delta. The detailed location of the suburban site labeled QP was at the Dianshanhu supersite (31.09° N, 120.98° E) [23]. The urban site labelled XH was a national automatic air quality monitoring station (121.41° E, 31.17° N), which was located on the rooftop of a six-floor building in Shanghai Normal University. This is a typical mixed area of commercial and residential areas affected by traffic emission. The rural site (121.41° E, 31.17° N) labelled CM was surrounded by large farmland and ecological parks.

2.2. Data

Daily concentration of PM2.5, PM10, SO2, NO2, CO, O3, and information on the primary pollutant that determines the daily air quality in XH, QP and CM from 2019 to 2021 were obtained from Shanghai Municipal Bureau of Ecology and Environment (https://sthj.sh.gov.cn/ (accessed on 1 March 2022)). Hourly concentrations of the six parameters in the three stations were sourced from China National Environment Monitoring Center (http://www.cnemc.cn/) by real-time acquisition. QP station ceased to be a national automatic air quality monitoring station and has not publicly released real-time hourly air quality data since 2021. Thus, hourly concentration of the six parameters of QP station in 2021 was provided by Shanghai Environment Monitoring Center. Information about the instruments of monitoring particulate matters and trace gases employed in the QP station can be found in our previous study [25]. Hourly air quality data from the CM station were obtained in 2021. A summary of the dataset used in this study was listed in Table 1.

2.3. Backward Trajectory Calculation

The 72 h backward trajectories and clusters were calculated using MeteoInfo software (http://www.meteothink.org/ (accessed on 1 January 2022)), which was developed for meteorological data visualization and analysis [26]. Archived meteorological data for trajectory calculation were downloaded from the Global Data Assimilation System (GDAS1) of the US National Oceanic and Atmospheric Administration (NOAA) (ftp://arlftp.arlhq.noaa.gov/pub/archives/gdas1 (accessed on 1 January 2022)). Backward trajectories arrival height in HYSPLIT was set at 500 m above the surface, which is applicable for considerations of both the long-range transport and transport in the planetary boundary layer [27]. In this study, hourly backward trajectories were calculated at the starting location of XH site, as the three sites showed similar trajectories pathway patterns. Angular distance was chosen for trajectories clustering in the HYSPLIT model [27,28].

2.4. Potential Source Contribution Function (PSCF) Analysis

The PSCF method has been widely applied to investigate the potential source areas of a receptor site by associating the measured concentration of pollutants and backward trajectory simulations at the receptor site [28,29,30]. The PSCF value of a grid (ij, latitude i and longitude j) is defined as follows:
PSCF = m ij n ij
where nij is the total number of trajectory endpoints falling in the grid(i,j), and mij is the number of trajectory endpoints corresponding to the concentration of the targeted pollutant at the receptor site exceeding a reference value when air masses pass through the grid(i,j). A detailed description of PSCF can be found in our previous studies [30,31].
HYSPLIT backward trajectories were utilized to perform PSCF analysis. To obtain seasonal variation, the seasonal average concentrations of each pollutant were set as the criteria for PM2.5, PM10, O3 and NO2 in XH site, Shanghai, from 2019 to 2021. In the study, the principle of setting the PSCF domain was based on the area which most backward trajectories covered, which extends from 20° N to 60° N and from 100° E to 135° E in 0.5 degree resolution. To reduce the uncertainties caused by small nij values, a weighting function Wij was utilized, as follows [29,30]:
W ij = 1.0 ,         n ave   n ij 0.75 ,       1 2   n ave     n ij < n ave                     0.5 ,       1 4   n ave n ij < 1 2 n ave 0.2 ,       0 n ij < 1 4 n ave
where nave is the average number of endpoints per grid, which is about 85 in this study. PSCF analysis was also performed using MeteoInfo software.

3. Results

3.1. Comparison of Primary Pollutants and Air Pollution Levels

The primary pollutant refers to the pollutant with the largest air quality sub-index when the air quality index is higher than 50. CO and SO2 have never been identified as the primary pollutants in Shanghai during 2019–2021 due to their low concentrations. The annual average concentration of SO2 in the three different functional areas was 5–6 μg/m3, which was much lower than the annual average concentration limit specified in the national ambient air quality standard (GB3095-2012, 60 μg/m3). Daily CO in XH, QP and CM ranged from 0.2 to 1.5 mg/m3, 0.3 to 1.4 mg/m3, and 0.1 to 1.3 mg/m3, respectively, which satisfied the daily limit specified in the national ambient air quality standard (4 mg/m3).
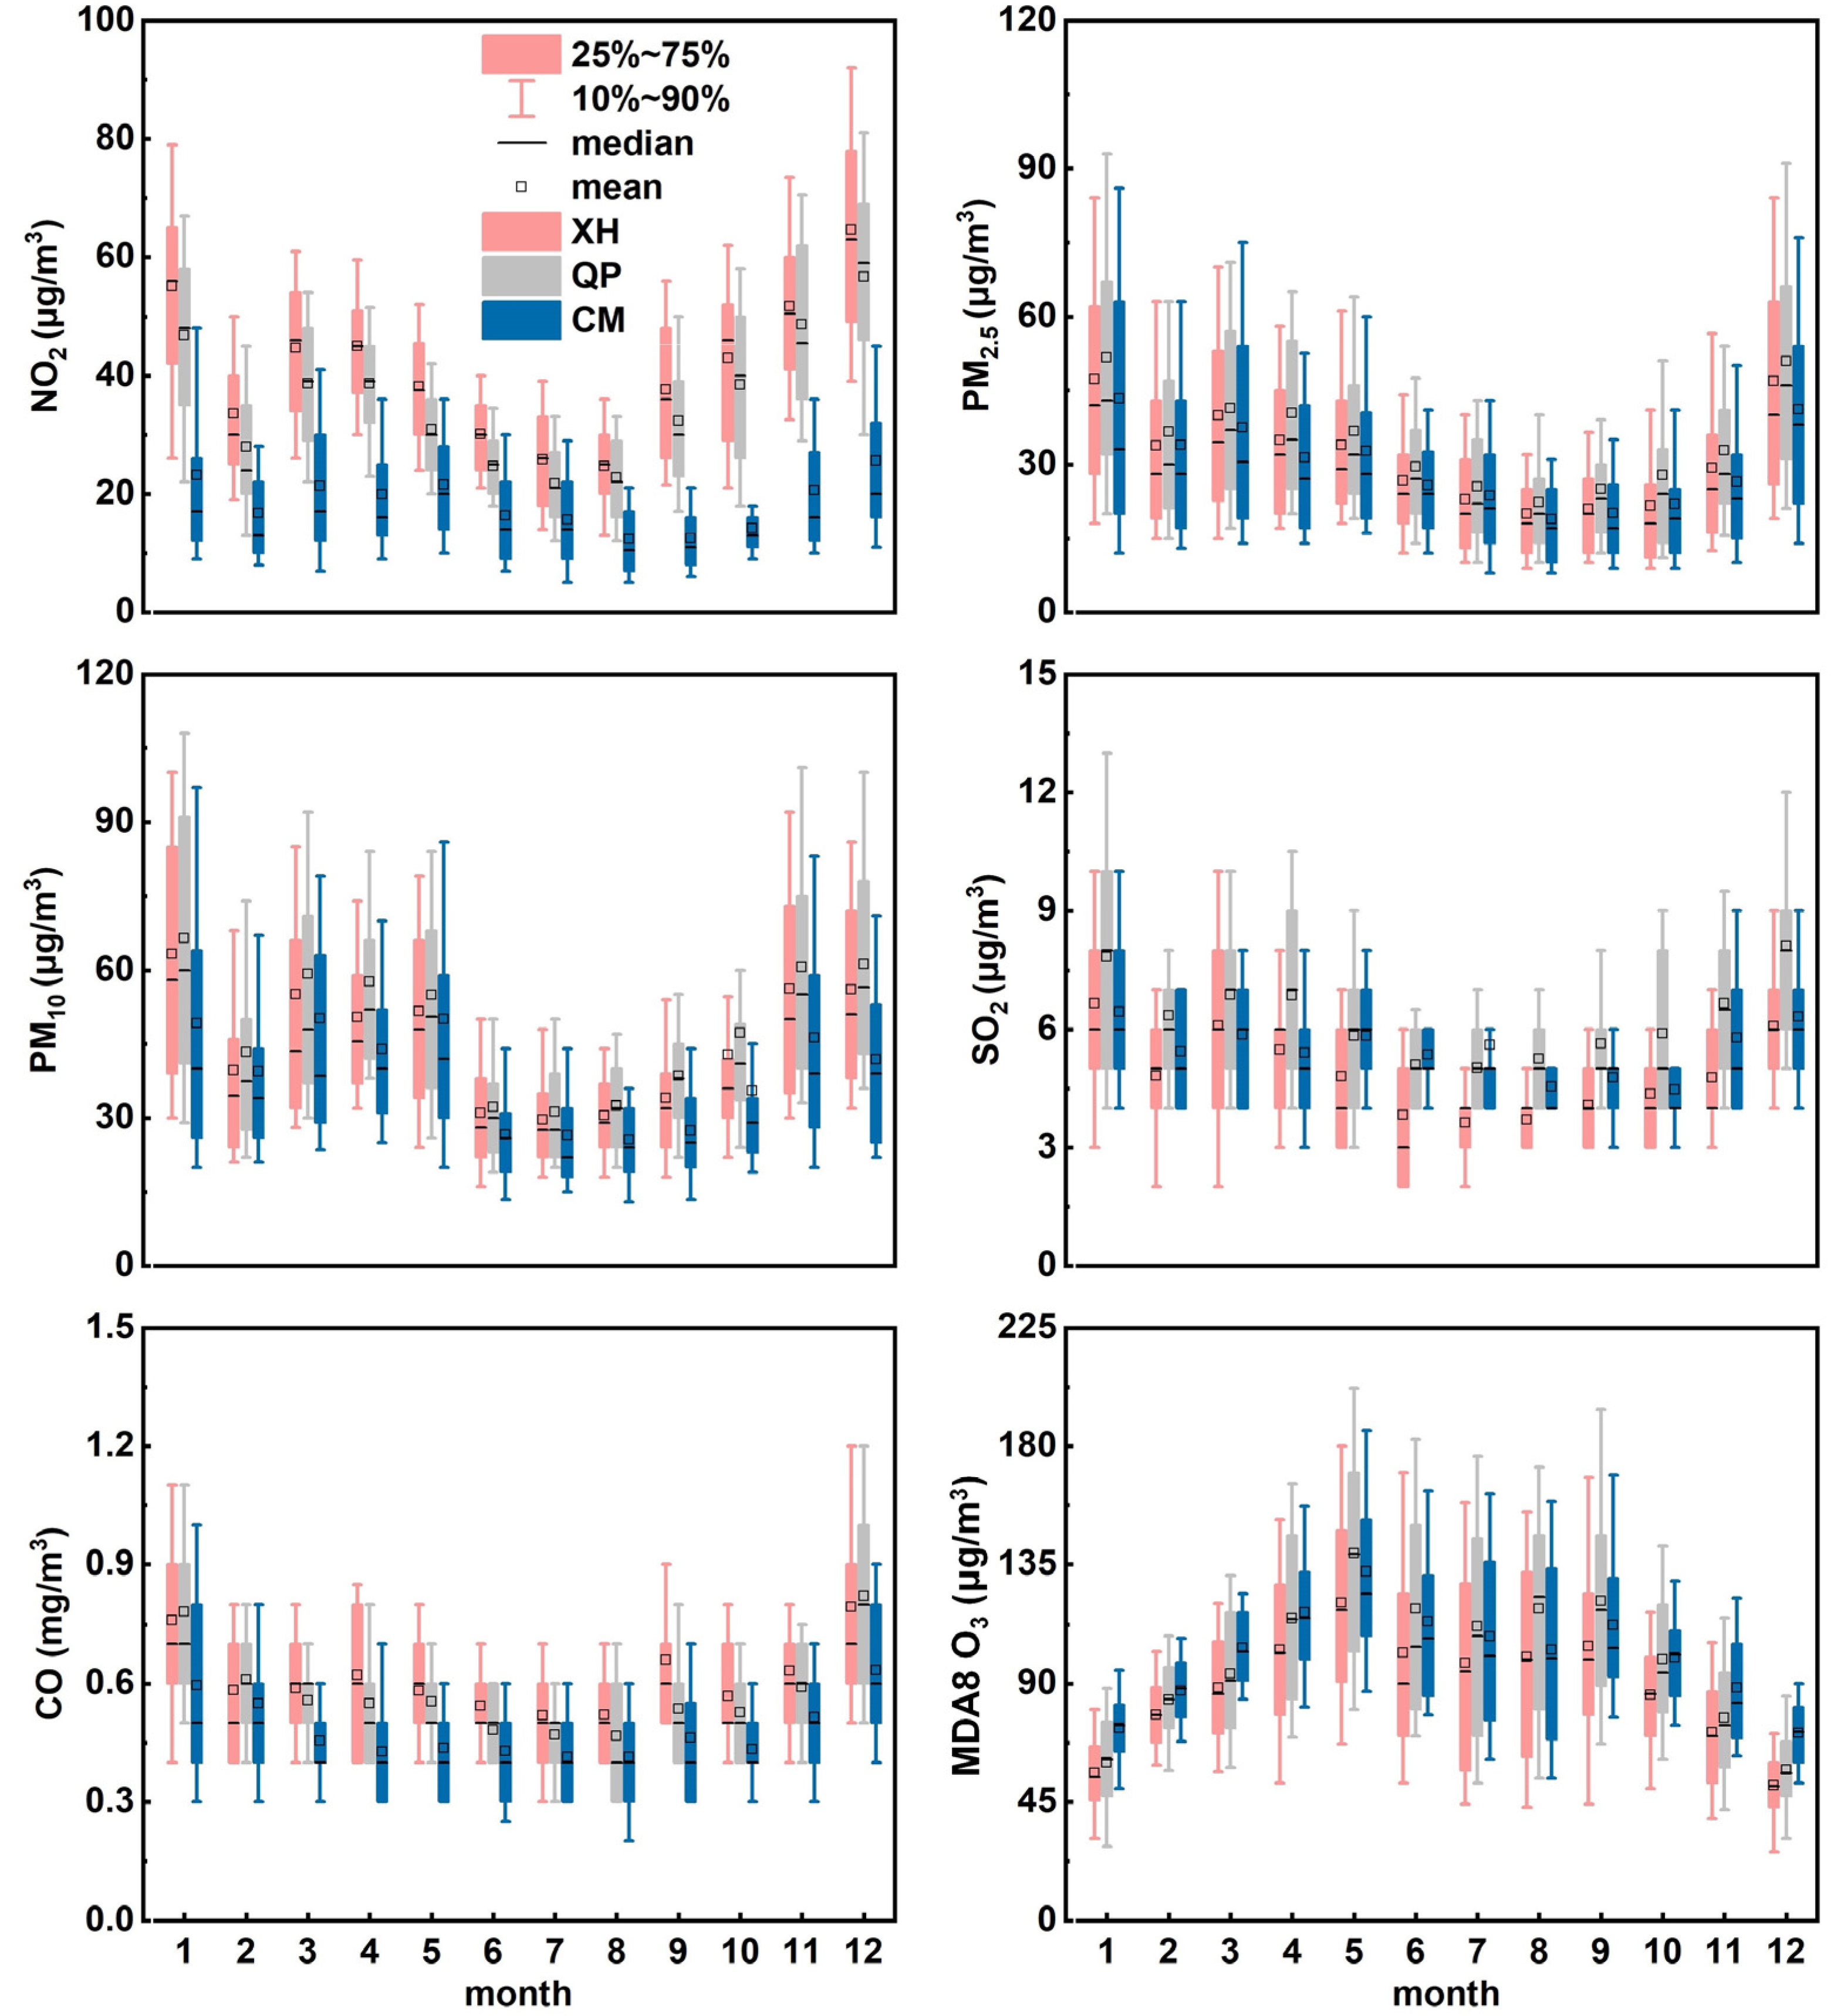
Frequencies of PM2.5, PM10, NO2 and O3 as primary pollutants in urban, suburban, and rural areas in Shanghai during 2019–2021 were summarized in Table 2. From urban area XH to rural area CM, the frequency of NO2 as the primary pollutant significantly dropped from 41% to 3%, which was consistent with the rural area in Shanghai being less affected by vehicular emissions. The annual concentration of NO2 in urban XH, suburban QP and rural CM was 41 (daily minimum–maximum: 3–120) μg/m3, 36 (4–108) μg/m3, and 18 (1–92) μg/m3, respectively. On the other hand, the frequency of O3 as the primary pollutant increased from 40% to 71%, from urban area XH to rural area CM. MDA 8 h O3 (maximum daily 8 h average concentration of O3) ranged from 13 μg/m3 to 276 μg/m3 in CM, from 14 μg/m3 to 261 μg/m3 in QP, and from 8 μg/m3 to 253 μg/m3 in XH. A weakened titration effect of NO on O3 (NO + O3→NO2 + O2) probably resulted in higher O3 concentration in rural areas [32]. The frequencies of PM2.5 as the primary pollutant were comparable, which were 14% in XH, 21% in QP and 20% in CM. Annual PM2.5 levels were similar in the three different functional areas, which were 31 (3–161) μg/m3 for XH, 35 (4–162) μg/m3 for QP and 30 (2–149) μg/m3 for CM. The frequencies of PM10 as the primary pollutant were low in the three areas in Shanghai, only 5–6%. The highest daily PM10 was observed during a dust storm event that occurred on 30 March 2021, with PM10 ranging from 284 μg/m3 to 316 μg/m3 in the three distinctive functional areas. It should be pointed out that QP, classified as suburban area, is located at the junction of Jiangsu Province, Zhejiang Province and Shanghai. Affected by multi-source emissions, the pollution characteristics of QP are more complicated. In summary, O3, instead of PM2.5, has become the most significant pollutant affecting air quality in Shanghai.
Monthly variations of NO2, PM2.5, PM10, SO2, CO and MDA 8 h O3 (maximum daily 8 h average concentration of O3) in the different functional areas in Shanghai were shown in Figure 2. The urban site XH was characterized by the highest NO2 level. The annual NO2 concentration in XH was 41 μg/m3, with monthly NO2 ranging from 25 μg/m3 in August to 65 μg/m3 in December. Compared with the rural site, MDA 8 h O3 was relatively lower (12%) in XH, which was consistent with a previous study in cities in Europe and the USA [33]. The suburban site QP was characterized by the highest PM2.5, PM10, SO2 and MDA 8 h O3 in the warm season among the three sites. An elevated level of MDA 8 h O3 in QP was observed from May to September, with the highest monthly average MDA 8 h O3 (139 μg/m3) observed in May. Similar temporal variations of MDA 8 h O3 were observed in XH and CM. Compared with XH and CM, air pollution in QP is more prominent, which was easily affected by the transport of pollutants from Zhejiang and Jiangsu [34,35]. The rural site CM was characterized by relatively lower NO2 and CO and higher MDA 8 h O3 levels in the cold season, which was less directly affected by traffic emissions. In summary, the atmospheric pollution characteristics of urban, suburban and rural areas in Shanghai are significantly different. Refined and precise measures should be taken according to local conditions to further improve the air quality in Shanghai.

3.2. Weekday–Weekend Effect

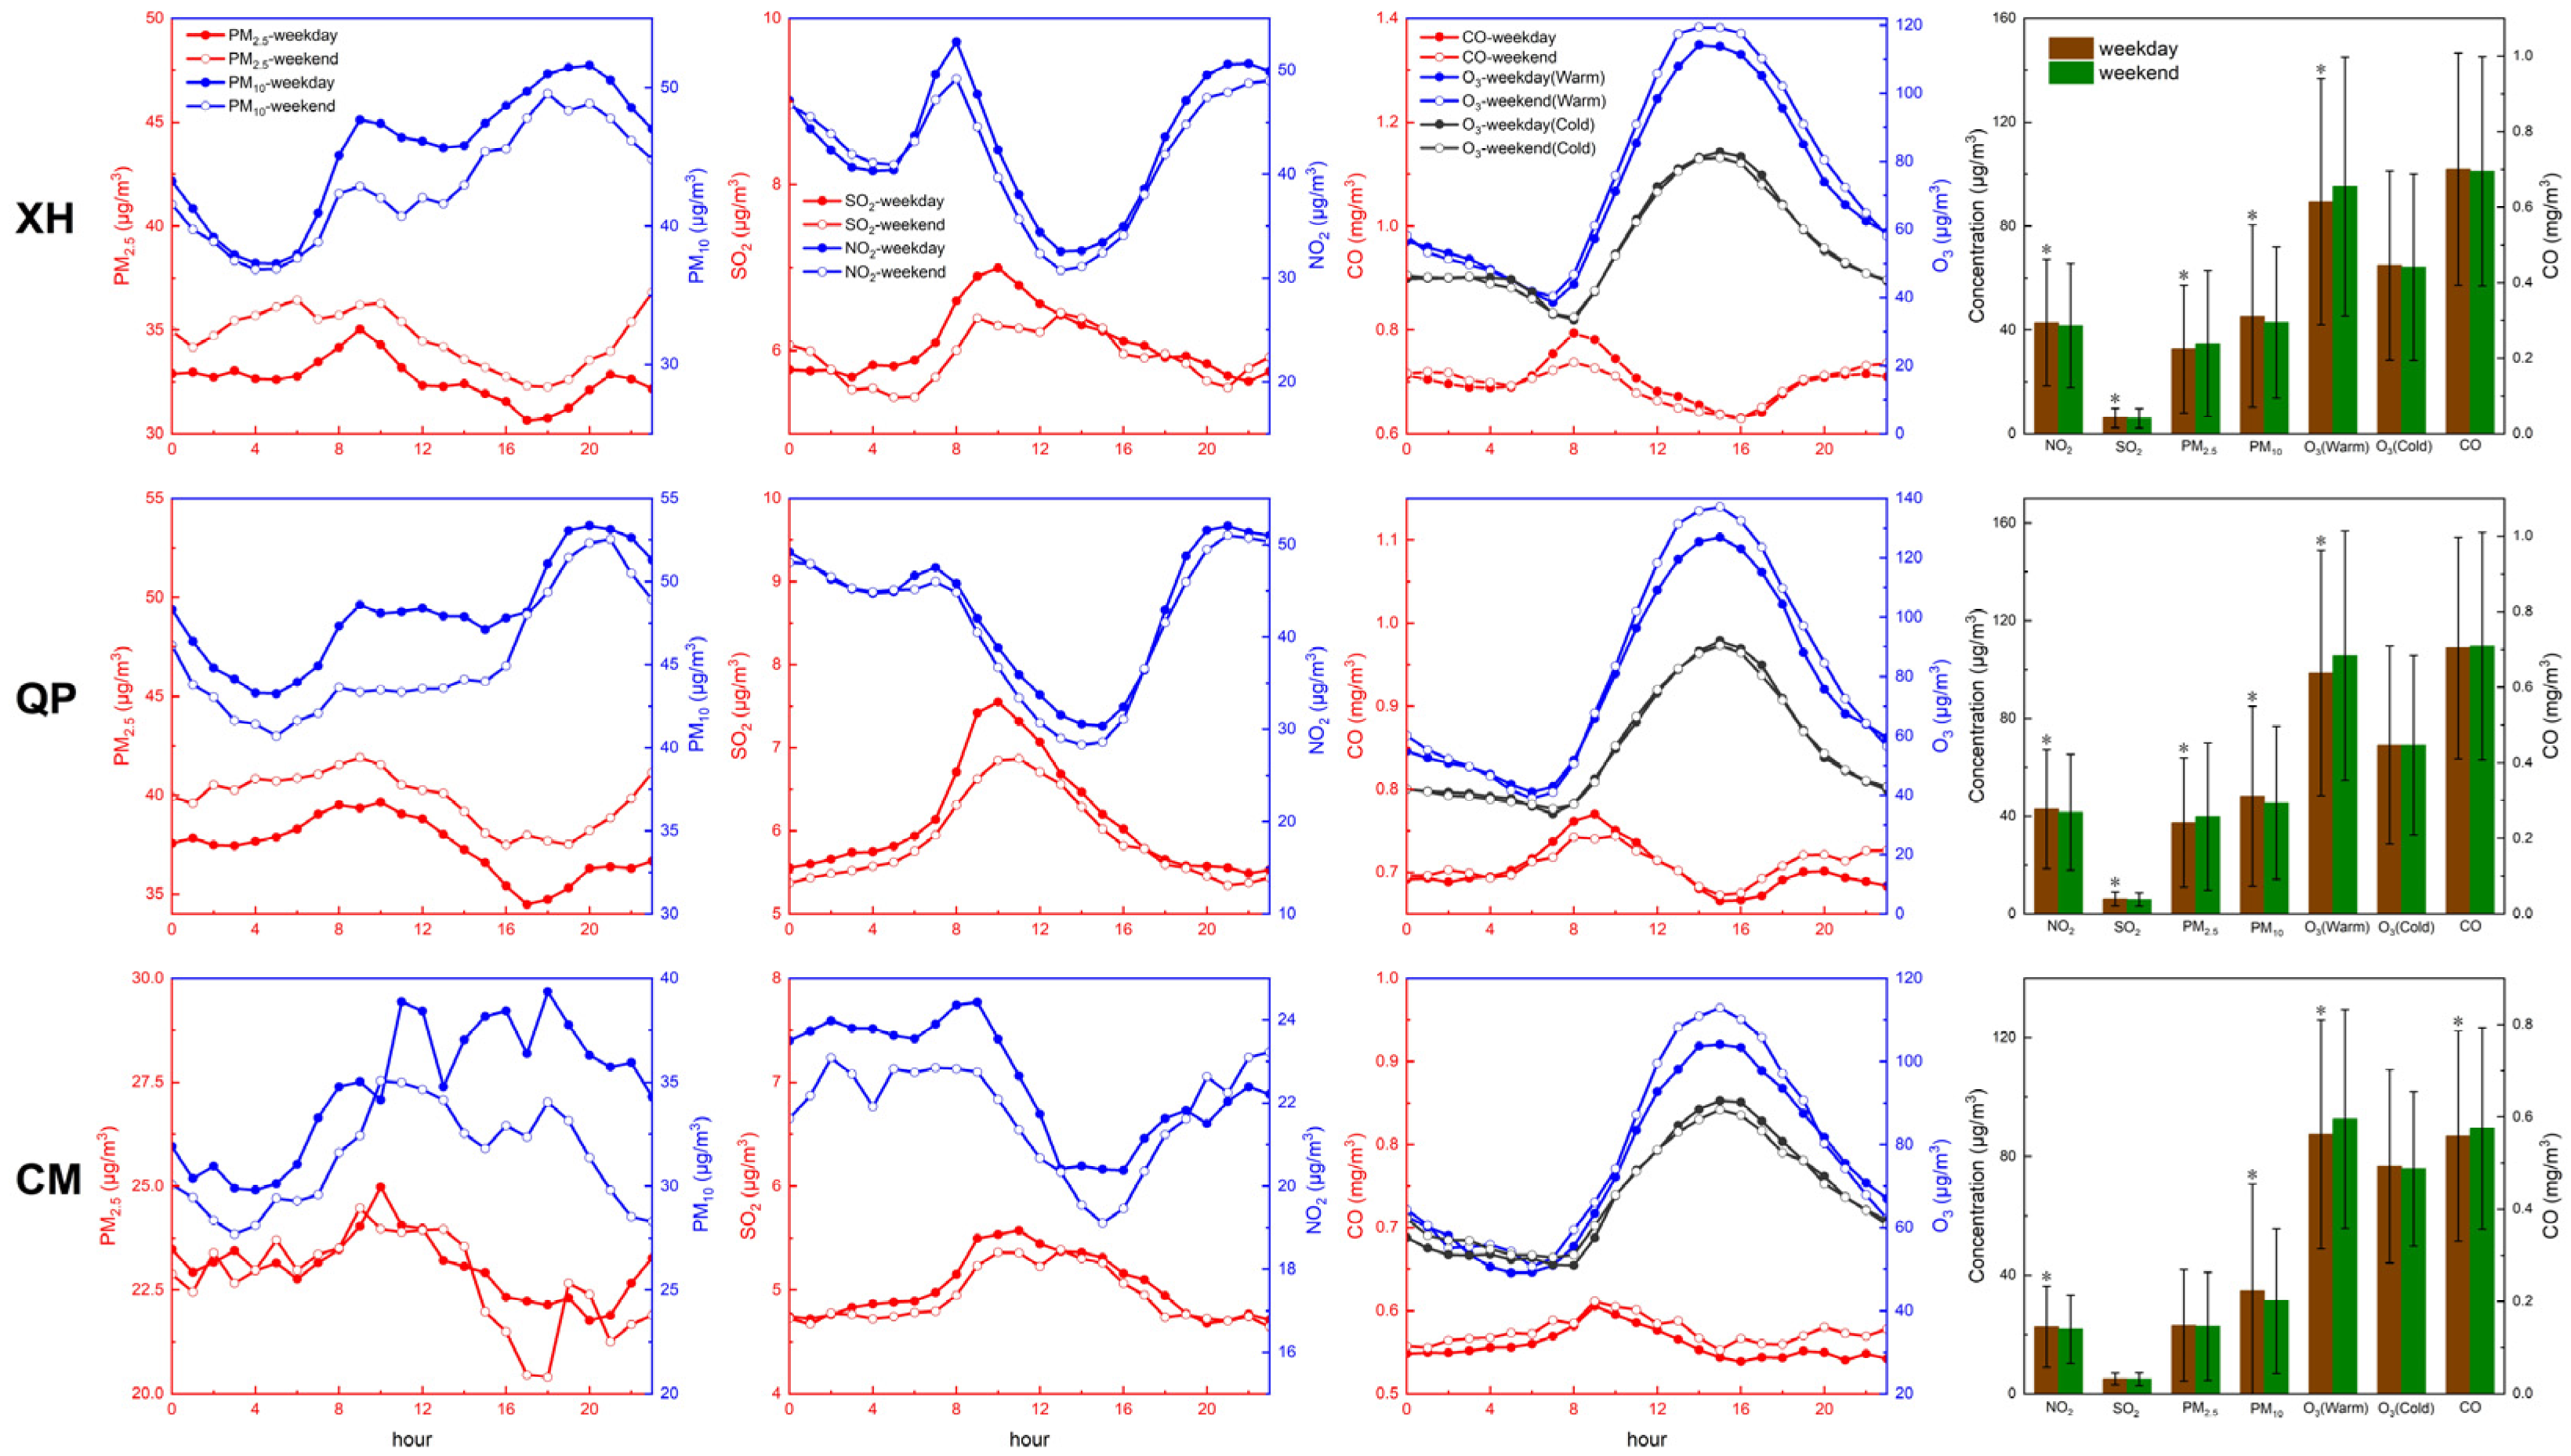
To investigate the response of air pollution to human activities, comparisons of pollutants between weekdays and weekends in the three different functional areas were made, as illustrated in Figure 3. NO2 was significantly higher on weekdays than at weekends in the three sites. Concentrations of NO2 and CO sharply increased during the morning rush hour in XH and QP. Concentrations of NO2 and CO on weekdays were higher than those at weekends during the morning rush hour, and this phenomenon is more noticeable in XH when compared with QP, which agreed with the theory that XH was most affected by traffic emissions [36]. The concentration of SO2 in the daytime on weekdays was higher than that at weekends, which was consistent with higher SO2 emissions from coal-fired power plants in the daytime on weekdays than those at weekends due to the higher power generation in Shanghai [37]. However, the concentration of PM2.5 at weekends seems higher than that on weekdays in XH and QP. In CM, there were no significant differences in PM2.5 concentration between weekdays and weekends, which indicated that air pollution in CM is mainly affected by regional transport, probably from Shanghai and Jiangsu [38]. PM10 presented a higher concentration in the daytime and continued to increase from 14:00, which was different from PM2.5. A clear weekend effect of PM10 was observed, indicating that a resuspension of road and construction dust was the main source of PM10 in Shanghai.
O3 is a product of photochemistry. Thus, variations of O3 were discussed in the warm season and the cold season. In the three areas, O3 at weekends was significantly higher than that on weekdays during the warm season, whereas there existed no significant difference between O3 on weekdays and at weekends in the cold season. The elevated O3 concentration at weekends in the warm season was associated with the combined effect of meteorological conditions (e.g., higher temperature and stronger solar radiation) favorable for O3 production and the weakened NO titration effect [39,40]. In summary, NO2 and SO2 presented a clear weekend effect, whereas PM2.5 at weekends seems higher than that on weekdays in urban and suburban areas. Warm-season O3 at weekends was higher than that on weekdays. A comparison of pollutants on weekdays and at weekends indicated a complex nonlinear relationship between the primary pollutants and the secondary pollutants.

3.3. Impact of Regional Transportation and Potential Source Areas

The lifetime of NO2 ranges from a few hours to days [41], and O3’s lifetime ranges from several days to weeks [42] and, thus, can be transported from one place to another. Regional and inter-regional transport plays an important role in air pollution [43,44,45,46,47]. The urban site XH, located in the middle Shanghai, was selected as the start source for backward trajectory clustering analysis. Seasonal cluster-mean backward-trajectories and average concentrations of pollutants corresponding to each cluster in Shanghai were shown in Figure 4. In spring, Cluster 1 (red, 12.11%) indicated trajectories carrying polluted air masses with the highest concentrations of all pollutants (50 μg/m3 of NO2, 53 μg/m3 of PM2.5, 93 μg/m3 of O3, and 78 μg/m3 of PM10), followed by Cluster 4 (blue, 16.70%). Cluster 1 represented the air mass trajectory of long-range transportation (inter-regional), which started from Inner Mongolia in the North China Plain. Cluster 4 represented the air mass trajectory of short-range transportation (intra-regional), which started from Jiangxi Province in Eastern China. In summer, Cluster 1 (blue) and Cluster 4 (purple) were polluted trajectories which accounted for 41.26%. Cluster 1 (blue, 29.95%) originated from Guangdong Province in the Pearl River Delta, which indicated the transregional transport of pollutants. Cluster 4 (purple, 11.31%), representative of short-range transportation within the Yangtze River Delta (intra-regional), brought the highest concentration of pollutants in summer. In autumn, air masses in Cluster 4 (purple, 11.70%) brought the highest concentration of PM2.5 (44 μg/m3), PM10 (73 μg/m3) and NO2 (55 μg/m3) through long distance transport, whereas Cluster 3 (yellow, 9.38%), brought the highest concentration of O3 (84 μg/m3) by short distance transport within the Yangtze River Delta. The contribution of inter-regional transport on O3 levels over the YRD region in summer had been estimated to be 20–44% [48]. In winter, the four clusters of trajectories were from long-range transport. Cluster 1 (red, 23.94%) brought the highest concentration of PM2.5 (65 μg/m3), PM10 (71 μg/m3) and NO2 (69 μg/m3), whereas Cluster 2 (purple, 26.37%) brought the highest concentration of O3 (54 μg/m3).
To further identify the probable geographic origin of emission sources, a PSCF analysis of the primary pollutants (NO2, PM2.5, PM10 and O3) in Shanghai was calculated, as depicted in Figure 5. The distribution of higher PSCF values of PM2.5 and PM10 were similar, which mainly included the Yangtze River Delta and its neighboring areas (intra-regional) in all seasons except summer. In summer, PM2.5 and PM10 were influenced by inter-regional (North China Plain and the Pearl River Delta) pollution transport. Compared to particulate matter, the potential source areas of NO2 were reduced, indicating that NO2 was mainly from local motor vehicle emissions in Shanghai and less affected by regional transport. The Bohai Sea Economic Region in China, North and South Korea was identified as the main potential source area of O3 in Shanghai during all seasons. The Bohai Sea Economic Region in China, characterized by industrial agglomeration, has a significant impact on regional haze pollution [49]. It is obvious that the potential source areas with high PSCF value for O3 were different from that of PM2.5, which poses challenges to the coordinated control of PM2.5 and O3 in Shanghai.

3.4. Case Study of Typical Pollution Events

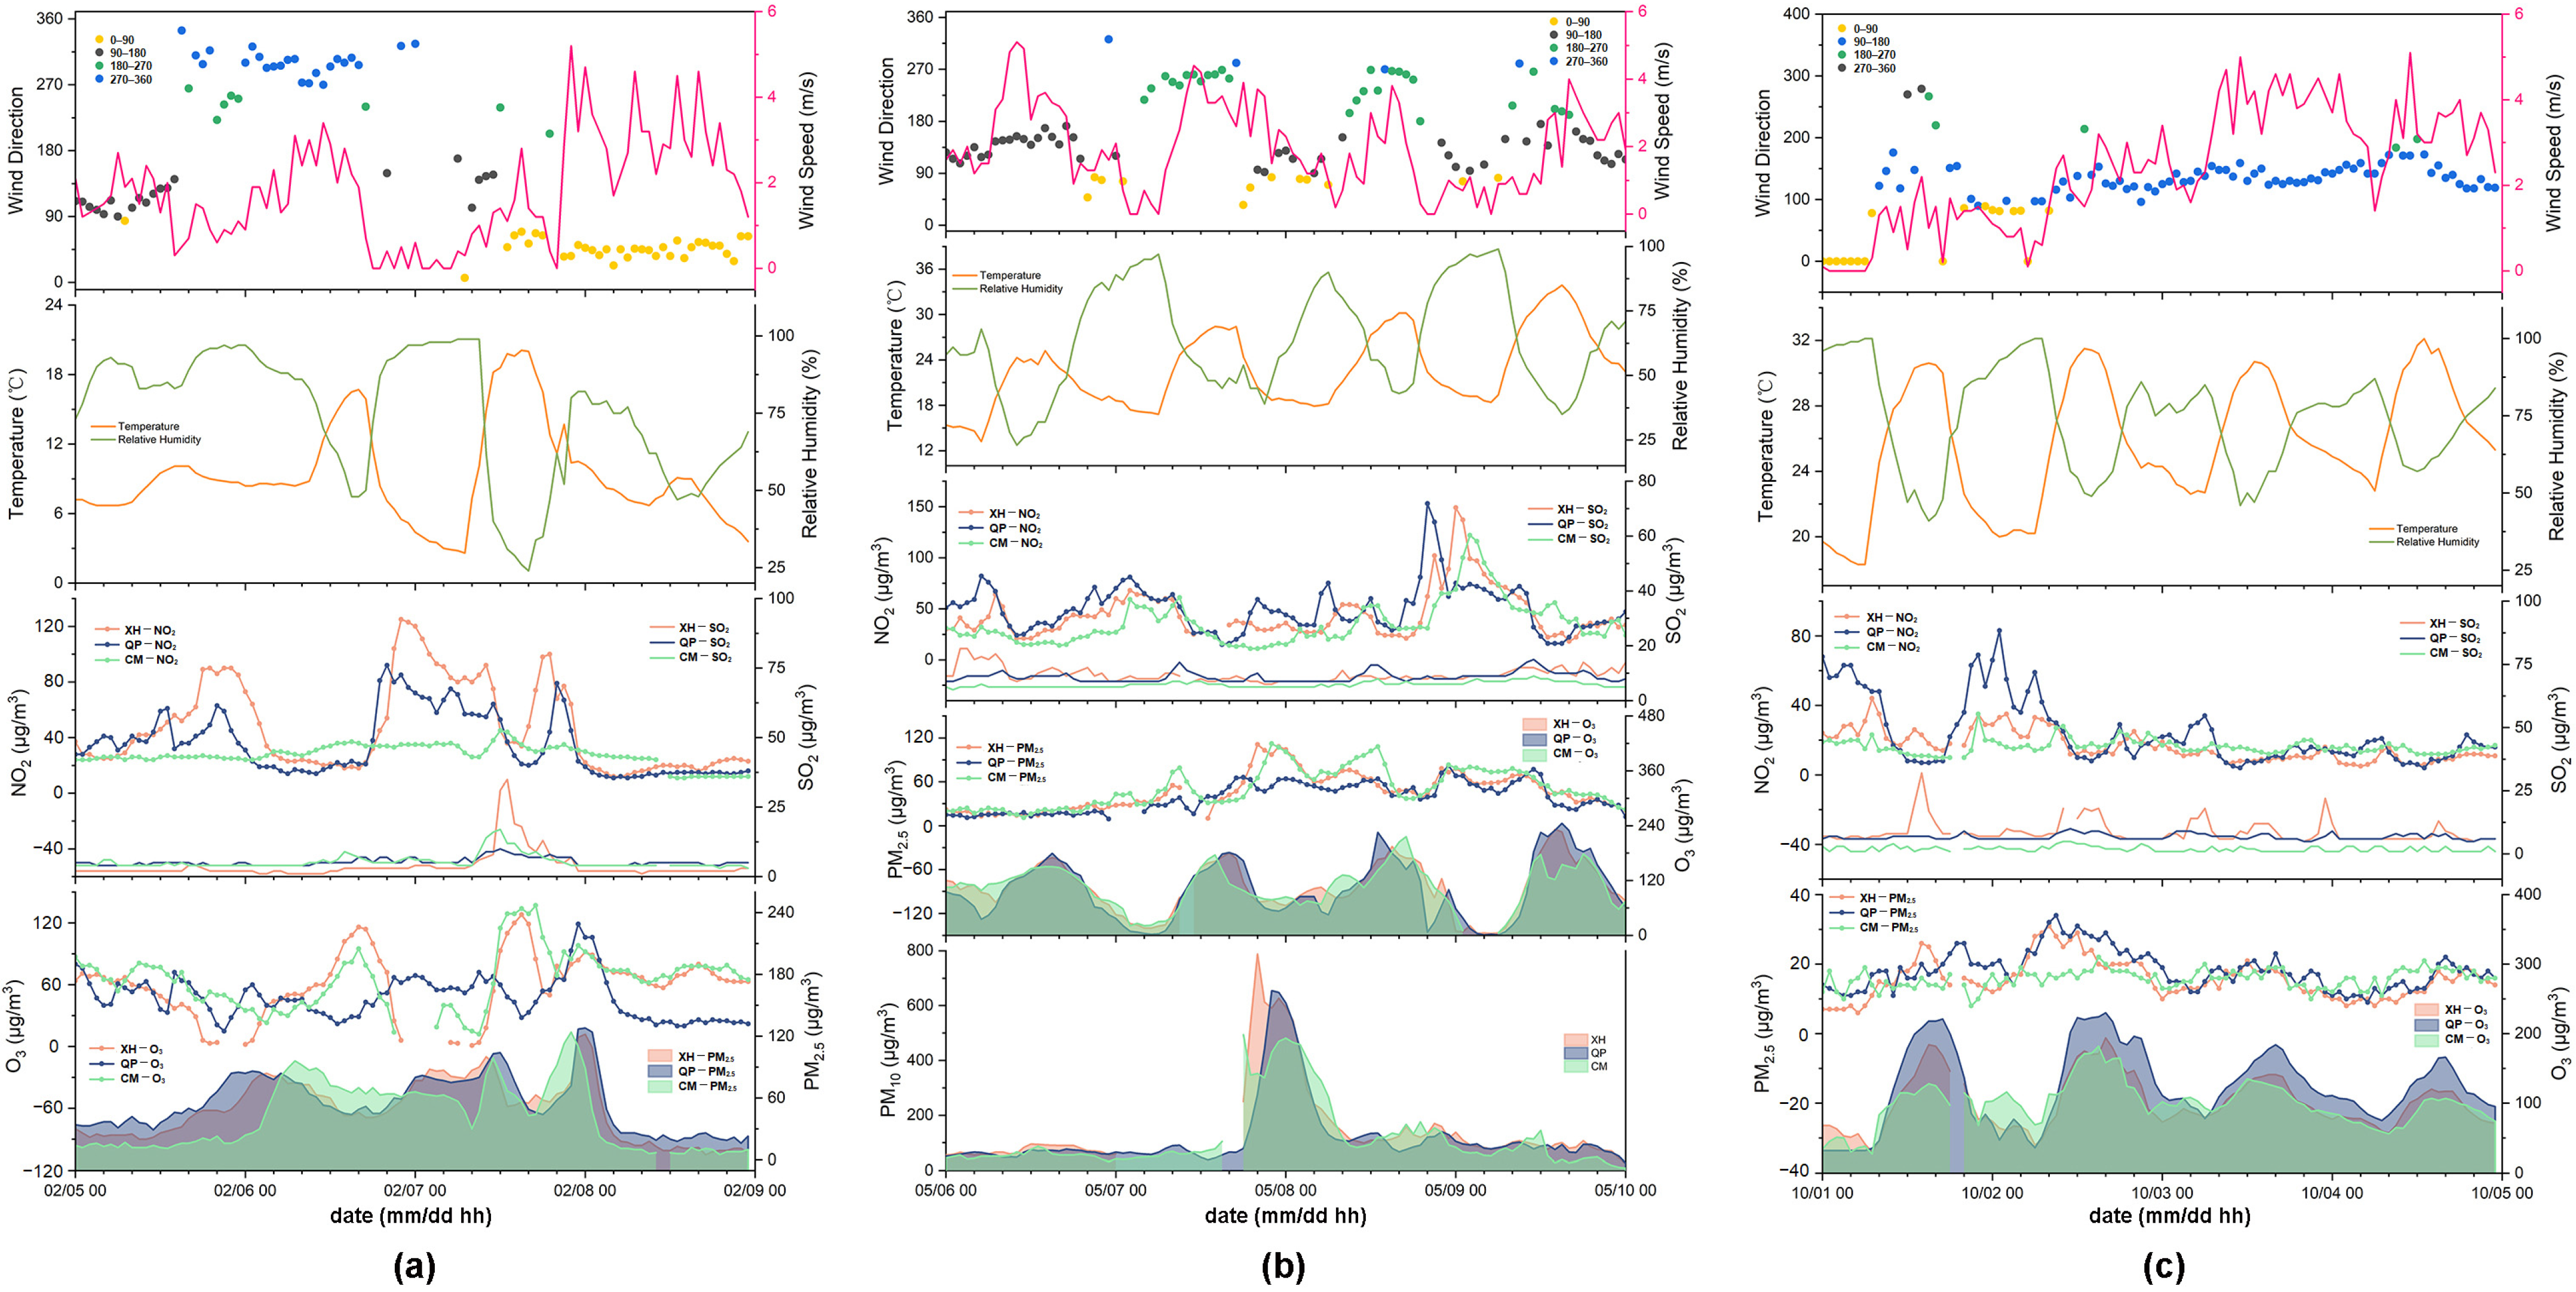
To investigate the formation mechanism of the pollution process, three types of pollution events of the three sites in 2021 are presented in Figure 6 and Figure S1. PM2.5 pollution events occurred on 5–8 February, 10 December, and 30 December, respectively. Dust storm events, characterized by extremely high PM10, occurred on 30–31 March and 7–8 May, respectively. O3 pollution events occurred on 22–23 September and 1–4 October, respectively. A pollution event was defined as a daily concentration of pollutants (e.g., PM2.5, PM10, and O3) in the three sites simultaneously exceeding the national ambient air quality standard (GB 3095-2012) Grade II, which was 75 μg/m3 for PM2.5, 150 μg/m3 for PM10 and 160 μg/m3 for MDA 8 h O3.
The three PM2.5 pollution events were observed in winter. From Figure 6a, PM2.5 started to increase (the accumulation process of PM2.5) at the QP site, then the XH site, and finally at the CM site on 5 February, indicating the impact of pollution transport from west to east during this pollution case. Trajectory cluster analysis showed that pollutants were transported from the northwest (cluster 1) with the highest PM2.5 concentration of 68.64 μg/m3 (Figure S2a). Coal-fired heating in the North China Plain may contribute to PM2.5 levels in Shanghai in winter [50]. On the other hand, PM2.5 began to decrease (the removal process of PM2.5) at the CM site, then the XH site, and finally the QP site on 8 February, which was caused by the long-range transport of clean air masses with PM2.5 ranging from 10 μg/m3 to 20 μg/m3 from the northeast (Figure S2b). The wind direction changed during the pollution episode, from northwest wind to northeast wind (Figure 6a), which agreed well with the trajectory analysis. However, there were no time sequence characteristics among the three sites during the PM2.5 pollution events observed on 10 December (Figure S1a) and 30 December (Figure S1b). In addition, a low wind speed and high relative humidity favored the accumulation and transformation of pollutants from local emissions. Notably, high concentrations of NO2 were observed during the three PM2.5 pollution events, and were consistent with the variations of PM2.5, which implied that nitrate was an important component of PM2.5 [12,14].
Two dust storm events affected Shanghai in spring, which were observed on 30–31 March (Figure S1c) and 7–8 May (Figure 6b), respectively. The results of trajectory clustering showed that Cluster 1 (black, 29.41%) originated from Mongolia, correspondeding to PM10 of 643 μg/m3 during the dust storm event which occurred on 7–8 May (Figure S3). Similarly, the average concentration of PM10 reached 473 μg/m3 of Cluster 2 (black, 40.74%), which represented long-range transport sourced from Mongolia during dust storm events which occurred on 30–31 March (Figure S4). Associated with the winter monsoon, Gobi dust has a larger influence on East Asia in spring [51]. In addition, O3 concentrations in Shanghai were also maintained at relatively high levels during dust storm events due to the influence of long-range transport.
Two O3 pollution episodes were observed in early autumn, as depicted in Figure 6c and Figure S1d. From Figure 6c, the highest MDA 8 h O3 was up to 216 μg/m3, which was observed at the suburban site, QP. Backward trajectory analysis indicated that O3 was influenced by air parcels transported from the Bohai Sea Economic Region in China and Korea (Figure S5). High night-time O3 was observed at the QP site from 22 September 22:00 to 23 September 22:00, with hourly O3 ranging from 118 μg/m3 to 163 μg/m3 (Figure S1d). MDA 8 h O3 grew at a rate of 5.61 μg/m3 per year in Shanghai during 2015–2019 [52], and the most elevated mean daily and MDA 8 h O3 concentrations occurred from mid-spring to early summer in Shanghai based on the long-term measurements from 2010 to 2019 [53]. In our study, the latest observation indicated that the occurrence of high MDA 8 h O3 extended to early autumn.

4. Discussion

O3 was identified as the most important pollutant determining air quality in Shanghai, which was consistent with the increasing trend of O3 in other Chinese mega cities. In a previous study conducted at the Pearl River Delta (PRD) region in southern China, surface ozone showed upward trends at the rate of 0.28–1.02 ppb yr−1 at urban sites from 2006 to 2019, which was attributed to the reduced NO titration effect [54]. Similarly, O3 concentrations exhibited obvious interannual increases in the Sichuan Basin, southwestern China during 2013–2019 [55]. O3 concentrations generally increased during 2014–2020, with a slower increasing rate after 2017, and the highest O3 concentrations primarily occurred during summer in northern China, and during autumn or spring in southern China [56]. Moreover, co-polluted days by ozone (O3) and PM2.5 were frequently observed in the Beijing–Tianjin–Hebei (BTH) region in the North China Plain in the warm seasons (April–October) of 2013–2020 [57]. In summary, O3 pollution, as well as PM2.5, has become the challenge of air pollution prevention and control in Chinese mega cities.
In the current work, O3 at weekends was significantly higher than that on weekdays during the warm season in the three different functional areas in Shanghai, whereas there exists no significant difference between O3 on weekdays and at weekends in the cold season. The results implied that only controlling emissions from motor vehicles is not effective for pollution control of O3 in Shanghai despite NO2 being a precursor of O3 formation. NOx and volatile organic compound (VOCs) are precursors of O3 [58]. However, the production of O3 in urban areas, characterized by high NOx/VOC ratios, is VOC-limited [42]. For example, O3 formation was simulated by the observation-based model in Shanghai in July 2017, and the results revealed that O3 formation at the urban site was controlled by VOCs [59]. Similar results were also reported in other Chinese mega cities [58,60]. An earlier study built an emission inventory for major anthropogenic air pollutants and VOC species in the YRD region for the year 2007, and found that the industrial sources contributed about 69% of the total VOC emissions, while vehicles only accounted for 12.4% of VOC emissions [61]. A recent study developed improved industrial VOCs emissions inventories for China from 2011 to 2018 and reported an increased trend of annual industrial VOCs emissions with an average annual growth rate of 5.2% [62]. An updated VOCs emission inventory at a regional scale was suggested as an emerging issue for future research, considering the significant influence of regional transport.
The present study has some limitations. Despite the long-term analysis of NO2 and O3, the study failed to produce in-depth analysis of the ozone formation mechanism due to a lack of data on the concentrations and composition of VOCs. Data on long-term ambient VOC compositions in different functional areas in Shanghai and other megacities are recommended for future studies.

5. Conclusions

In the study, characteristics of atmospheric pollution were discussed by analyzing daily and hourly concentrations of PM2.5, PM10, SO2, NO2, CO and O3 in three different functional areas which are representative of urban, suburban, and rural areas in Shanghai from 2019 to 2021. The frequency of O3 identified as the primary pollutant was 40% in the urban site, 51% in the suburban site, and 71% in the rural site in Shanghai, far higher than that of PM2.5 (14–21%). The frequency of NO2 as the primary pollutant was 41% in the urban site and 23% in the suburban site. NO2 and SO2 presented a clear weekend effect, whereas PM2.5 at weekends seems higher than that on weekdays in urban and suburban areas. In the warm season, O3 at weekends was higher than that on weekdays in the three sites. However, no significant difference was observed between O3 on weekdays and at weekends in the cold season. Different temporal variations of O3 in the warm and the cold seasons not only resulted from the weakened NO titration effect, but were also related to meteorological conditions. A comparison of variations of pollutants on weekdays and at weekends indicated complex nonlinear relationship between primary pollutants and secondary pollutants. Inter-regional and intra-regional transport played an important role in the pollution process in Shanghai. Potential source areas of PM2.5 in Shanghai mainly included the Yangtze River Delta region and its surrounding areas, whereas the Bohai Sea Economic Region in China, North and South Korea was identified as the main potential source area of O3 during all seasons. Different source areas of PM2.5 and O3 brought challenges to the coordinated control of PM2.5 and O3 in Shanghai.

Supplementary Materials

The following supporting information can be downloaded at: https://www.mdpi.com/article/10.3390/su15032429/s1, Figure S1: Time series of pollutants and meteorological parameters during (a) PM10 pollution process (b) O3 pollution process (c–d) PM2.5 pollution process in Shanghai, 2021; Figure S2: Trajectory clustering and average concentration of pollutants corresponding to each cluster of trajectories during (a) accumulation process of PM2.5 pollution and (b) removal process of PM2.5 pollution during 5–8 February 2021; Figure S3: Trajectory clustering and average concentration of pollutants corresponding to each cluster of trajectories during the typical PM10 pollution process on 7–8 May 2021; Figure S4: Trajectory clustering and average concentration of pollutants corresponding to each cluster of trajectories during the typical PM10 pollution process observed during 30–31 March 2021; Figure S5: Trajectory clustering and average concentration of pollutants corresponding to each cluster of trajectories during the typical O3 pollution process on 1–4 October 2021.

Author Contributions

J.Y.: data curation, software, visualization, writing—original draft. X.F.: data curation, software, visualization. L.Q.: resources, writing—review and editing. L.Y.: writing—review and editing, supervision, funding acquisition, and project administration. F.Z.: software, writing—review and editing. W.L.: writing—review and editing. All authors have read and agreed to the published version of the manuscript.

Funding

This work was supported by the National Natural Science Foundation of China (No. 42005089), the State Environmental Protection Key Laboratory of Formation and Prevention of Urban Air Pollution Complex (NO. 2021080539), and the Opening Project of Shanghai Key Laboratory of Atmospheric Particle Pollution and Prevention (LAP3) (NO. FDLAP20007).

Institutional Review Board Statement

Not applicable.

Informed Consent Statement

Not applicable.

Data Availability Statement

Data are available on reasonable request from the corresponding author.

Acknowledgments

Great appreciation to the Shanghai Environment Monitoring Center for providing data of hourly PM2.5, PM10, SO2, NO2, CO and O3 concentrations at the QP site in Shanghai during 2021. The free software, MeteoInfo, is developed by Yaqiang Wang, Chinese Academy of Meteorological Sciences.

Conflicts of Interest

The authors declare no conflict of interest.

References

  1. Liao, H.; Gao, Y.; Chen, D.; Dai, H.; Du, N.; Fang, L.; Kang, L.; Qian, J.; Qin, Z.; Wang, Y.; et al. Assessment of air quality-climate interactions in IPCC AR6. Trans. Atmos. Sci. 2021, 44, 658–666. (In Chinese) [Google Scholar]
  2. Health Effects Institute. State of Global Air 2019. Special Report; Health Effects Institute: Boston, MA, USA, 2019. [Google Scholar]
  3. Zhu, T.; Wan, W.; Liu, J.; Xue, T.; Gong, J.; Zhang, S. Insights into the new WHO Global Air Quality Guidelines. Chin. Sci. Bull. 2022, 67, 697–706. (In Chinese) [Google Scholar] [CrossRef]
  4. WHO. WHO Global Air Quality Guidelines: Particulate Matter (PM2.5 and PM10), Ozone, Nitrogen Dioxide, Sulfur Dioxide and Carbon Monoxide; WHO: Geneva, Switzerland, 2021.
  5. Szopa, S.; Naik, V.; Adhikary, B.; Artaxo, P.; Berntsen, T.; Collins, W.D.; Fuzzi, S.; Gallardo, L.; Kiendler-Scharr, A.; Klimont, Z.; et al. Short-Lived Climate Forcers. In Climite Change 2021: The Physical Science Basis. Contribution of Working Group I to the Sixth Assessment Report of the Intergovernmental Panel on Climate Change; Cambridge University Press: Cambridge, UK; New York, NY, USA, 2021; pp. 817–922. [Google Scholar]
  6. Ye, B.; Ji, X.; Yang, H.; Yao, X.; Chan, C.K.; Cadle, S.H.; Chan, T.; Mulawa, P.A. Concentration and chemical composition of PM2.5 in Shanghai for a 1-year period. Atmos. Environ. 2003, 37, 499–510. [Google Scholar] [CrossRef]
  7. Wang, H.L.; Qiao, L.P.; Lou, S.R.; Zhou, M.; Ding, A.J.; Huang, H.Y.; Chen, J.M.; Wang, Q.; Tao, S.K.; Chen, C.H.; et al. Chemical composition of PM2.5 and meteorological impact among three years in urban Shanghai, China. J. Clean. Prod. 2016, 112, 1302–1311. [Google Scholar] [CrossRef]
  8. Guo, L.; Hu, Y.; Hu, Q.; Lin, J.; Li, C.; Chen, J.; Li, L.; Fu, H. Characteristics and chemical compositions of particulate matter collected at the selected metro stations of Shanghai, China. Sci. Total Environ. 2014, 496, 443–452. [Google Scholar] [CrossRef]
  9. Wang, X.; Chen, J.; Cheng, T.; Zhang, R.; Wang, X. Particle number concentration, size distribution and chemical composition during haze and photochemical smog episodes in Shanghai. J. Environ. Sci. 2014, 26, 1894–1902. [Google Scholar] [CrossRef]
  10. Ling, Y.; Wang, Y.; Duan, J.; Xie, X.; Liu, Y.; Peng, Y.; Qiao, L.; Cheng, T.; Lou, S.; Wang, H.; et al. Long-term aerosol size distributions and the potential role of volatile organic compounds (VOCs) in new particle formation events in Shanghai. Atmos. Environ. 2019, 202, 345–356. [Google Scholar] [CrossRef]
  11. Zhang, K.; Wang, D.; Bian, Q.; Duan, Y.; Zhao, M.; Fei, D.; Xiu, G.; Fu, Q. Tethered balloon-based particle number concentration, and size distribution vertical profiles within the lower troposphere of Shanghai. Atmos. Environ. 2017, 154, 141–150. [Google Scholar] [CrossRef]
  12. Wang, Q.; Qiao, L.; Zhou, M.; Zhu, S.; Griffith, S.; Li, L.; Yu, J.Z. Source Apportionment of PM2.5 Using Hourly Measurements of Elemental Tracers and Major Constituents in an Urban Environment: Investigation of Time-Resolution Influence. J. Geophys. Res. Atmos. 2018, 123, 5284–5300. [Google Scholar] [CrossRef]
  13. Feng, X.; Feng, Y.; Chen, Y.; Cai, J.; Li, Q.; Chen, J. Source apportionment of PM2.5 during haze episodes in Shanghai by the PMF model with PAHs. J. Clean. Prod. 2022, 330, 129850. [Google Scholar] [CrossRef]
  14. Li, R.; Wang, Q.; He, X.; Zhu, S.; Zhang, K.; Duan, Y.; Fu, Q.; Qiao, L.; Wang, Y.; Huang, L.; et al. Source apportionment of PM2.5 in Shanghai based on hourly organic molecular markers and other source tracers. Atmos. Chem. Phys. 2020, 20, 12047–12061. [Google Scholar] [CrossRef]
  15. Luo, R.; Dai, H.; Zhang, Y.; Wang, P.; Zhou, Y.; Li, J.; Zhou, M.; Qiao, L.; Ma, Y.; Zhu, S.; et al. Association of short-term exposure to source-specific PM2.5 with the cardiovascular response during pregnancy in the Shanghai MCPC study. Sci. Total Environ. 2021, 775, 145725. [Google Scholar] [CrossRef]
  16. Chen, R.; Wang, X.; Meng, X.; Hua, J.; Zhou, Z.; Chen, B.; Kan, H. Communicating air pollution-related health risks to the public: An application of the Air Quality Health Index in Shanghai, China. Environ. Int. 2013, 51, 168–173. [Google Scholar] [CrossRef] [PubMed]
  17. Chen, R.; Chu, C.; Tan, J.; Cao, J.; Song, W.; Xu, X.; Jiang, C.; Ma, W.; Yang, C.; Chen, B.; et al. Ambient air pollution and hospital admission in Shanghai, China. J. Hazard Mater. 2010, 181, 234–240. [Google Scholar] [CrossRef]
  18. Chen, H.; Huo, J.; Fu, Q.; Duan, Y.; Xiao, H.; Chen, J. Impact of quarantine measures on chemical compositions of PM2.5 during the COVID-19 epidemic in Shanghai, China. Sci. Total Environ. 2020, 743, 140758. [Google Scholar] [CrossRef]
  19. Wu, C.; Wang, H.; Cai, W.; He, H.; Ni, A.; Peng, Z. Impact of the COVID-19 lockdown on roadside traffic-related air pollution in Shanghai, China. Build. Environ. 2021, 194, 107718. [Google Scholar] [CrossRef]
  20. Filonchyk, M.; Peterson, M. Air Quality Changes in Shanghai, China, and the Surrounding Urban Agglomeration During the COVID-19 Lockdown. J. Geovis. Spat. Anal. 2020, 4, 22. [Google Scholar] [CrossRef]
  21. Wang, J.; Hu, Z.; Chen, Y.; Chen, Z.; Xu, S. Contamination characteristics and possible sources of PM10 and PM2.5 in different functional areas of Shanghai, China. Atmos. Environ. 2013, 68, 221–229. [Google Scholar] [CrossRef]
  22. Hu, Z.; Wang, J.; Chen, Y.; Chen, Z.; Xu, S. Concentrations and source apportionment of particulate matter in different functional areas of Shanghai, China. Atmos. Pollut. Res. 2014, 5, 138–144. [Google Scholar] [CrossRef] [Green Version]
  23. Sun, W.; Wang, D.; Yao, L.; Fu, H.; Fu, Q.; Wang, H.; Li, Q.; Wang, L.; Yang, X.; Xian, A. Chemistry-triggered events of PM2. 5 explosive growth during late autumn and winter in Shanghai, China. Environ. Pollut. 2019, 254, 112864. [Google Scholar] [CrossRef]
  24. Xu, X. Grid Data Set of Kilometers of Population and GDP Spatial Distribution in China. Resource Science Data Registration and Publishing System. 2017. Available online: http://www.resdc.cn/DOI (accessed on 1 March 2022). (In Chinese).
  25. Yao, L.; Wang, D.; Fu, Q.; Qiao, L.; Wang, H.; Li, L.; Sun, W.; Li, Q.; Wang, L.; Yang, X. The effects of firework regulation on air quality and public health during the Chinese Spring Festival from 2013 to 2017 in a Chinese megacity. Environ. Int. 2019, 126, 96–106. [Google Scholar] [CrossRef] [PubMed]
  26. Wang, Y.Q. MeteoInfo: GIS software for meteorological data visualization and analysis. Meteorol. Appl. 2014, 21, 360–368. [Google Scholar] [CrossRef]
  27. Yin, X.; Kang, S.; de Foy, B.; Ma, Y.; Tong, Y.; Zhang, W.; Wang, X.; Zhang, G.; Zhang, Q. Multi-year monitoring of atmospheric total gaseous mercury at a remote high-altitude site (Nam Co, 4730&thinsp;m&thinsp;a.s.l.) in the inland Tibetan Plateau region. Atmos. Chem. Phys. 2018, 18, 10557–10574. [Google Scholar]
  28. Wang, Y.Q.; Zhang, X.Y.; Arimoto, R. The contribution from distant dust sources to the atmospheric particulate matter loadings at XiAn, China during spring. Sci. Total Environ. 2006, 368, 875–883. [Google Scholar] [CrossRef] [PubMed]
  29. Jeong, U.; Kim, J.; Lee, H.; Lee, Y.G. Assessing the effect of long-range pollutant transportation on air quality in Seoul using the conditional potential source contribution function method. Atmos. Environ. 2017, 150, 33–44. [Google Scholar] [CrossRef]
  30. Yao, L.; Zhan, B.; Xian, A.; Sun, W.; Li, Q.; Chen, J. Contribution of transregional transport to particle pollution and health effects in Shanghai during 2013–2017. Sci. Total Environ. 2019, 677, 564–570. [Google Scholar] [CrossRef]
  31. Yao, L.; Yang, L.; Yuan, Q.; Yan, C.; Dong, C.; Meng, C.; Sui, X.; Yang, F.; Lu, Y.; Wang, W. Sources apportionment of PM2. 5 in a background site in the North China Plain. Sci. Total Environ. 2016, 541, 590–598. [Google Scholar] [CrossRef]
  32. Zara, M.; Boersma, K.F.; Eskes, H.; Denier Van Der Gon, H.; Vilà-Guerau De Arellano, J.; Krol, M.; van der Swaluw, E.; Schuch, W.; Velders, G.J.M. Reductions in nitrogen oxides over the Netherlands between 2005 and 2018 observed from space and on the ground: Decreasing emissions and increasing O3 indicate changing NOx chemistry. Atmos. Environ. X 2021, 9, 100104. [Google Scholar] [CrossRef]
  33. Paoletti, E.; De Marco, A.; Beddows, D.C.S.; Harrison, R.M.; Manning, W.J. Ozone levels in European and USA cities are increasing more than at rural sites, while peak values are decreasing. Environ. Pollut. 2014, 192, 295–299. [Google Scholar] [CrossRef]
  34. Liu, J.; Shen, J.; Cheng, Z.; Wang, P.; Ying, Q.; Zhao, Q.; Zhang, Y.; Zhao, Y.; Fu, Q. Source apportionment and regional transport of anthropogenic secondary organic aerosol during winter pollution periods in the Yangtze River Delta, China. Sci. Total Environ. 2020, 710, 135620. [Google Scholar] [CrossRef]
  35. Li, L.; An, J.Y.; Shi, Y.Y.; Zhou, M.; Yan, R.S.; Huang, C.; Wang, H.L.; Lou, S.R.; Wang, Q.; Lu, Q.; et al. Source apportionment of surface ozone in the Yangtze River Delta, China in the summer of 2013. Atmos. Environ. 2016, 144, 194–207. [Google Scholar] [CrossRef]
  36. Yin, Q.; Ma, Q.; Lin, W.; Xu, X.; Yao, J. Measurement report: Long-term variations in surface NOx and SO2 mixing ratios from 2006 to 2016 at a background site in the Yangtze River Delta region, China. Atmos. Chem. Phys. 2022, 22, 1015–1033. [Google Scholar] [CrossRef]
  37. Chen, X.; Liu, Q.; Sheng, T.; Li, F.; Xu, Z.; Han, D.; Zhang, X.; Huang, X.; Fu, Q.; Cheng, J. A high temporal-spatial emission inventory and updated emission factors for coal-fired power plants in Shanghai, China. Sci. Total Environ. 2019, 688, 94–102. [Google Scholar] [CrossRef] [PubMed]
  38. Li, L.; An, J.Y.; Zhou, M.; Yan, R.S.; Huang, C.; Lu, Q.; Lin, L.; Wang, Y.J.; Tao, S.K.; Qiao, L.P.; et al. Source apportionment of fine particles and its chemical components over the Yangtze River Delta, China during a heavy haze pollution episode. Atmos. Environ. 2015, 123, 415–429. [Google Scholar] [CrossRef]
  39. Zhang, T.; Xu, X.; Su, Y. Long-term measurements of ground-level ozone in Windsor, Canada and surrounding areas. Chemosphere 2022, 294, 133636. [Google Scholar] [CrossRef]
  40. Tong, D.; Muller, N.; Mauzerall, D.; Mendelsohn, R. Integrated assessment of the spatial variability of ozone impacts from emissions of nitrogen oxides. Environ. Sci. Technol. 2006, 40, 1395–1400. [Google Scholar] [CrossRef] [Green Version]
  41. Kang, Y.; Choi, H.; Im, J.; Park, S.; Shin, M.; Song, C.; Kim, S. Estimation of surface-level NO2 and O3 concentrations using TROPOMI data and machine learning over East Asia. Environ. Pollut. 2021, 288, 117711. [Google Scholar] [CrossRef] [PubMed]
  42. Wang, T.; Xue, L.; Feng, Z.; Dai, J.; Zhang, Y.; Tan, Y. Ground-level ozone pollution in China: A synthesis of recent findings on influencing factors and impacts. Environ. Res. Lett. 2022, 17, 63003. [Google Scholar] [CrossRef]
  43. Rivera, C.; Stremme, W.; Barrera, H.; Friedrich, M.M.; Grutter, M.; Garcia Yee, J.; Torres Jardon, R.; Ruiz Suarez, L.G. Spatial distribution and transport patterns of NO2 in the Tijuana—San Diego area. Atmos. Pollut. Res. 2015, 6, 230–238. [Google Scholar] [CrossRef] [Green Version]
  44. Lee, H.J.; Kim, S.W.; Brioude, J.; Cooper, O.R.; Frost, G.J.; Kim, C.H.; Park, R.J.; Trainer, M.; Woo, J.H. Transport of NOx in East Asia identified by satellite and in situ measurements and Lagrangian particle dispersion model simulations. J. Geophys. Res-Atmos. 2014, 119, 2574–2596. [Google Scholar] [CrossRef]
  45. Wang, Z.; Li, J.; Wang, Z.; Yang, W.; Tang, X.; Ge, B.; Yan, P.; Zhu, L.; Chen, X.; Chen, H.; et al. Modeling study of regional severe hazes over mid-eastern China in January 2013 and its implications on pollution prevention and control. Sci. China Earth Sci. 2014, 57, 3–13. [Google Scholar] [CrossRef]
  46. Yang, X.; Wu, K.; Lu, Y.; Wang, S.; Qiao, Y.; Zhang, X.; Wang, Y.; Wang, H.; Liu, Z.; Liu, Y.; et al. Origin of regional springtime ozone episodes in the Sichuan Basin, China: Role of synoptic forcing and regional transport. Environ. Pollut. 2021, 278, 116845. [Google Scholar] [CrossRef] [PubMed]
  47. Li, L.; An, J.; Huang, L.; Yan, R.; Huang, C.; Yarwood, G. Ozone source apportionment over the Yangtze River Delta region, China: Investigation of regional transport, sectoral contributions and seasonal differences. Atmos. Environ. 2019, 202, 269–280. [Google Scholar] [CrossRef]
  48. Wang, Q.; Wang, X.; Huang, R.; Wu, J.; Xiao, Y.; Hu, M.; Fu, Q.; Duan, Y.; Chen, J. Regional transport of PM2.5 and O3 based on complex network method and chemical transport model in the Yangtze River Delta, China. J. Geophys. Res. Atmos. 2022, 127, e2021JD034807. [Google Scholar]
  49. Lu, W.; Tam, V.W.; Du, L.; Chen, H. Impact of industrial agglomeration on haze pollution: New evidence from Bohai Sea Economic Region in China. J. Clean Prod. 2021, 280, 124414. [Google Scholar] [CrossRef]
  50. Zhao, M.; Huang, Z.; Qiao, T.; Zhang, Y.; Xiu, G.; Yu, J. Chemical characterization, the transport pathways and potential sources of PM2.5 in Shanghai: Seasonal variations. Atmos. Res. 2015, 158–159, 66–78. [Google Scholar] [CrossRef]
  51. Zhang, Z.; Zhou, W.; Wenig, M.; Yang, L. Impact of long-range desert dust transport on coastal East Asia: Analysis of urban dust concentration and wet deposition with model simulation. Air Qual. Atmos. Health 2017, 10, 325–337. [Google Scholar] [CrossRef]
  52. Qin, Y.; Li, J.; Gong, K.; Wu, Z.; Chen, M.; Qin, M.; Huang, L.; Hu, J. Double high pollution events in the Yangtze River Delta from 2015 to 2019: Characteristics, trends, and meteorological situations. Sci. Total Environ. 2021, 792, 148349. [Google Scholar] [CrossRef]
  53. Chang, L.; He, F.; Tie, X.; Xu, J.; Gao, W. Meteorology driving the highest ozone level occurred during mid-spring to early summer in Shanghai, China. Sci. Total Environ. 2021, 785, 147253. [Google Scholar] [CrossRef]
  54. Li, X.; Yuan, B.; Parrish, D.D.; Chen, D.; Song, Y.; Yang, S.; Liu, Z.; Shao, M. Long-term trend of ozone in southern China reveals future mitigation strategy for air pollution. Atmos. Environ. 2022, 269, 118869. [Google Scholar] [CrossRef]
  55. Wu, K.; Wang, Y.; Qiao, Y.; Liu, Y.; Wang, S.; Yang, X.; Wang, H.; Lu, Y.; Zhang, X.; Lei, Y. Drivers of 2013–2020 ozone trends in the Sichuan Basin, China: Impacts of meteorology and precursor emission changes. Environ. Pollut. 2022, 300, 118914. [Google Scholar] [CrossRef] [PubMed]
  56. Wang, W.; Parrish, D.D.; Wang, S.; Bao, F.; Ni, R.; Li, X.; Yang, S.; Wang, H.; Cheng, Y.; Su, H. Long-term trend of ozone pollution in China during 2014–2020: Distinct seasonal and spatial characteristics and ozone sensitivity. Atmos. Chem. Phys. 2022, 22, 8935–8949. [Google Scholar] [CrossRef]
  57. Dai, H.; Liao, H.; Li, K.; Yue, X.; Yang, Y.; Zhu, J.; Jin, J.; Li, B.; Jiang, X. Composited analyses of the chemical and physical characteristics of co-polluted days by ozone and PM2.5 over 2013–2020 in the Beijing–Tianjin–Hebei region. Atmos. Chem. Phys. 2023, 23, 23–39. [Google Scholar] [CrossRef]
  58. Wang, T.; Xue, L.; Brimblecombe, P.; Lam, Y.F.; Li, L.; Zhang, L. Ozone pollution in China: A review of concentrations, meteorological influences, chemical precursors, and effects. Sci. Total Environ. 2017, 575, 1582–1596. [Google Scholar] [CrossRef] [PubMed]
  59. Lin, H.; Wang, M.; Duan, Y.; Fu, Q.; Ji, W.; Cui, H.; Jin, D.; Lin, Y.; Hu, K. O3 sensitivity and contributions of different NMHC sources in O3 formation at urban and suburban sites in Shanghai. Atmosphere 2020, 11, 295. [Google Scholar] [CrossRef] [Green Version]
  60. Lu, H.; Lyu, X.; Cheng, H.; Ling, Z.; Guo, H. Overview on the spatial–temporal characteristics of the ozone formation regime in China. Environ. Sci. Proc. Imp. 2019, 21, 916–929. [Google Scholar] [CrossRef]
  61. Huang, C.; Chen, C.H.; Li, L.; Cheng, Z.; Wang, H.L.; Huang, H.Y.; Streets, D.G.; Wang, Y.J.; Zhang, G.F.; Chen, Y.R. Emission inventory of anthropogenic air pollutants and VOC species in the Yangtze River Delta region, China. Atmos. Chem. Phys. 2011, 11, 4105–4120. [Google Scholar] [CrossRef] [Green Version]
  62. Liang, X.; Sun, X.; Xu, J.; Ye, D. Improved emissions inventory and VOCs speciation for industrial OFP estimation in China. Sci. Total Environ. 2020, 745, 140838. [Google Scholar] [CrossRef]
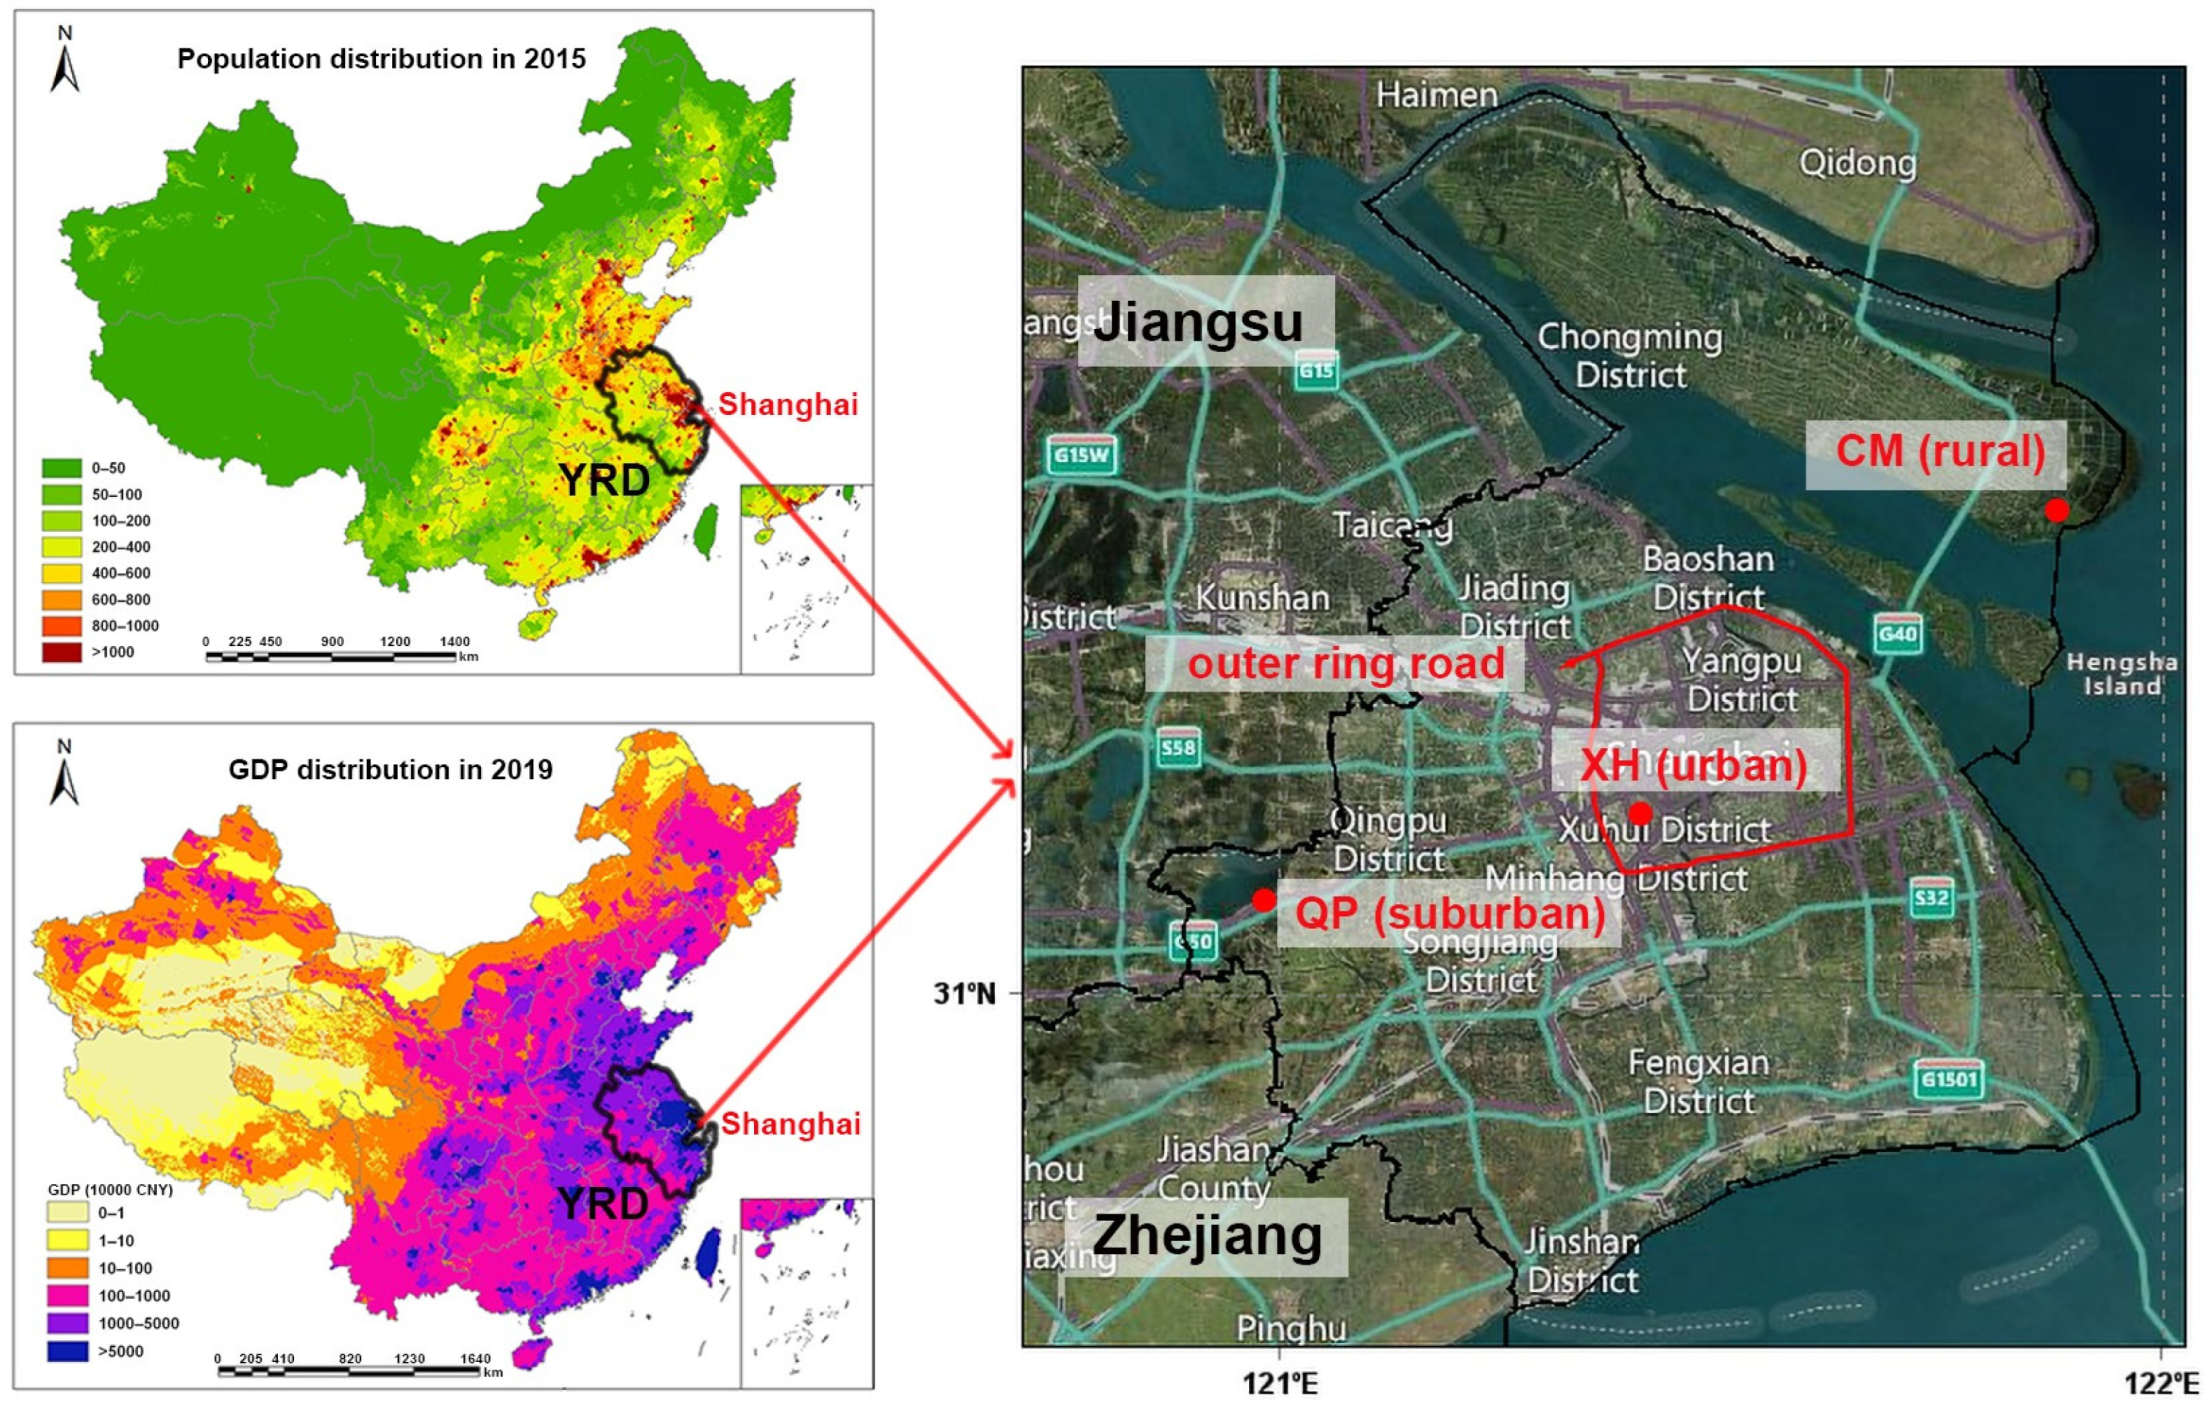
Figure 1. Location of the three monitoring sites in Shanghai. Population and GDP distribution were sourced from grid datasets of kilometers of population and GDP spatial distribution in China [24].
Sustainability 15 02429 g001
Figure 2. Monthly variation of concentration of air pollutants in the three sites during 2019–2021 (based on daily average concentration).
Sustainability 15 02429 g002
Figure 3. Comparison of daily variation of pollutants on weekdays and weekends in the three typical sites in Shanghai. “*” indicated a significant difference (p < 0.05) between concentrations of pollutants on weekdays and weekends. Warm season includes May, June, July, August, September, and October.
Sustainability 15 02429 g003
Figure 4. Seasonal cluster-mean backward-trajectories (1–5) and average concentration of pollutants corresponding to each cluster originated from XH station, Shanghai (2019 to 2021).
Sustainability 15 02429 g004
Figure 5. Map of PSCF analysis for NO2, PM2.5, PM10, and O3 in Shanghai during different seasons.
Sustainability 15 02429 g005
Figure 6. Time series of pollutants and meteorological parameters during (a) PM2.5 pollution episode; (b) PM10 pollution episode; (c) O3 pollution episode in the three sites in Shanghai, 2021. Meteorological parameters were measured at the QP site.
Sustainability 15 02429 g006
Table 1. Summary of the air quality dataset in this study.
SiteDaily DataHourly Data
XH2019–20212019–2021
QP2019–20212019–2021
CM2019–20212021
Table 2. Frequency of different pollutants as primary pollutants (based on daily average concentration) in different functional areas in Shanghai during 2019–2021.
Functional AreaNO2O3PM10PM2.5Frequency
XH (Urban)41%40%5%14%n = 1097
QP (Suburban)23%51%5%21%n = 1099
CM (Rural)3%71%6%20%n = 1093
Disclaimer/Publisher’s Note: The statements, opinions and data contained in all publications are solely those of the individual author(s) and contributor(s) and not of MDPI and/or the editor(s). MDPI and/or the editor(s) disclaim responsibility for any injury to people or property resulting from any ideas, methods, instructions or products referred to in the content.