Article

Concentrations and Stoichiometric Characteristics of C, N, and P in Purple Soil of Agricultural Land in the Three Gorges Reservoir Region, China

1
Faculty of Resources and Environment, Xichang College, Xichang 615000, China
2
Key Laboratory of Mountain Surface Processes and Ecological Regulation, Institute of Mountain Hazards and Environment, Chinese Academy of Sciences, Chengdu 610041, China
*
Author to whom correspondence should be addressed.
Sustainability 2023, 15(3), 2434; https://doi.org/10.3390/su15032434
Submission received: 3 January 2023 / Revised: 24 January 2023 / Accepted: 27 January 2023 / Published: 30 January 2023
(This article belongs to the Section Soil Conservation and Sustainability)

Abstract

:
Soil stoichiometry is an essential tool for understanding soil nutrient balance and cycling. Previous studies have recognized that some relationships were observed between particle size and carbon and nitrogen parameters. This study attempted to evaluate nutrient element concentrations and their stoichiometric ratios of surface soil (0–10 cm) under different land use types (forest, sloping arable land, paddy fields, and orchards). and different particle sizes (<32 µm, <63 µm, and <125 µm) from a small typical hilly catchment (0.35 km2) in the Three Gorges Reservoir Region of China. The contents of soil organic carbon (SOC), total nitrogen (TN). and total phosphorus (TP) were measured, and the ratios of C:N, C:P, N:P were calculated. The results indicated that land use type and soil particle size have diverse impacts on the studied indexes (SOC, TN, TP, C:N, C:P, and N:P). Six indexes were significantly affected by land use type (p < 0.01), while only C:N ratio was statistically influenced by soil particle size (p < 0.05). Furthermore, several significant differences of studied parameters of four land use types grouped within three particle sizes were found. The concentrations of SOC (12.34~13.46 g kg−1), TN (1.27~1.59 g kg−1), and TP (0.71~0.92 g kg−1) in the study site were lower than the national average values of China. Moreover, the productivity in the study area was mainly limited by TN concentration. Additionally, the concentration of TP decreased obviously with the increase in particle size. Furthermore, various coupling relationships were validated by linear and nonlinear fitting among different indexes. At the small catchment scale, take forest as a reference, human activities have significant impact on C-N-P stoichiometry (p < 0.05). Especially, tillage may reduce SOC and TN contents, leading to a decline in soil quality. Overall, our findings can provide a basis for rational utilization and sustainable development of land resources.

1. Introduction

Ecological stoichiometry usually refers to the elemental composition of organisms, emphasizing on the relationship between the major constituent elements of living organisms, especially the relation of carbon (C), nitrogen (N), and phosphorous (P). Generally, organic matter is made up of multiple elements (such as C, N, P, H, O, S, and so on), and the ratios of C, N, and P almost determine the key characteristics of the organism, and its requirements depending on the type and quantity of resources. The ratio of organic elements in soil is greatly influenced by the environmental factors, such as geology, climate, biology, etc., [1,2]. Therefore, a complex feedback relationship is formed between the elemental stoichiometric balance of the environment and the stoichiometric balance of the organism. In fact, soil performs a fundamental role as the basis of plant growth. The elements of C, N, and P are vital factors maintaining ecosystem health and nutrient cycling. The dynamic balance in terms of contents for above mentioned elements and their stoichiometric characteristics directly affect soil fertility and plant productivity [3,4]. Therefore, it is important to study the implication of co-variation pattern and relationship between chemical elements (C, N, and P) to reveal the processes influencing the equilibrium cycle and ecosystem mechanism [5]. In recent years, a large number of researchers worked extensively on soil C-N-P stoichiometry [6,7,8,9,10,11]. In these studies, it is hypothesized that land use types account for a large proportion in regulating soil C-N-P stoichiometry. Several studies have confirmed the variability of soil stoichiometry under different land use types and different vegetation cover [12,13,14,15]. Nevertheless, the majority of studies mainly concentrated on natural ecosystem, such as forest, grassland, wetland, and so on [1,3,5,8,12,16]. Little attention has been paid to agroecological systems regarding soil C-N-P stoichiometry.
Soil stoichiometry could provide basic data and theoretical guidance for hilly ecosystems to unveil the balance and cycling of soil elements (C, N, P) under different land-use. Furthermore, understanding of the differences between soil nutrients under different land use types can provide a basis for rational utilization and sustainable development of land resources. Currently, most of the existing studies focused on large spatial scale, such as global scale [10,15,17], national scale [6,11,12,18], and large watershed scale covering hundreds of square kilometers [3,4,7,8,9]. Past studies have confirmed that the variability of soil C, N, and P contents, and their stoichiometry varied with different regions and spatial scales [19]. However, few studies reported the status of soil nutrients and their stoichiometry on small catchment scale.
The Three Gorges Reservoir, characterized by a large number of mountains and hills with a very small portion of lowland plain, recognizes a fragile ecological environment. Purple soil is one of the most common soil types in this region, which has been classified as Orthic Entisol in the Chinese Soil Taxonomic System, Entisol in USDA Taxonomy, and Regosol in FAO Taxonomy [20]. Additionally, purple soil is also one of the most vital soil resources in the mountainous area of southwestern China with features of high reclamation index and strong human activities. There are few studies on the soil stoichiometry characteristics of different land use types in purple soil areas, especially in small agricultural catchment with diverse land-use types.
Normally, different land use type reveals uneven particle size distribution. The size of soil particles may be one of the main factors affecting the distribution of soil nutrients [21]. As the product of soil erosion, sediment inherits some of the properties of soil. A number of studies have shown that particle size affected the element concentration [21,22]. According to research achievement available, Laceby et al. [23] selected four particle sizes (<2 µm, <10 µm, <63 µm, and <2 mm) for analysis, and the results indicated that nitrogen sediment properties had significant particle size enrichment. Additionally, the results of Laceby et al. [24] revealed that C and N parameters of varied land use types showed diverse enrichment rules in different particle sizes (i.e., <63 µm and <2 mm). Hence, it is meaningful to probe the variability of soil C-N-P stoichiometry under different land use and particle size.
Against the above background, the present work was undertaken to study mainly the soil C-N-P stoichiometry distributions of four land-use type at three soil particle size (i.e., <32 µm, <63 µm, and <125 µm, which referred to the particle size distribution of outlet sediments) in a typical hilly catchment of the Three Gorges Reservoir Region, hoping to provide a valuable insight for other purple soil area in China.

2. Materials and Methods
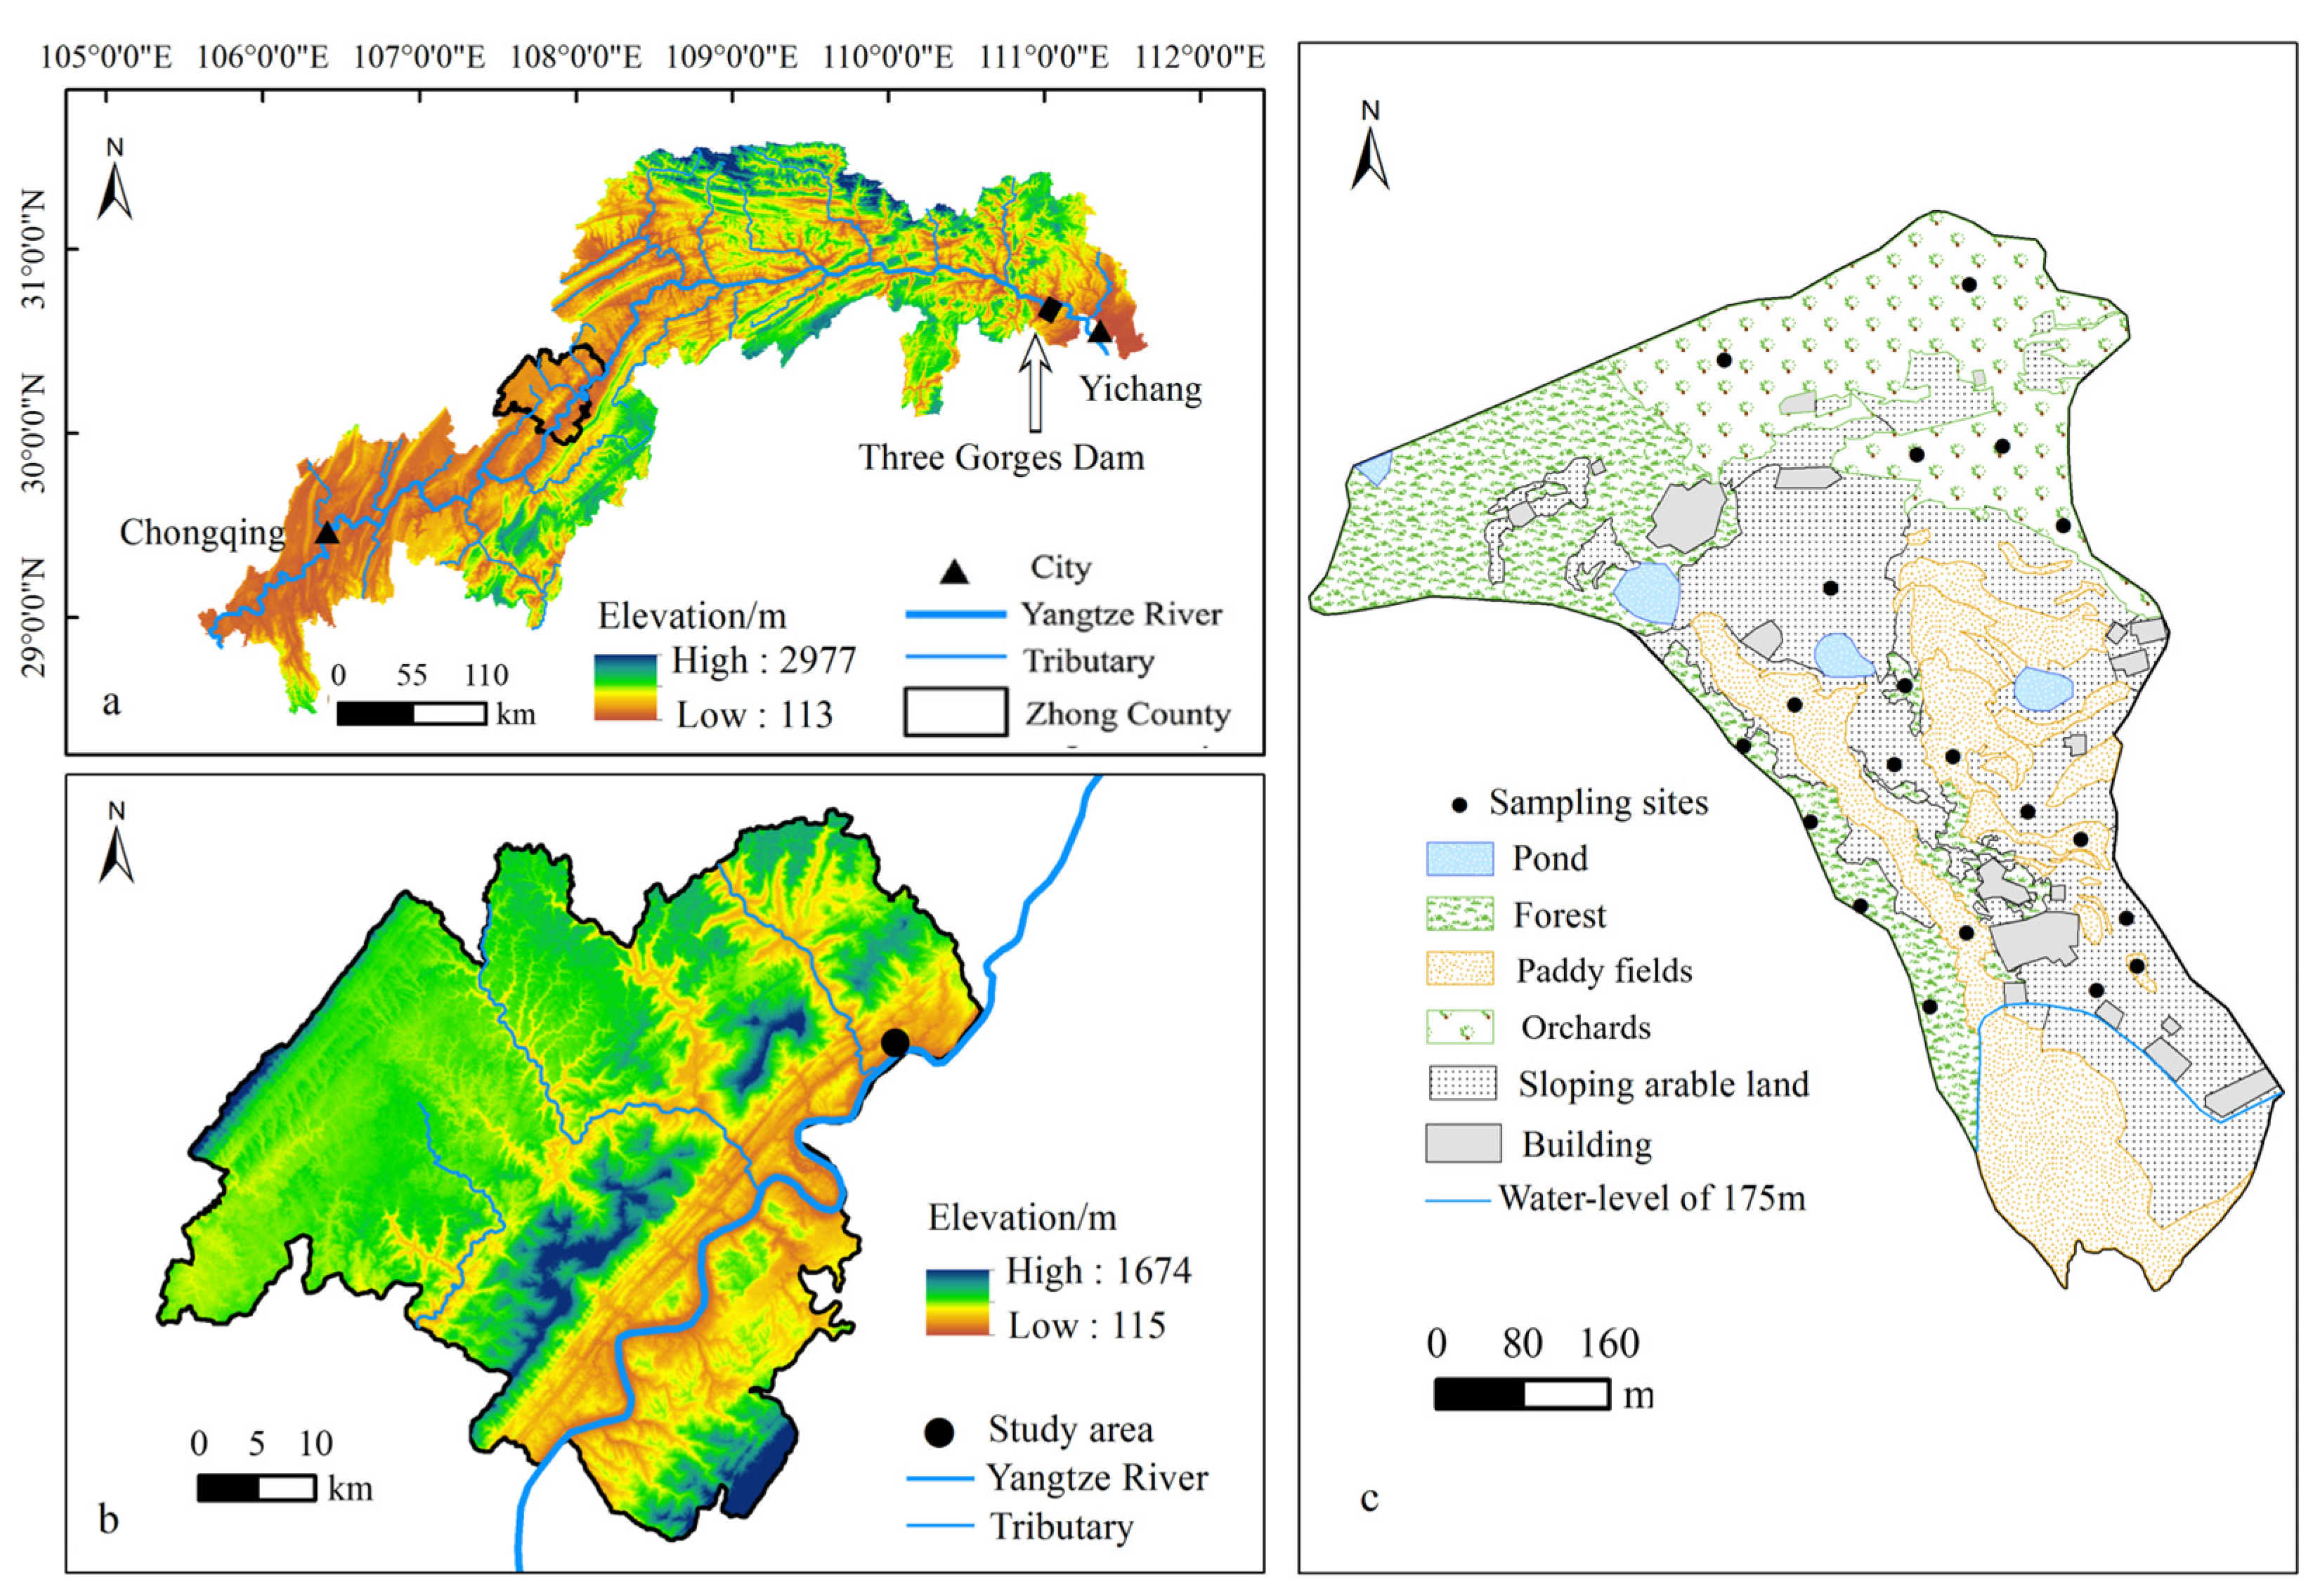
2.1. Study Area

The study was conducted in the Shipanqiu catchment of the Three Gorges Reservoir Region (Figure 1), located in Zhong County, Chongqing province, China (107°3′~108°14′ E, 30°03′~30°35′ N), which is a representative hilly catchment with spatial landscape complexity, covering an area of 0.35 km2. This subtropical southeast monsoon area experiences annual average temperature of 19.2 °C with frost-free period of 320 days, and annual mean precipitation of 1150 mm. A total of 70% of the rainfall is concentrated in the rainy season from April to September. Purple soil is the most common soil type in this area. The predominant soil type in the study area is neutral purple. It is classified as Regosols in FAO Taxonomy or Entisols in USDA Taxonomy [20]. The dominant typical land use types of the catchment include residential zones (villages and market towns), agricultural land (paddy fields and sloping arable land), forest, orchards, etc. The main kind of trees of orchards and forest are Citrus reticulata Blanco and Bambusoideae, separately. Additionally, the major crop in paddy fields is Oryza sativ L. In addition, Brassica campestris, Glycine max, and Zea mays were the common crops planted in sloping arable land.

2.2. Field Sampling

The soil samples were collected from surface soil (0–10 cm) of four different land use types (forest, sloping arable land, paddy fields, and orchards). Five replicate samples were collected for each land use using a stainless-steel shovel, and each sample was a mixed sample collected from 10 surrounding points. Each sample weighed about 500 g. The samples approximately covered the entire studied area. The sampling points followed the principle of random sampling, and the distribution of sampling points was shown in Figure 1c. Indeed, the southern part of the catchment experiences a periodic water level fluctuation in the reservoir area which consequently influences the variability of its soil physical properties. With this regard, the present study skipped any kind of sampling in this area. The study area is very small (0.35 km2). Moreover, the distributions of forest, orchards, and paddy fields are relatively continuous and concentrated. Consequently, there might be a little spatial variation of soil properties within one kind of land use type. Therefore, the sample was representative for the properties of the major land use types.

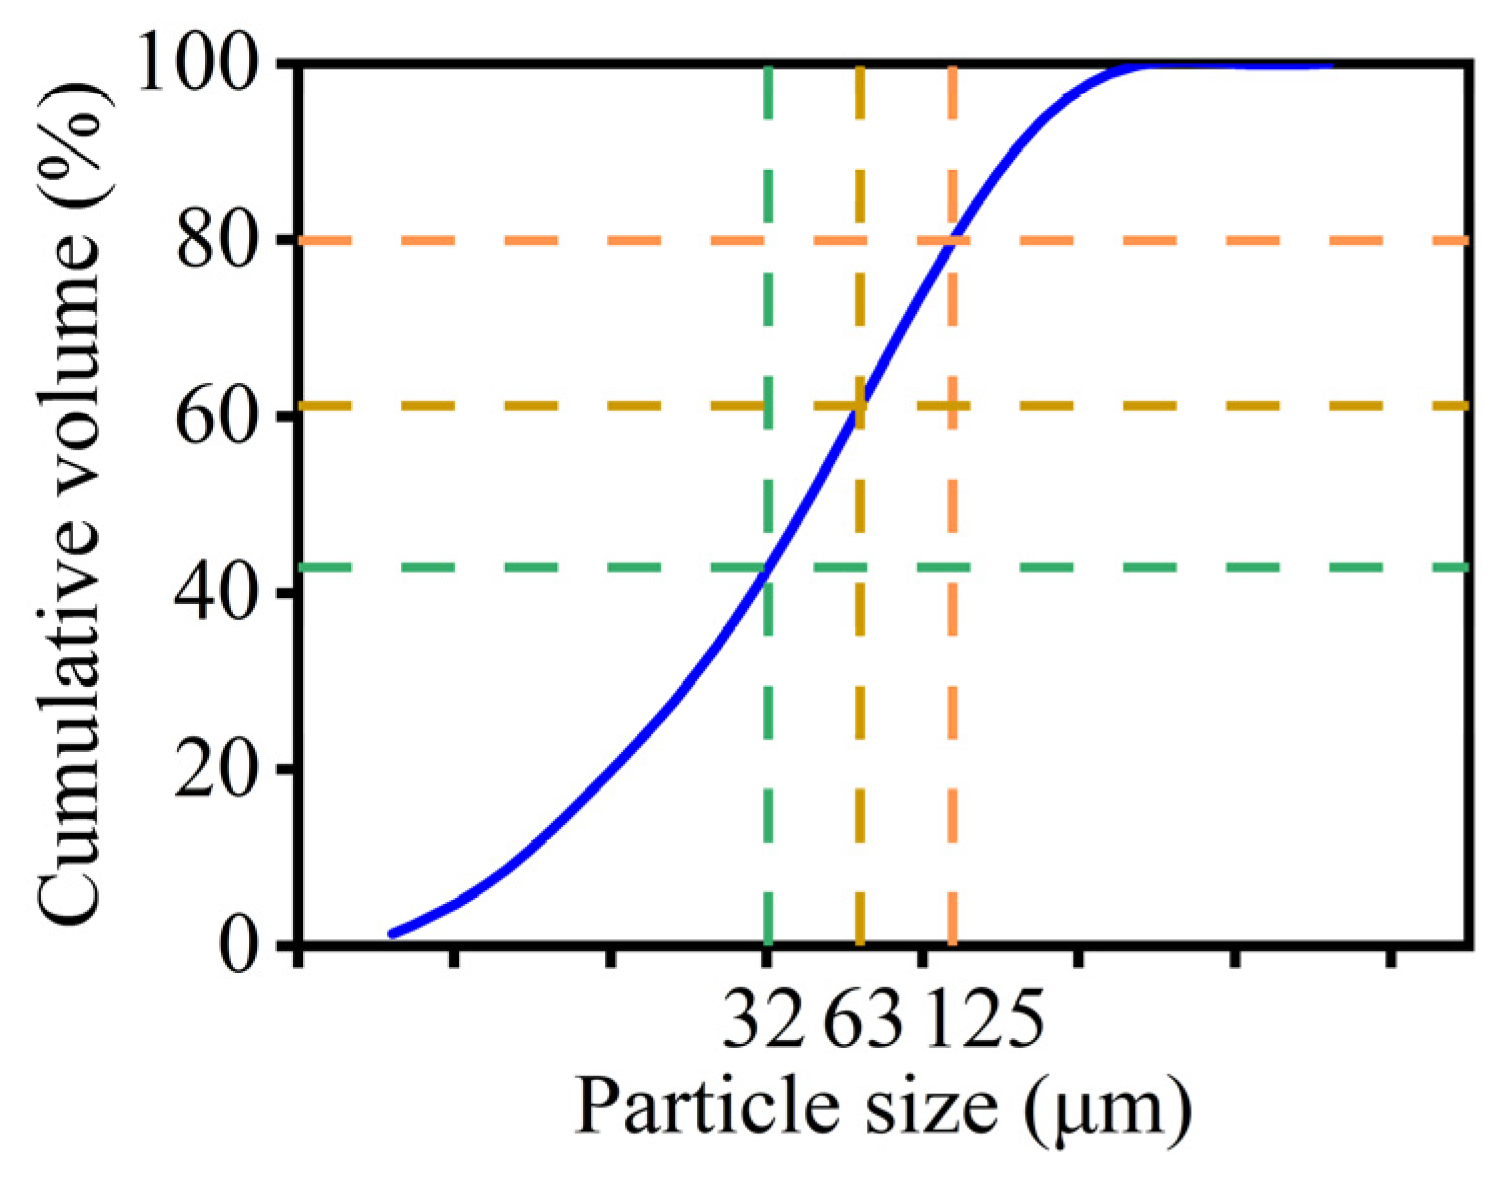
2.3. Particle Size Selection

A preliminary experiment of particle size analysis of sediments at the outlet of the studied catchment was conducted. After collecting sediment from rainfall erosion, Malvern Mastersizer 2000 (Malvern Instruments, Malvern, UK) was used for granularity analysis. Additionally, the particle size distribution of sediment in this catchment were presented in Figure 2. The results indicated that the particle size of about 80% components was <125 µm, about 60% components was <63 µm, and about 40% components was <32 µm (Figure 2). Based on the above particle size distribution characteristics, these three particle size ranges (<125 µm, <63 µm, and <32 µm) were selected to further analysis.

2.4. Laboratory Analysis

Prior to all pre-treatments, dead leaves, plant roots, and coarse gravel were manually removed from all the samples, which was followed by air-dried in the laboratory at room temperature. All samples were sifted through a 2 mm soil sieve at first. Then, they were in turn dry screened to the three analytical sizes (<125 μm, <63 μm, and <32 μm) for further analysis of soil organic carbon (SOC), total nitrogen (TN). and total phosphorus (TP). Then, SOC and TN concentrations were measured using the Vario MACRO Cube produced by Elementar, Hanau, Germany, removing the inorganic carbon in the sample with 1 mol L−1 hydrochloric acid. Then, weighing the sample and wrapping it in tin foil for elemental analysis. The samples to be tested were put into the combustion tube of the elemental analyzer for full combustion, and SOC and TN contents of the samples were calculated according to the peak area of CO2 and NOX concentrations generated by combustion. Moreover, TP concentration was determined by UV-visible spectrophotometer (Shimadzu, Kyoto, Japan, UV-1601PC). After melting with sodium hydroxide, the phosphate minerals and organophosphorus compounds in the soil samples were converted into soluble orthophosphate, which reacted with molybdenum-antimony anti-color reagent under acidic conditions to produce phosphomolybdenum blue. The absorbance was measured at the wavelength 700 nm to calculate the contents of TP in the samples.

2.5. Statistical Analyses

Excel 2016 and SPSS 20.0 were used for statistical analysis. The nonparametric Kruskal–Wallis test was performed to identify the significant difference between elemental concentrations and stoichiometric ratios in different land use types, and among particle sizes of similar land use type. Pearson correlation analysis was applied for correlation analysis of soil stoichiometric parameters. In this study, the p value below 0.05 was regarded as statistically significant in all statistical tests.

3. Results

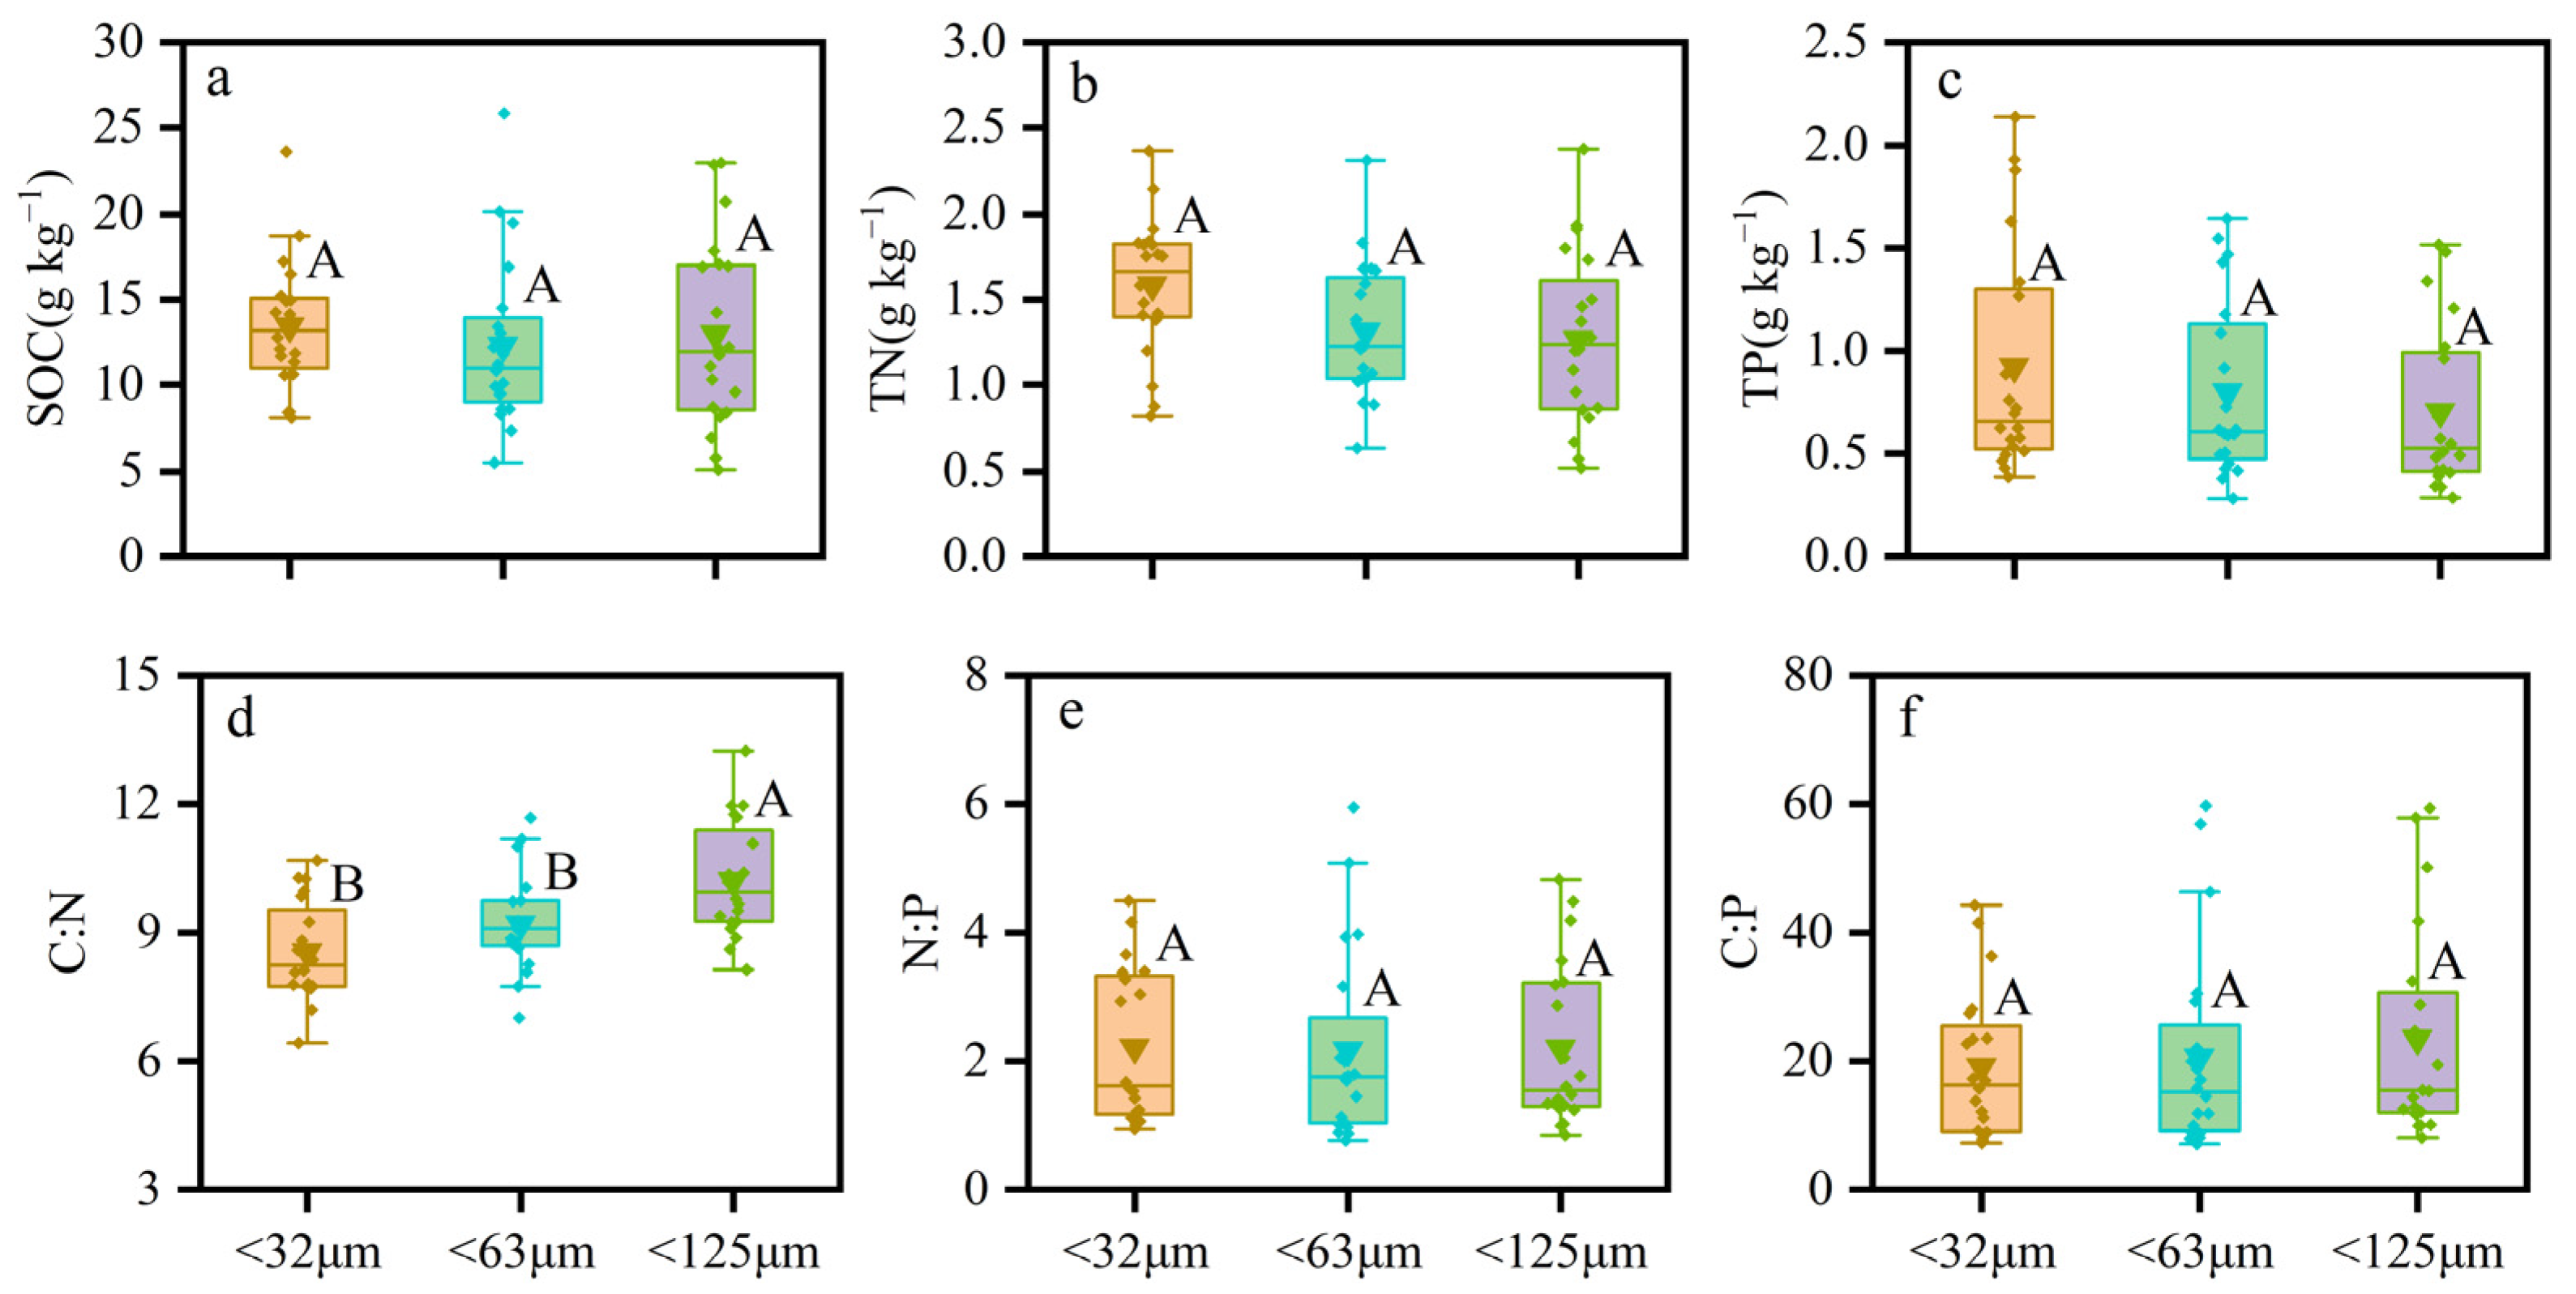
3.1. Soil Stoichiometric Characteristics of Different Particle Size Groups

The concentrations of SOC, TN, and TP of three particle size groups in the study area were shown in Figure 3a–c. The average SOC concentrations under particle size of <32, <63, and <125 μm were 13.46 ± 3.68, 12.34 ± 4.83, 12.99 ± 5.33 g kg−1, respectively. The lowest SOC concentration appeared at the particle size of <63 μm. In addition, the TN content decreased with increasing particle size (Figure 3b), and the average content was 1.59 ± 0.39, 1.32 ± 0.39, and 1.27 ± 0.49 g kg−1 of <32, <63, and <125 μm particle size, separately. Furthermore, the content of TP showed the same decreasing trend as TN with the increase in particle size (Figure 3c). The specific mean values of TP concentration were 0.92 ± 0.55 g kg−1 of <32 μm, 0.80 ± 0.42 g kg−1 of <63 μm, 0.71 ± 0.39 g kg−1 of <125 μm, respectively. Overall, the mean concentrations of SOC, TN, and TP under three particle size were not significantly different (p < 0.05).
The ratios of soil C:N, N:P, and C:P in the studied particle size were presented in Figure 3d,e. The mean values of C:N and C:P ratios increased with the increase in particle size, while the mean N:P ratio fluctuated slightly with increasing particle size. Specifically, mean values of C:N ratio were 8.55 ± 1.13, 9.21 ± 1.11, and 10.21 ± 1.30 for particle size of <32, <63, and <125 μm, respectively. The C:N ratio of <125 μm was significantly higher than other two sizes (p < 0.05). The variation range of N:P ratio and C:P ratio in different particle size were 2.17 ± 1.44 to 2.20 ± 1.24, and 19.23 ± 11.16 to 23.56 ± 16.00, respectively. However, neither the N:P ratio nor C:P ratio under three selected particle size were not significantly different (p < 0.05).

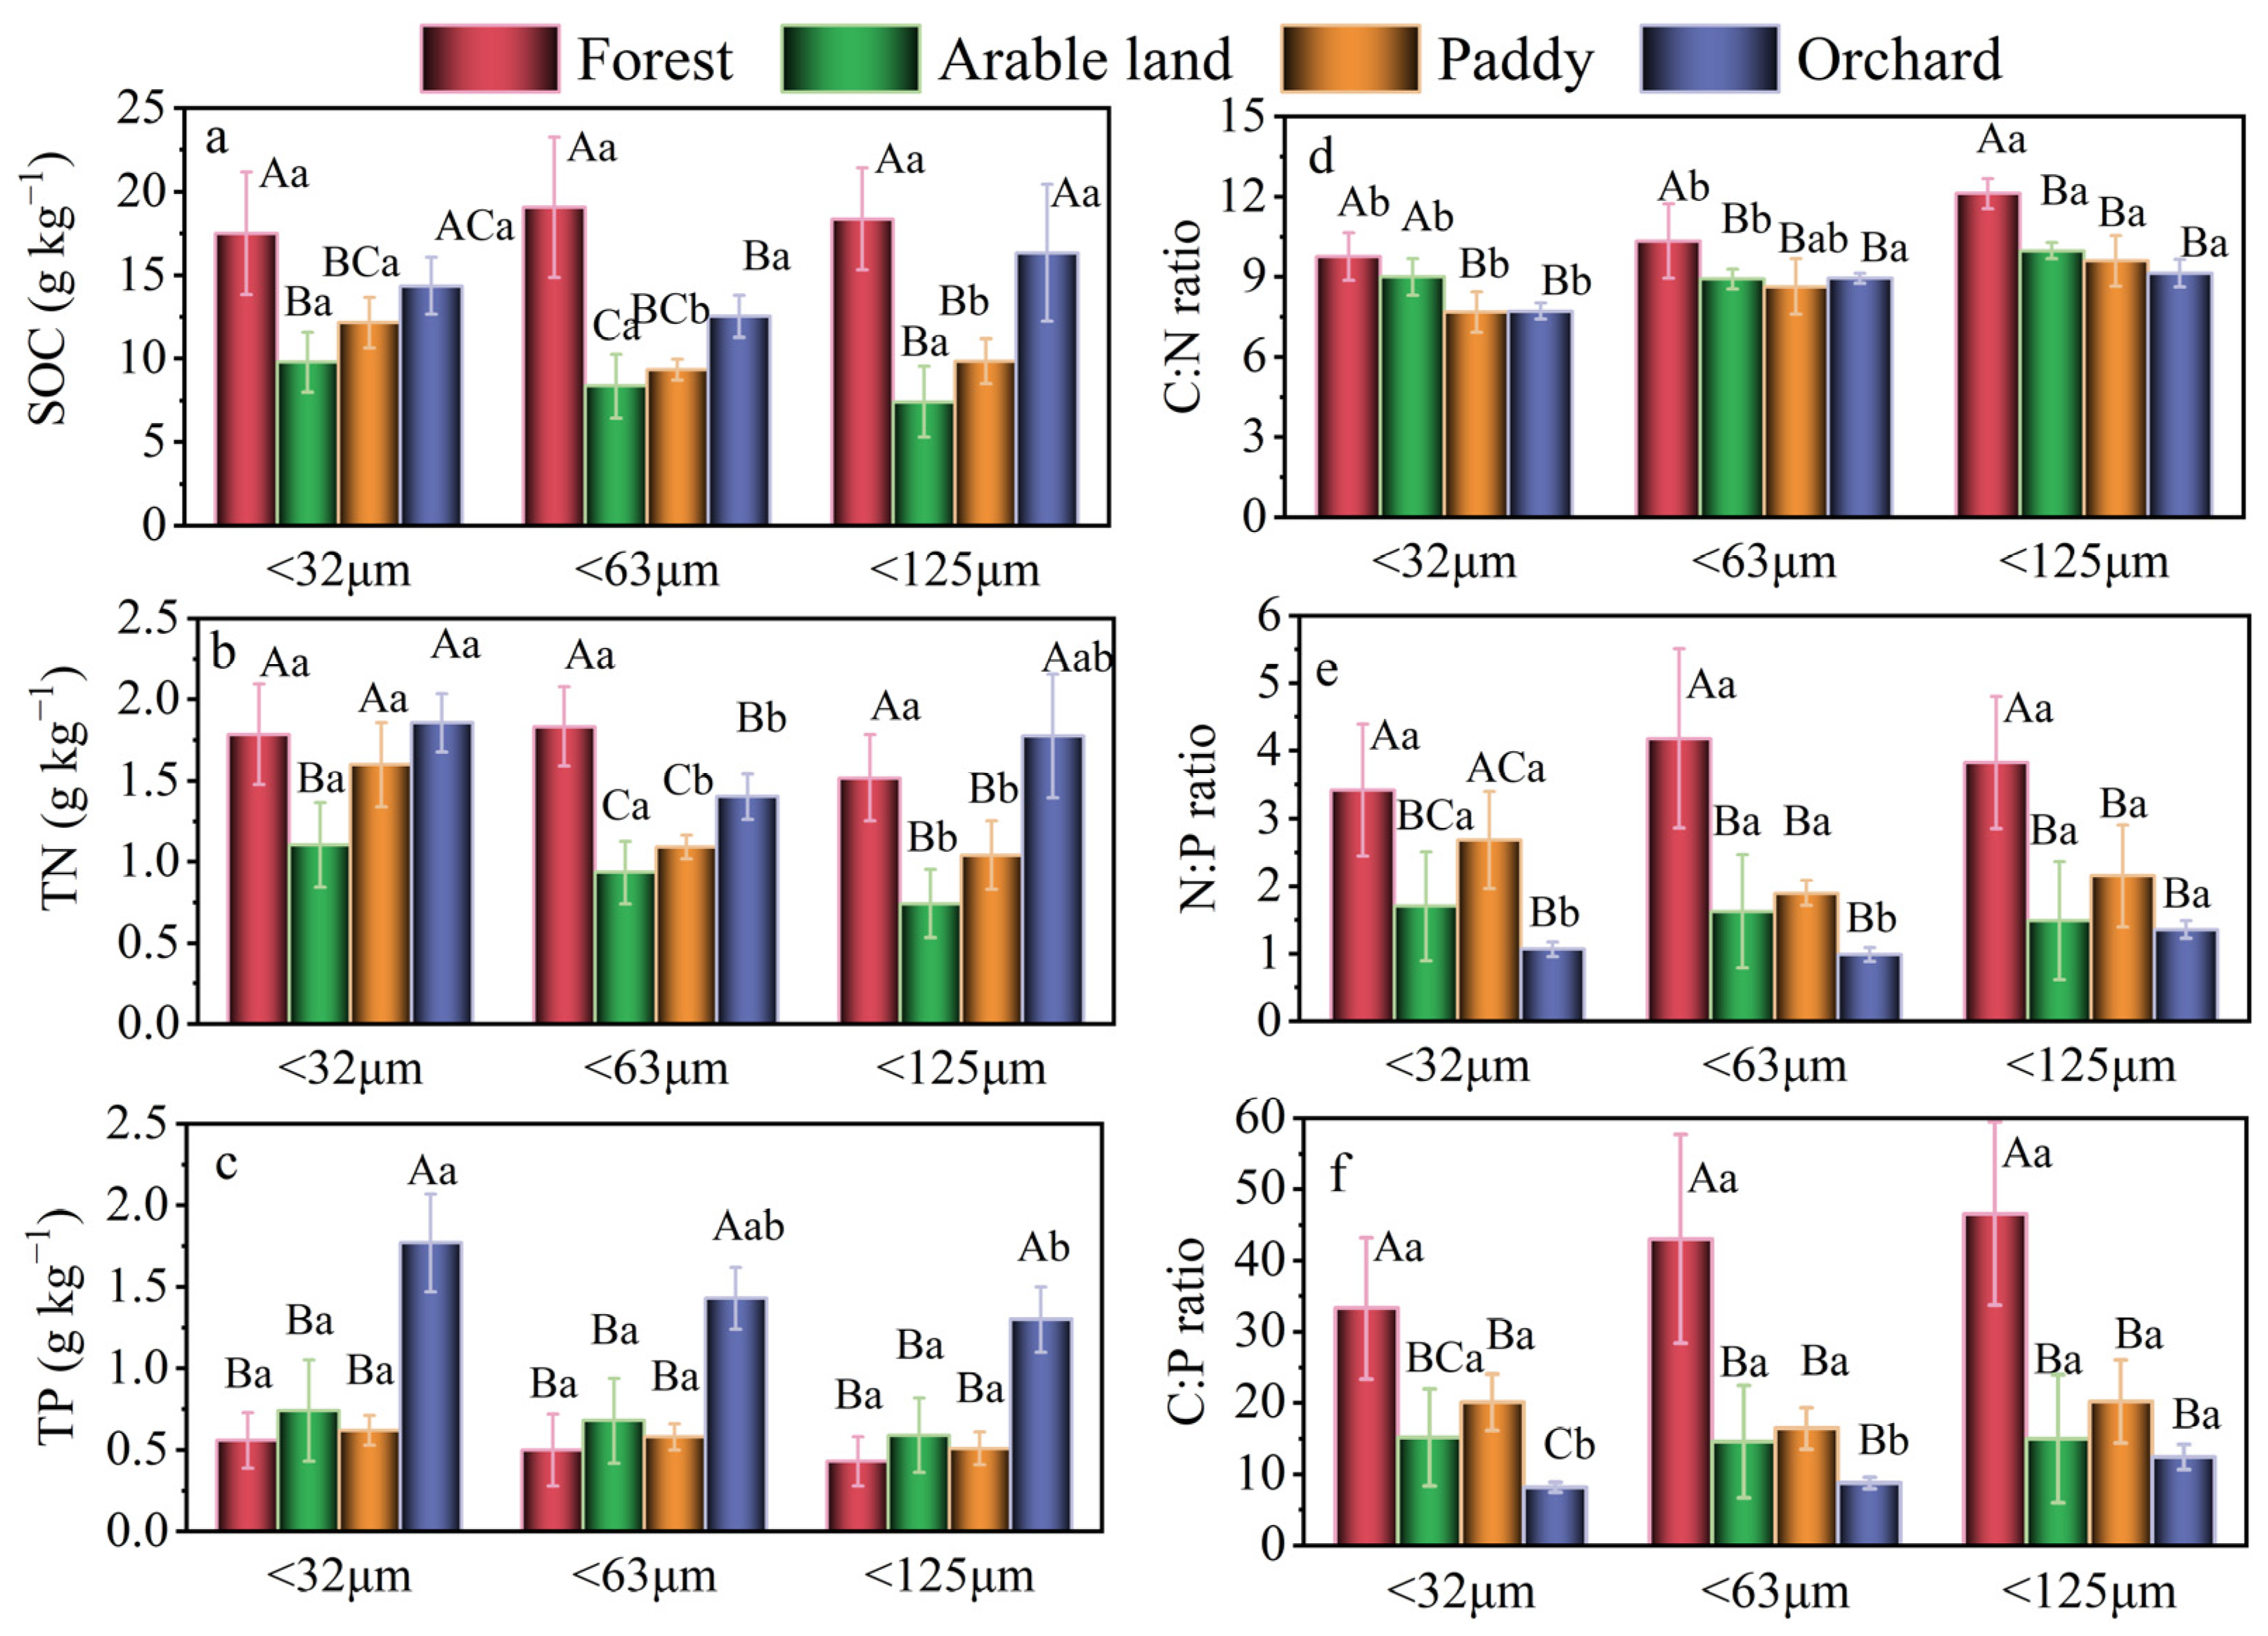
3.2. Soil Stoichiometric Characteristics of Four Land Use Types with Different Particle Sizes

Six soil stoichiometric parameters of four land use types grouped within three particle sizes were presented in Figure 4. Generally speaking, TP concentration and the ratio of C:N showed distinct regularity with the increase in soil particle size. The concentration of TP decreased with the increase in particle size, while value of C:N increased with the increase in particle size in all land use types except for arable land. This trending pattern of the studied properties changing with particle size was relatively inconsistent throughout different land use. The values of SOC, TN, and N:P for forest peaked at <63 µm. The attributes SOC, TN, TP, N:P, and C:P for arable land decreased with the increase in particle size. Moreover, TN and TP concentrations of paddy fields showed decreasing trend from fine to coarse particles, opposite trend was found for C:N ratio of paddy fields. Additionally, the lowest values of SOC, N:P and C:P were appeared in particle size of <63 µm. Similarly, the minimum values of SOC, TN, N:P of orchards also existed in particle size of <63 µm. In addition, from fine (<32 µm) to coarse particles (<125 µm), TP concentration of orchards decreased, and the ratios of C:N and C:P continuously increased.
There were significant differences in SOC concentration in paddy fields among groups with different particle sizes (p < 0.05). However, the concentrations of TN in arable land, paddy fields, and orchards showed statistically differences in three particle size groups (p < 0.05). Furthermore, the values of TP, N:P, and C:P in orchards under different particle size presented evident differences (p < 0.05). The ratio of C:N in four land use types exhibited distinct difference under different particle size groups studied (p < 0.05).
Kruskal–Wallis test was employed to identify the effects of land use type and soil particle size on six indexes of soil stoichiometric characteristics. The overall impact of the above-mentioned characteristics was shown in Table 1. The influence of land use type on six indexes showed a significant difference at p < 0.01, and the impact of soil particle size on three indexes (TN, TP, C:N) recorded a significant difference at p < 0.05.

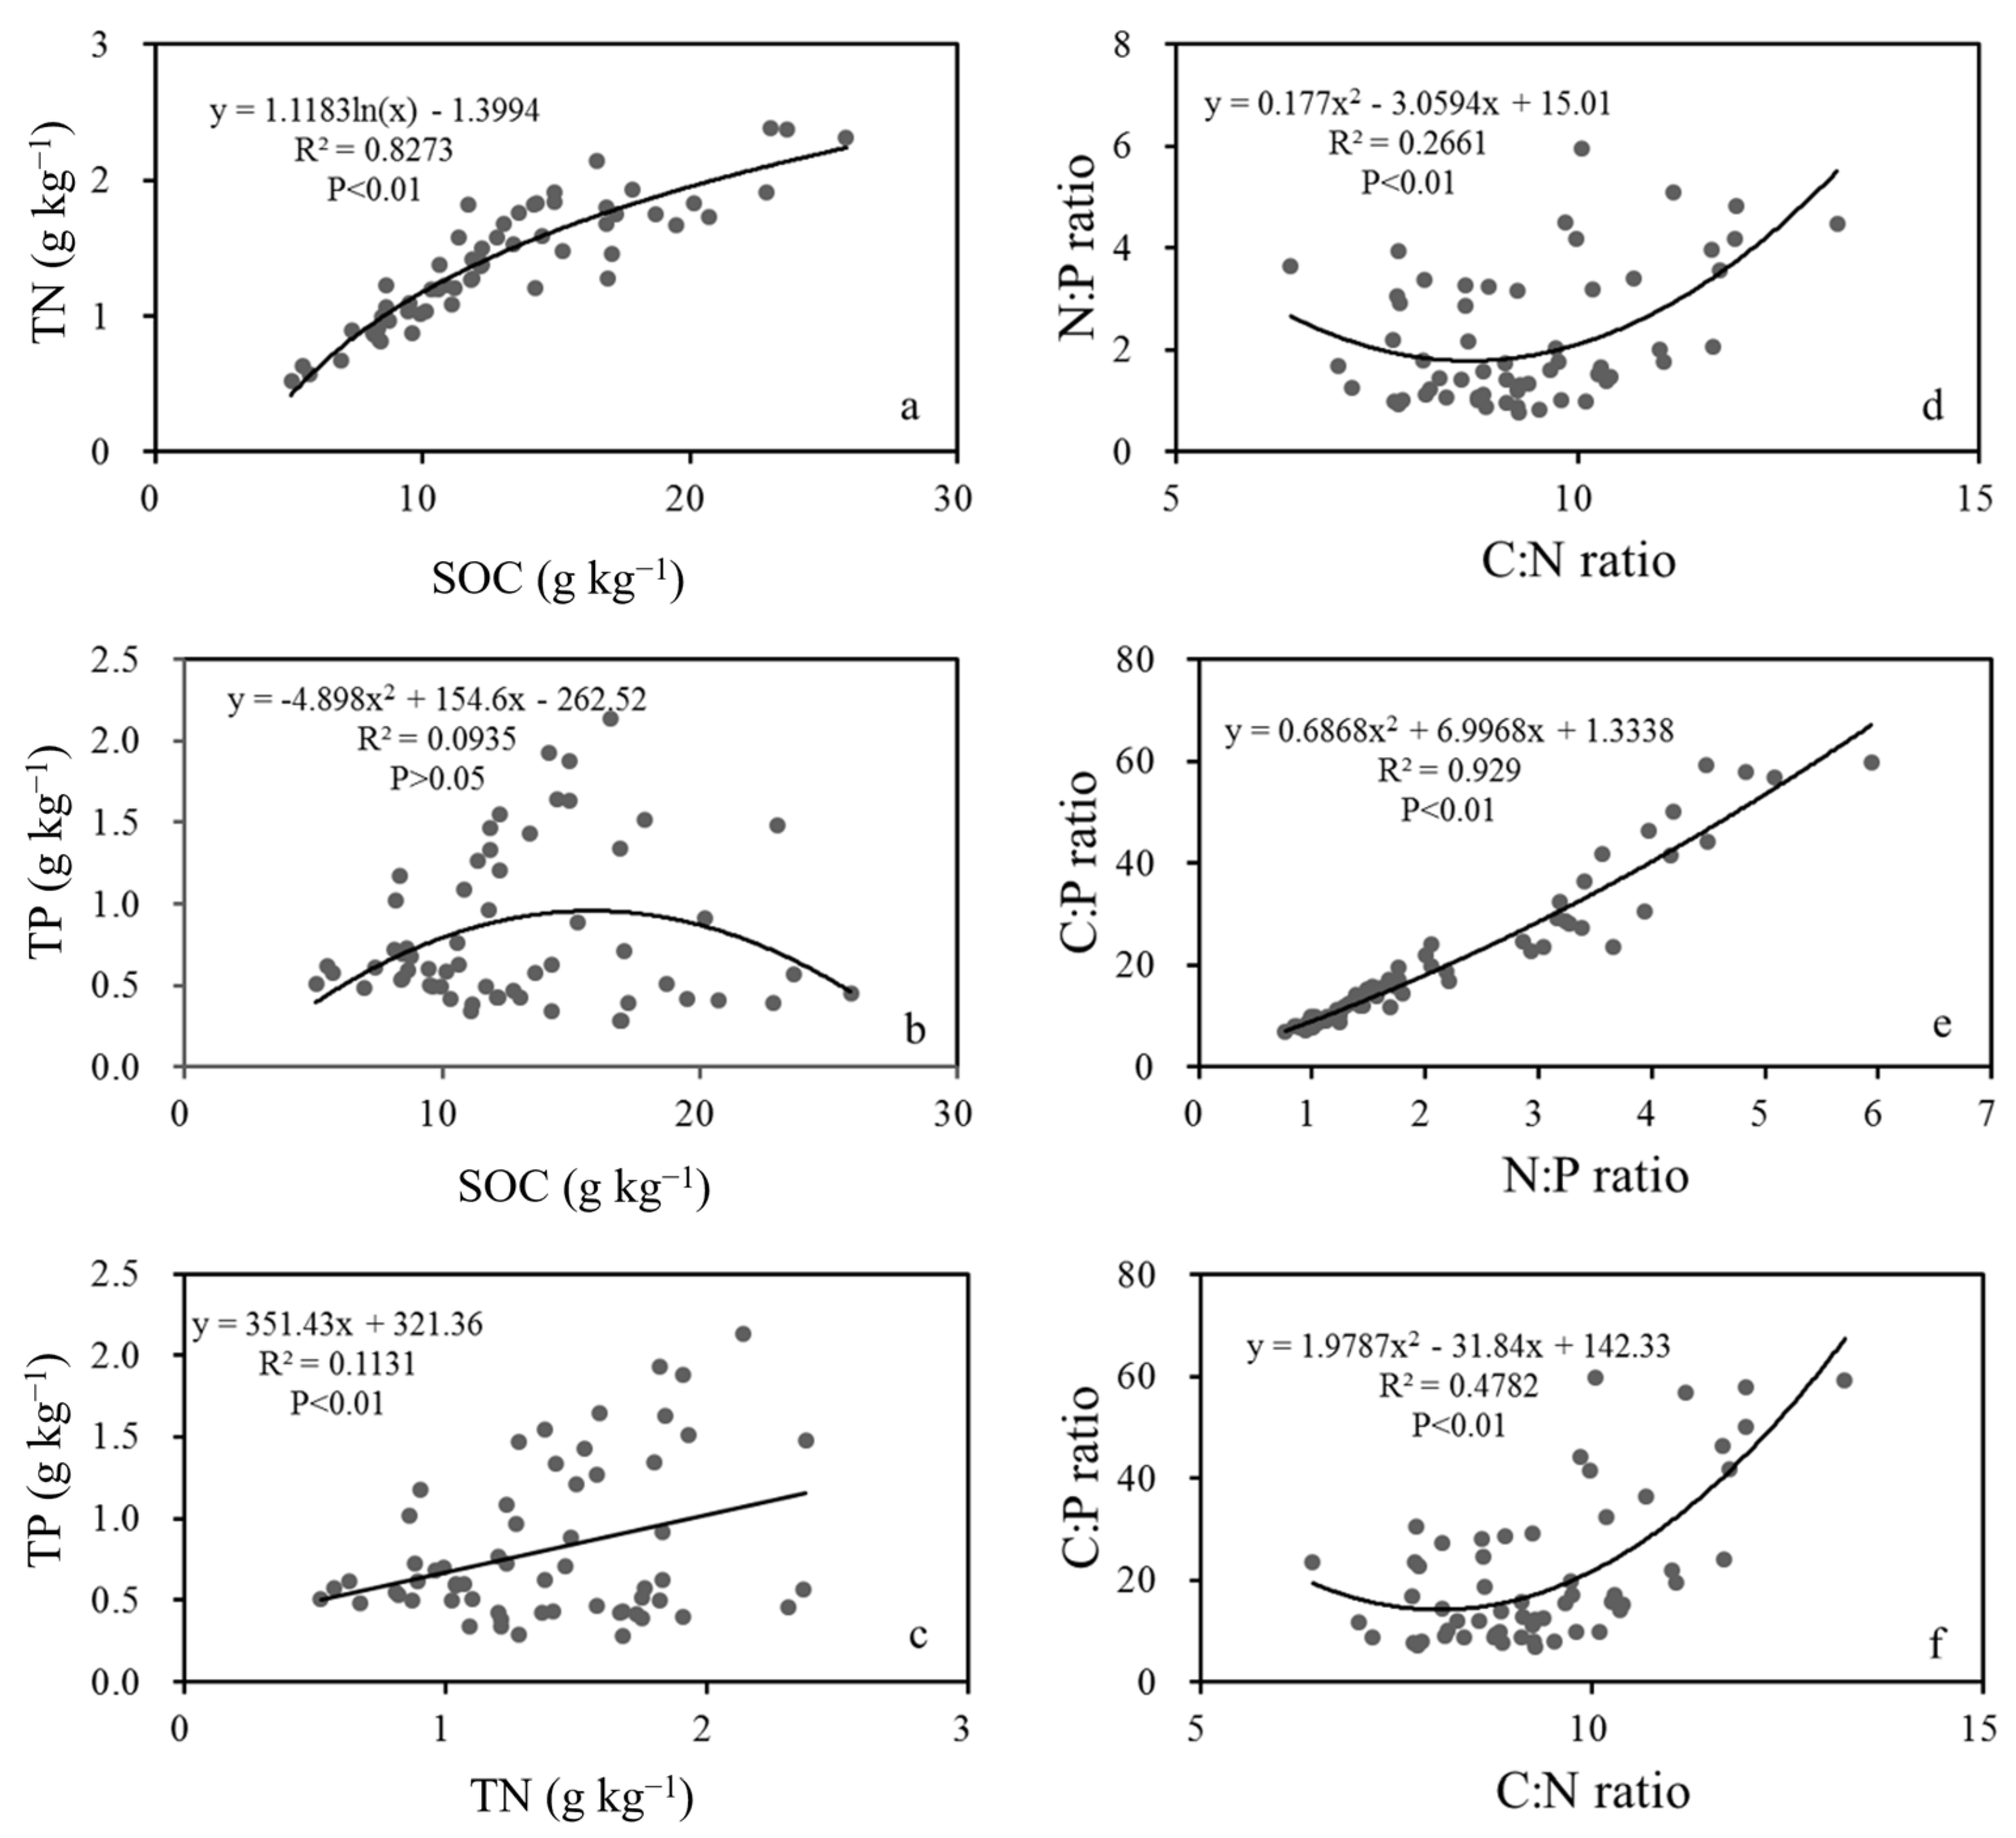
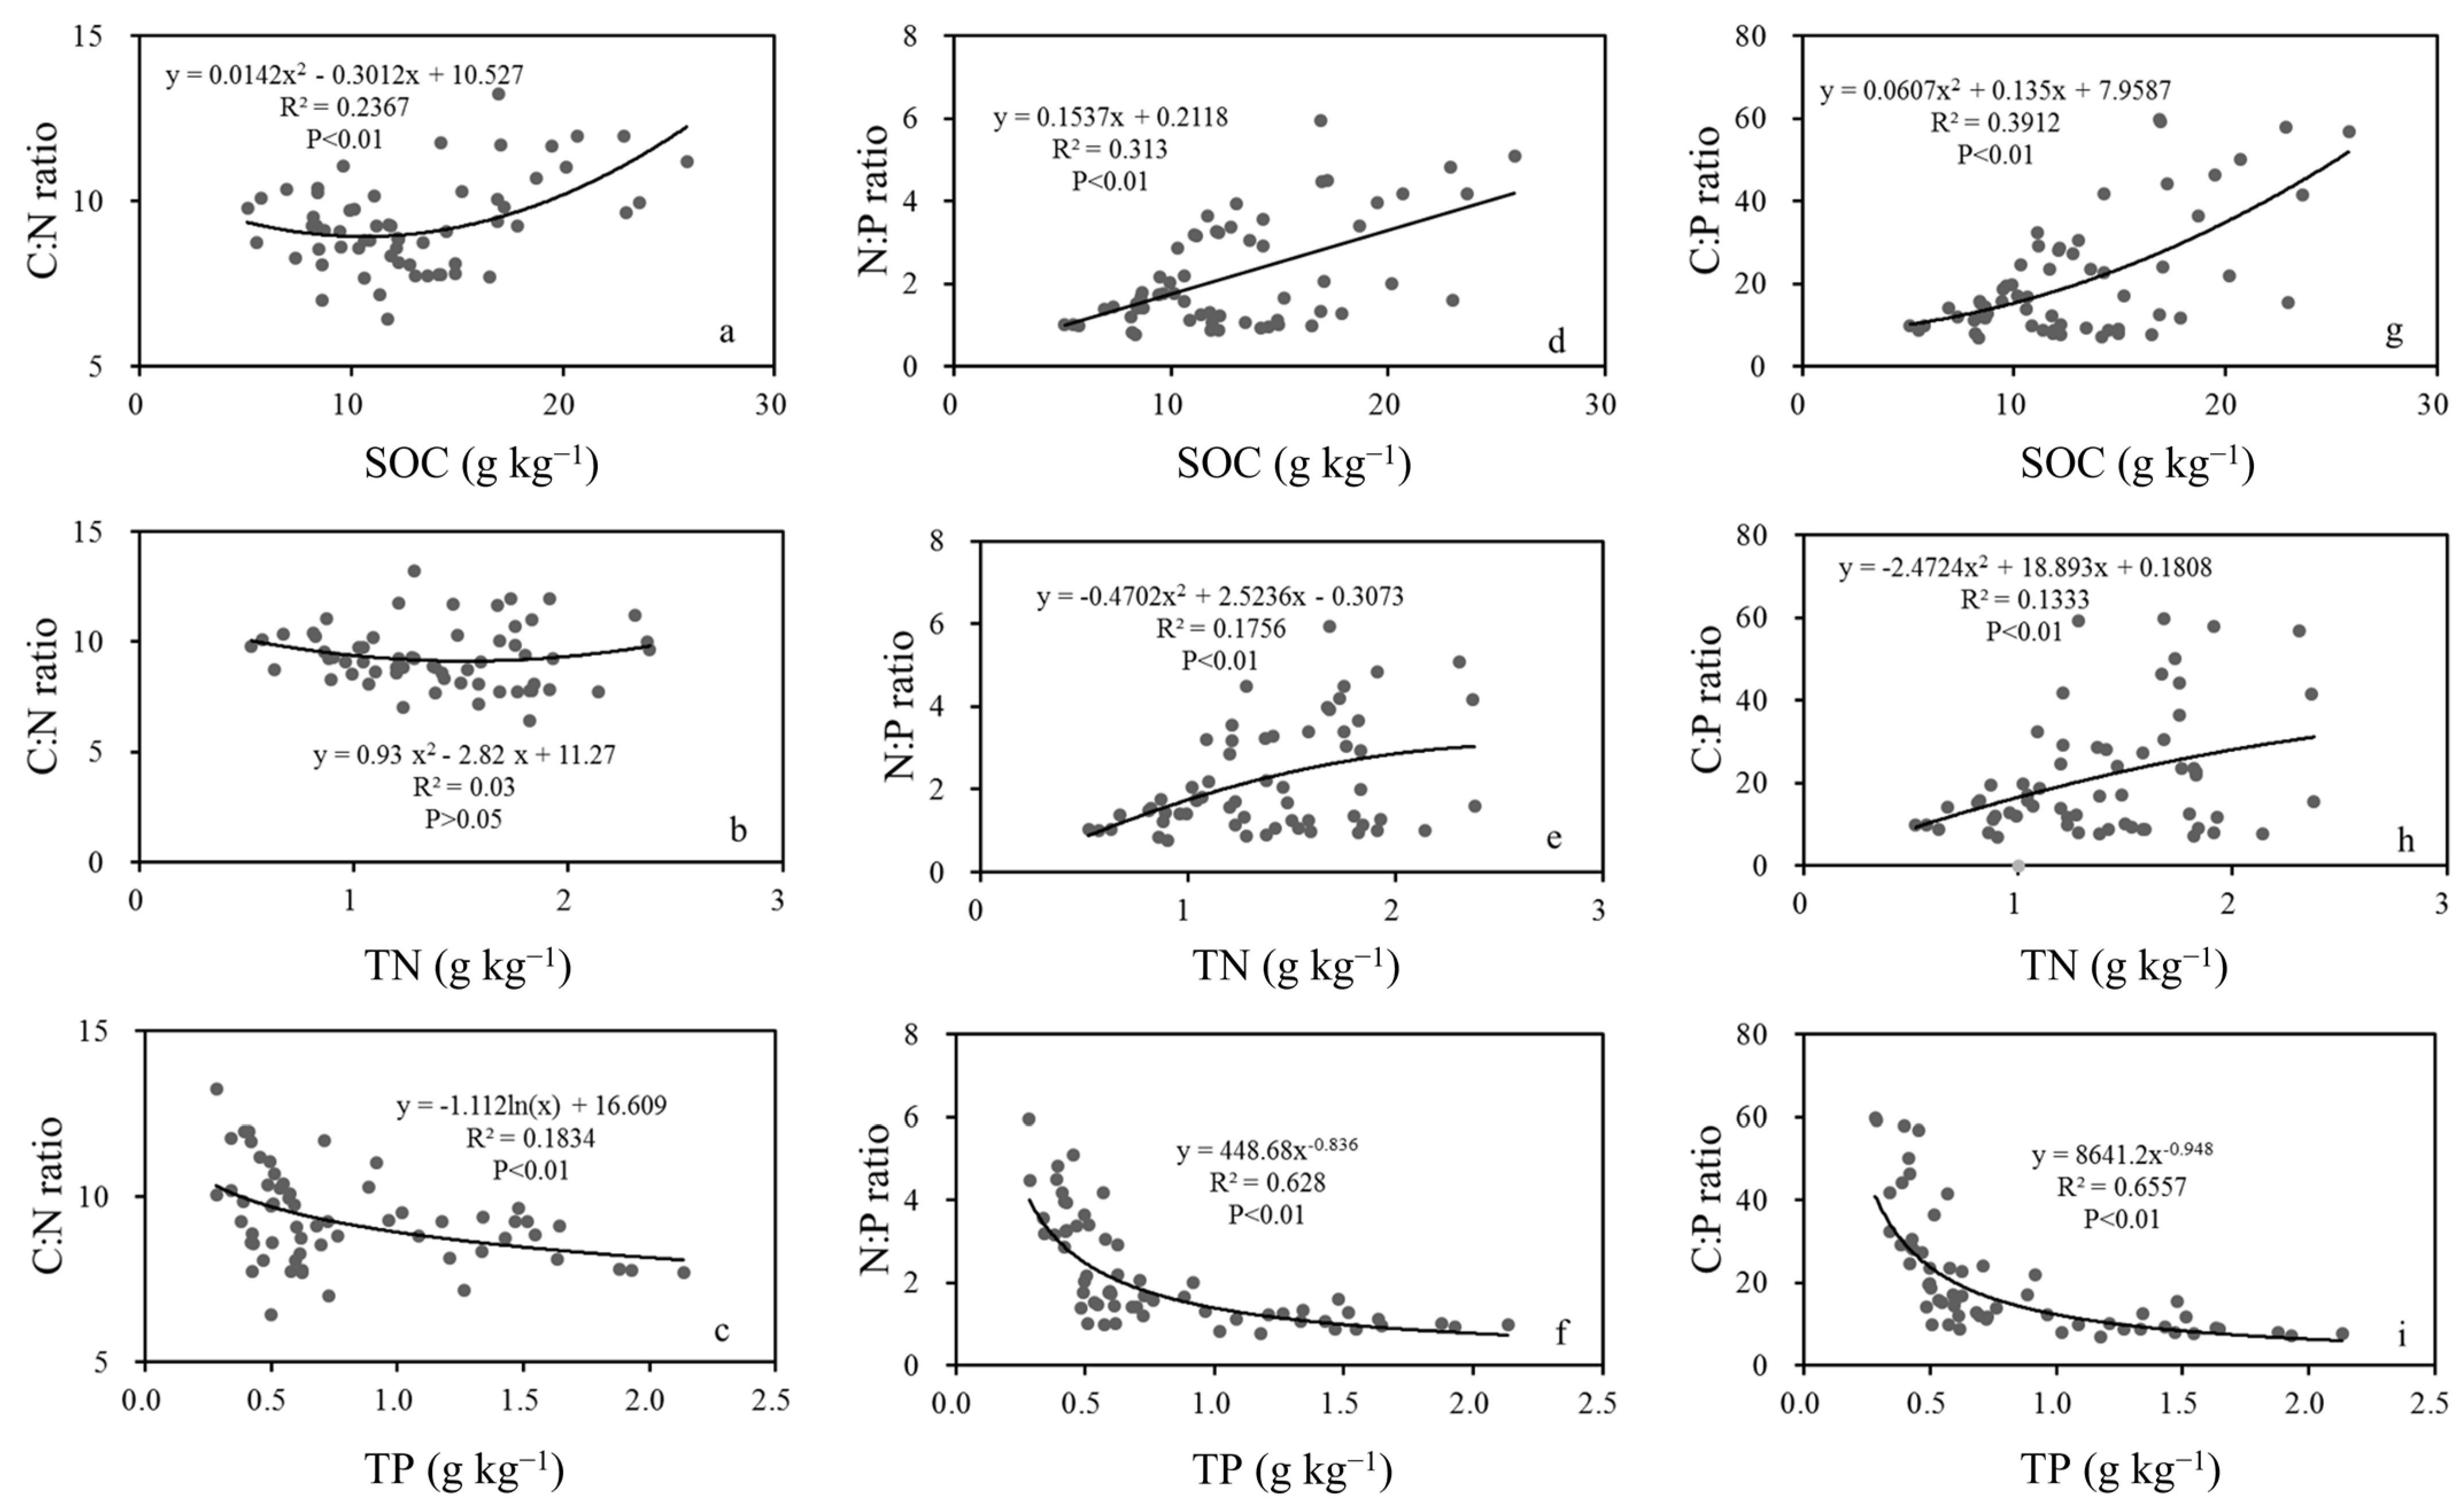
3.3. Relationship between Soil Stoichiometric Characteristics

Coupling relationship existed among SOC, TN, and TP concentrations (Figure 5). A significant logarithmic relationship was detected between SOC and TN concentration (R2 = 0.8273, p < 0.01). The concentration of TN increased significantly with the increase in SOC concentration. A significant linear relationship was demonstrated between TN and TP concentration (p < 0.01) with a low coefficient of determination (R2 = 0.1131). However, no evident relationship was found between SOC and TP (p > 0.05). Additionally, there was a significant quadratic function relationship for the three soil measurement ratios (p < 0.01) with R2 ranging from 0.2661 for C:N with N:P to 0.9290 of C:P with N:P, respectively.
The relationships between SOC, TN, and TP concentrations and the stoichiometry ratios in the study catchment were presented in Figure 6. An extremely significant quadratic function relationships for SOC with C:N and C:P were identified (p < 0.01), and strikingly apparent linear relationship for SOC with N:P was also found (p < 0.01) with a low R2 value of 0.313. Different from C:N value, the ratios of N:P and C:P increased with the increase in SOC content Our results recorded R2 of 0.03, 0.1756, 0.1333 for TN with C:N, N:P, and C:P in different quadratic function relationships, respectively. There was no statistically significant relationship (p < 0.05) between TN and C:N. On the contrary, the relationships for TN with N:P and C:P displayed a statistical significance at p < 0.01. Furthermore, N:P and C:P increased with the increase in TN concentration. Additionally, the logarithmic model applied to the relationship between TP and C:N, and power function was applicable for TP with N:P and C:P, and the coefficient of determination (i.e., R2) of those three relationships were 0.1834, 0.628, and 0.6557, respectively. The ratios of C:N, N:P, and C:P decreased with the increase in TP concentration. Compared with N:P and C:P, C:N showed a more gradual downward trend. Additionally, the main control elements of different stoichiometric ratios varied. Looking at the higher value of R2 (0.2367), we can deduct that SOC concentration has significantly impacted the ratio of C:N. Furthermore, consideration of high coefficient of determination values of TP with N:P (0.628) and C:P (0.6557), TP concentration was regarded as the major factor affecting N:P and C:P, followed by SOC and TN concentrations. Therefore, the relationships between SOC, TN, and TP contents and their stoichiometric ratios were a more complex non-linear relation rather than a simple linear relationship.
According to the Pearson correlation analysis of six soil stoichiometric parameters (Table 2), varied degrees of correlations were presented. There was a positive correlation between SOC and TN (0.888), SOC and C:N (0.396), SOC and N:P (0.560), SOC and C:P (0.615), TN and TP (0.336), TN and N:P (0.410), TN and C:P (0.363), C:N and N:P (0.383), C:N and C:P (0.602), and N:P and C:P (0.961). Moreover, a significant negative correlation between TP and C:N (−0.389), TP and N:P (−0.651), and TP and C:P (−0.622) was found.

4. Discussion

4.1. C-N-P Stoichiometry under Different Particle Size

Various potential relationships between particle size and particulate matter parameters for elemental geochemistry were illustrated by existing study [25,26]. The same is true between particle size and carbon and nitrogen parameters [24]. In the current study, the concentrations of C-N-P stoichiometry varied with different particle sizes. However, the variation rules of properties (SOC, TN, and TP) and the stoichiometry ratios with different particle sizes were inconsistent. Additionally, there were no significant differences in soil C-N-P stoichiometry in different particle size groups except for C:N (p < 0.05).

4.2. Particle-Size-Dependent Soil C-N-P Stoichiometry

Nutrient availability may restrict vegetation productivity in many ecosystems [27]. SOC has been recognized as an indicator of soil quality [28,29,30], which has a noticeable influence on soil fertility and function. In this study site, the concentrations of SOC in different land use types of each particle size group showed significant differences (p < 0.05). For example, concentrations of SOC in forest and orchards are significantly higher than that of arable land among the three particle size groups (p < 0.05). The difference of SOC content among land use types is the consequence of long-term decomposition, which mainly reflects drainage and land use effects [31]. Moreover, the great effects on C:N:P stoichiometry by anthropogenic cultivation of reed-dominated coastal wetlands in the Yellow River Delta has been confirmed [1]. However, there was no significant difference in SOC content of the same type of land use, expect in paddy fields, in different particle size (p < 0.05). The contents of TN and TP presented a similar pattern. Significant differences were found between different land use types, while it was difficult to find significant differences among different particle sizes of one kind of land use type (p < 0.05). That is, particle size had a potential effect on concentrations of SOC, TN and TP without statistically significant. In contrast, land use type was a preferred impact factor to the concentrations of SOC, TN and TP.
The maximum concentrations of both SOC and TN appeared in forest, while the lowest values emerged in arable land. SOC content could be reduced when forest was converted to arable land due to the erosion of topsoil organic matter [32,33,34]. Farming practices destroyed the original structure of the topsoil, and combined with rainfall and mountainous topography conditions would lead to the loss of surface carbon, meanwhile, inappropriate land management also contributed to significant reductions in SOC and TN. Relevant conclusion has been reported that extensive anthropogenic activities profoundly altered the soil C, N, and P contents and their stoichiometry of farmland [19]. Therefore, sloping arable land recorded the lowest concentrations of SOC and TN. The concentrations of SOC and TN in the forest topsoil were further increased by less disturbance and more accumulation of litter. Although the orchards were disturbed by human activities, it also has a complex root network and abundant ground litter to increase the contents of SOC and TN. Additionally, its canopy and litter reduced soil erosion. Correspondingly, it has the second highest SOC and TN contents, higher than paddy fields and sloping arable land. Previous study calculated the average SOC content of paddy fields (15.6 g kg−1), upland (9.6 g kg−1), forest (26.1 g kg−1), grassland (38.5 g kg−1), and waste-land (6.0 g kg−1) soils according to the Second State Soil Survey of China [13]. The SOC content under different land use types presented in this study area was lower than the corresponding land-use national average (sloping arable land was compared with upland, and orchards taken forest as a reference). The soil in the study area was classified as Regosols in FAO Taxonomy with low organic matter content, which may be the major reason. Generally speaking, plenty of studies have verified intense variability of soil C, N and P contents and their stoichiometry in different regions and spatial scales [19,35,36,37].
The content of TN was significantly correlated with SOC (Figure 5a) (0.888). Generally, TN concentration increased with the increase in SOC content [38]. SOC and TN are mainly derived from the decomposition of soil organic matter, litters, and root exudates, which are greatly influenced by the environment and vegetation types [39]. The order by concentration of SOC and TN in the four land use types presented similarity. Sloping arable land, paddy fields and orchards were strongly disturbed by human activities. The major crops of sloping arable land and paddy fields were annual herbs and annual gramineous plant. Both had sparse, fine root systems and little surface litter. Consequently, the content of organic matter synthesized by decomposition of litters transported into the soil was relatively low, resulting in relatively low contents of SOC and TN in the soil. The TN content in paddy fields was higher than that in sloping arable land, which may because the root system of rice was backfilled after harvest, then the nitrogen in the root system was absorbed and accumulated again. On the other hand, crops on sloping arable land were mainly corn, rapeseed, potatoes, and so on. After harvest, farmers usually remove the residual roots. Existing study revealed that soil organic matter and TN increased significantly after land use changed from arable land to paddy fields [30]. However, citrus orchards are mature dungarunga with complex root network and affluent surface litter. Hence, its soil SOC and TN contents were only slightly lower than forest. In brief, compared with natural vegetation, cultivation may lessen SOC and TN contents. Cheng and An [38] reported a similar conclusion for the study conducted in the Loess Plateau.
Phosphorus is a kind of sedimentary mineral which migrates slowly, and its content is mostly affected by the parent material of the soil. However, the concentration trend of TP in different land uses was ordered as follows: orchards > paddy fields > sloping arable land > forest. The TP concentration peaked in orchards (Figure 4c), which was much higher than the other three land uses. More times and amounts of phosphate fertilizer input in orchards may account for it. In addition, the phosphorus previously accumulated in the soil also increased the content of soil phosphorus due to its difficulty of being transported.
To sum up, the ratios of soil C:N, N:P, and C:P are indicators of soil nutrient status. In the current study, the soil C-N-P stoichiometry in different land use types showed significant differences within each particle size group (p < 0.05). Specifically, the C-N-P stoichiometry value of forest was generally significantly larger than other land uses. To some extent, agriculture induces a progressed state of soil degradation [31]. In addition, C:N ratio also exhibited statistical differences in varied particle sizes (p < 0.05). Combined with the characteristics of SOC and TN contents in different particle size groups, we supposed that C:N was mainly affected by land use directly [31]. Additionally, Wang et al. [40] considered that fertilizers exacerbate the imbalance of soil C and N stoichiometry. However, only N:P and C:P ratios of orchards presented significant differences with different particle sizes (p < 0.05). The large amount of fertilizer applied in the orchards may be the major reason. On the other hand, Tian et al. [41] reported the mean level of C:N, N:P, and C:P ratios of 12, 5, 61 across China, respectively. The ratios calculated in the studied area were lower than equivalent ratios calculated when considering national average.
Güsewell [42] comprehensively reviewed the research results of N:P mass ratio before 2004, and proposed that N:P < 10 or N:P > 20 should be considered as an indicator for evaluating vegetation productivity limited by N or P. The results of the present study presented the range of N:P less than 10, indicating that productivity in the study site mainly limited by soil TN concentration. Soil N:P ratios were also recognized for their potential diagnostic value, and they were easily altered by fertilization [17]. The ratio of surface soil N:P was significantly influenced by the content of SOC, TN, and TP (p < 0.01; Figure 5d–f). TP concentration accounted for 62.8% of the change in N:P ratio, followed by SOC concentration (31.3%), and finally TN concentration (17.56%). It has been proposed that a decrease in phosphorus may lead to an increase in the soil N:P ratio, since phosphorus was often leached and blocked in strongly weathered soils, while N was usually replenished by biological nitrogen fixation and atmospheric nitrogen deposition [43]. Compared to forest, the ratios of N:P under other three land use types decreased. Contrary to the hypothesis of [43], the Entisols soil of the study area, according to the USDA soil taxonomic system, was characterized by a slightly weathered soil, and the decreased N:P ratio could be induced by the increased phosphorus concentration. Fertilization is a necessary measure to ensure the growth of crops for three types of land use (sloping arable land, paddy fields, and orchards). The amount of fertilizer applied to economic orchards is much higher than sloping arable land and paddy fields. Consequently, the TP content in orchards was the highest and the N:P ratio was the lowest.
Soil C:P ratio is usually used as an important indicator of phosphorus availability. Generally, C:P < 200 means net mineralization, C:P > 300 implies the net immobilization, and C:P value between 200 and 300 means little change in soluble P concentration [18]. The value of soil C:P ratio in this catchment was extremely small (<50) suggesting the net mineralization. The variation trend of soil N:P and C:P ratio under different land use types conformed to the variation trend of phosphorus.

4.3. Relationship between Soil Stoichiometric Characteristics

The correlation analysis results (Figure 5) showed that SOC had significant correlation with TN (0.888), and TN and TP (0.336) (p < 0.01). Additionally, their interactions formed a certain coupling relationship. The correlation coefficient between SOC and TN was as high as 0.888 (Table 2), indicating that the response of SOC and TN contents to land use type and environmental factors were consistent. Similar results were reported in previous researches [14,44].
There were several coupling relationships between SOC, TN, and TP content and their stoichiometric ratios (Figure 6). Linear model was applicable to SOC with N:P and TN with TP. Logarithmic model was most appropriate for SOC with TN and TP with C:N. The optimal fitting model for TP with N:P and TP with C:P was power function. Various quadratic function relationships were presented for the others. Nonlinear correlations between soil nutrient contents, and their stoichiometric ratios were found in a karst rocky desertification ecosystem, southwest China [45].

5. Conclusions

This study attempted to explored the soil nutrient contents and their stoichiometry characteristics of four land use types at different soil particle size (<32 µm, <63 µm, and <125 µm) in a typical agricultural catchment of the Three Gorges Reservoir Region, to reveal the effect of particle sizes and land use types on soil C-N-P stoichiometry. The results indicated that land use type has significant impacts on SOC, TN, and TP contents and their stoichiometry (p < 0.01), while particle size has a potential influence on nutrient contents and their stoichiometry without statistical significance except C:N (p < 0.05). Further studies should be conducted to explore the relationship between particle size and soil properties (SOC, TN, TP and soil stoichiometry).
At the small catchment scale, natural conditions converged, and the soil stoichiometric indexes were profoundly affected by human cultivation behaviors. SOC contents of the four land use types in three particle size groups were ranked as: arable land < paddy fields < orchards < forest, the order of TP content was: forest < paddy fields < arable land <orchards, N:P and C:P ratios presented a rand-size relationship as orchards <arable land < paddy fields < forest. Furthermore, various coupling relationships (including linear and nonlinear relationship) were identified between nutrient contents and their stoichiometric ratios. The coupling relationships of soil properties (SOC, TN, TP, and soil stoichiometry) vary from study to study. The reasons for the inconsistent results of different studies need further research.

Author Contributions

Conceptualization, T.C. and Z.S.; methodology, T.C.; software, T.C.; validation, T.C., Z.S. and A.W.; formal analysis, T.C.; investigation, T.C.; resources, T.C.; data curation, T.C.; writing—original draft preparation, T.C.; writing—review and editing, Z.S. and A.W.; visualization, T.C.; supervision, Z.S. and A.W.; project administration, Z.S.; funding acquisition, A.W. All authors have read and agreed to the published version of the manuscript.

Funding

This research was funded by the National Key R and D Program of China, grant number 2017YFD0800505.

Institutional Review Board Statement

Not applicable.

Informed Consent Statement

Not applicable.

Data Availability Statement

Not applicable.

Conflicts of Interest

The authors declare no conflict of interest.

References

  1. Qu, F.; Yu, J.; Du, S.; Li, Y.; Lv, X.; Ning, K.; Wu, H.; Meng, L. Influences of anthropogenic cultivation on C, N and P stoichiometry of reed-dominated coastal wetlands in the Yellow River Delta. Geoderma 2014, 235–236, 227–232. [Google Scholar] [CrossRef]
  2. Zheng, S.; Xia, Y.; Hu, Y.; Chen, X.; Rui, Y.; Gunina, A.; He, X.; Ge, T.; Wu, J.; Su, Y.; et al. Stoichiometry of carbon, nitrogen, and phosphorus in soil: Effects of agricultural land use and climate at a continental scale. Soil Till. Res. 2021, 209, 104903. [Google Scholar] [CrossRef]
  3. Alberti, G.; Vicca, S.; Inglima, I.; Belelli-Marchesini, L.; Genesio, L.; Miglietta, F.; Marjanović, H.; Martinez, C.; Matteucci, G.; D’Andrea, E.; et al. Soil C:N stoichiometry controls carbon sink partitioning between above-ground tree biomass and soil organic matter in high fertility forests. IForest 2015, 8, 195–206. [Google Scholar] [CrossRef] [Green Version]
  4. Yang, Z.; Baoyin, T.; Minggagud, H.; Sun, H.; Li, F.Y. Recovery succession drives the convergence, and grazing versus fencing drives the divergence of plant and soil N/P stoichiometry in a semiarid steppe of Inner Mongolia. Plant Soil 2017, 420, 303–314. [Google Scholar] [CrossRef]
  5. Li, Y.; Liang, S.; Zhao, Y.; Li, W.; Wang, Y. Machine learning for the prediction of L. chinensis carbon, nitrogen and phosphorus contents and understanding of mechanisms underlying grassland degradation. J. Environ. Manag. 2017, 192, 116–123. [Google Scholar] [CrossRef] [PubMed]
  6. Chen, L.; Li, P.; Yang, Y. Dynamic patterns of nitrogen: Phosphorus ratios in forest soils of China under changing environment. J. Geophys. Res.-Biogeo. 2016, 121, 2410–2421. [Google Scholar] [CrossRef]
  7. Lucas-Borja, M.E.; Delgado-Baquerizo, M. Plant diversity and soil stoichiometry regulates the changes in multifunctionality during pine temperate forest secondary succession. Sci. Total Environ. 2019, 697, 134204. [Google Scholar] [CrossRef]
  8. Bai, Y.; Chen, S.; Shi, S.; Qi, M.; Liu, X.; Wang, H.; Wang, Y.; Jiang, C. Effects of different management approaches on the stoichiometric characteristics of soil C, N, and P in a mature Chinese fir plantation. Sci. Total Environ. 2020, 723, 137868. [Google Scholar] [CrossRef]
  9. Qiao, Y.; Wang, J.; Liu, H.M.; Huang, K.; Yang, Q.S.; Lu, R.L.; Yan, L.M.; Wang, X.H.; Xia, J.Y. Depth-dependent soil C-N-P stoichiometry in a mature subtropical broadleaf forest. Geoderma 2020, 370, 9. [Google Scholar] [CrossRef]
  10. Yue, K.; Fornara, D.A.; Yang, W.; Peng, Y.; Li, Z.; Wu, F.; Peng, C. Effects of three global change drivers on terrestrial C:N:P stoichiometry: A global synthesis. Glob. Chang. Biol. 2017, 23, 2450–2463. [Google Scholar] [CrossRef]
  11. Yu, Z.; Wang, M.; Huang, Z.; Lin, T.C.; Vadeboncoeur, M.A.; Searle, E.B.; Chen, H.Y.H. Temporal changes in soil C-N-P stoichiometry over the past 60 years across subtropical China. Glob. Chang. Biol. 2018, 24, 1308–1320. [Google Scholar] [CrossRef]
  12. Yang, Y.; Fang, J.; Ji, C.; Datta, A.; Li, P.; Ma, W.; Mohammat, A.; Shen, H.; Hu, H.; Knapp, B.O.; et al. Stoichiometric shifts in surface soils over broad geographical scales: Evidence from China’s grasslands. Glob. Ecol. Biogeogr. 2014, 23, 947–955. [Google Scholar] [CrossRef]
  13. Xie, Z.; Zhu, J.; Liu, G.; Cadisch, G.; Hasegawa, T.; Chen, C.; Sun, H.; Tang, H.; Zeng, Q. Soil organic carbon stocks in China and changes from 1980s to 2000s. Glob. Chang. Biol. 2007, 13, 1989–2007. [Google Scholar] [CrossRef]
  14. Cleveland, C.C.; Liptzin, D. C:N:P stoichiometry in soil: Is there a “Redfield ratio” for the microbial biomass? Biogeochemistry 2007, 85, 235–252. [Google Scholar] [CrossRef]
  15. Shi, S.; Peng, C.; Wang, M.; Zhu, Q.; Yang, G.; Yang, Y.; Xi, T.; Zhang, T. A global meta-analysis of changes in soil carbon, nitrogen, phosphorus and sulfur, and stoichiometric shifts after forestation. Plant Soil 2016, 407, 323–340. [Google Scholar] [CrossRef]
  16. Feng, D.; Bao, W.; Pang, X. Consistent profile pattern and spatial variation of soil C/N/P stoichiometric ratios in the subalpine forests. J. Soils Sed. 2017, 17, 2054–2065. [Google Scholar] [CrossRef]
  17. Peñuelas, J.; Sardans, J.; Rivas-ubach, A.; Janssens, I.A. The human-induced imbalance between C, N and P in Earth’s life system. Glob. Chang. Biol. 2012, 18, 3–6. [Google Scholar] [CrossRef]
  18. Bui, E.N.; Henderson, B.L. C:N:P stoichiometry in Australian soils with respect to vegetation and environmental factors. Plant Soil 2013, 373, 553–568. [Google Scholar] [CrossRef]
  19. Hu, B.; Xie, M.; Li, H.; Zhao, W.; Hu, J.; Jiang, Y.; Ji, W.; Li, S.; Hong, Y.; Yang, M.; et al. Stoichiometry of soil carbon, nitrogen, and phosphorus in farmland soils in southern China: Spatial pattern and related dominates. Catena 2022, 217, 106468. [Google Scholar] [CrossRef]
  20. He, X.; Bao, Y.; Nan, H.; Xiong, D.; Wang, L.; Liu, Y.; Zhao, J. Tillage pedogenesis of purple soils in southwestern China. J. Mt. Sci.-Engl. 2009, 6, 205–210. [Google Scholar] [CrossRef]
  21. Bellanger, B.; Huon, S.; Velasquez, F.; Valles, V.; Girardin, C.; Mariotti, A. Monitoring soil organic carbon erosion with δ13C and δ15N on experimental field plots in the Venezuelan Andes. Catena 2004, 58, 125–150. [Google Scholar] [CrossRef]
  22. Wynn, J.G.; Bird, M.I.; Wong, V.N. Rayleigh distillation and the depth profile of 13C/12C ratios of soil organic carbon from soils of disparate texture in Iron Range National Park, Far North Queensland, Australia. Geochim. Cosmochim. Acta 2005, 69, 1961–1973. [Google Scholar] [CrossRef]
  23. Laceby, J.P.; Olley, J.; Pietsch, T.J.; Sheldon, F.; Bunn, S.E. Identifying subsoil sediment sources with carbon and nitrogen stable isotope ratios. Hydrol. Process 2015, 29, 1956–1971. [Google Scholar] [CrossRef] [Green Version]
  24. Laceby, J.P.; Huon, S.; Onda, Y.; Vaury, V.; Evrard, O. Do forests represent a long-term source of contaminated particulate matter in the Fukushima Prefecture? J. Environ. Manag. 2016, 183, 742–753. [Google Scholar] [CrossRef] [Green Version]
  25. Russell, M.A.; Walling, D.E.; Hodgkinson, R.A. Suspended sediment sources in two small lowland agricultural catchments in the UK. J. Hydrol. 2001, 252, 1–24. [Google Scholar] [CrossRef]
  26. Smith, H.G.; Blake, W.H. Sediment fingerprinting in agricultural catchments: A critical re-examination of source discrimination and data corrections. Geomorphology 2014, 204, 177–191. [Google Scholar] [CrossRef]
  27. Shiels, A.B.; Sanford, R.L. Soil nutrient differences between two krummholz-form tree species and adjacent alpine tundra. Geoderma 2001, 102, 205–217. [Google Scholar] [CrossRef]
  28. Pulleman, M.M.; Bouma, J.; van Essen, E.A.; Meijles, E.W. Soil Organic matter content as a function of different land use history. Soil Sci. Soc. Am. J. 2000, 64, 689–693. [Google Scholar] [CrossRef] [Green Version]
  29. Lal, R.; Kimble, J.M. Conservation tillage for carbon sequestration. Nutr. Cycl. Agroecosys 1997, 49, 243–253. [Google Scholar] [CrossRef]
  30. Huang, B.; Sun, W.; Zhao, Y.; Zhu, J.; Yang, R.; Zou, Z.; Ding, F.; Su, J. Temporal and spatial variability of soil organic matter and total nitrogen in an agricultural ecosystem as affected by farming practices. Geoderma 2007, 139, 336–345. [Google Scholar] [CrossRef]
  31. Leifeld, J.; Klein, K.; Wüst-Galley, C. Soil organic matter stoichiometry as indicator for peatland degradation. Sci Rep.-UK 2020, 10, 7634. [Google Scholar] [CrossRef] [PubMed]
  32. Brown, S.; Lugo, A.E. Biomass of tropical forests: A new estimate based on forest volumes. Science 1984, 223, 1290–1293. [Google Scholar] [CrossRef] [PubMed]
  33. Detwiler, R.P. Land use change and the global carbon cycle: The role of tropical soils. Biogeochemistry 1986, 2, 67–93. [Google Scholar] [CrossRef]
  34. Mann, L.K. Changes in soil carbon storage after cultivation. Soil Sci. 1986, 142, 5. [Google Scholar] [CrossRef]
  35. Hui, D.; Yang, X.; Deng, Q.; Liu, Q.; Wang, X.; Yang, H.; Ren, H. Soil C:N:P stoichiometry in tropical forests on Hainan Island of China: Spatial and vertical variations. Catena 2021, 201, 105228. [Google Scholar] [CrossRef]
  36. Liu, J.; Gou, X.; Zhang, F.; Bian, R.; Yin, D. Spatial patterns in the C:N:P stoichiometry in Qinghai spruce and the soil across the Qilian Mountains, China. Catena 2021, 196, 104814. [Google Scholar] [CrossRef]
  37. Fang, Z.; Li, D.D.; Jiao, F.; Yao, J.; Du, H.T. The Latitudinal Patterns of Leaf and Soil C:N:P Stoichiometry in the Loess Plateau of China. Front. Plant Sci. 2019, 10, 85. [Google Scholar] [CrossRef] [Green Version]
  38. Cheng, M.; An, S. Responses of soil nitrogen, phosphorous and organic matter to vegetation succession on the Loess Plateau of China. J. Arid Land 2015, 7, 216–223. [Google Scholar] [CrossRef] [Green Version]
  39. Batjes, N.H. Total carbon and nitrogen in the soils of the world. Eur. J. Soil Sci. 1996, 47, 151–163. [Google Scholar] [CrossRef]
  40. Wang, H.; Ren, T.; Müller, K.; Van Zwieten, L.; Wang, H.; Feng, H.; Xu, C.; Yun, F.; Ji, X.; Yin, Q.; et al. Soil type regulates carbon and nitrogen stoichiometry and mineralization following biochar or nitrogen addition. Sci. Total Environ. 2021, 753, 141645. [Google Scholar] [CrossRef]
  41. Tian, H.; Chen, G.; Zhang, C.; Melillo, J.M.; Hall, C.A.S. Pattern and variation of C:N:P ratios in China’s soils: A synthesis of observational data. Biogeochemistry 2010, 98, 139–151. [Google Scholar] [CrossRef]
  42. Güsewell, S. N: P ratios in terrestrial plants: Variation and functional significance. New Phytol. 2004, 164, 243–266. [Google Scholar] [CrossRef] [PubMed]
  43. Vitousek, P.M.; Porder, S.; Houlton, B.Z.; Chadwick, O.A. Terrestrial phosphorus limitation: Mechanisms, implications, and nitrogen-phosphorus interactions. Ecol. Appl. 2010, 20, 5–15. [Google Scholar] [CrossRef] [PubMed] [Green Version]
  44. Yang, Y.; Luo, Y. Carbon: Nitrogen stoichiometry in forest ecosystems during stand development. Glob. Ecol. Biogeogr. 2011, 20, 354–361. [Google Scholar] [CrossRef]
  45. Wang, L.; Wang, P.; Sheng, M.; Tian, J. Ecological stoichiometry and environmental influencing factors of soil nutrients in the karst rocky desertification ecosystem, southwest China. Glob. Ecol. Conserv. 2018, 16, e00449. [Google Scholar] [CrossRef]
Figure 1. (a) Elevation map of the Three Gorges Reservoir area showing Zhong County. (b) Elevation map of Zhong County revealing the study area of Shipanqiu catchment. (c) Distribution of land use type and sampling sites in the study area.
Sustainability 15 02434 g001
Figure 2. Particle size distribution of sediments at the outlet of the studied catchment. Notes: The lines in orange, brown, and green represented the cumulative volumes of particle sizes of 125 µm, 63 µm, and 32 µm, respectively.
Sustainability 15 02434 g002
Figure 3. Statistics of (a) soil organic carbon (SOC); (b) total nitrogen (TN); (c) total phosphorus (TP); (d) C:N; (e) N:P; (f) C:P in three groups of particle size of Shipanqiu catchment. Notes: Different uppercase letters indicated the significant difference between different particle size (p < 0.05).
Sustainability 15 02434 g003
Figure 4. (a–f) Soil C-N-P stoichiometric characteristics of four land use types with three analytical particle sizes. Notes: Different uppercase letters indicated the significant difference between different land use types in the same particle size (p < 0.05). Different lowercase letters indicated the significant difference between different particle sizes of the same land use (p < 0.05).
Sustainability 15 02434 g004
Figure 5. The nutrient elements coupling relationship and soil stoichiometric ratios coupling relationship.
Sustainability 15 02434 g005
Figure 6. Relationship between nutrient concentrations and their soil stoichiometric ratios.
Sustainability 15 02434 g006
Table 1. p values of Kruskal–Wallis test between land use type and soil particle size.
IndexLand Use TypeSoil Particle Size
SOC0.0000.465
TN0.0000.001
TP0.0000.017
C:N0.0000.000
N:P 0.0000.985
C:P0.0000.291
Table 2. The Pearson correlation coefficient of soil stoichiometric parameters.
SOCTNTPC:N N:PC:P
SOC1
TN0.888 **1
TP0.1120.336 **1
C:N0.396 **−0.058−0.389 **1
N:P0.560 **0.410 **−0.651 **0.383 **1
C:P0.615 **0.363 **−0.622 **0.602 **0.961 **1
** is significant at level of 0.01.
Disclaimer/Publisher’s Note: The statements, opinions and data contained in all publications are solely those of the individual author(s) and contributor(s) and not of MDPI and/or the editor(s). MDPI and/or the editor(s) disclaim responsibility for any injury to people or property resulting from any ideas, methods, instructions or products referred to in the content.

