Article

Impact of Integrating Annual and Perennial Legumes under Coffea arabica on Sloping Land

by
Thaddeo Kahigwa Tibasiima
1,2,*,
Deous Mary Ekyaligonza
1,2,
John Patrick Kanahe Kagorora
2,*,
Jürgen Kurt Friedel
1,
Andreas Melcher
3,
Bosco Bwambale
2,
Edwin Akugizibwe
4 and
Bernhard Freyer
1
1
Department of Sustainable Agricultural Systems, Division of Organic Farming, University of Natural Resources and Life Sciences (BOKU), Gregor-Mendel-Strasse 33, 1180 Vienna, Austria
2
Faculty of Agriculture and Environmental Sciences, Mountains of the Moon University (MMU), Fort Portal P.O. Box 837, Uganda
3
Department of Sustainable Agricultural Systems, Institute for Development Research, University of Natural Resources and Life Sciences (BOKU), Peter-Jordan-Strasse 76, 1190 Vienna, Austria
4
Faculty of Science, Technology and Innovation, Mountains of the Moon University (MMU), Fort Portal P.O. Box 837, Uganda
*
Authors to whom correspondence should be addressed.
Sustainability 2023, 15(3), 2453; https://doi.org/10.3390/su15032453
Submission received: 15 November 2022 / Revised: 24 January 2023 / Accepted: 25 January 2023 / Published: 30 January 2023
(This article belongs to the Section Sustainable Agriculture)

Abstract

:
Above-ground biomass cover under Coffea arabica on sloping land is beneficial but difficult to sustain. Interplanting annual and perennial legumes can sustain the above-ground biomass cover, and improve soil fertility, yield, and profitability. This was tested on 26 sloping farms in a four-growing season experiment on undersowing C. arabica with new crop combinations: Mucuna pruriens var. utilis (T1); Millettia dura Dunn (T2); a combination of M. pruriens and M. dura (T3); and the control with a no-cover legume (T4). On each farm, all treatments followed a randomized single-block design. T3 produced 8.7 mt/ha/yr above-ground biomass that was significantly (p < 0.01) higher than other treatments and was increasing with the seasons. Under T3, plant-available nitrogen (N) and potassium (K) increased more than in other treatments. During the fourth season, coffee yield in T3 was 54%, 22%, and 11% higher than in T4, T2, and T1, respectively. The gross profit under T3 was 86% higher than in T4 in the fourth season. This indicates that interplanting a combination of M. pruriens and M. dura under C. arabica on sloping land can sustainably increase above-ground biomass cover, soil’s plant-available N and K, coffee yield, and profitability. Based on the results, the combination of M. pruriens and M. dura is recommended to optimize coffee production under the described conditions.

1. Introduction

In the tropics, smallholder farmers producing Coffea arabica predominantly use high-altitude sloping land for this purpose [1,2]. Despite such land being prone to degradation due to limited cover [3], it remains essential for high-altitude smallholder coffee-producing farmers [2,4]. Worldwide, coffee is generally the most important crop worth over USD 460 billion annually [5], consumed by over 30–40% of the world population with some individuals drinking over 9 kgs of coffee annually [6] of which C. arabica is the most valued [2,7]. In Uganda, Coffea arabica remains the primary source of livelihood for over 1.5 million (42%) smallholder farmers and contributes 30% of the country’s foreign exchange [4,8,9] with increasing annual export earnings above USD 862 million in 2022 and a potential of reaching USD 2.2 billion by 2025 [10]. Since 1920, the production of C. arabica in Uganda has been restricted to high-altitude sloping areas while the low land that is less sloping has been left for the production of robusta coffee which is preferred for being less labor-demanding compared to C. arabica. Additionally, in this area, C. arabica has been restricted to high altitudes because at this altitude the incidence of leaf rust (Hemileia vastatrix), and Antestia bugs is low [11]. The introduction of C. arabica in these areas led to the replacement of the mountain natural forest and vegetation cover which would otherwise support coffee production [12,13]. The reduced natural vegetation with a negative impact on microclimate, intense hand hoe tillage, and heavy rains leads to a loss of soil fertility and a reduction of up to 49% coffee yield [4,9,14,15,16].
In Uganda, on the Rwenzori Mountain, C. arabica is cultivated by 66% of the smallholder farmers on land of less than 1 ha [17,18,19,20]. This area faces high erosion rates of 28.9–37.5 mt/ha [21]. Furthermore, there is a negative nutrient balance due to nutrient mining by C. arabica and the lack of recirculation of coffee husks in the system. For example, annually 0.75 mt/ha of NPK is removed to produce 1.6 mt/ha of green coffee beans [9]. Worse still, due to climate change, most areas below 1400 m will be unsuitable for C. arabica production [2,15,18] thus restricting its production to more sloping land at higher altitudes [18,22]. Such land requires a fundamental change for resetting the cropping system to attain an economically attractive and sustainable production [23]. It is known that smallholder farmers can increase C. arabica production from 1.6 mt/ha to 3.2 mt/ha via appropriate management practices [9]. However, implementation of the known soil conservation methods such as contour bands, terraces, and mulching is hindered by the small farm sizes, high labor requirements, high maintenance costs, limited experience with feasible soil conservation methods, and technical knowledge [15,23,24,25,26,27,28,29,30]. Amidst these constraints, improving above-ground cover can offer a remedy without destructing the farming system in the already established coffee fields [31,32,33,34,35]. However, smallholder farmers generally find it challenging to raise the required biomass quantities for above-ground cover [36]. Additionally, above-ground cover that would be attained through integrating cover crops under C. arabica is considered labor-intensive [15,23]. A further hindrance to establishing cover crops is the livestock demand for forage [17,37]. Nevertheless, cover crops are known to be a sustainable strategy for transitioning into sustainable farming [38,39,40,41]. Particularly, legumes are considered important for their multiple benefits in the farming system such as sustaining soil nitrogen, reducing soil erosion, and increasing crop yield [39,42,43]. Cover legumes have been recommended as a feasible strategy for smallholder high-altitude C. arabica farmers [8,9,28,44]. Similarly, it has been demonstrated that cover crop mixtures increase biomass inputs in the soil [40,45,46]. For example, Mucuna pruriens, an annual climber can creep to cover the soil surface and attain full maturity within six growing months [47]. Generally, M. pruriens is known for its multiple benefits to smallholder farmers [48]. Specifically, M. pruriens produces up to 30 mt/ha/yr dry matter [47,49,50], accumulates above-ground biomass cover which reduces the cost of weed control [51,52,53], conserves soil moisture [50], increases crop yield [51,52], improves soil fertility by fixing up to 0.09–0.1 mt N/ha/yr [42,47,49,50,51], and increases carbon sequestration [48,54]. Mucuna pruriens reduces soil erosion on land slopes of 15–25% [55,56] and is among the best possible cover legumes for integration into coffee fields due to its fast establishment [9,57]. Mucuna pruriens offers a feasible strategy in farming systems better than artificial fertilizers [49,58]. However, the benefits of M. pruriens are known to vary with ecological specificity and thus require adaptation studies before introducing it in new farming systems [53,59]. Additionally, the biomass generated by M. pruriens is known to fluctuate due to continuous planting [47,53]. Thus, we hypothesize that combining M. pruriens with a perennial agroforestry legume can enable sustaining above-ground biomass cover.
Agroforestry legumes have several benefits in coffee farming systems such as enhanced soil organic carbon, an increase of nitrogen [44,60], and an improvement of the microclimate that favors the performance of C. arabica [61,62,63]. One such perennial leguminous tree with the potential of fulfilling the numerous benefits of agroforestry but is not yet studied in farming systems is the Millettia dura. This tree is indigenous to the Rwenzori area and was first found on river Dura in Kibale National park, Uganda [64]. Milletia dura is a fast-growing leguminous tree that grows up to 13 m tall, with a deep root feeding system, and takes approximately ten years to fully mature [64]. The tree is shade tolerant, grows at varying altitudes (1200–1650 m), accepts a broad range of soil conditions [65], and has a high stem density [66]. In addition, M. dura has numerous medicinal values, is resistant to pests such as termites, and produces strong agricultural tool handles [67,68,69]. Studies on Millettia ferruginea, a relative of M. dura, have reported a positive impact on crop yield and soil properties such as textural fractions, organic carbon, total nitrogen, and available phosphorus [70,71]. However, there are no studies on M. dura in the farming system. Rather, most studies on the genus Milletia have focused on its medicinal value [72]. This study attempted to understand the impact of integrating this perennial leguminous tree with an annual leguminous cover crop in the farming system. The study aimed to find out if integrating a combination of M. pruriens and M. dura under C. arabica on sloping land can: (1) increase above-ground biomass cover, (2) improve the availability of soil macro nutrients, (3) increase coffee yield, and (4) increase profit from C. arabica on sloping land.

2. Materials and Methods

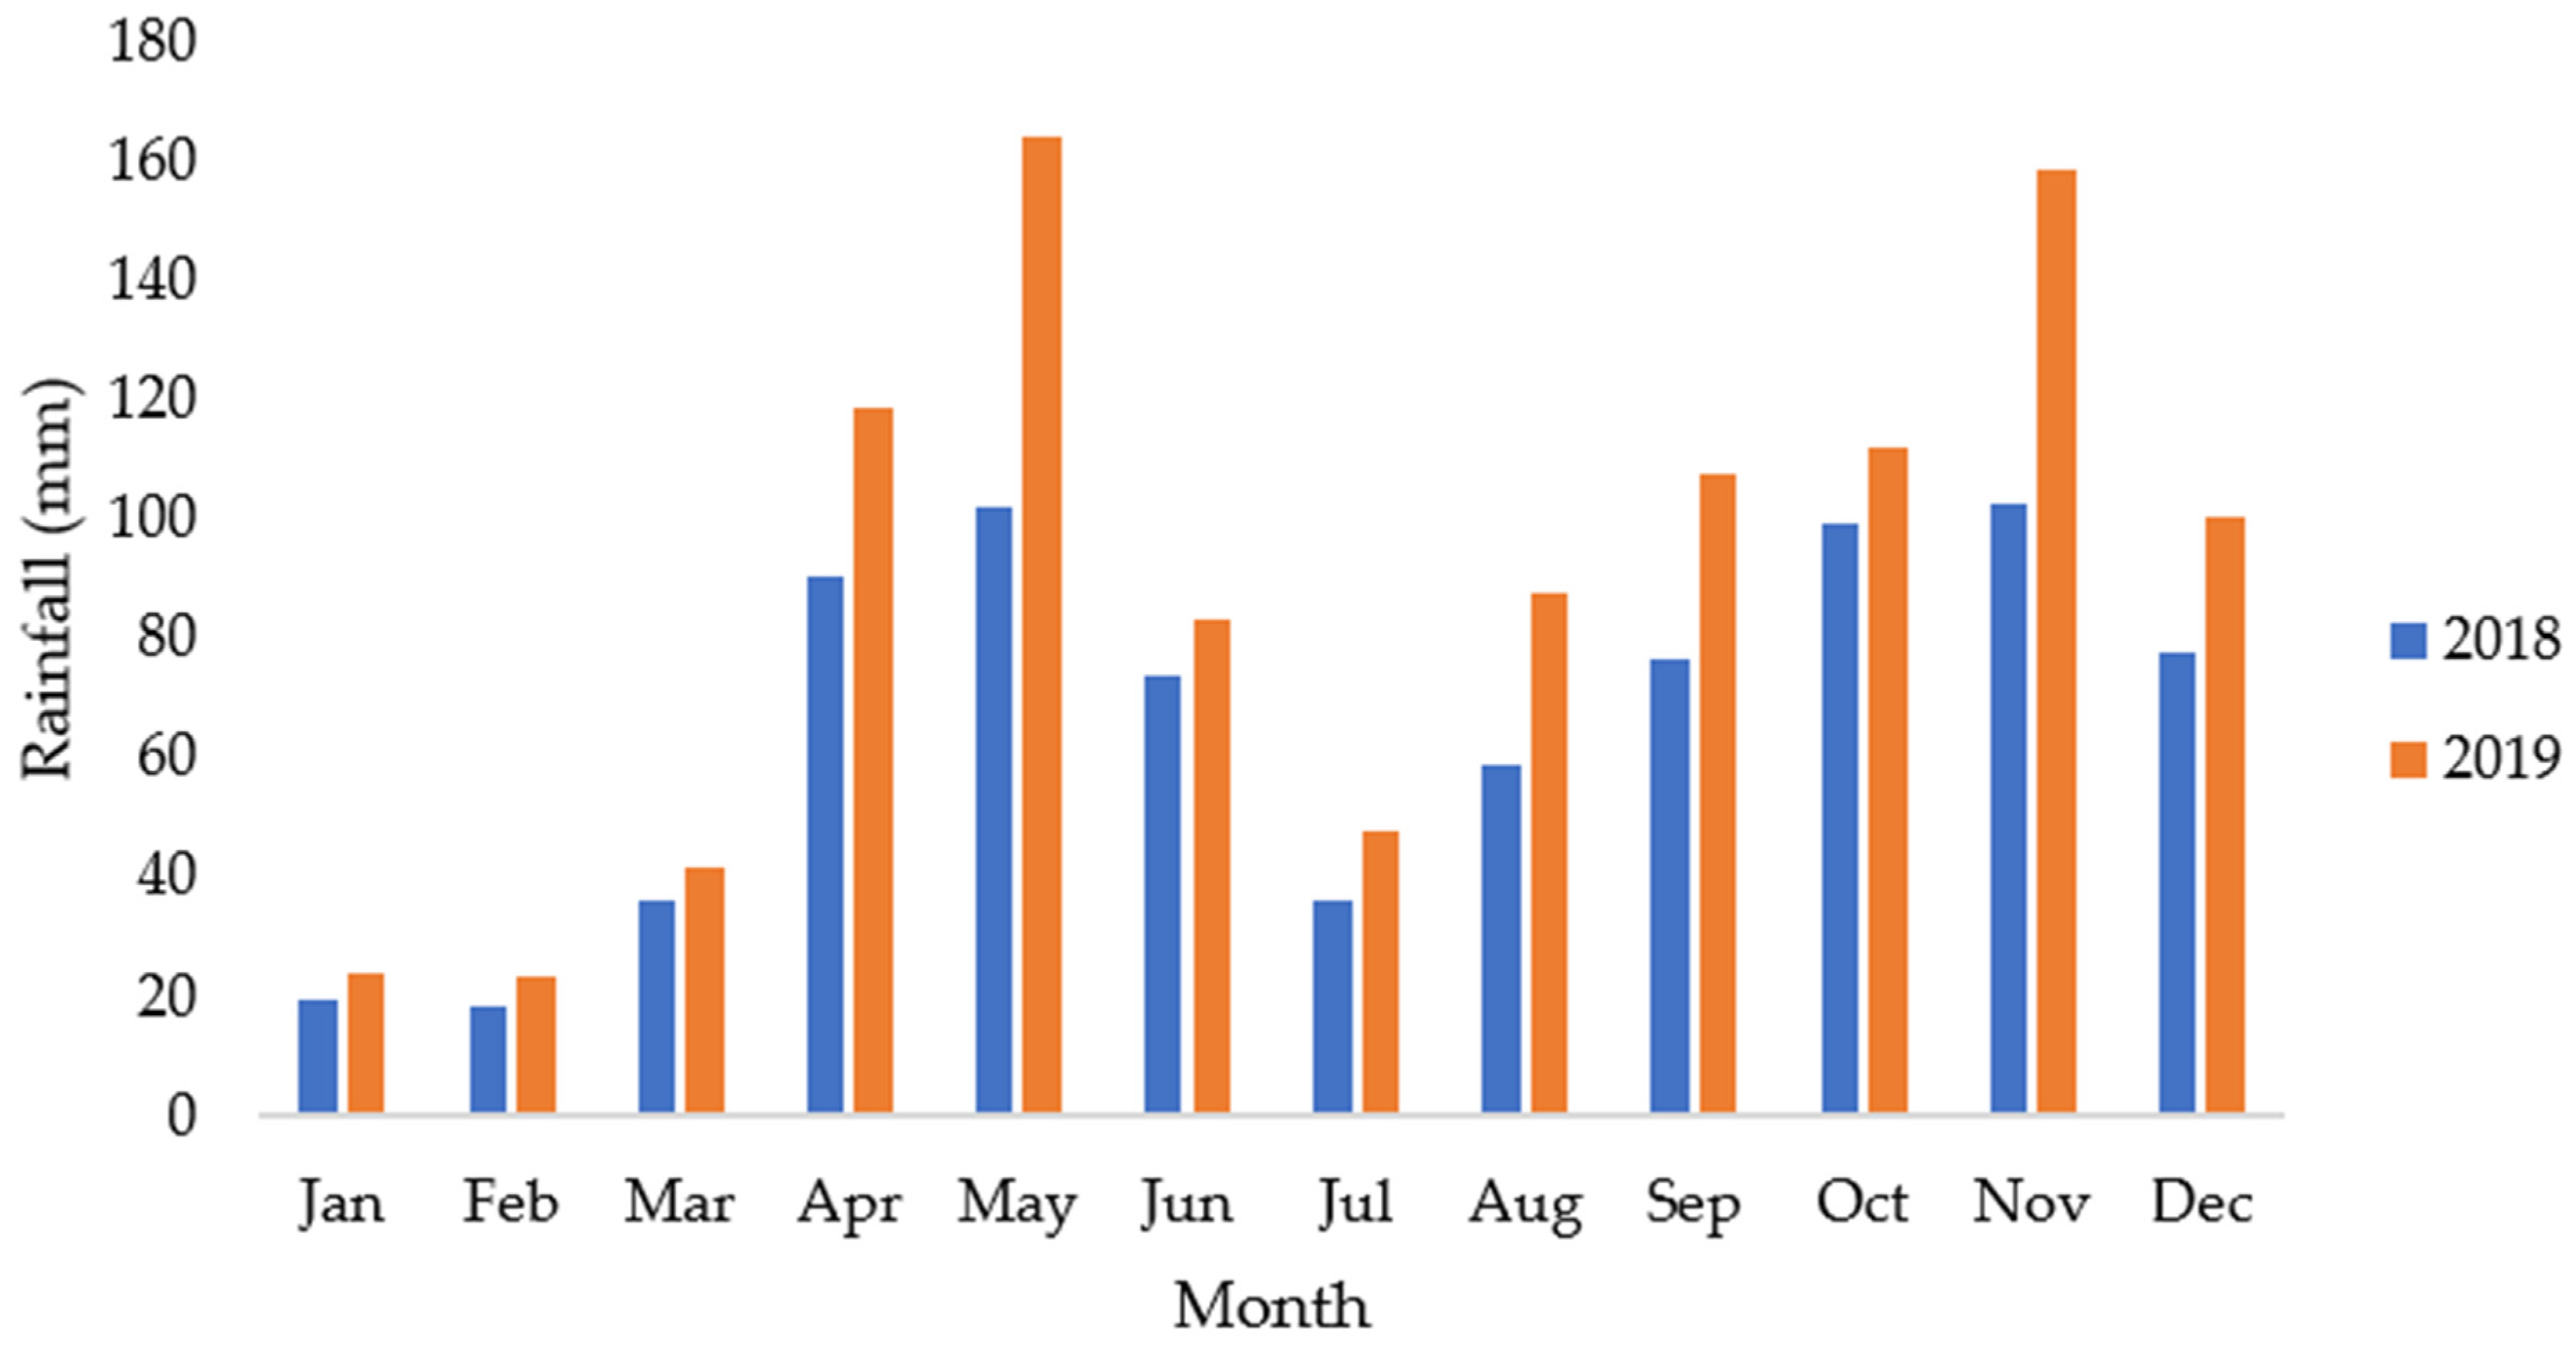
2.1. Description of the Study Area

The experimental study was conducted in the Rwenzori Mountains, in the Kyondo sub-county (Figure 1), at an altitude of 1300–1800 m. The Kyondo sub-county is located in the Kasese district at 0°11′12.0″ N, 30°05′17.0″ E in the western part of Uganda close to the Democratic Republic of the Congo. In this area, the main crop is C. arabica, which is grown as a monocrop. Kyondo has a total population of 27,400 coffee farmers [19]. Due to farming on steep slopes, vulnerable soils, poor farming practices, and population pressure, approximately 60% of the land in this area is prone to degradation [24]. The experimental sites encompassed a total land area of 52 ha on a 45–60% slope (Figure 1). The soils in the experimental area are erosion-prone Leptosols with pH 5–6, and predominantly loamy sands with 46.3% sand, 45.2% silt, and 6.6% clay, indicating a high risk of degradation and low natural fertility [73].
The study area experiences a tropical climate (Figure 2) with bimodal rainfall (short rainfall season March-May 286 mm, 23.3 °C and long rainfall season August–November 375 mm, 22.9 °C) and an average annual rainfall of 884 mm/yr [74]. Monthly rainfall (Figure 2) for the study area was measured using rain gauges which were installed on each of the 26 farms during the experimental period (2018–2019).

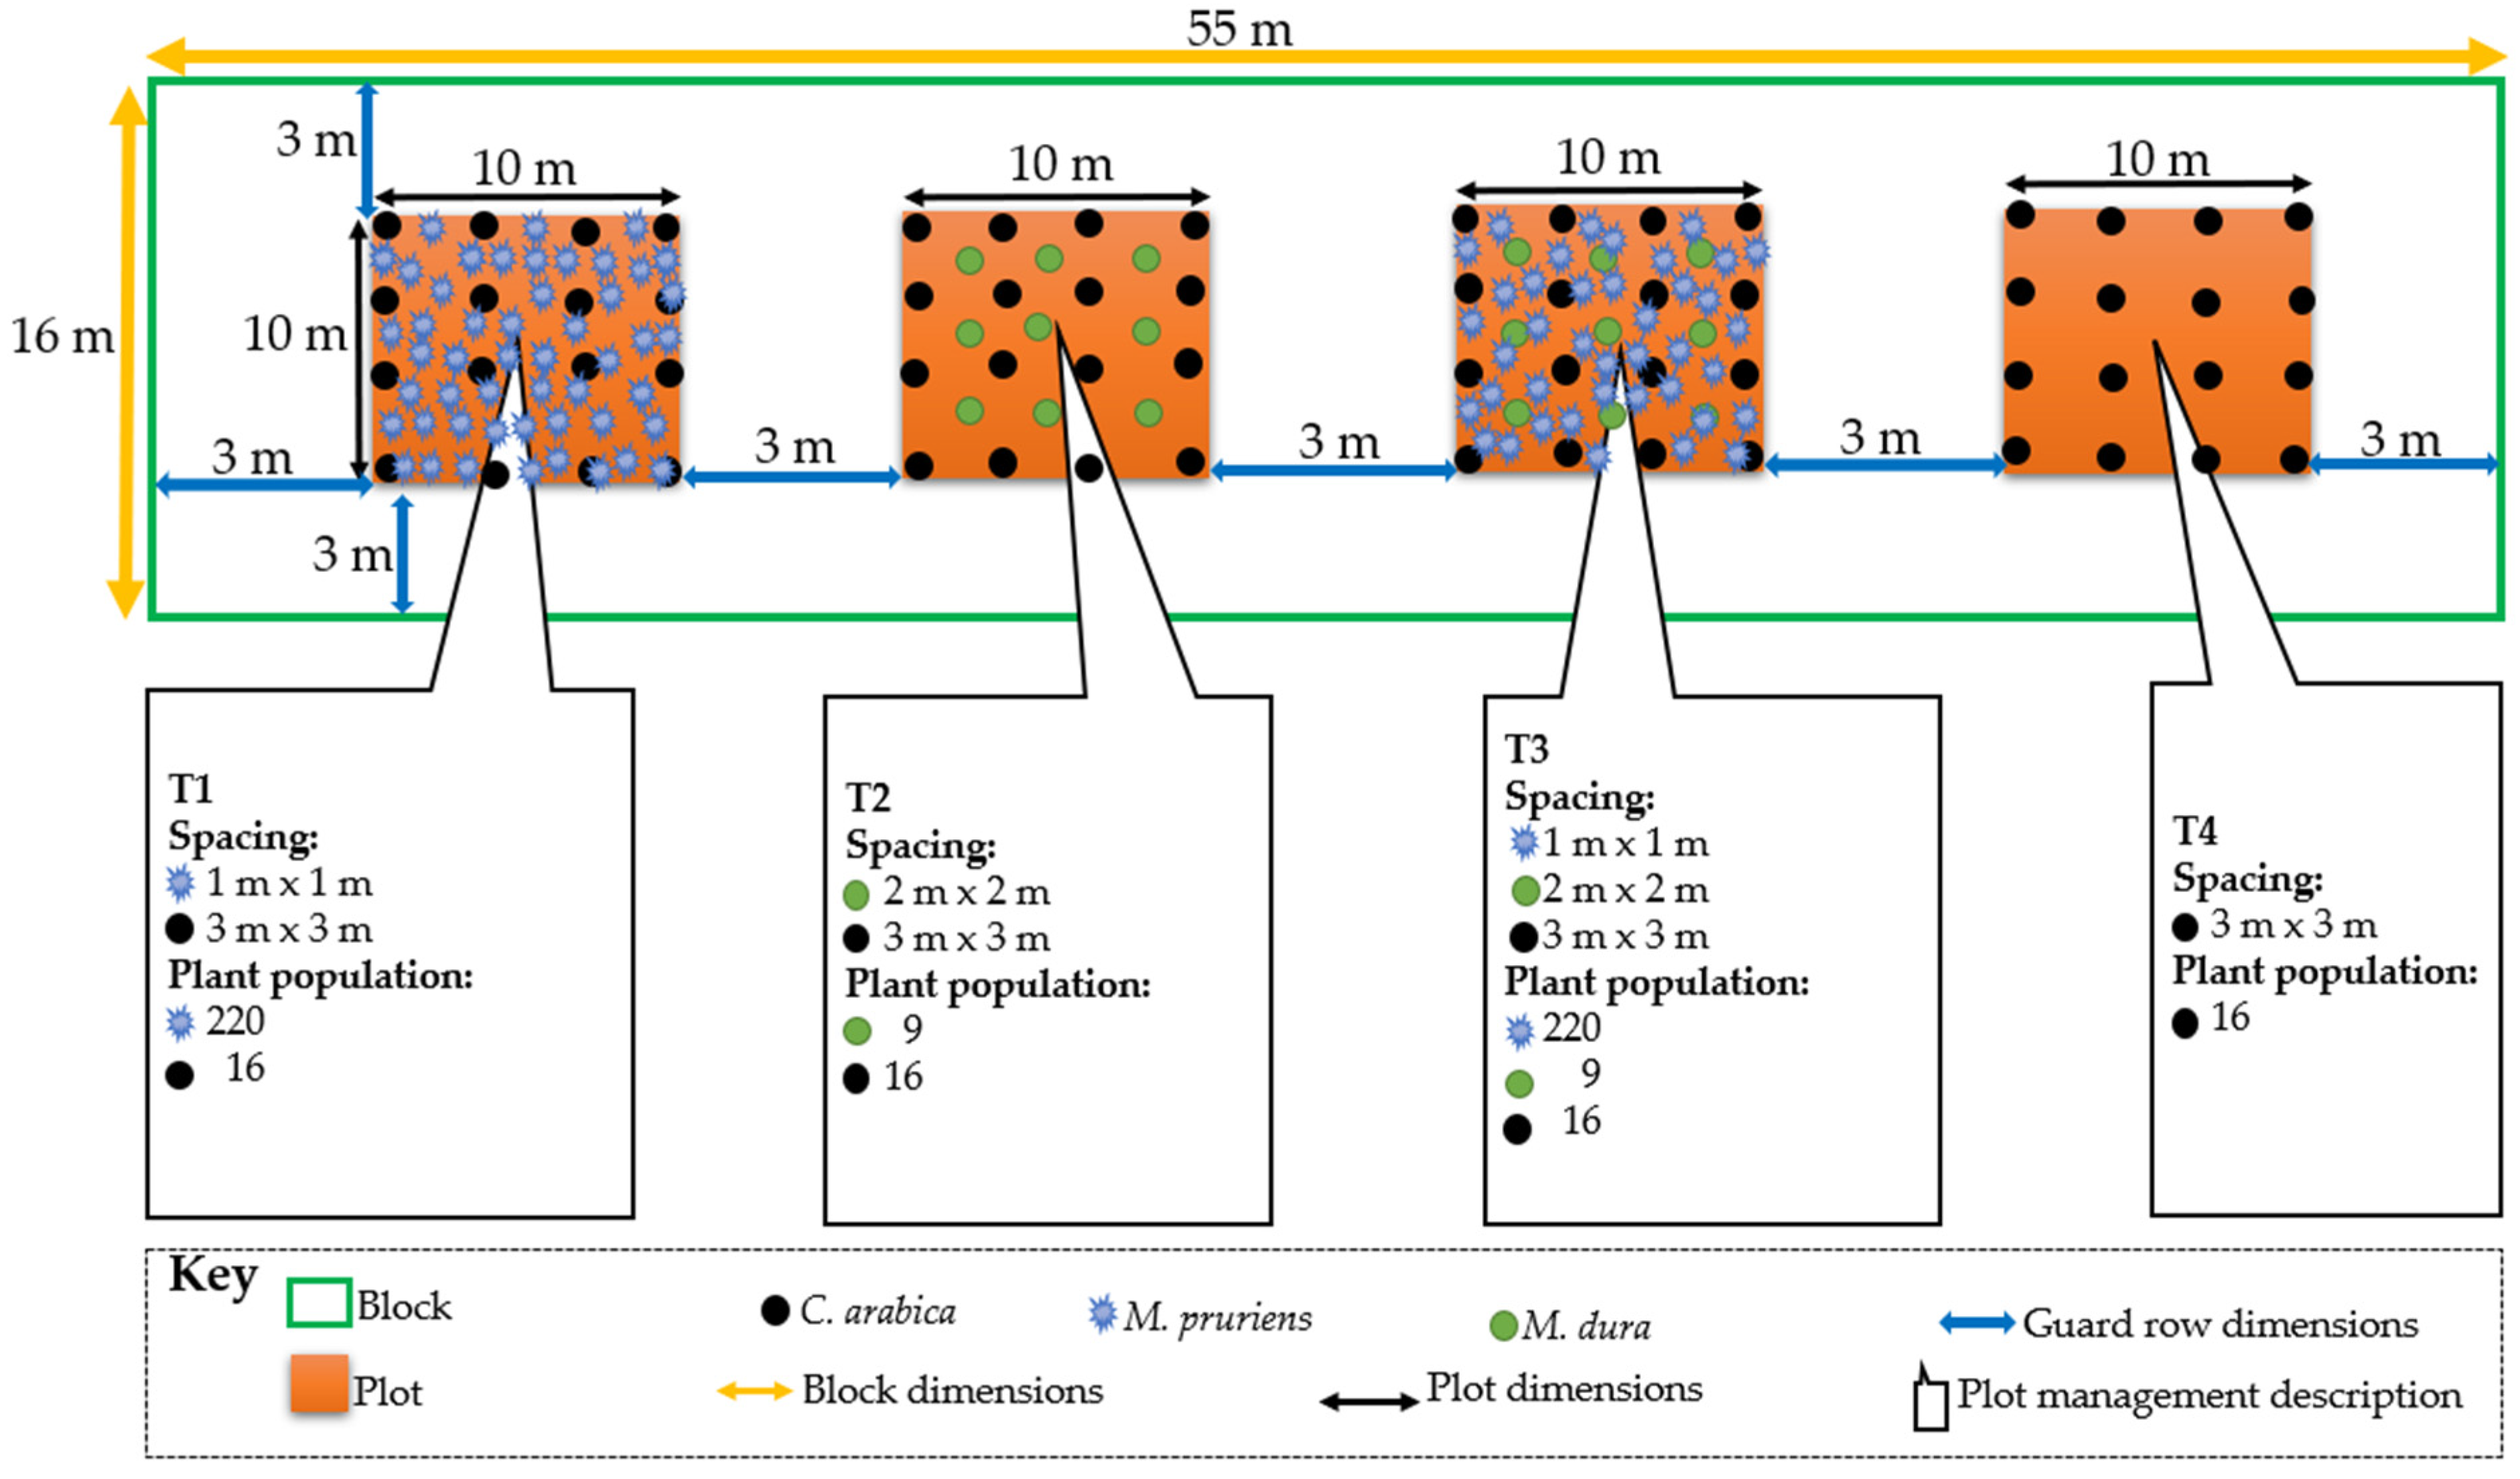
2.2. Experimental Design and Establishment

This study involved multi-locational experiments that were established following a randomized single-block design on 26 smallholder farms of 30-year-old monoculture pure-stand C. arabica with no soil cover. This was done to ensure that findings from the study apply to the varying conditions on the different smallholder farms [75]. In each of the 26 experiments, a single experimental block with the dimensions of 55 m × 16 m was demarcated across the slope such that all plots where the different treatments were introduced on a particular farm were at the same gradient. To manage to implement the experiment on the small land holding per farm (less than 1 ha per household), one block was implemented per farm thus there were no replications per experiment.
All the plots were subjected to the traditional practice of hand hoeing three weeks before the treatments were implemented. A buffer area of 3 m was left between the plots as shown in Figure 3 to avoid inter-plot treatment effects. In the first growing season, the different treatments (T1, T2, T3, and T4) were randomly allocated to the plots to minimize errors associated with non-homogeneity between and within the experiments [76]. To ensure that the effect in each plot was attributed to a particular treatment, the same treatment was repeated in the specific plot for all four growing seasons. The plot-specific management techniques implemented in the experiment are described in Table 1.
The treatments included an undersow of Mucuna pruriens var. utilis in C. arabica (T1), Millettia dura Dunn undersows in C. arabica (T2), a combination of M. dura and M. pruriens var. utilis undersow in C. arabica (T3), and control (T4) which was managed following the traditional farming practices (continuous weed clearing by hand hoeing and no cover plants). The experiment was implemented and monitored for four consecutive growing seasons: first growing season (January–July 2018) = SR1, second growing season (July–December 2018) = LR1, third growing season (January–July 2019) = SR2, and fourth growing season (July–December 2019) = LR2 (see Figure 3 and Table 1). This was to ascertain the consistency of the influence of the different treatments during the different seasons in the studied area [75].

2.3. Data Collection

2.3.1. Above-Ground Biomass

The above-ground biomass (M. pruriens and the weeds) in each treatment was measured from a 1 m2 quadrat delineated at the center of each plot [78]. The plants within the quadrat (except coffee and M. dura) were cut at the root collar. The biomass from M. dura was attained by pruning the tree that was in the quadrat delineated area at the center of the plot in T2 and T3. The M. dura tree was pruned 50% following the recommendation for pruning trees [77]. This enabled the collection of biomass for above-ground cover sampling without damaging the tree. For each growing season, the above-ground biomass sampling on all 26 farms was completed on the same day. The harvested biomass from each plot was separately oven-dried at 70 °C until a constant weight was obtained. To convert to mt/ha, the measured biomass from the 1 m2 quadrat was multiplied by 10,000 m2 and for M. dura it was multiplied by 625: the equivalent number of M. dura trees in a hectare. After weighing the dry biomass from the different treatments it was returned to decompose in the specific plots where it had been harvested.

2.3.2. Soil Sampling and Testing

Using a soil auger, five soil sub-samples were collected from each treatment plot at 0–15 cm. The soil samples were collected at this depth because it is the soil layer within which C. arabica roots extract the soil’s plant-available nutrients [79]. The soil sub-samples were collected following random sampling procedures recommended for soil sample collection by Okalebo et al. [80]. The five sub-samples collected from each plot were thoroughly mixed to make one composite sample per treatment. This was repeated to make 26 composite samples from the 26 farms. The first soil sampling was done in January 2018 (SR1) before introducing the treatments to the different plots. This was done to determine the initial plant-available nutrient status of the different plots without the treatment effect. After the four growing seasons with treatment (T1, T2, T3, and T4) application in January 2020 (end of LR2), the second soil sample collection was done following the same procedure that was used during the first soil sampling. This was done to determine the change in the soil’s plant-available nutrients (difference between SR1 and LR2) per treatment. The soil analysis focused on the macronutrients (nitrogen-N, phosphorus-P, and potassium-K) in plant-available form because these are essential in the production of C. arabica [81].
The plant-available N, P, and K in the soil samples were tested following procedures for testing acidic soils since the soils have pH 5–6 [73]. Soil samples were first air-dried and then passed through a 2 mm sieve. N was determined using the hot hydrogen peroxide/potassium chloride extraction method recommended by Tié [82]. Following this procedure, 50 mL of 25% hydrogen peroxide was added to 5 g of sieved soil in a 300 mL conical flask. The conical flask with its content was then placed into a ventilated oven and heated for 6 h at a temperature of 60 °C. The suspension was cooled and 1 M of potassium chloride was added. The mixture was then rotated for 30 min. Ammonium Nitrogen was determined from the filtrate through distillation. Plant-available P was determined through Bray 1 extraction method according to the procedure by Kovar and Pierzynski [83] where 20 mL of Bray1 extraction solution (0.025 M hydrochloric acid) in 0.03 M of ammonium fluoride was added to 2 g of soil in a conical flask. At room temperature, the flask with its contents was shaken at 200 revolutions per minute. The plant-available P was measured from the filtrate by use of a VWR- UV- 6300PC spectrophotometer at a wavelength of 880 nm [83]. Plant-available K was determined following a flame photometry procedure with ammonium acetate extractant [80,84] where 100 mL of ammonium acetate extractant was added to a conical flask containing 5 g of the air-dried soil samples. The flask and its contents were shaken at 200 oscillations per minute for 30 min and the solution was left to settle for 30 min. The supernatant was filtrated through the Whatman No. 42 filter paper and the extracted solution was 10 times diluted. Five (5) mL of the solution was pipetted into a 50 mL volumetric flask and 1 mL of lanthanum chloride solution was added. The contents were then diluted with ammonium acetate extractant solution. The content of K was then determined by spraying the soil extract, lanthanum chloride, and ammonium acetate solution onto the flame of a PFP7 model flame photometer.
Percentage change in N, P, and K was calculated as follows (Equation (1)):
P e r c e n t a g e   c h a n g e   i n   a v a i b l e   n u t r i e n t s = ( A v a i l a b l e   a m o u n t   i n   2020 ) ( A v a i l a b l e   a m o u n t   i n   2018 ) ( A v a i l a b l e   a m o u n t   i n   2018 ) * 100

2.3.3. Coffee Yield

Fresh red coffee cherries were harvested by hand from three randomly selected coffee trees at the center of each plot following the recommendation by Langton [85] to avoid border effects. Four harvesting seasons were observed; November 2018–January 2019: associated with SR1; April 2019–July 2019: associated with LR1; November 2019–January 2020: associated with SR2 and; April 2020–July 2020: associated with LR2. Coffee was harvested from the same coffee trees in each plot for all four harvesting seasons to avoid changes in yield due to coffee tree variations. For every harvest season, harvesting of fresh red coffee cherries was done on the same day on all 26 farms. Harvesting in each season was done at an interval of two weeks to ensure that only fully ripe red cherries were harvested. This was repeated until all the cherries on each of the selected coffee trees were harvested during a particular harvest season. The red coffee cherries from each plot were separately dried under a shed on raised screens until a constant moisture content (12% which is appropriate for further processing and selling of the coffee) determined by a moisture meter was attained. The coffee weights per treatment were converted to mt/ha by multiplying the average yield per coffee tree by the total number of coffee trees (1111) in a hectare.

2.3.4. Profitability

The input (total variable costs-TVC) i.e., the seed and labor for planting, weeding, and harvesting costs for each treatment on each farm were recorded in Uganda shillings by the farmers with guidance from the researchers. This data was converted into USD/ha to determine the TVC. Equally, the prices for the dry coffee cherry and the dry biomass were based on farm gate prices at USD 750/mt and USD 28/mt respectively. The dollar (USD) exchange rate was determined from the local bank rates (22 May 2020) for Uganda shilling at 3710/USD 1. The data were used to calculate the profitability of each treatment following the formula (Equations (2) and (3)) adopted from [86,87]:
GP   = R TVC  
R = [ DCW   ×   PC ] + [ DBM   × PD ]
where:
GP—Gross profit
R—Revenues
TVC—Total variable costs (cost of seed, labor for planting, weeding, and harvesting) for implementing each treatment (USD). Fixed costs were constant across all treatments and therefore were not included in the calculation.
DCW—Total dry coffee yield (mt/ha)
PC—Price per mt of dry coffee (USD)
DBM—Dry biomass yield (mt)
PD—Price per mt of dry biomass material (USD)

2.4. Statistical Analysis

AgroR [88] and SPSS 18 were used to run a joint analysis of experiments conducted in a randomized single-block design with balanced data. Here, the data was considered as arising from 26 separate experiments (farms) and the interest was to fit a multiple linear regression model for each of the response variables (biomass, coffee yield, profit, and soil’s plant-available macronutrients). The dependent variables were treatment (made up of T1, T2, T3, and T4), season (made up of SR1, LR1, SR2, and LR2), and experiment (made up of the 26 experiments analyzed together). The ANOVA results showed that the experiment was not significant (p = 0.16) while both treatment and time (season) were significant (p < 0.01) predictors of the response variables (biomass, soil’s plant-available nutrients, coffee yield, and profit). The likelihood ratio test indicated that 88.53% of the variations in the response variables were attributed to the variations in treatment and time (season). The variables treatment and season fulfilled the key assumptions of the linear regression model. They were independent with no collinearity between them. Their residuals were fairly normal and homoscedastic. After confirming that there were no significant differences between the experiments, we dropped the experiment variable and continued with treatment and season as dependent variables in the linear regression models and the post hoc analysis with Tukey’s test to compare the averages between treatments and seasons for the different response variables. We produced cross-tabulations of the means of the different response variables to compare the treatment effect in each season. A Kruskal Wallis rank-sum test was done to determine the significance of the differences in the percentage change of the soil plant-available nutrients by treatment. This was followed by a pairwise comparison between treatments using the Wilcoxon rank sum exact test.

3. Results

3.1. Above-Ground Biomass

The mean biomass produced per season by T1, T2, T3, and T4 was 3.68, 2.09, 4.35, and 1.59 mt/ha, respectively (Figure 4). The biomass of T3 was significantly higher than all other treatments (Table 2). Generally, the biomass produced increased with the season from 2.57 mt/ha in SR1 to 3.13 mt/ha in LR2.
After two consecutive growing seasons, dry biomass in T1 started declining while that under T2 and T3 was increasing with subsequent seasons (Table 3).

3.2. Soil Macronutrients

Table 4 shows that the change in N and K was positive for T1, T2, and T3 but was negative for T4. The change in P was negative for all treatments. The changes in available nutrients were significantly different (p < 0.01).

3.3. Coffee Yield

The mean coffee yield produced per season under T1, T2, T3, and T4 were 1.01, 0.69, 1.10, and 0.40 mt/ha, respectively. For the season, the mean coffee yield was increasing with the season from 0.36 mt/ha in season one to 1.31 mt/ha in season four. There was a positive correlation between biomass and coffee yield. The results show that these two have a significant, positive correlation ( ρ = 0.567 , p < 0.001 ). By the fourth growing season (LR2), coffee yield was significantly higher under T3 than in all the other treatments (Table 5).

3.4. Profitability

A high positive correlation between biomass and profit was observed ( ρ = 0.87 , p < 0.001 ).
In all seasons combined, the highest profit was attained in T1 (USD 511.57) and it was significantly higher than in all other treatments (Table 6). The mean profit per season for T2, T3, and T4 was USD 89.64, USD 363.37, and USD −104.58 respectively.
The profits were increasing with the season from USD −668.2/ha during SR1 to USD 812/ha during LR1 in T3.
In the first season (SR1) gross profit in all treatments was negative and by the fourth growing season (LR2) T3 had significantly higher positive profit than all other treatments (Table 7).

4. Discussion

4.1. Above-Ground Biomass

Sufficient above-ground biomass (up to 8.7 mt/ha/yr) for cover under C. arabica was produced by T3 as compared to the control where only 3.2 mt/ha/yr was generated. This result agrees with findings on biomass generation by M. pruriens under different soil, agroecological, and cropping system conditions [46,47,48,49,50]. Similarly, related studies indicate that M. dura has a high stem density [66] and can produce above-ground biomass of 8.2–17 mt/ha [89]. Therefore, the results of this experiment agree with the documented evidence that above-ground biomass cover increases via the integration of legumes [45,46].
The decline in above-ground biomass of T1 during SR2 and LR2 confirms findings from other studies where successive planting and cutting of M. pruriens produced declining above-ground biomass [47,53]. This decline could have been induced by a viral infection whose signs were observed during LR2. A similar viral infection associated with the continuous planting of M. pruriens has been reported by Zaim et al. [90]. This indicates that M. pruriens alone may not be a sustainable source of above-ground cover but requires interplanting it with a perennial legume. T2 produced significantly higher above-ground dry biomass cover than T4 starting with SR2, indicating that an initial phase with a lower impact of M. dura during subsequent growing seasons can be anticipated as is expected of agroforestry systems [89]. Results of this four-season experiment indicate that a combination of M. pruriens with M. dura can sustainably fulfil the 0.5–2 mt/ha annual above-ground biomass cover recommended for tropical areas by Bekeko [36], since T3 produced more than the required minimum amounts of biomass and was increasing with the season.

4.2. Available Soil Macronutrients

After the four growing seasons of integrating the treatments, plant-available N and K increased under T1, T2, and T3 compared to T4. This could be explained by the addition of nitrogen via the leguminous M. pruriens and M. dura. This finding is consistent with the nitrogen-fixing potential of M. pruriens reported by Kaizzi et al. [49], Hauser and Nolte [51], Vasconcelos et al. [42], and Ahmed et al. [47]. This finding also agrees with other studies that found that M. pruriens improves the activity of soil biota both for the macro and microorganisms which facilitate processes that accumulate soil nutrients including N, P, and K [91] while also suppressing weeds that would otherwise reduce the soil nutrient stocks [35]. The findings also support other related studies which show that legumes, including trees integrated under coffee increase the availability of soil nutrients [39,44].
The reduction in plant-available P under T1, T2, and T3 could have been due to its increased uptake by the coffee trees induced by the increase in nitrogen, which led to a higher demand for P in the production of more coffee cherries. Available P was lower under T4 than in T1, T2, and T3 probably due to the high loss of P that is known to occur due to erosion rather than leaching [92,93]. In T1, T2, and T3 the cover legumes could have protected the soil against erosion hence less loss of P as has been documented in studies on cover legumes [39,55,56]. The plant-available K increased in T1, T2, and T3 probably as a result of the mineralization of the plant residues during their decomposition. Additionally, the increase in K could be attributed to its uptake from deeper soil layers which is then transferred to the surface through the deposition of the leaves of M. pruriens and M. dura. This finding agrees with several studies on the contribution of crop residues to the availability of K in the soil [94]. Results from this study indicate that a combination of M. pruriens with M. dura integrated under C. arabica on sloping land increases the availability of macronutrients that are essential for coffee production.

4.3. Coffee Yield

The observed increase in coffee yield under T3 and T1 can be attributed to the high biomass with its several positive impacts that are known about legume cover such as, increasing the availability of soil nutrients, reducing the disturbance of coffee feeder roots, and reduction of soil erosion. This finding agrees with the known positive impact of legume cover on crop yield [39,51,52,53]. Additionally, an increase in plant-available soil K is known for contributing to the coffee cherry formation, increasing the weight and volume of coffee as well as activating its maturation [95]. This can explain the increase in coffee yield under T1, T2, and T3 where plant-available K increased. The increase in coffee yield can also be explained by the mineralization of the biomass in T1, T2, and T3 which consequently optimized the uptake of soil nutrients by the coffee trees [43,47,49,50,96]. A positive correlation between biomass and coffee yield has been found where in a similar study, above-ground biomass increased coffee yield by improving the fruit-bearing nodes of coffee trees [79]. This confirms the positive correlation between biomass and coffee yield that was observed. Thus, the findings on biomass accumulation and increase in the availability of soil nutrients are consistent with the observed increase in coffee yield under T1 and T3 and agree with other studies which indicate that cover legumes contribute to sustained yield increase [41,43,48]. The overall increase in coffee yield in all treatments during LR2 could, besides the impact of the treatments, be attributed to the high rainfall that was received in that season (Figure 2) and not necessarily attributed to the impact of T4. The low coffee yield under T2 compared to T1 could be due to the uptake of soil nutrients by the young M. dura trees which competed with the coffee for soil nutrients. The soil’s plant-available N, P, and K remained low under T4 compared to other treatments. Thus, the low coffee yield in T4 was also commensurate with the low soil nutrients.
The lower coffee yield observed under T4 compared to other treatments could also be due to the continuous hand hoeing: a traditional weed control method under the coffee trees. This is known to be destructive to the coffee because the C. arabica feeder roots feed within 20 cm soil depth [97,98,99]. The impact of such disturbance by continuous hoeing has also been reported by Sarmiento-Soler et al. [100] and Iijima et al. [101]. On the other hand, hoeing was only required two times under T3. This could have reduced the destruction of the surface feeder roots, hence the immediate high yields of coffee since coffee is a highly responsive plant [39,47,53,96]. This further corroborates findings on the potential of legumes in reducing tillage rate [31,39,47,52]. The slow impact on the coffee yield that was observed in T2 confirms the finding that the benefits of agroforestry systems take a long time to manifest [100].

4.4. Profitability

The observed positive correlation between biomass and profit indicates that the realized profits can be attributed to the different treatments which contributed the different amounts of biomass. T1 had a significantly high profit overall because of the low costs associated with integrating M. pruriens and the resulting increase in the yield of coffee. During the first growing season (SR1) labor costs for T3 associated with M. dura establishment were 18% and 15% higher than the costs for T1 and T4, respectively. However, after their establishment, and particularly when the M. dura trees had been established (LR2), T3 became more profitable than all other treatments.
Gross profit in T4 continued to be negative due to the high costs required for continuous hoeing as a traditional weed control method while this cost was avoided under T3 since the biomass cover in this treatment smothered the weeds [42,47,48,53]. Under T4, the C. arabica was also likely experiencing competition from the weeds, and destruction of the roots of C. arabica due to continuous weeding, hence there were low yields with subsequent negative gross profit. These findings confirm that covering with legumes is profitable as opposed to no-cover [8,9,48]. Although, until the fourth growing season the profit in T2 was significantly lower than in T1, its tested impact was preliminary since the M. dura trees were not fully mature. Thus, a further increase in annual biomass production and nitrogen fixation rate can be expected in the future to impact soil fertility positively under T2 and T3 resulting in higher coffee yield with a subsequent increase in profits as reported in related studies [41,43,48].

5. Conclusions

A combination of the annual legume M. pruriens with the perennial legume M. dura under C. arabica on sloping land sustainably increases above-ground biomass cover, availability of the soil’s plant-macronutrients (N and K) which subsequently increases coffee yield and profitability. Therefore, it is recommended to integrate a combination of M. pruriens with M. dura under C. arabica on sloping land.
This study was based on four cropping seasons, extended studies on implementing a self-sowing system of M. pruriens under M. dura and C. arabica to further increase profitability, and a study on understanding the long-term impact of this cropping system on the microclimate and soil erosion are recommended.

Author Contributions

Conceptualization, T.K.T., D.M.E., J.P.K.K., J.K.F., A.M. and B.F.; methodology, T.K.T., D.M.E., J.P.K.K., J.K.F., A.M. and B.F.; validation, T.K.T., J.P.K.K., B.B. and B.F.; formal analysis, T.K.T., D.M.E., J.P.K.K., J.K.F., A.M., B.B. and E.A.; investigation, T.K.T., J.P.K.K. and B.F.; data curation, T.K.T., J.P.K.K., J.K.F., A.M. and B.B.; writing—original draft preparation, T.K.T., D.M.E., J.P.K.K., J.K.F., A.M. and B.F.; writing—review and editing, T.K.T., D.M.E., J.P.K.K., J.K.F., A.M., B.B., E.A. and B.F.; visualization, B.B. and E.A.; supervision, J.P.K.K., J.K.F., A.M. and B.F. All authors have read and agreed to the published version of the manuscript.

Funding

This research was funded by Austrian Development Cooperaton—OEZA, with financing from the OeAD—Austria’s Agency for Educaton and Internatonalisaton, grant number MPCl-2022-05837 and The APC was funded by T.K.T.

Institutional Review Board Statement

Not applicable.

Conflicts of Interest

The authors declare no conflict of interest.

References

  1. Etienne, H. Somatic Embryogenesis Protocol: Coffee (Coffea arabica L. and C. canephora P.). In Protocol for Somatic Embryogenesis in Woody Plants; Jain, S.M., Gupta, P.K., Eds.; Forestry Sciences; Springer-Verlag: Berlin/Heidelberg, Germany, 2005; Volume 77, pp. 167–179. ISBN 978-1-4020-2984-4. [Google Scholar]
  2. Ovalle-Rivera, O.; Läderach, P.; Bunn, C.; Obersteiner, M.; Schroth, G. Projected Shifts in Coffea arabica Suitability among Major Global Producing Regions Due to Climate Change. PLoS ONE 2015, 10, e0124155. [Google Scholar] [CrossRef] [Green Version]
  3. Labrière, N.; Locatelli, B.; Laumonier, Y.; Freycon, V.; Bernoux, M. Soil erosion in the humid tropics: A systematic quantitative review. Agric. Ecosyst. Environ. 2015, 203, 127–139. [Google Scholar] [CrossRef]
  4. Wang, N.; Jassogne, L.; van Asten, P.J.A.; Mukasa, D.; Wanyama, I.; Kagezi, G.; Giller, K.E. Evaluating coffee yield gaps and important biotic, abiotic, and management factors limiting coffee production in Uganda. Eur. J. Agron. 2015, 63, 1–11. [Google Scholar] [CrossRef]
  5. Workman, D. Coffee Exports by Country. Available online: https://www.worldstopexports.com/coffee-exports-country/ (accessed on 8 January 2023).
  6. Wisevoter. Coffee Consumption by Country; Wisevoter: Washington, DC, USA, 2023. [Google Scholar]
  7. Clay, J. World Agriculture and the Environment: A Commodity-by-Commodity Guide to Impacts and Practices; Island Press: Washington, DC, USA, 2004; ISBN 978-1-55963-370-3. [Google Scholar]
  8. MAAIF. National Coffee Policy; Ministry of Agriculture Animal Industry and Fisheries (MAIF): Entebbe, Uganda, 2013. [Google Scholar]
  9. UCDA. Uganda National Coffee Strategy 2040 Plan for 2015/16–2019/2; UCDA: Kampala, Uganda, 2015. [Google Scholar]
  10. UCDA. Daily Coffee Market Prices; Uganda Coffe Development Authority: Kampala, Uganda, 2023. [Google Scholar]
  11. Mukiibi, J.K. Agriculture in Uganda, 2nd ed.; Fountain Publishers: Kampala, Uganda, 2001. [Google Scholar]
  12. Geromel, C.; Ferreira, L.P.; Davrieux, F.; Guyot, B.; Ribeyre, F.; Brígida dos Santos Scholz, M.; Protasio Pereira, L.F.; Vaast, P.; Pot, D.; Leroy, T.; et al. Effects of shade on the development and sugar metabolism of coffee (Coffea arabica L.) fruits. Plant Physiol. Biochem. 2008, 46, 569–579. [Google Scholar] [CrossRef] [Green Version]
  13. Bosselmann, A.S.; Dons, K.; Oberthur, T.; Olsen, C.S.; Ræbild, A.; Usma, H. The influence of shade trees on coffee quality in small holder coffee agroforestry systems in Southern Colombia. Agric. Ecosyst. Environ. 2009, 129, 253–260. [Google Scholar] [CrossRef]
  14. Briggs, L.; Twomlow, S.J. Organic material flows within a smallholder highland farming system of South West Uganda. Agric. Ecosyst. Environ. 2002, 89, 191–212. [Google Scholar] [CrossRef] [Green Version]
  15. Asten, P.V.; Wanyama, I.; Mukasa, D.; Nansamba, R.; Kisaakye, J.; Sserubiri, I.; Bongers, G.; Jassogne, L. Mapping and Evaluating Improved Intercrop and Soil Management Options for Ugandan Coffee Farmers; International Institute of Tropical Agriculture (IITA): Ibadan, Nigeria, 2012. [Google Scholar] [CrossRef]
  16. Jacobs, L.; Dewitte, O.; Poesen, J.; Delvaux, D.; Thiery, W.; Kervyn, M. The Rwenzori Mountains, a landslide-prone region? J. Int. Consort. Landslides 2016, 13, 519–536. [Google Scholar] [CrossRef] [Green Version]
  17. Muhumuza, M.; Byarugaba, D. Impact of land use on the ecology of uncultivated plant species in the Rwenzori mountain range, mid western Uganda. Afr. J. Ecol. 2009, 47, 614–621. [Google Scholar] [CrossRef]
  18. Jassogne, L.; Läderach, P.; van Asten, P. The Impact of Climate Change on Coffee in Uganda: Lessons from a Case Study in the Rwenzori Mountains; Oxfam: Oxford, UK, 2013. [Google Scholar]
  19. UBOS. The National Population and Housing Census 2014—Main Report. Available online: http://www.ubos.org/2014-census/census-2014-final-results/ (accessed on 4 July 2017).
  20. Ssebunya, B.R.; Schmid, E.; van Asten, P.; Schader, C.; Altenbuchner, C.; Stolze, M. Stakeholder engagement in prioritizing sustainability assessment themes for smallholder coffee production in Uganda. Renew. Agric. Food Syst. 2017, 32, 428–445. [Google Scholar] [CrossRef]
  21. Karamage, F.; Zhang, C.; Liu, T.; Maganda, A.; Isabwe, A. Soil Erosion Risk Assessment in Uganda. Forests 2017, 8, 52. [Google Scholar] [CrossRef]
  22. Grüter, R.; Trachsel, T.; Laube, P.; Jaisli, I. Expected global suitability of coffee, cashew and avocado due to climate change. PLoS ONE 2022, 17, e0261976. [Google Scholar] [CrossRef]
  23. Scopel, E.; Triomphe, B.; Affholder, F.; Da Silva, F.A.M.; Corbeels, M.; Xavier, J.H.V.; Lahmar, R.; Recous, S.; Bernoux, M.; Blanchart, E.; et al. Conservation agriculture cropping systems in temperate and tropical conditions, performances and impacts. A review. Agron. Sustain. Dev. 2013, 33, 113–130. [Google Scholar] [CrossRef]
  24. Berry, L.; Olson, J.M.; Campbell, D. Assessing the Extent, Cost and Impact of Land Degradation at the National Level: Findings and Lessons Learned from Seven Pilot Case Studies; World Bank: Washington, DC, USA, 2003. [Google Scholar]
  25. Van Der Vossen, H.A.M. A critical analysis of the agronomic and economic sustainability of organic coffee production. Ex. Agric. 2005, 41, 449–473. [Google Scholar] [CrossRef] [Green Version]
  26. Shiferaw, B.A.; Okello, J.; Reddy, R.V. Adoption and adaptation of natural resource management innovations in smallholder agriculture: Reflections on key lessons and best practices. Environ. Dev. Sustain. 2009, 11, 601–619. [Google Scholar] [CrossRef] [Green Version]
  27. Muhamud, N.W. Socio-Economic Factors Assessment Affecting the Adoption of Soil Conservation Technologies on Rwenzori Mountain. IJG 2015, 47, 26. [Google Scholar] [CrossRef]
  28. Tibasiima, T.K.; Ekyaligonza, D.M.; Bwambale, B. Can Agroecology Provide a Panacea for Sustaining the Adoption of Soil Erosion Control Measures? A Case of Smallholder Coffea arabica Production in the Rwenzori Mountain Region, Uganda. Sustainability 2022, 14, 13461. [Google Scholar] [CrossRef]
  29. Banadda, N. Gaps, barriers and bottlenecks to sustainable land management (SLM) adoption in Uganda. Afr. J. Agric. Res. 2010, 5, 3571–3580. [Google Scholar]
  30. Haggblade, S.; Tembo, G.; Donovan, C. Household level financial incentives to adoption of conservation agricultural technologies in Africa. Res. Agric. Appl. Econ. 2004, 30, 54466. [Google Scholar]
  31. Seitz, S.; Goebes, P.; Puerta, V.L.; Pereira, E.I.P.; Wittwer, R.; Six, J.; van der Heijden, M.G.A.; Scholten, T. Conservation tillage and organic farming reduce soil erosion. Agron. Sustain. Dev. 2019, 39, 4. [Google Scholar] [CrossRef] [Green Version]
  32. Tessaro, A.A.; Pereira, M.A.; Calegari, A.; Onofre, S.B.; Ralisch, R. Soybean Yields and Biomass Production of Winter Cover Crops in the Southwest of Parana—Brazil. JSD 2019, 12, 40. [Google Scholar] [CrossRef] [Green Version]
  33. Calegari, A.; Tiecher, T.; Wutke, E.B.; Canalli, L.B.D.S.; Bunch, R.; Rheinheimer, D.D.S. The role and management of soil mulch and cover crops in Conservation Agriculture systems. In Advances in Conservation Agriculture; Burleigh Dodds Science Publishing: Cambridge, UK, 2020; ISBN 978-0-429-26872-4. [Google Scholar]
  34. Nasir Ahmad, N.S.B.; Mustafa, F.B.; Muhammad Yusoff, S.Y.; Didams, G. A systematic review of soil erosion control practices on the agricultural land in Asia. Int. Soil Water Conserv. Res. 2020, 8, 103–115. [Google Scholar] [CrossRef]
  35. Kocira, A.; Staniak, M.; Tomaszewska, M.; Kornas, R.; Cymerman, J.; Panasiewicz, K.; Lipińska, H. Legume Cover Crops as One of the Elements of Strategic Weed Management and Soil Quality Improvement. A Review. Agriculture 2020, 10, 394. [Google Scholar] [CrossRef]
  36. Bekeko, Z. Effect of Maize Stover Application as Soil Mulch on Yield of Arabica coffee (Coffee arabica L., Rubiaceae) at Western Hararghe Zone, Eastern Ethiopia. SAR 2013, 2, 15. [Google Scholar] [CrossRef]
  37. Wezel, A.; Rath, T. Resource conservation strategies in agro-ecosystems of semi-arid West Africa. J. Arid Environ. 2002, 51, 383–400. [Google Scholar] [CrossRef]
  38. Baligar, V.C.; Fageria, N.K. Agronomy and Physiology of Tropical Cover Crops. J. Plant Nutr. 2007, 30, 1287–1339. [Google Scholar] [CrossRef]
  39. Praharaj, S.; Maitra, S. Importance of Legumes in Agricultural Production System: An Overview. Agro Econ. 2020, 7, 69–71. [Google Scholar]
  40. Tully, K.L.; McAskill, C. Promoting soil health in organically managed systems: A review. Org. Agric. 2020, 10, 339–358. [Google Scholar] [CrossRef]
  41. Diacono, M.; Trinchera, A.; Montemurro, F. An Overview on Agroecology and Organic Agriculture Strategies for Sustainable Crop Production. Agronomy 2021, 11, 223. [Google Scholar] [CrossRef]
  42. Vasconcelos, M.W.; Grusak, M.A.; Pinto, E.; Gomes, A.; Ferreira, H.; Balázs, B.; Centofanti, T.; Ntatsi, G.; Savvas, D.; Karkanis, A.; et al. The Biology of Legumes and Their Agronomic, Economic, and Social Impact. In The Plant Family Fabaceae; Hasanuzzaman, M., Araújo, S., Gill, S.S., Eds.; Springer: Singapore, 2020; pp. 3–25. ISBN 9789811547515. [Google Scholar]
  43. Nzeyimana, I.; Hartemink, A.E.; Ritsema, C.; Mbonigaba, J.J.M.; Geissen, V. Mulching effects on soil nutrient levels and yield in coffee farming systems in Rwanda. Soil Use Manag. 2020, 36, 58–70. [Google Scholar] [CrossRef]
  44. Nguyen, M.P.; Vaast, P.; Pagella, T.; Sinclair, F. Local Knowledge about Ecosystem Services Provided by Trees in Coffee Agroforestry Practices in Northwest Vietnam. Land 2020, 9, 486. [Google Scholar] [CrossRef]
  45. Meza, K.; Vanek, S.J.; Sueldo, Y.; Olivera, E.; Ccanto, R.; Scurrah, M.; Fonte, S.J. Grass–Legume Mixtures Show Potential to Increase Above- and Belowground Biomass Production for Andean Forage-Based Fallows. Agronomy 2022, 12, 142. [Google Scholar] [CrossRef]
  46. Ekyaligonza, D.M.; Kahigwa, T.T.; Dietrich, P.; Akoraebirungi, B.; Kagorora, J.P.; Friedel, J.K.; Melcher, A.; Freyer, B. Biomass contribution and nutrient recycling of organic matter management practices in tropical smallholder annual farming systems. Acta Agric. Scand. Sect. B Soil Plant Sci. 2022, 72, 945–956. [Google Scholar] [CrossRef]
  47. Ahmed, M.R.; Osei, B.A.; Bonsu, M. Regenerative capacity and factors influencing the management of Mucuna pruriens var. utilis live-mulch. Ghana J. Agric. Sci. 2008, 40, 51–58. [Google Scholar] [CrossRef]
  48. Muoni, T.; Öborn, I.; Mhlanga, B.; Okeyo, I.; Mutemi, M.; Duncan, A. The Role of Mucuna pruriens in Smallholder Farming Systems of Eastern and Southern Africa: A Review. In Agronomic Crops; Hasanuzzaman, M., Ed.; Springer: Singapore, 2019; pp. 485–498. ISBN 978-981-329-782-1. [Google Scholar]
  49. Kaizzi, C.K.; Ssali, H.; Vlek, P.L.G. Differential use and benefits of Velvet bean (Mucuna pruriens var. utilis) and N fertilizers in maize production in contrasting agro-ecological zones of E. Uganda. Agric. Syst. 2006, 88, 44–60. [Google Scholar] [CrossRef]
  50. Nicholls, C.I.; Altieri, M.A. Agro-ecological approaches to enhance resilience. Farming Matters 2012, 28, 14–17. [Google Scholar]
  51. Hauser, S.; Nolte, C. Biomass production and N fixation of five Mucuna pruriens varieties and their effect on maize yields in the forest zone of Cameroon. J. Plant Nutr. Soil Sci. 2002, 165, 101–109. [Google Scholar] [CrossRef]
  52. Masikati, P.; Manschadi, A.; van Rooyen, A.; Hargreaves, J. Maize–mucuna rotation: An alternative technology to improve water productivity in smallholder farming systems. Agric. Syst. 2014, 123, 62–70. [Google Scholar] [CrossRef] [Green Version]
  53. Carsky, R.J.; Becker, M.; Hauser, S. Mucuna Cover Crop Fallow Systems: Potential and limitations. In SSSA Special Publications; Tian, G., Ishida, F., Keatinge, D., Carsky, R., Wendt, J., Eds.; Soil Science Society of America and American Society of Agronomy: Madison, WI, USA, 2015; pp. 111–135. ISBN 978-0-89118-952-7. [Google Scholar]
  54. Barthès, B.; Azontonde, A.; Blanchart, E.; Girardin, C.; Villenave, C.; Lesaint, S.; Oliver, R.; Feller, C. Effect of a legume cover crop (Mucuna pruriens var. utilis) on soil carbon in an Ultisol under maize cultivation in southern Benin. Soil Use Manag. 2006, 20, 231–239. [Google Scholar] [CrossRef]
  55. Satriawan, H.; Harahap, E.M.; Karim, A. Effectiveness of Soil Conservation to Erosion Control on Several Land Use Types. Agric. (Polnohospodárstvo) 2015, 61, 61–68. [Google Scholar] [CrossRef] [Green Version]
  56. Satriawan, H.; Fuady, Z.; Mayani, N. Soil Conservation by Vegetative Systems in Oil Palm Cultivation. PJSS 2017, 49, 223. [Google Scholar] [CrossRef] [Green Version]
  57. Mureithi, J.G.; Gachene, C.K.K.; Ojiem, J. The Role of Green Manure Legumes in Smallholder Farming Systems in Kenya: The Legume Research Network Project. Trop. Subtrop. Agroecosystems 2003, 1, 57–70. [Google Scholar]
  58. Pender, J.; Jagger, P.; Nkonya, E.; Sserunkuuma, D. Development Pathways and Land Management in Uganda: Causes and Implications. Res. Agric. Appl. Econ. 2002, 131, 16124. [Google Scholar]
  59. Makhaye, N.; Aremu, A.O.; Gruz, J.; Magadlela, A. Effects of soil nutrients and microbe symbiosis on the nutrient assimilation rates, growth carbon cost and phytochemicals in Mucuna pruriens (L.) DC. Acta Physiol. Plant 2021, 43, 153. [Google Scholar] [CrossRef]
  60. Tumwebaze, S.B.; Byakagaba, P. Soil organic carbon stocks under coffee agroforestry systems and coffee monoculture in Uganda. Agric. Ecosyst. Environ. 2016, 216, 188–193. [Google Scholar] [CrossRef]
  61. Lin, B.B. Agroforestry management as an adaptive strategy against potential microclimate extremes in coffee agriculture. Agric. For. Meteorol. 2007, 144, 85–94. [Google Scholar] [CrossRef]
  62. Vaast, P.; Harmand, J.-M.; Rapidel, B.; Jagoret, P.; Deheuvels, O. Coffee and Cocoa Production in Agroforestry—A Climate-Smart Agriculture Model. In Climate Change and Agriculture Worldwide; Torquebiau, E., Ed.; Springer Netherlands: Dordrecht, The Netherlands, 2016; pp. 209–224. ISBN 978-94-017-7460-4. [Google Scholar]
  63. De Carvalho, A.F.; Fernandes-Filho, E.I.; Daher, M.; Gomes, L.D.C.; Cardoso, I.M.; Fernandes, R.B.A.; Schaefer, C.E.G.R. Microclimate and soil and water loss in shaded and unshaded agroforestry coffee systems. Agroforest. Syst. 2021, 95, 119–134. [Google Scholar] [CrossRef]
  64. Orwa, C.; Mutua, A.; Kindt, A.; Jamnadass, R.; Anthony, S. Agroforestree Database: A Tree Reference and Selection Guide; Centre for Agriculture and Bioscience International: Wallingford, UK, 2009. [Google Scholar]
  65. Meunier, Q.; Lemmens, R.; Morin, A. Alternatives to Exotic Species in Uganda: Growth and Cultivation of 85 Indigenous Trees; French Embassy in Uganda: Kampala, Uganda, 2010; ISBN 978-9970-14-402-0. [Google Scholar]
  66. Bitariho, R.; Byamukama, A.; Akampurira, E. Socio-Economic and Ecological Baseline Impact Study of the Reclaimed Part of Sarambwe Nature Reserve after Border Reaffirmation; GVTC: New Braunfels, TX, USA, 2019. [Google Scholar]
  67. Ollis, W.D.; Rhodes, C.A.; Sutherland, I.O. The extractives of Millettia dura (Dunn). Tetrahedron 1967, 23, 4741–4760. [Google Scholar] [CrossRef]
  68. Kakudidi, E.K. A study of plant materials used for house construction around Kibale National Park, western Uganda. Afr. J. Ecol. 2007, 45, 22–27. [Google Scholar] [CrossRef]
  69. Banzouzi, J.T.; Prost, A.; Rajemiarim, M.; Ongoka, P. Traditional Uses of the African Millettia species (Fabaceae). Int. J. Bot. 2008, 4, 406–420. [Google Scholar] [CrossRef] [Green Version]
  70. Asfaw, Z. Growt of Millettia ferruginea and its impact on soil properties of three coffee plantations of southern Ethiopia. Ethiop. J. Nat. Resour. 2008, 10, 147–160. [Google Scholar]
  71. Nigussie, A.; Taye, E.; Bukero, G. Survey on Potentials and Constraints of Shade Tree Species for Arabica Coffee Production in South Ethiopia. Int. J. Recent Res. Life Sci. 2014, 1, 11. [Google Scholar]
  72. Jena, R.; Rath, D.; Rout, S.S.; Kar, D.M. A review on genus Millettia: Traditional uses, phytochemicals and pharmacological activities. Saudi Pharm. J. 2020, 28, 1686–1703. [Google Scholar] [CrossRef]
  73. Fischer, G.; Nachtergaele, F.; Prieler, S.; van Velthuizen, H.T.; Verelst, L.; Wiberg, D. Global Agro-Ecological Zones Assessment for Agriculture (GAEZ 2008); IIASA: Laxenburg, Austria; FAO: Rome, Italy, 2008. [Google Scholar]
  74. Grieser, J.; Gommes, R.; Bernardi, M. New LocClim—The Local Climate Estimator of FAO. Geophys. Res. Abstr. 2006, 8, 2. [Google Scholar]
  75. Blouin, D.C.; Webster, E.P.; Bond, J.A. On the Analysis of Combined Experiments. Weed Technol. 2011, 25, 165–169. [Google Scholar] [CrossRef]
  76. Petersen, R.G. Agricultural Field Experiments; CRC Press: Boca Raton, FL, USA, 1994; ISBN 978-1-4822-7737-1. [Google Scholar]
  77. Nyombi, K.; Ssebulime, G.; Kagezi, G.; Mpiira, S.; Byabagambi, S.; Tushemereirwe, W.; Kubiriba, J.; Karamura, E.; Staver, C. Canopy management, leaf fall and litter quality of dominant tree species in the banana agroforestry system in Uganda. AJFAND 2018, 18, 13154–13170. [Google Scholar] [CrossRef]
  78. Zhang, L.; Cui, G.; Shen, W.; Liu, X. Cover as a simple predictor of biomass for two shrubs in Tibet. Ecol. Indic. 2016, 64, 266–271. [Google Scholar] [CrossRef]
  79. DaMatta, F.M.; Ronchi, C.P.; Maestri, M.; Barros, R.S. Ecophysiology of coffee growth and production. Braz. J. Plant Physiol. 2007, 19, 485–510. [Google Scholar] [CrossRef] [Green Version]
  80. Okalebo, J.R.; Gathua, K.W.; Woomer, P.L. Laboratory Methods of Soil and Plant Analysis: A Working Manual, 2nd ed.; Sacred Africa: Nairobi, Kenya, 2002. [Google Scholar]
  81. Cordingley, J. Soil Fertility Survey of Rwandan Coffee Sector; Crop Nutrition Laboratory Services: Nairobi, Kenya, 2009. [Google Scholar]
  82. Tié, T.B.; Diby, L.N.; Seyo, E.; Assa, A. Estimating soil available nitrogen with a hot H2O2/KCl extraction. Sci. Res. Essays 2010, 5, 1455–1462. [Google Scholar]
  83. Kovar, J.L.; Pierzynski, G.M. Southern Cooperative Series Bulletin; North Carolina State University: Raleigh, North Carolina, USA, 2009. [Google Scholar]
  84. Pawar, D.R.; Randhe, D.B.; Shaikh, M.; Korde, A.K.; Shinde, K.A.; Yadav, M.P.; Chavan, A.E.; Sapkale, V.M. Laboratory Testing Procedure for Soil & Water Sample Analysis; Government of Maharashtra: Maharashtra, India, 2009. [Google Scholar]
  85. Langton, S. Avoiding edge effects in agroforestry experiments; the use of neighbour-balanced designs and guard areas. Agroforest. Syst. 1990, 12, 173–185. [Google Scholar] [CrossRef]
  86. Beuchelt, T.D.; Zeller, M. Profits and poverty: Certification’s troubled link for Nicaragua’s organic and fairtrade coffee producers. Ecol. Econ. 2011, 70, 1316–1324. [Google Scholar] [CrossRef]
  87. Uddin, M.T.; Dhar, A.R.; Islam, M.M. Adoption of conservation agriculture practice in Bangladesh: Impact on crop profitability and productivity. J. Bangladesh Agric. Univ. 2016, 14, 101–112. [Google Scholar] [CrossRef] [Green Version]
  88. Archontoulis, S.V.; Miguez, F.E. Nonlinear Regression Models and Applications in Agricultural Research. Agron. J. 2015, 107, 786–798. [Google Scholar] [CrossRef] [Green Version]
  89. Omeja, P.A.; Chapman, C.A.; Obua, J.; Lwanga, J.S.; Jacob, A.L.; Wanyama, F.; Mugenyi, R. Intensive tree planting facilitates tropical forest biodiversity and biomass accumulation in Kibale National Park, Uganda. For. Ecol. Manag. 2011, 261, 703–709. [Google Scholar] [CrossRef]
  90. Zaim, M.; Kumar, Y.; Hallan, V.; Zaidi, A.A. Velvet bean severe mosaic virus: A distinct begomovirus species causing severe mosaic in Mucuna pruriens (L.) DC. Virus Genes 2011, 43, 138–146. [Google Scholar] [CrossRef]
  91. Blanchart, E.; Villenave, C.; Viallatoux, A.; Barthès, B.; Girardin, C.; Azontonde, A.; Feller, C. Long-term effect of a legume cover crop (Mucuna pruriens var. utilis) on the communities of soil macrofauna and nematofauna, under maize cultivation, in southern Benin. Eur. J. Soil Biol. 2006, 42, S136–S144. [Google Scholar] [CrossRef]
  92. Sims, J.T.; Simard, R.R.; Joern, B.C. Phosphorus Loss in Agricultural Drainage: Historical Perspective and Current Research. J. Environ. Qual. 1998, 27, 277–293. [Google Scholar] [CrossRef] [Green Version]
  93. Addiscott, T.M.; Thomas, D. Tillage, mineralization and leaching: Phosphate. Soil Tillage Res. 2000, 53, 255–273. [Google Scholar] [CrossRef]
  94. Fu, B.; Chen, L.; Huang, H.; Qu, P.; Wei, Z. Impacts of crop residues on soil health: A review. Environ. Pollut. Bioavailab. 2021, 33, 164–173. [Google Scholar] [CrossRef]
  95. Mancuso, M.A.C.; Soratto, R.P.; Crusciol, C.A.C.; Castro, G.S.A. Effect of potassium sources and rates on arabica coffee yield, nutrition, and macronutrient export. Rev. Bras. Ciênc. Solo 2014, 38, 1448–1456. [Google Scholar] [CrossRef]
  96. Melke, A.; Ittana, F. Nutritional Requirement and Management of Arabica Coffee (Coffea arabica L.) in Ethiopia: National and Global Perspectives. AJEA 2014, 5, 400–418. [Google Scholar] [CrossRef]
  97. Waller, J.M.; Bigger, M.; Hillocks, R.J. Coffee Pests, Diseases and Their Management; CABI Pub: Wallingford, UK; Cambridge, MA, USA, 2007; ISBN 978-1-84593-129-2. [Google Scholar]
  98. Murthy, P.S.; Madhava Naidu, M. Sustainable management of coffee industry by-products and value addition—A review. Resour. Conserv. Recycl. 2012, 66, 45–58. [Google Scholar] [CrossRef]
  99. Wairegi, L.; van Asten, P.; Giller, K.; Fairhurst, T. Banana-Coffee System Cropping Guide; Africa Soil Health Consortium: Muscle Shoals, AL, USA, 2016; p. 104. [Google Scholar]
  100. Sarmiento-Soler, A.; Vaast, P.; Hoffmann, M.P.; Rötter, R.P.; Jassogne, L.; van Asten, P.J.A.; Graefe, S. Water use of Coffea arabica in open versus shaded systems under smallholder’s farm conditions in Eastern Uganda. Agric. For. Meteorol. 2019, 266–267, 231–242. [Google Scholar] [CrossRef]
  101. Iijima, M.; Izumi, Y.; Yuliadi, E.; Sunyoto; Afandi; Utomo, M. Erosion Control on a Steep Sloped Coffee Field in Indonesia with Alley Cropping, Intercropped Vegetables, and No-Tillage. Plant Prod. Sci. 2003, 6, 224–229. [Google Scholar] [CrossRef]
Figure 1. Location of experimental sites: adapted from Tibasiima et al. [28].
Sustainability 15 02453 g001
Figure 2. Monthly rainfall (mm) of Kyondo sub-county during the two years of the experimental study. (Source: field data).
Sustainability 15 02453 g002
Figure 3. Diagrammatic illustration of the single block experimental design used on the 26 farms.
Sustainability 15 02453 g003
Figure 4. Box plots of the mean biomass (mt/ha) per treatment for the four seasons.
Sustainability 15 02453 g004
Table 1. Management procedure of the different experimental treatments.
Date.ActivityActivity Description Treatment
21 January 2018Weed control by hoeAll weeds were cleared and turned into the soil using a hand hoe.T1, T2, T3 and T4
12 April 2018,
16 September 2018,
12 April 2019,
16 September 2019
T4
3 July 2018,
4 December 2018,
3 July 2019,
and 4 December 2019
After sampling for biomass, all weeds were cleared and turned into the soil using a hand hoe.T4
12 February 2018Planting the different treatmentsTreatments were randomly allocated to the plots and planted at the spacing and plant population indicated in Figure 3.T1, T2, T3
16 July 2018,
12 February 2019,
and 16 July 2019
Mucuna pruriens was integrated into the specific plots where it had been planted in the first growing season. The spacing and seed rate is indicated in Figure 3.T1 and T3
12 April 2018,
16 September 2018,
12 April 2019,
and 16 September 2019
Spot weedingWeeds were removed by hand and left on the ground surface as mulch within the respective plots.T1, T2 and T3
3 July 2018
and 4 December 2018
Sampling for biomass/harvestingAbove-ground biomass cover (excluding coffee trees and M. dura trees) in each plot was cut at the root collar and was returned to the respective plot as a surface mulch.T1, T2, T3 and T4
3 July 2019
and 4 December 2019
Above-ground biomass cover (excluding coffee trees and M. dura trees) in each plot was cut at the root collar.
Millettia dura trees were pruned according to the guidelines by Nyombi et al. [77].
All cut material was returned to the respective plot as a surface mulch.
Table 2. Post hoc analysis of mean biomass (mt/ha) by treatment.
TreatmentMean Difference in Biomass Std. Errort ValuePr (>|t|)
T2-T1−1.590.06−27.530.00
T3-T10.670.0611.570.00
T4-T1−2.090.06−36.220.00
T3-T22.260.0639.100.00
T4-T2−0.500.06−8.690.00
T4-T3−2.760.06−47.790.00
Table 3. Cross tabulation of biomass (mt/ha) treatment and season effect.
TreatmentSR1LR1SR2LR2
T13.57 (0.05) b4.06 (0.05) b3.78 (0.05) b3.32 (0.10) b
T21.41 (0.03) c1.62 (0.03) c2.46 (0.07) c 2.88 (0.13) c
T33.88 (0.05) a4.53 (0.04) a4.41 (0.06) a4.58 (0.05) a
T41.43 (0.04) c1.60 (0.03) c1.59 (0.04) d1.74 (0.03) d
Figures followed by different superscripts are significantly different at p < 0.05 (otherwise non-significant). Comparisons are done column-wise using Tukey’s post hoc analysis of the regression model biomass by treatment and season. Figures in the brackets are the standard error of the mean.
Table 4. Change in soil’s plant-available nutrients between 2018 and 2020.
Treatment% Change in Available Soil-Plant Nutrients
NPK
T182.76−7.4126.33
T258.53−4.5716.57
T369.92−3.0530.64
T4−0.35−52.87−2.90
The pairwise comparison test showed that T4 had a significant change (p = 0.016) compared to T1, T2, and T3. The N, P, and K pairwise comparison tests showed significant differences in all treatment pairs (p < 0.05).
Table 5. Cross tabulation of coffee yield (mt/ha) with treatment and season.
TreatmentSR1LR1SR2LR2
T10.47 (0.03) a0.96 (0.04) a1.07 (0.07) a1.54 (0.09) b
T20.34 (0.02) b c0.53 (0.03) b0.67 (0.05) b1.22 (0.06) c
T30.39 (0.04) a b0.95 (0.04) a1.16 (0.07) a1.91 (0.08) a
T40.24 (0.02) c0.37 (0.03) c0.43 (0.05) c0.57 (0.03) d
Figures followed by different superscripts are significantly different at p < 0.05 (otherwise non-significant). Comparisons are done column-wise using Tukey’s post hoc analysis of the regression model coffee yield by treatment and season. Figures in brackets are the standard error of the mean.
Table 6. Post hoc analysis of the profit mean by treatment.
TableMean Difference in ProfitStd. Errort ValuePr (>|t|)
T2-T1−421.9347.56−8.870.00
T3-T1−148.2047.56−3.120.01
T4-T1−616.1647.56−12.960.00
T3-T2273.7347.565.760.00
T4-T2−194.2347.56−4.080.00
T4-T3−467.9547.56−9.840.00
Table 7. Cross-tabulation of gross profit for the different treatments and seasons.
TreatmentSR1LR1SR2LR2
Gross Profit ($ ha−1)
T1−206.7 (21.78) a504.9 (30.15) a700.6 (48.82) a1047.5 (63.86) b
T2−1012.9 (17.48) c278.2 (25.45) b332.8 (40.28) b760.5 (47.51) c
T3−1122.3 (29.71) d475.1 (30.99) a764.4 (52.04) a1336.3 (60.37) a
T4−331.0 (19.99) b−188.0 (24.60) c−3.1 (33.15) c103.8 (23.01) d
Figures followed by different superscripts are significantly different at p < 0.05 (otherwise non-significant). Comparisons are done columnwise using Tukey’s post hoc analysis of the regression model profit by treatment and season. Figures in brackets are the standard error of the mean.
Disclaimer/Publisher’s Note: The statements, opinions and data contained in all publications are solely those of the individual author(s) and contributor(s) and not of MDPI and/or the editor(s). MDPI and/or the editor(s) disclaim responsibility for any injury to people or property resulting from any ideas, methods, instructions or products referred to in the content.

