Article

Potential Use of Bio-Oleogel as Phase Change Material

by
Natasha Dantas Lorenzo
1,
Leonardo Seibert Kuhn
2,
Túlio Caetano Guimarães
2,*,
Mona Nazari Sam
3,
Christoph Mankel
3,
Antonio Caggiano
3,
Eduardus Koenders
3,
Cleiton Antonio Nunes
4 and
Saulo Rocha Ferreira
2
1
Department of Chemistry, Federal University of Lavras, Lavras 37203-202, Brazil
2
Department of Engineering, Federal University of Lavras, Lavras 37203-202, Brazil
3
Institut für Werkstoffe im Bauwesen, Technische Universität Darmstadt, 64289 Darmstadt, Germany
4
Department of Food Science, Federal University of Lavras, Lavras 37203-202, Brazil
*
Author to whom correspondence should be addressed.
Sustainability 2023, 15(3), 2534; https://doi.org/10.3390/su15032534
Submission received: 16 December 2022 / Revised: 24 January 2023 / Accepted: 29 January 2023 / Published: 31 January 2023
(This article belongs to the Section Sustainable Materials)

Abstract

:
Two bio-oleogels were investigated. These materials were produced with a combination of canola and soybean oil with 4, 6, 8, and 10% of beeswax (by weight). Sensible heat storage capacity, melting parameters, and enthalpies were investigated by the differential scanning calorimetry (DSC) test. An ordinary DSC dynamic test was performed. Cycles of heating and cooling were performed, as well as tests with different heating rates. According to the results, the materials present a melting temperature between −16 to −12 °C and a total latent heat between 22.9 and 367.6 J/g. BC10 (canola oil with 10% beeswax) was the sample with the best performance, with a latent heat of 367.6 J/g and a melting temperature of −13.6 °C, demonstrating its possible use as a phase change material for cold storage.

1. Introduction

Phase change materials (PCMs) are well known when it comes to thermal energy storage (TES) due to their large thermal energy storage capacity through latent heat [1]. Nowadays, many studies have been investigating the use of PCM in buildings and construction materials, indicating that PCMs can remarkably improve the building energy performance [2,3,4,5,6,7].
The appropriate use of PCMs can minimize the peak heating and cooling loads and has the capability to keep indoor temperatures within comfort range due to smaller temperature fluctuations, providing buildings with higher thermal inertia, smaller range of diurnal temperature variations, and reduced energy consumption [8].
This remarkable feature led research to the improvement of PCMs, involving characteristics such as thermal conduction during the melting of the material and use, through encapsulation, of porous material, among other methods [9,10,11].
The use of PCM in cooling systems has attracted the attention of research related to the food industry, more specifically for the development of packaging that can preserve food without fluctuating the temperature of products that are part of the cold chain system. The main reason for such interest relies on the fact that the shelf life of most food is quite sensitive to temperature variations. This is the main cause of deterioration and economic loss of perishable goods in processes of transportation, handling, distribution, storage, and consumption [12].
Some studies [13,14] describing this possibility and other practical applications of PCMs as packaging material have already been published [15,16,17,18,19,20]. However, most of this research worked with commercial PCMs such as Rubitherm RT5 or commercial acids such as octanoic acid.
The search for sustainable and renewable materials has been gaining importance worldwide. In this context, bio-based materials often present themselves as more eco-friendly alternatives to conventional materials. Bio-based PCMs are derived from animals or plants, being mostly waxes, oils, or greases, among others. As they are more complex materials, their phase change temperature range is slightly wider compared to other organic PCMs such as paraffines. They have already been extensively researched for several applications, including buildings, solar energy, and applications that require temperatures below 0 °C [21,22,23,24].
Combining different bio-based materials opens up the possibility of modifying their properties, potentially leading to more efficient products. Since oils present low solidification temperatures and waxes present high melting temperatures, compared to the ambient temperature, the combination of the two results in a material with an intermediate melting temperature. With this prospect, oleogelation was proposed as a feasible method to achieve this. Oleogel is a gel-like material formed by a low concentration (<10%) of an oleogelator, generally wax, and an oil. Using the appropriate gelation method, oleogelator molecules are dispersed in the oil phase and self-assemble to form a network, structuring the liquid oil. The crystalline phase is usually prepared by controlled rapid cooling of a warm liquid oil phase to a temperature well below the melting point of the crystalline phase. The formation of very large crystals is prevented by deep cooling and high cooling rates. This avoids crystallization conditions just below the melting point of the crystalline phase, where supercooling can occur relatively easily because nucleation rates are low and crystal growth rates are large [25,26,27].
This research can be considered a new approach in the use of oleogels as a PCM. In order to verify this possible application, this work has the objectives of: (1) demonstrating oleogel’s effectiveness as a PCM for cold storage; (2) comparing these results with other organic PCMs developed in other studies.

2. Materials and Methods
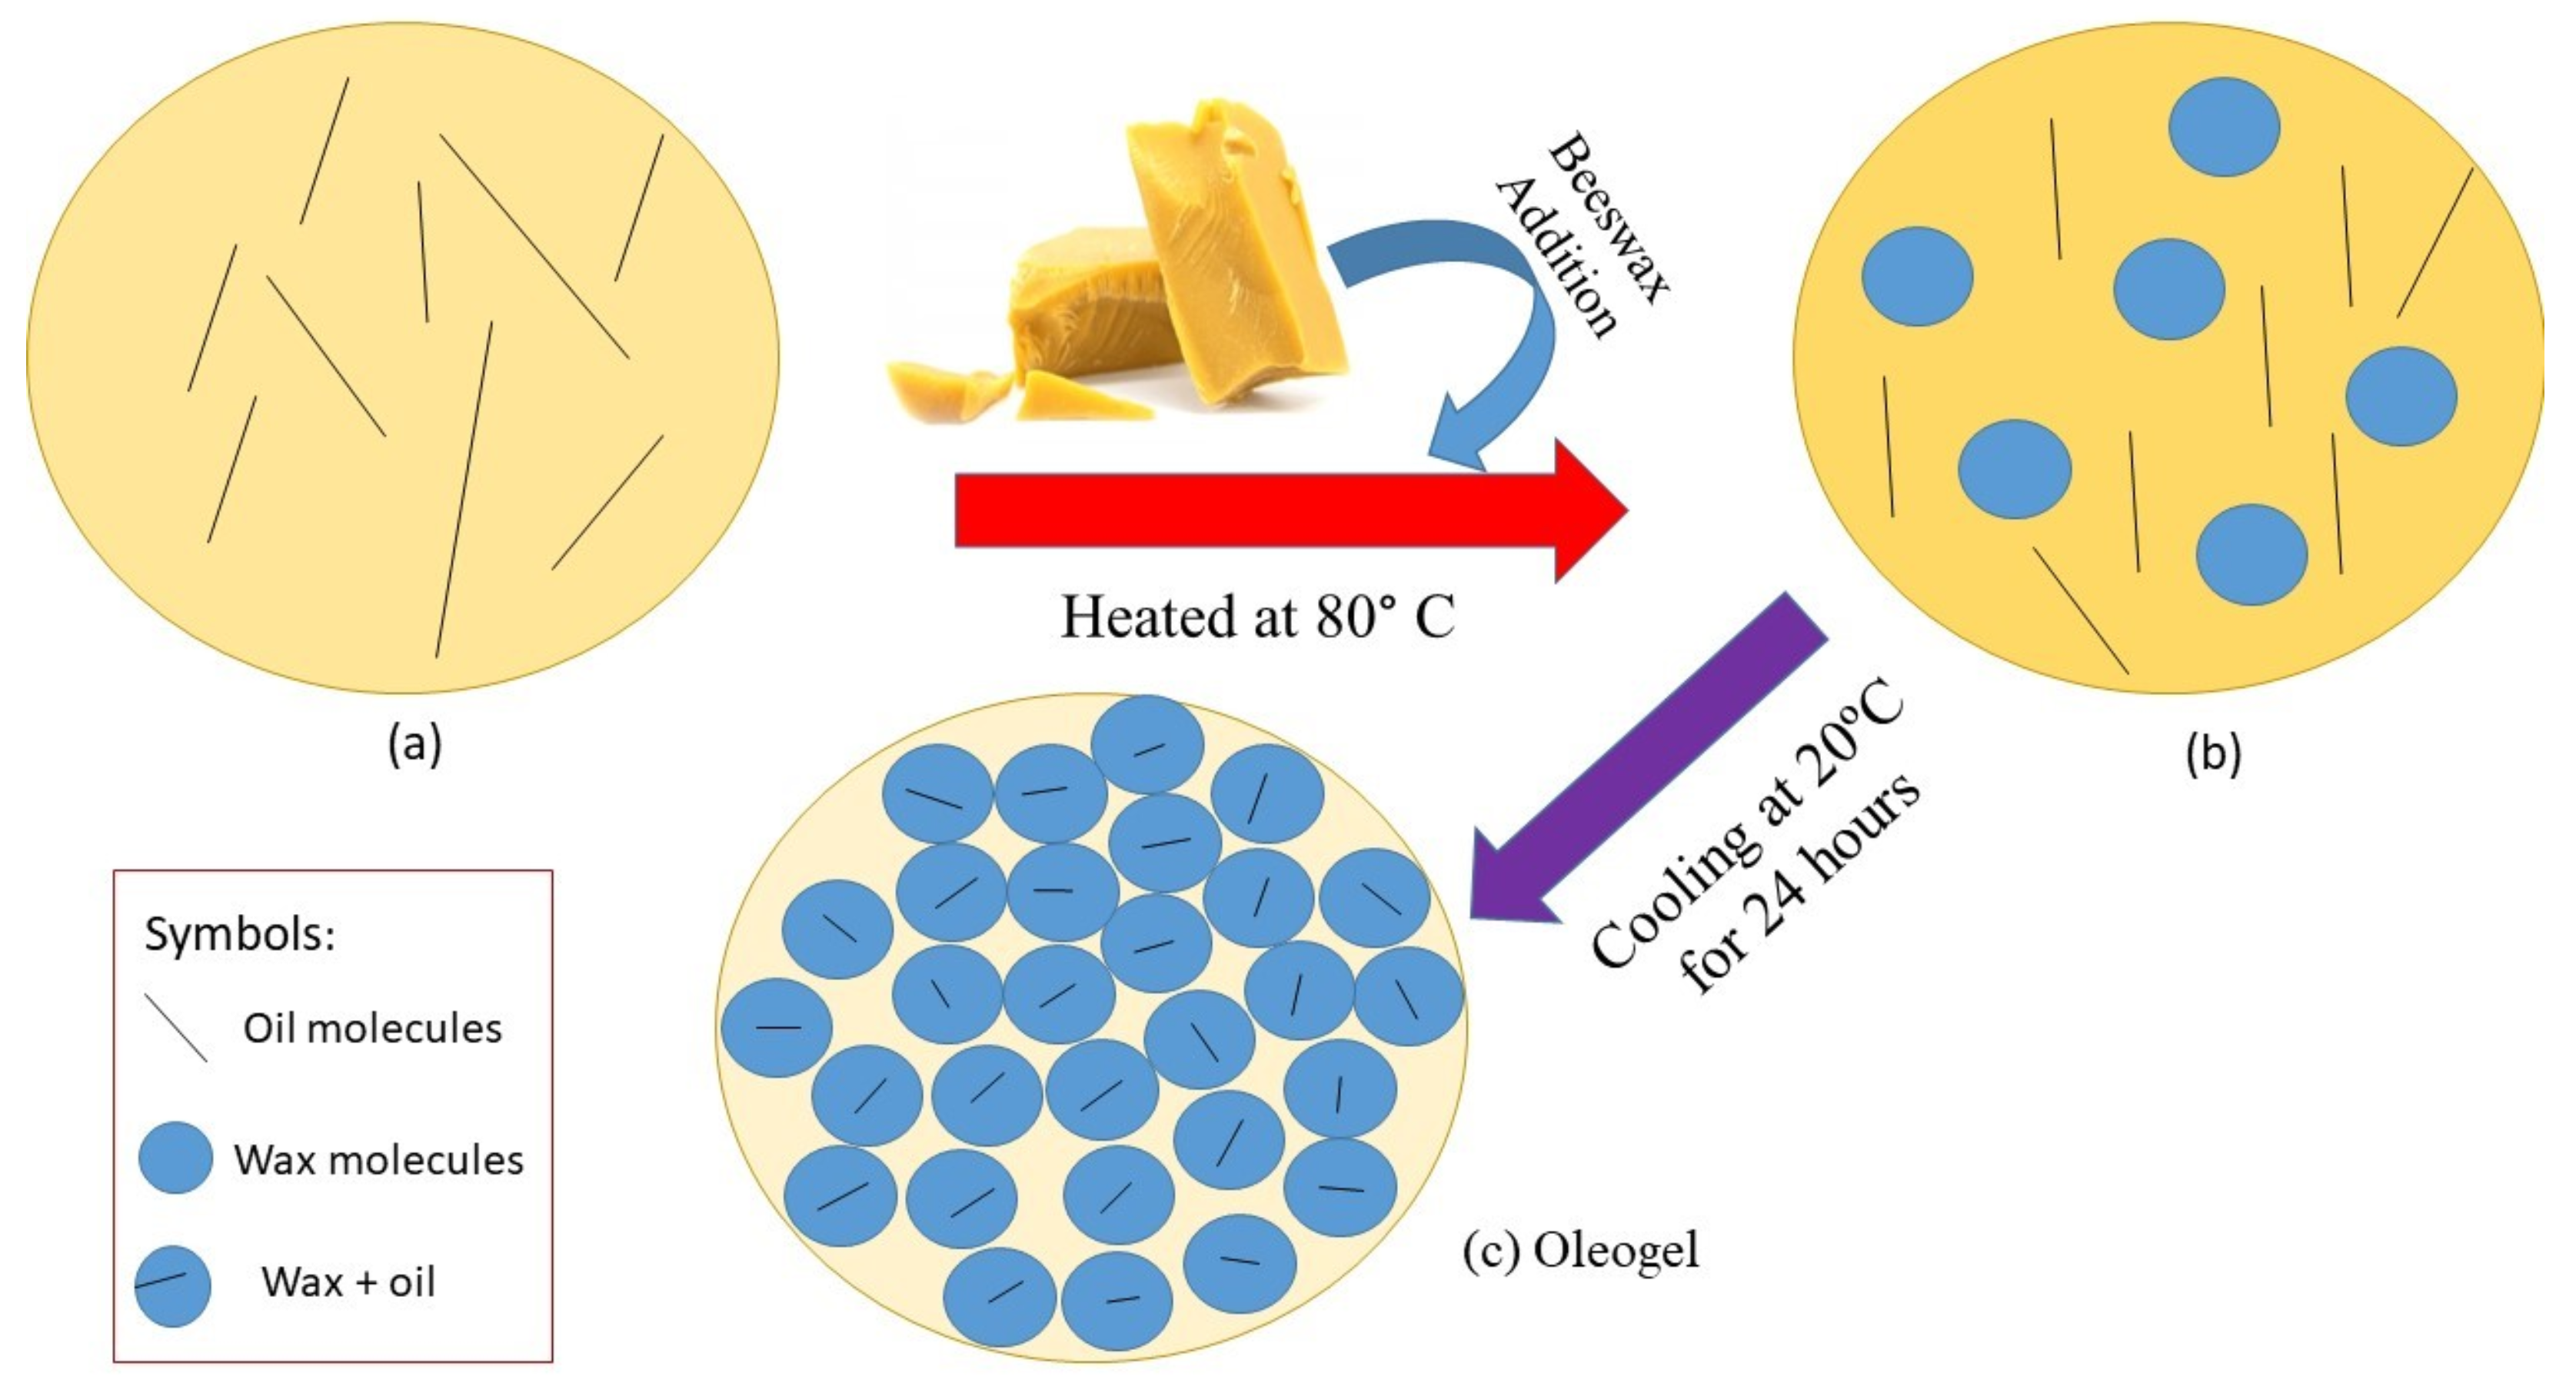
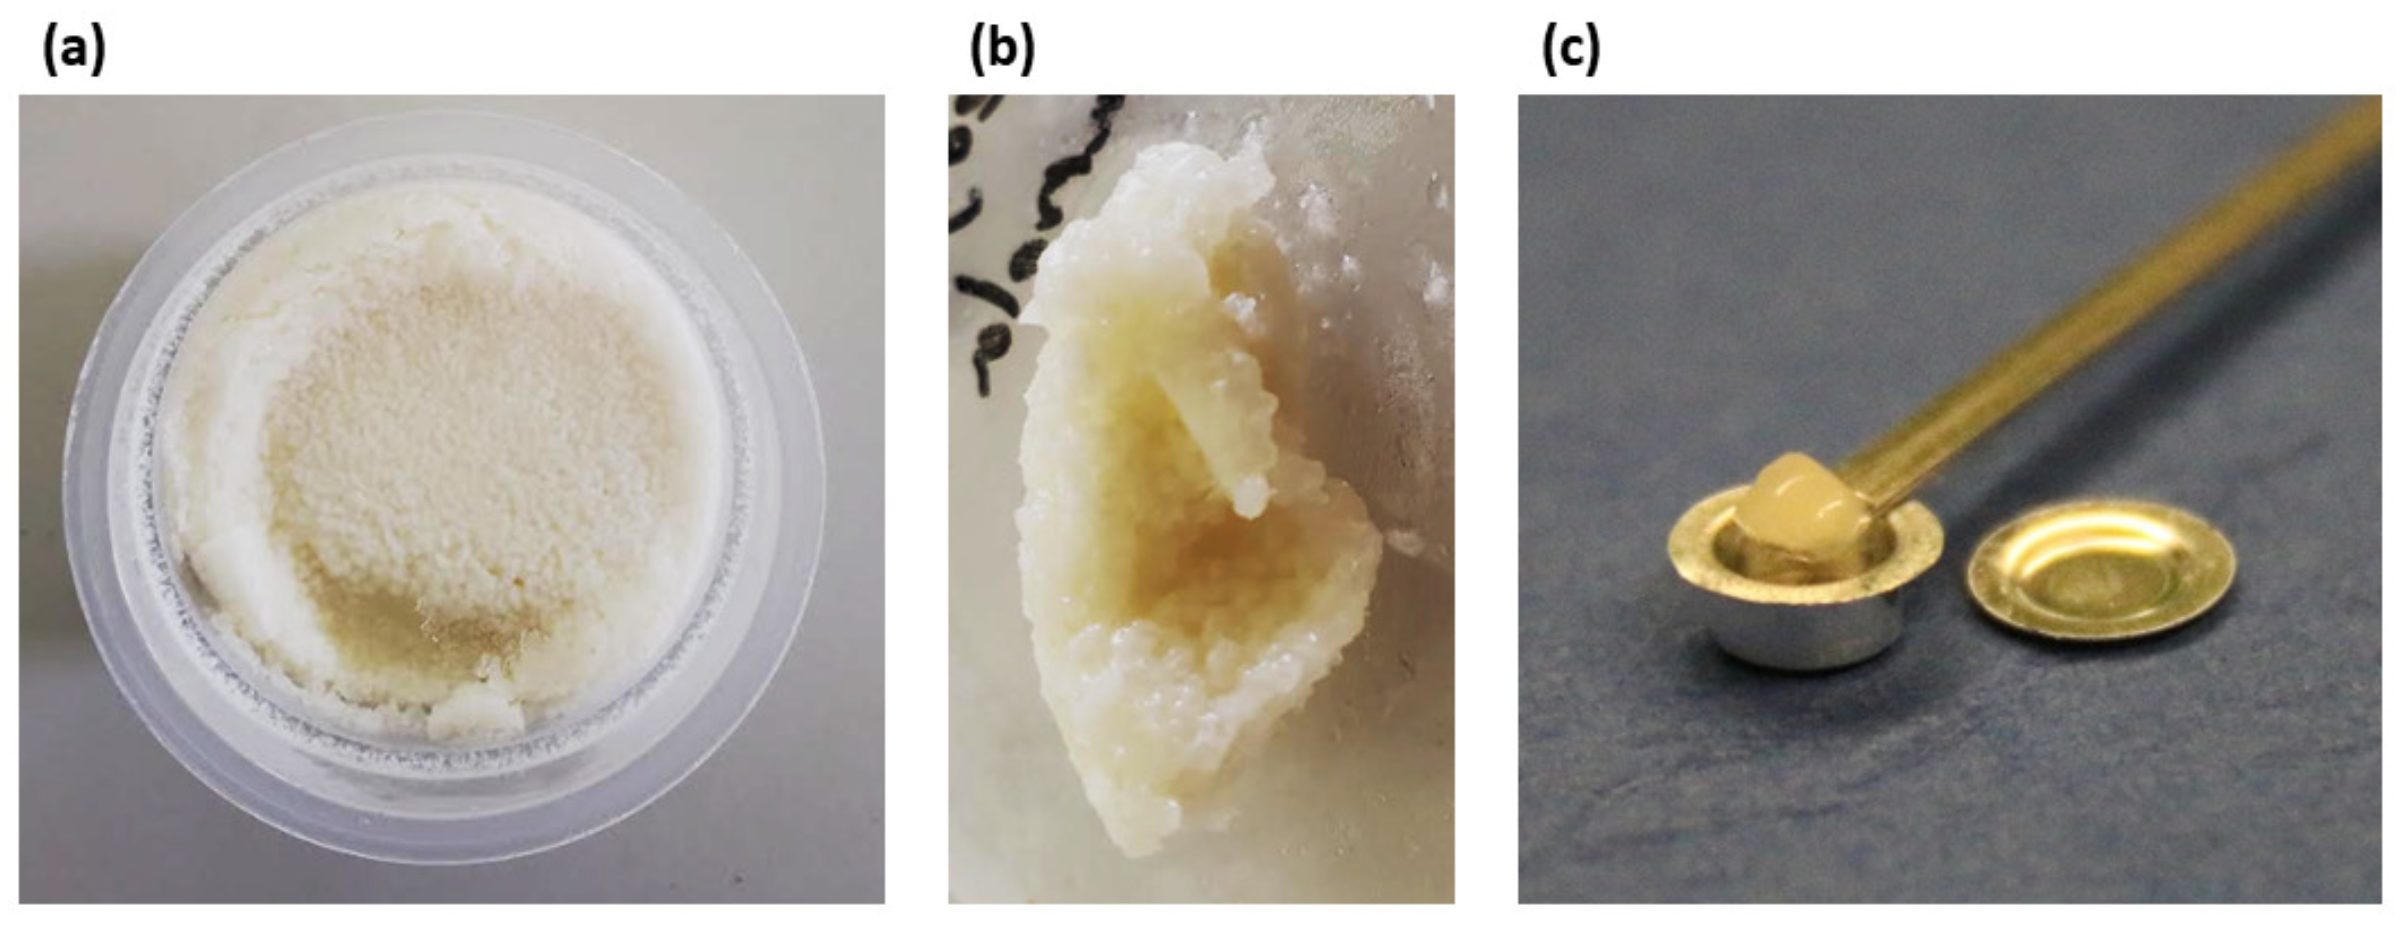
2.1. Bio-Oleogel

The oils (soybean and canola), as well as the beeswax, were obtained in a local market. The soybean oil utilized was from Liza brand, produced by Cargill Agricola S.A. (Brazil). The canola oil utilized was from Purilev brand, produced by Cargill Agricola S.A. (Brazil). Oil content in these products was 100%, according to the label.
The raw materials were weighed, and then the wax was added to the oil in a water bath at 80 °C and the mixture was manually stirred with a glass stick for 10 min. After that, the material was cooled at 20 °C for 24 h. Figure 1 illustrates the formation process of the oleogel. In Figure 1a, oil molecules are dispersed in the oil phase. When the oil was heated, the oleogelator (wax) was added and both were dispersed in the oil phase as demonstrated in Figure 1b. During the cooling process, the oil and the wax molecules, present in the oil phase, self-assemble to form a network, structuring the liquid oil and obtaining the oleogel, as observed in Figure 1.
The sequence of produced oleogels is presented in Table 1. A total of eight different formulations is studied: four with soybean oil and four with canola oil. All oleogels were prepared with beeswax at different contents by oil weight (4, 6, 8, and 10%).

2.2. Methods

2.2.1. Attenuated Total Reflectance Infrared Spectroscopy (ATR–IR)

Infrared spectroscopy tests were carried out (Varian 660-IR, Agilent Technologies, USA with ATR Pike MIRacle, Pike Technologies, Madison, WI, USA), analyzing spectra in the wavenumber range between 4000 and 400 cm−1 with 2 cm−1 resolution and using air as background. No prior sample preparation was needed for the oleogel samples. Both sample and background spectrum were registered with 32 scans.

2.2.2. Differential Scanning Calorimetry (DSC)

Thermal energy storage (TES) was evaluated by DSC. A heat-flux DSC method, named as a dynamic method, was applied. German codes DIN 51005:2022 [28] and DIN 51007:2019 [29] have been used as a reference to perform DSC tests, whereas IEA standard procedure DSC 4229 PCM Standard [30,31] is followed to determine the heat storage capacity of the PCMs. Detailed information about the calculation of the heat storage capacity can be found in [32]. The test was performed in a NETZSCH, equipment model DSC 214. An alumina crucible (capacity of 40 µL) with a hole in the lid was used. Figure 2 illustrates the preparation of a sample for a DSC test.
The DSC test was performed over a temperature range of −50 to 60 °C. Each test was performed with three cycles, according to IEA proceedings. An initial analysis was performed on soybean and canola oil gels with lower and higher contents of beeswax (4 and 10%, respectively). The analysis was performed at 10 °C/min. A single test of each oleogel was performed. The PCM with the best performance, in this case, canola oil with beeswax, was further evaluated, including intermediary oleogels (with 6 and 8% of beeswax). These tests were performed in order to evaluate and indicate the optimum amount of beeswax on canola oleogel. Further, the best oleogel was carefully tested at different heat rates: 0.125, 0.5, and 1 K/min. This last step was performed according to TES parameters. This procedure is necessary in order to obtain a more realistic understanding of the material. In the dynamic measuring mode with a constant heating or cooling rate, a temperature gradient occurs within the specimen. This temperature gradient depends on the specimen geometry, specimen mass, and material properties (enthalpy and thermal conductivity). The effect is more significant inside the phase change than outside. To achieve sufficient measurement accuracy, thermal equilibrium within the sample must be targeted. Accordingly, the DSC test must be performed using suitable heating/cooling rates.
In this way, the DSC measurement must be carried out with several samples, changing the heating rate from 10 to 0.125 K/min. This process must be performed until the temperature between its enthalpy curves presents a value of 0.2 K. The tests were performed with heating rates of 10, 1, 0.5, and 0.125 K/min according to IEA standards, and can be used to control/solve heating rate issues, as has been shown.

2.2.3. Thermogravimetric Analysis (TGA)

Oleogel samples were subjected to thermogravimetric analysis. The test was performed with an STA 449 F5 Jupiter instrument from NETZSCH. Samples were heated from 25 °C to 1000 °C in nitrogen gas flowing at 20 mL/min with a heating rate of 10 °C/min. The degradation temperature was determined from the intersection of the baseline in the differential thermogravimetric (DTG) curve. An open alumina crucible was used.

2.2.4. Viscosity

Viscosity was determined by using a Brookfield viscosimeter, model DVII Brookfield. Samples were placed in a beaker (100 mL). A spindle #64 was used. The test was performed at 20 °C, with an angular velocity between 12 and 60RPM [33,34].

3. Results and Discussion

3.1. Structural Characterization of Oleogel by ATR-IR

In order to evaluate the chemical structure of the produced oleogels, FTIR analysis was performed. ATR-IR spectra of all samples are presented in Figure 3.
According to [35], beeswax represents a complex organic mixture of numerous compounds. However, in a typical IR spectrum, only the most dominating ones are observable and considerable as beeswax. The results observed in Figure 3 are mostly analyte signals belonging to hydrocarbons, esters, and free fatty acids in accordance with [35]. A typical FTIR–ATR spectrum of canola and soybean oil in comparison to characteristic beeswax (raw materials) is presented in Figure 3. It is characterized by a molecular structure related to hydrocarbon absorption bands (at 2922, 2852, 1743, and 1157 cm−1). The main spectral differences between beeswax and the oils are observed in the fingerprint region. The analyte signals are related to the ester and free fatty acids vibrations (at 1743 and 1157 cm−1). These signals are considerably stronger and characterized by the increase in maximum absorption in comparison to beeswax signals.
Figure 3 shows the FTIR spectra of canola oleogel (4, 6, 8, and 10% of beeswax). These spectra showed the typical characteristic of absorption bands similar to the raw materials. The most prominent absorption band at 1743 cm−1 can be assigned to the C=O stretching of aliphatic esters. The strong bands at around 2922 and 2852 cm−1 can be ascribed to the asymmetrical and symmetrical C–H stretching vibrations of CH2 groups. The band at around 1157 cm−1 can be assigned to the stretching of the C–O bonds of aliphatic esters. Similar results were found in canola oil [36], beeswax [35] and soybean oil [37]. At first sight, the entire ranges of spectra of the oleogel with different concentrations look similar. However, the 2852 and 1157 cm−1 bands reveal some discrepancies with 4, 8, and 10% beeswax concentration.
Figure 3 shows FTIR spectra of soybean oleogel (4, 6, 8, and 10% of beeswax). Each band and shoulder in FTIR spectra corresponds to the functional group responsible for IR absorption and exhibits the characteristic bands for edible fats and oils and it shows in accordance with the spectra of the raw materials. All spectra look very similar to the raw material and are dominated by FTIR spectra triglycerides. However, if we examine the spectra closely, they reveal some differences in terms of peak intensities or shift, which can be observed in the region around 2922–2852 cm−1, as well as at the fingerprint region, between 1743 and 1157 cm−1. It was observed that different concentrations of beeswax) reveal discrepancies in the FTIR spectra, mainly in 2852 and 1157 cm−1 bands for 8 and 10%. This can be associated with the differences in compact entrapment of oil within crystal network, in addition to differences in van der Waals interaction oil–wax, depending on the concentration of beeswax [38].

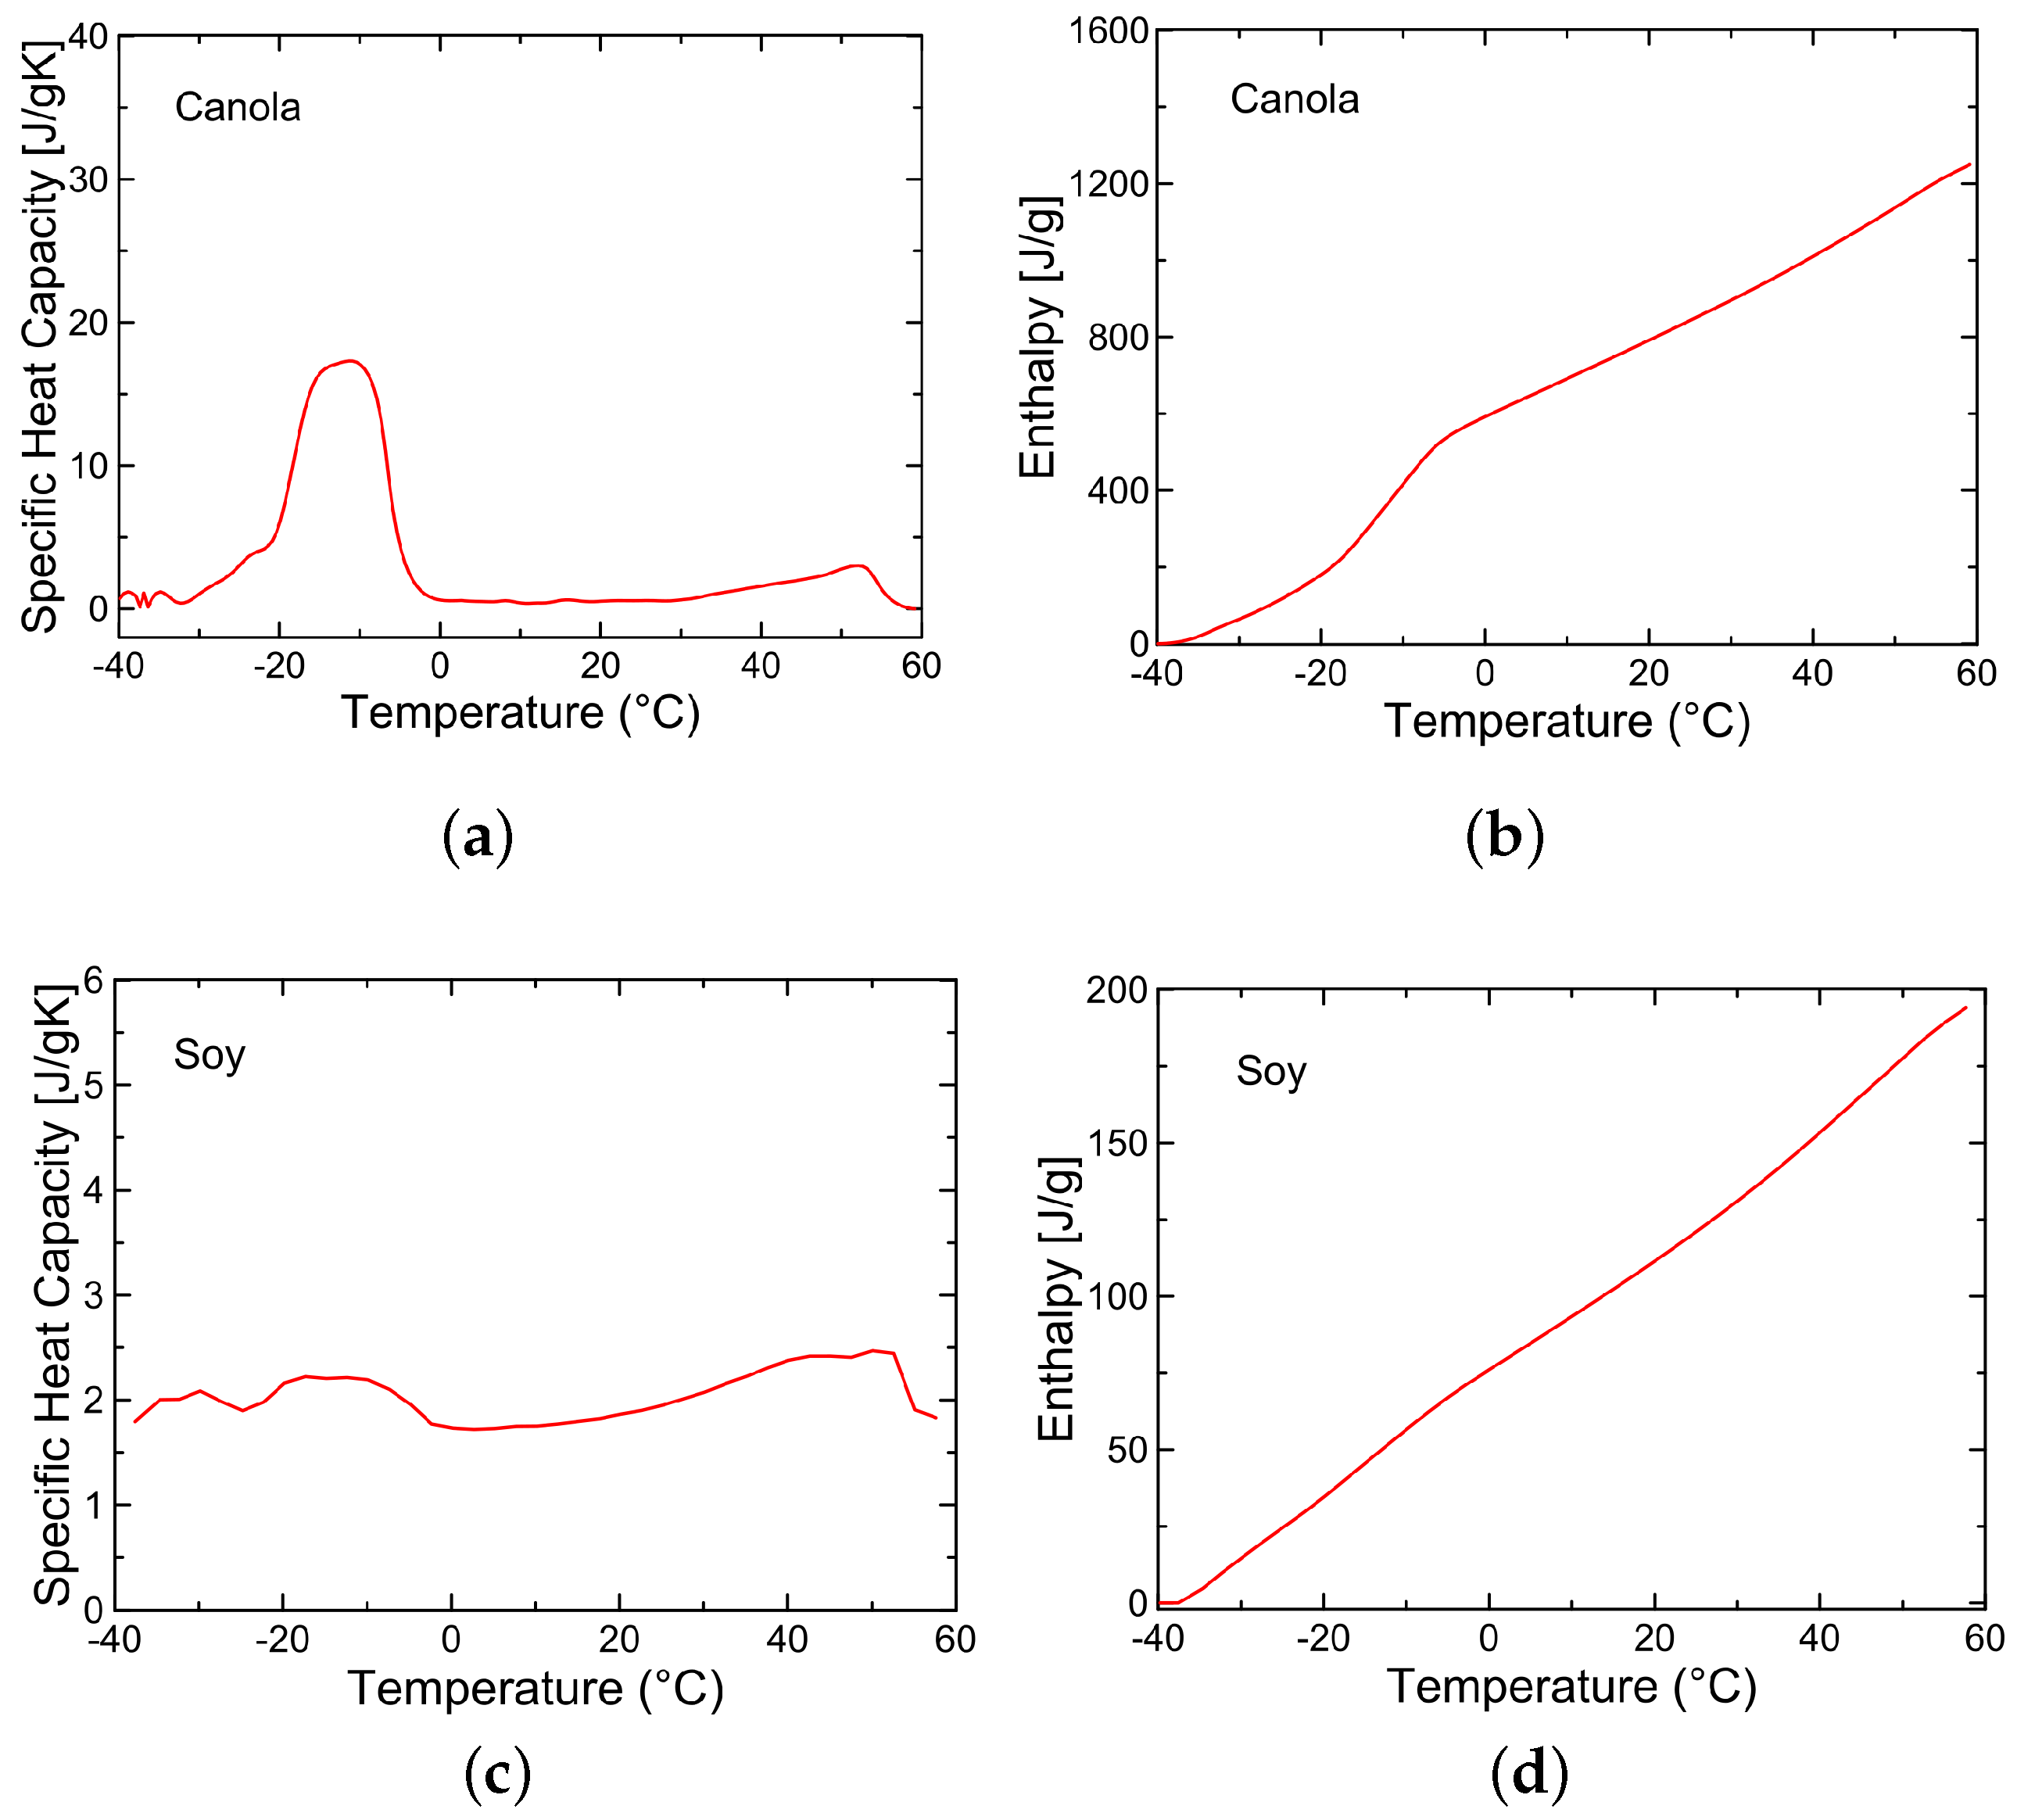
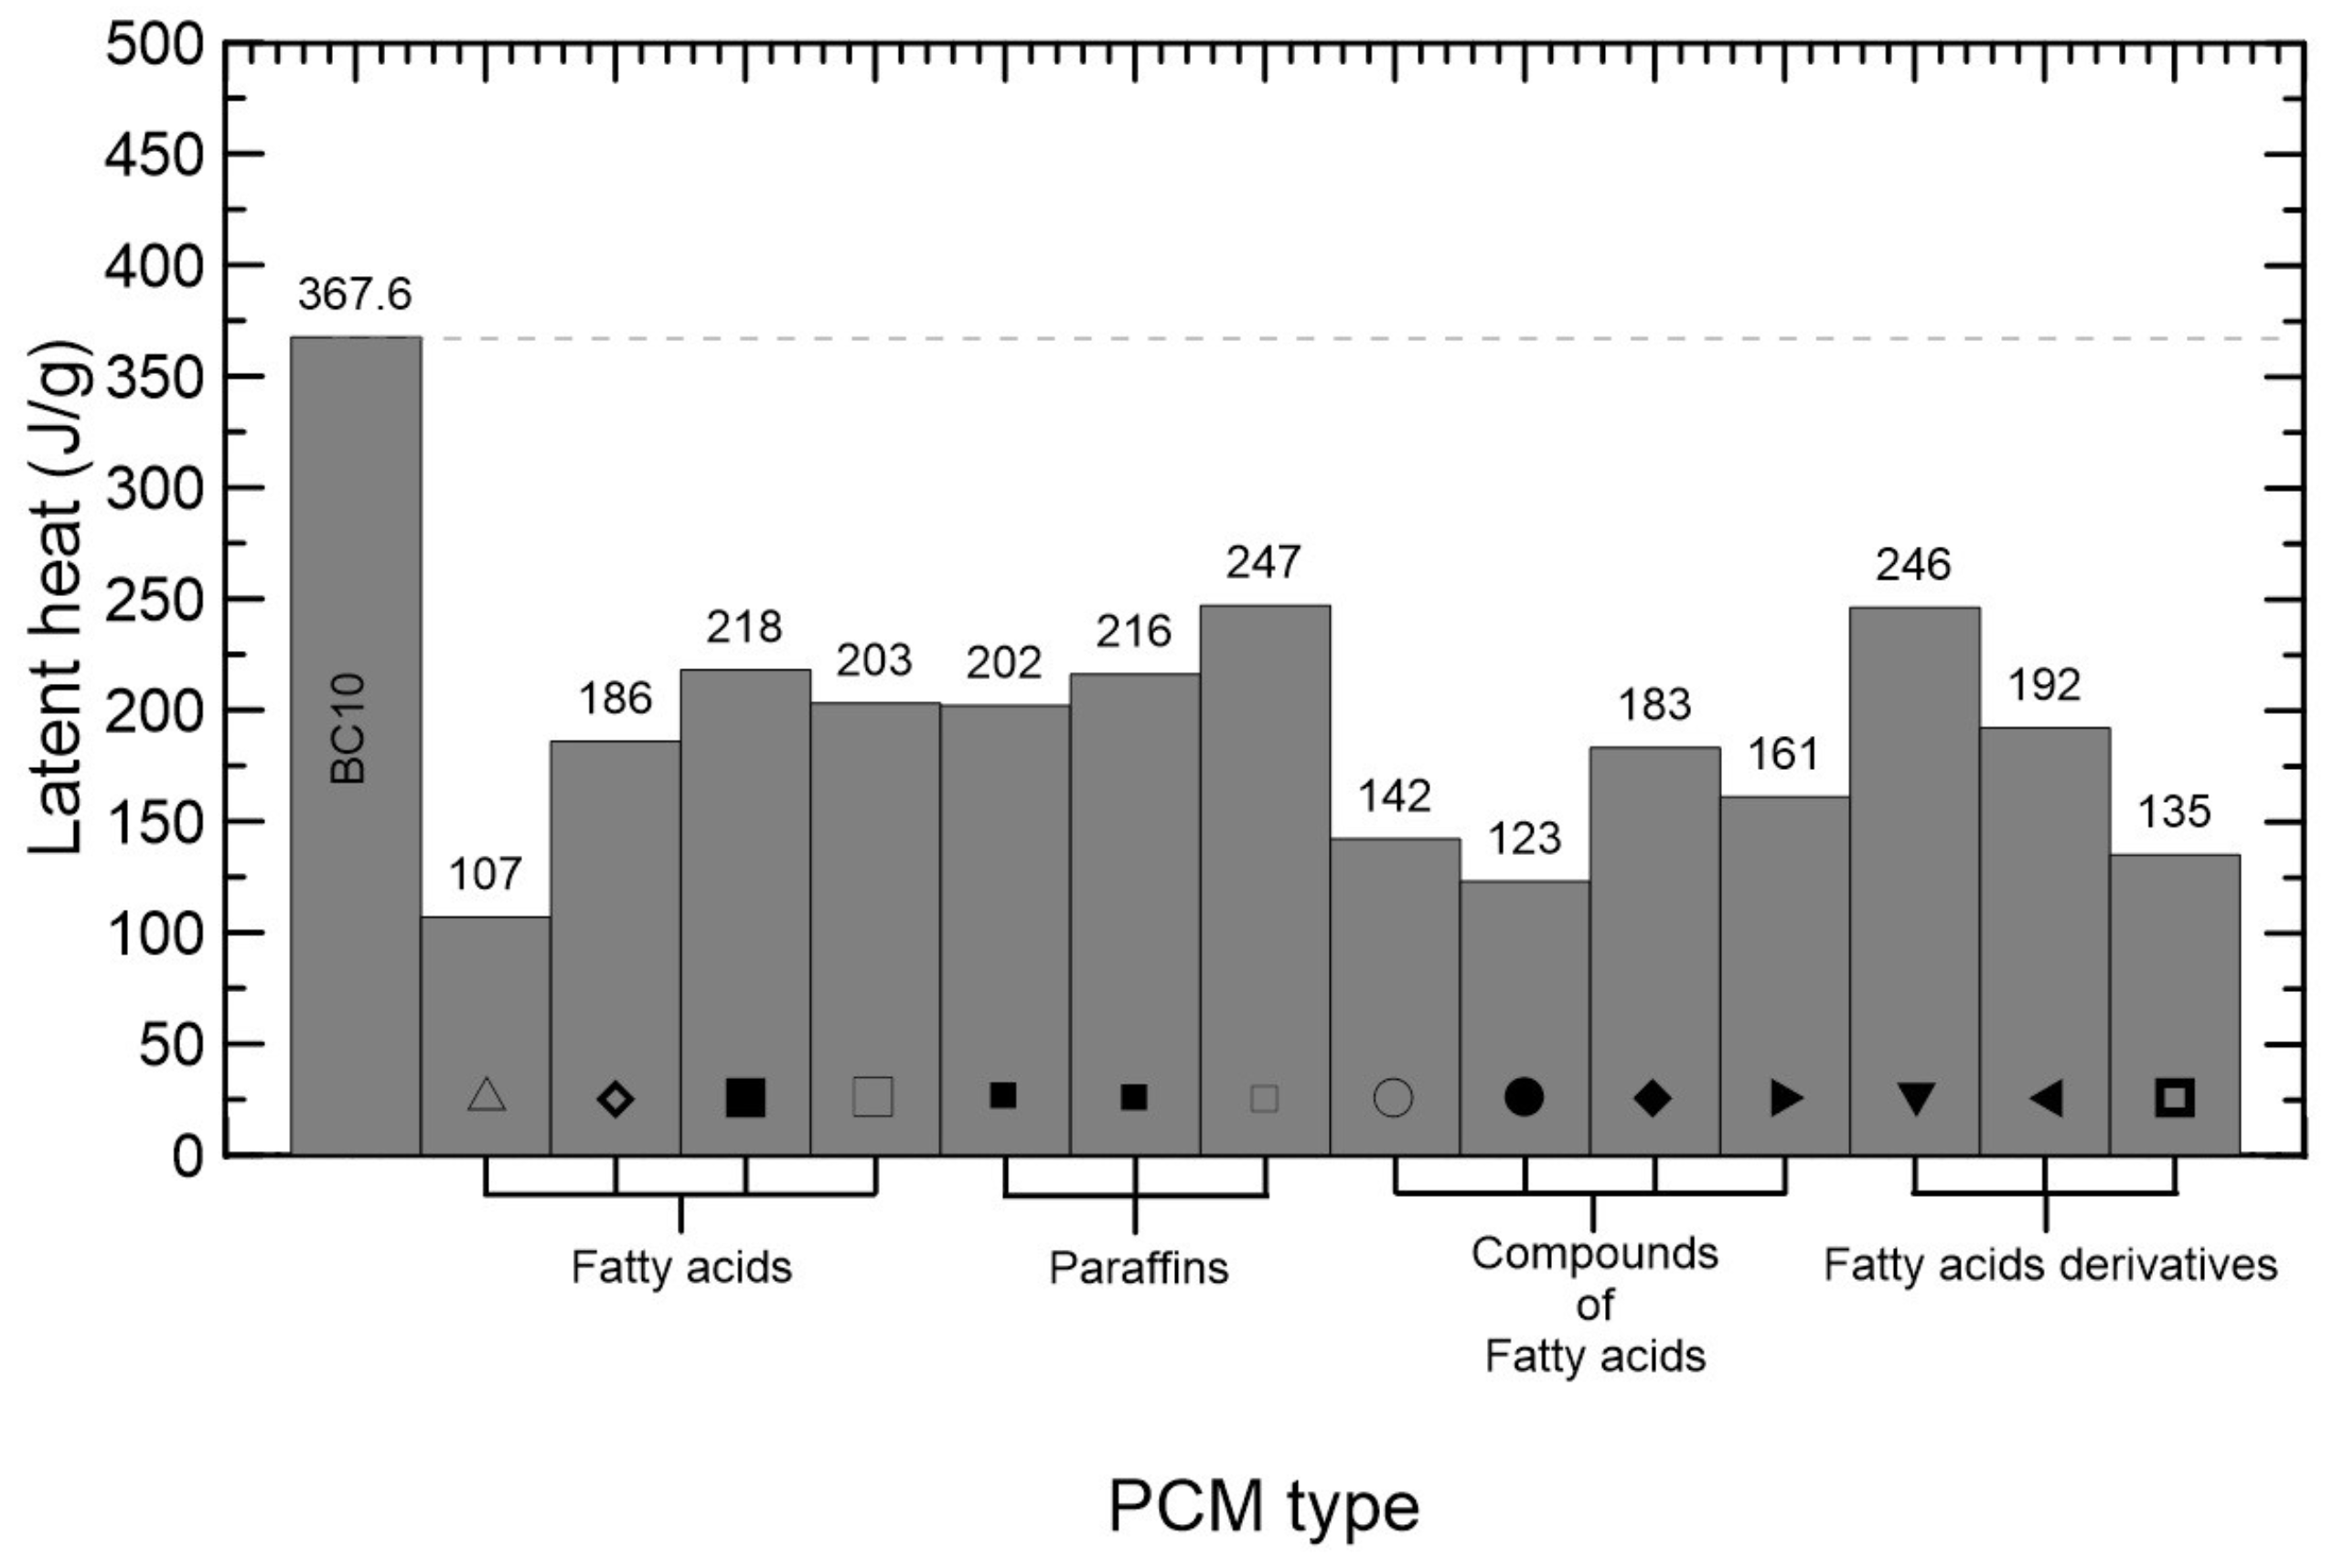
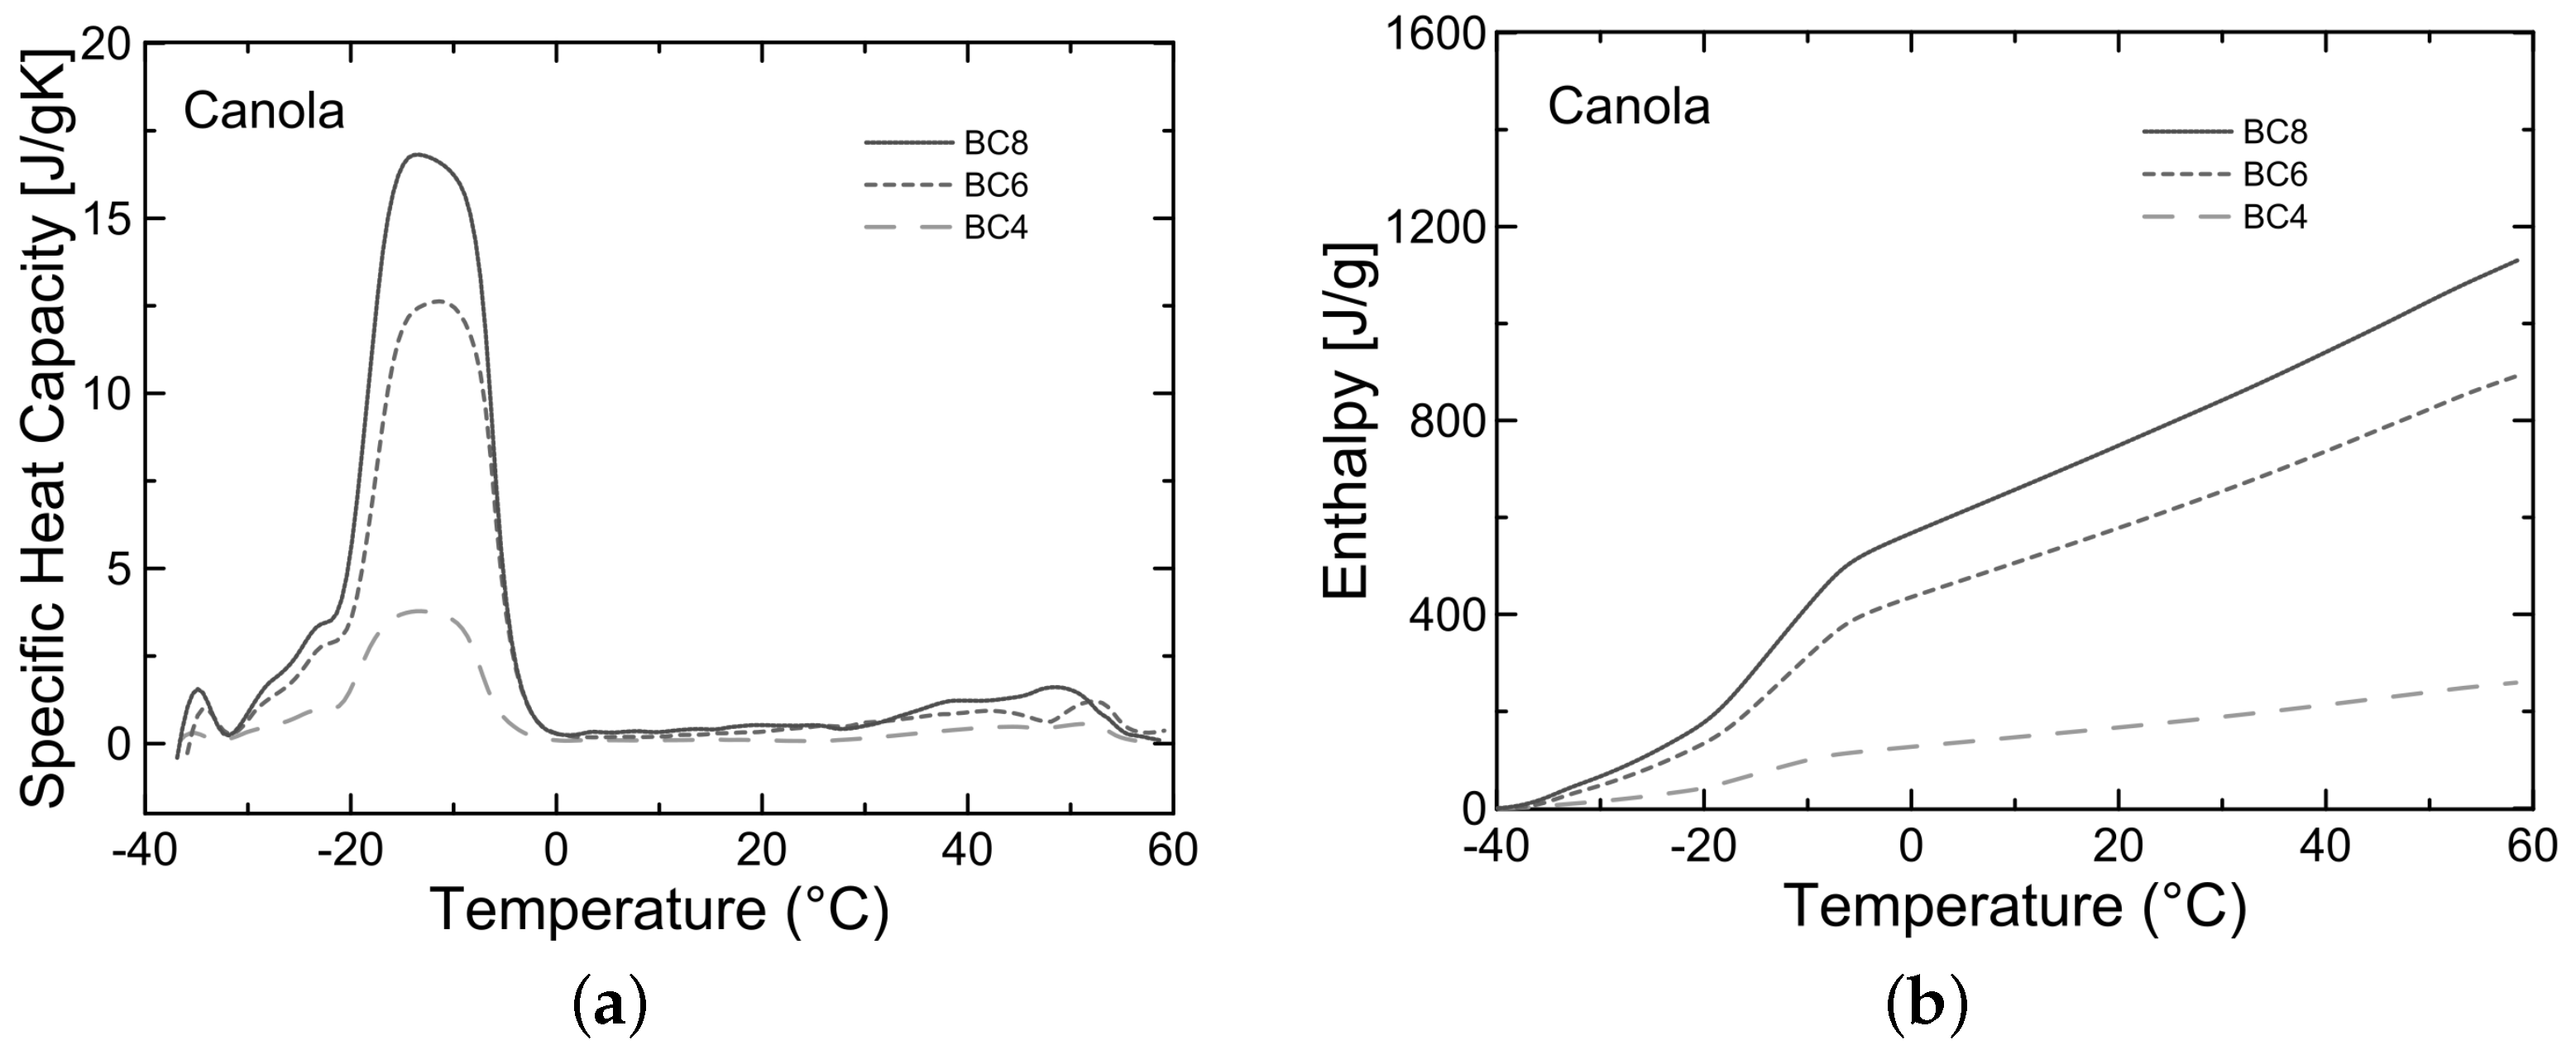
3.2. Analysis of Thermal Properties
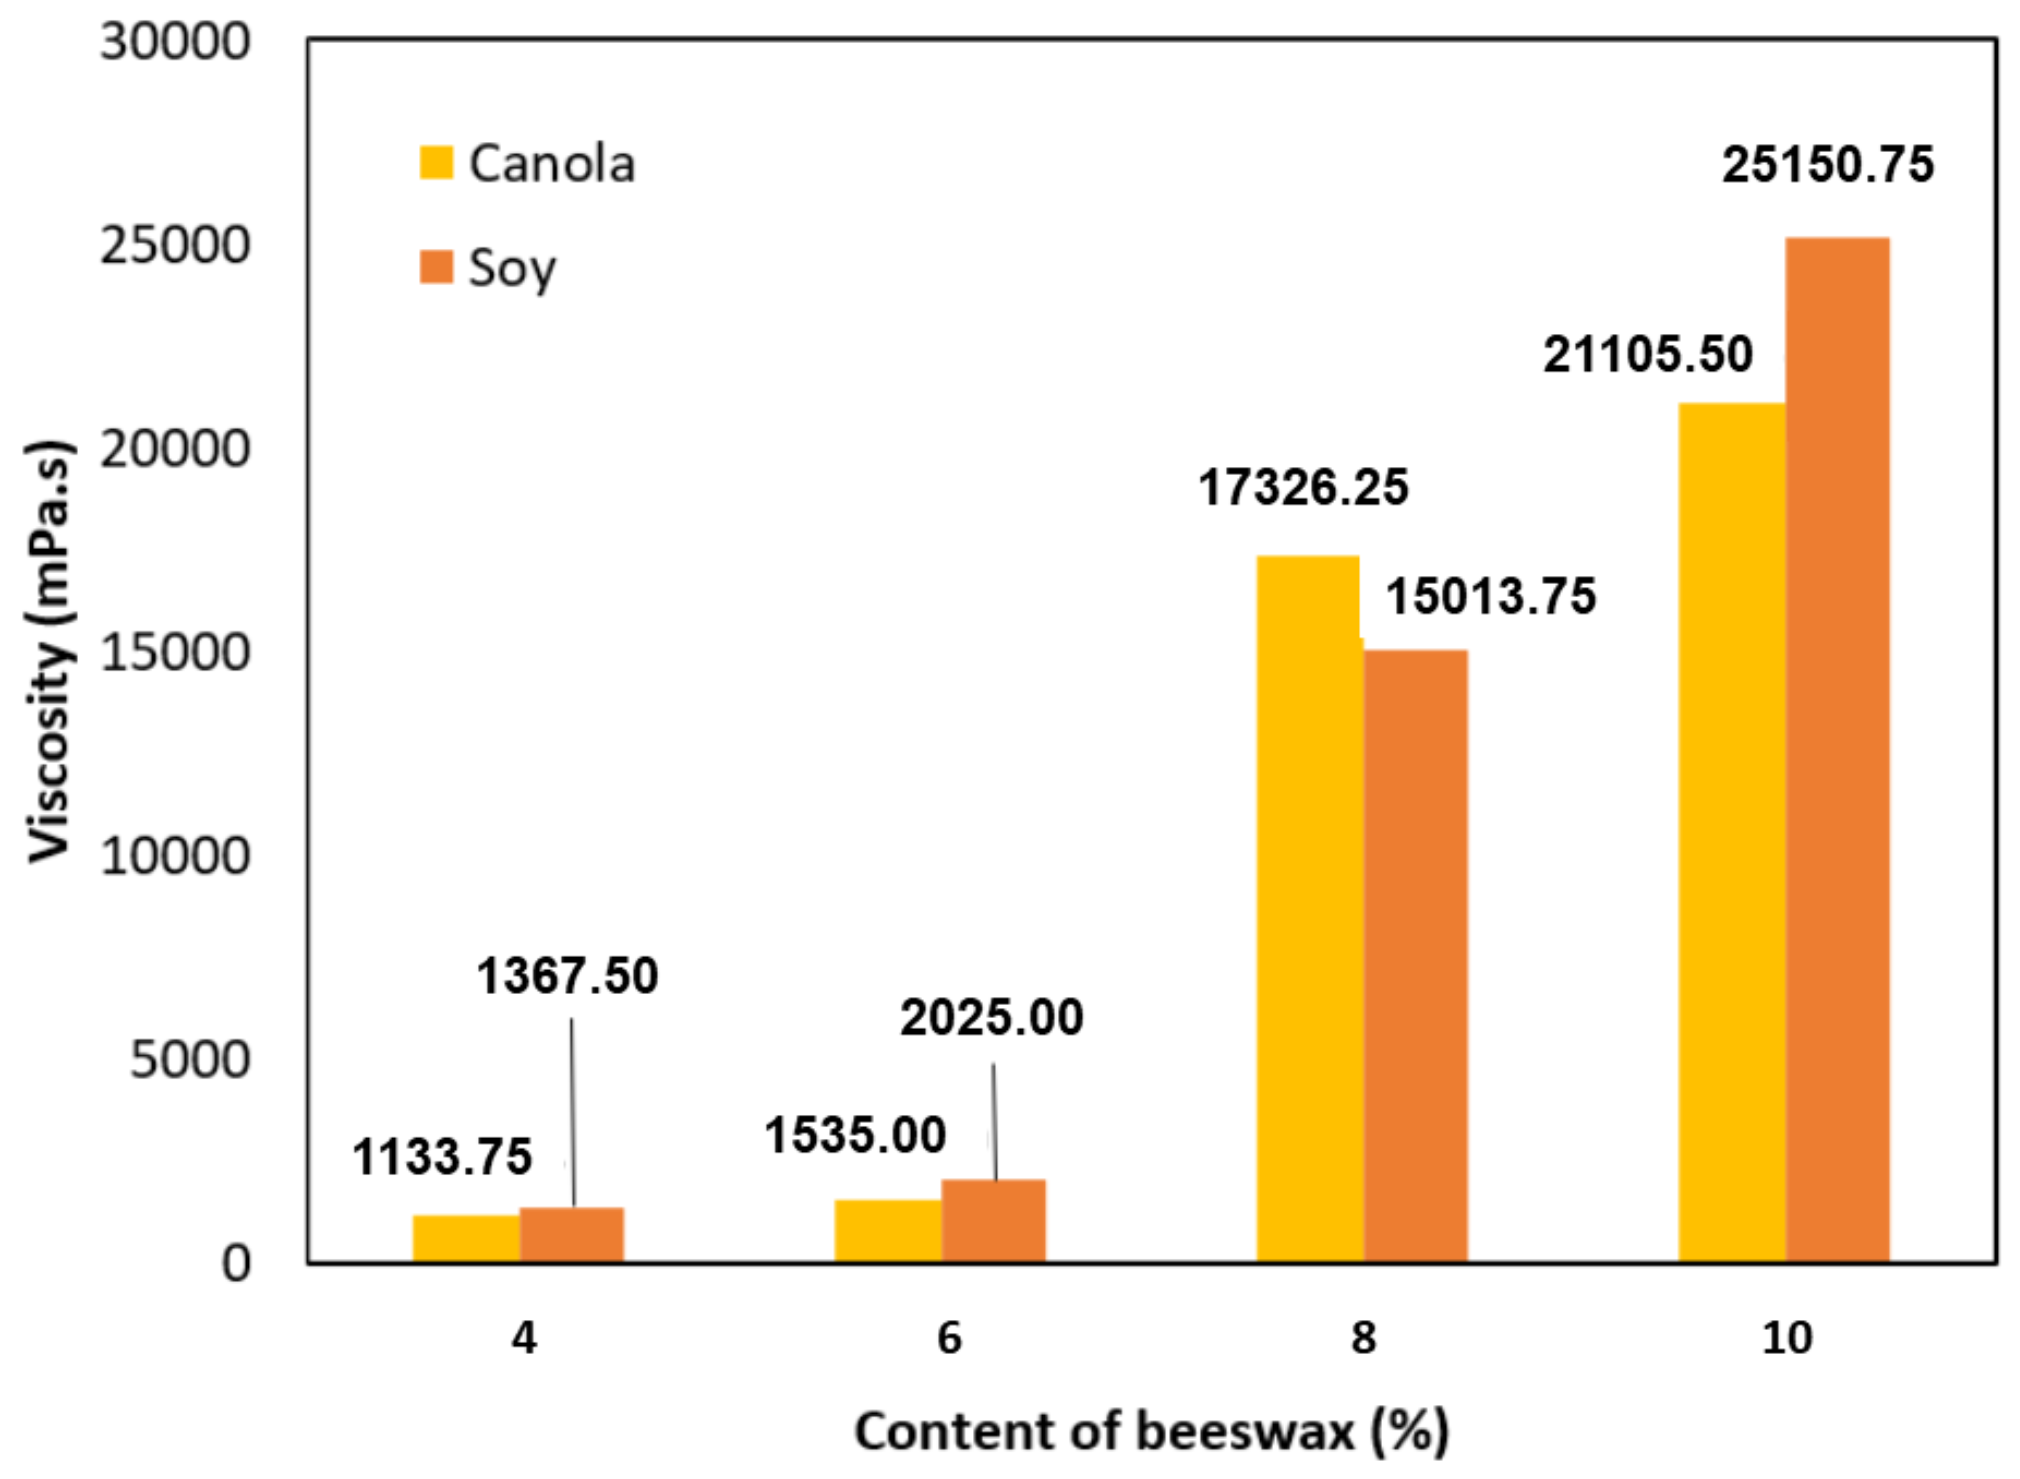
After confirming the structures of the raw material, the thermal properties of the material were investigated. In order to obtain a better comparison between BC and BS, the two materials (BC10 and BS10) were analyzed. The results of these DSC measurements are described in Table 2. The melting temperature range of the specimens was between −13.6 °C and −16.7 °C. Canola oil oleogel presented a higher melting temperature than the soybean oil oleogel, with the oleogel containing 10% beeswax presenting a total latent heat of 367.6 J/g, compared to 22.9 J/g for the soybean oil oleogel with the same content of beeswax.
According to the melting temperature range obtained in this study, this PCM is suitable to be applied in food conservation, which requires lower temperatures. Some studies show the efficiency of utilizing PCM in that application [24,39,40,41].
The data presented in Table 2 are a summary of the curves presented in Figure 4, showing the evolution of specific heat capacity and enthalpy with the temperatures of the oleogels made with different oils.
Canola oil oleogel presents a higher capacity for thermal storage than the soybean oil oleogel. This can be associated with the fatty acid present in each oil, which could also explain the peaks in the curves: canola oil oleogel presented only one (major) peak at −12 °C, whereas soybean oil oleogel presented two small peaks around −20 °C. Canola oil is about 2.5 times less saturated, 2.5 times more monounsaturated, and 2 times more polyunsaturated than soybean oil [42], which can impact the oleogel structures and thermal properties. Holey et al. [43] report that higher unsaturation and polyunsaturated content in oil leads to an increase in the strength of oleogels with compact entrapment within the crystal network. In addition, the temperature difference between the onset melting temperature and peak melting temperature significantly decreased with an increase in oil saturation.
In Figure 5, comparisons with an ample gamma of phase change materials, both organic and inorganic, used for miscellaneous applications, are shown. The range of latent heats was from 100 J/g to 279 J/g, with most being between 180 and 220 J/g, including PCMs for cold storage, with melting temperature under −10 °C [40,44]. As can be seen, BC10 presented latent heat far beyond the other researched PCMs, demonstrating its possible applicability for cold storage in cold chain foods and their preservation.
Figure 6 shows the comparative evolution of the melting peak temperatures at the heating rate of 10 °C/min, with temperatures between −40 and 60 °C. In Table 3, the latent heat of oleogels produced from different concentrations (%) of beeswax with canola oil and their respective sample masses are presented.
It can be observed in Figure 6 that oleogel BC8 presented the best results of specific heat capacity and enthalpy among the three formulations. An increase in the content of beeswax increased the heat storage capacity of the materials, however, BC4 and BC6 presented a greater increment in heat storage capacity compared to BC8. Although it would seemingly be more efficient to add more than 10% beeswax to the oleogel, studies in this field [58,59,60,61,62] have already demonstrated the unfeasibility of doing so.
Furthermore, the latent heat and total heat storage measurements demonstrated that the oleogel BC10, made of canola oil and 10% beeswax, presented higher total heat storage (1320 J/g) than the other formulations. Other studies [63,64] found beeswax latent heat values of around 395 J/g with melting point between 55 °C and 64 °C, whereas [65] found 141 J/g. This can be explained by how the raw material was treated along with the bee species that produced it.
Besides that, [66] related the high content of wax ester in beeswax (about 60–70%) with the crystal morphology. That could assist in the formation and maintenance of the structure at the temperatures used in the present study. In [67], the authors explain that a higher amount of wax esters will result in a strong and brittle gel, which is expressed in a high storage modulus and flow yield stress of the wax-based oleogels. The fatty acids will contribute to the consistency and stability of the wax-based oleogels.
The dynamic DSC test was performed for all oleogels, considering heating rates (from 1 K/min to 0.125 K/min) with sample masses described in Table 3. The effect of the heating rate, between −40 to 60 °C, was investigated for only one of the oleogels. Table 4 shows sample masses and the enthalpy of each sample at different heating rates.
Figure 7 shows the curves of each sample at different heating rates (0.125, 0.5, and 1 K/min) along with specific heat capacity and enthalpy (latent only). A significant difference can be observed among each sample with different heating rates. The melting temperature (Tm) presented a high and defined peak in the sample with a heating rate of 0.125 K/min. Other authors [32,68,69,70] realized that different DSC heating rates (latent only) in PCMs can influence the DSC curves during melting, and lower heating rates result in a higher specific heat capacity of the materials. For the two (local) peaks of heating rates, more pronounced at 0.125 K/min, the first peak (also maximum) was registered at −20 °C, and the second local peak was achieved at −12 °C. The two major melting curves can be associated with the polymorphism of natural oils and fats. A similar observation was found by [71] in different types of oils.
This peculiarity can be related to the different types and concentrations of fatty acids and other components present in the material of the mixture (oleogel), the wax and the oils having different chain lengths, structures, and a possible occurrence of solid–liquid latent phase transition prior to the melting or degradation. A similar observation was made in a study using lactones as PCMs by Ravotti et al. (2019) [72]. According to [66], that could be associated with an initial disaggregation of the network in oil followed by the melting of crystals. In [71], the authors emphasize that oils and fats do not have specific melting and crystallization temperatures. Rather, they show melting/crystallization profiles.
Figure 8a shows the scattering of specific heat capacities following the dynamic DSC tests between −40 and 60 °C in BC10 with a heating hate of 0.25 K/min. A single heating rate was adopted to avoid the influence of this parameter on specific heat capacity. In Figure 7, the DSC curves are characterized by an almost sensible behavior in the temperatures from −20 to −12 °C, in accordance with the results in Figure 8. It can be observed that the results show a deviation, as indicated by arrows in Figure 7b, which can be related to the heating rate used, causing a variation in the signal in the lower temperature ranges (solid sensible responses, between −20 and −12 °C). In the latent only response (Figure 8c,d), heating and cooling cycles are represented by red and blue lines, respectively. The pronounced peaks in Figure 8c represent the solid–liquid phase change in the samples. According to [67], in temperatures above the melting points, waxes can show liquid-like behavior, and the solubility of the wax in liquid oil decreases, causing microscopic phase separation and further supercooling results in nucleation.
The enthalpy curves (latent only) represent the mean values of the measurements conducted for three BC samples over three cycles (Figure 8d). This analysis represents the absorbed and released thermal energies during heating and cooling and the unitary latent heat during a phase change [32]. Enthalpy results are shown in Table 5, along with melting and crystallization peaks, onset, and offset.

3.3. Viscosity

During the application and use of the PCM, information about viscosity is important to predict the behavior of resistance to flow and how that affects heat exchange [73,74]. This property also decreases with increasing temperature, being higher at the beginning of the curve. Thus, it is possible to evaluate the thermal energy storage system’s efficiency through its viscosity. Empirical equations to determine viscosity and specific heat capacity of PCMs have been formulated by previous studies [75,76,77].
The results of the viscosity of the oleogels obtained at 20 °C are shown in Figure 9, where we can observe three effects of the formulation: they presented a higher viscosity with a greater content of beeswax; there has been a difference in viscosity results between canola and soybean oils, being more discernible when the content of beeswax increases; increasing from 6 to 8% beeswax caused a significant increase in viscosity for both oleogels.
The first effect described could be explained by beeswax’s higher solidification temperature. This effect has been reported in other works where inorganic PCMs with higher transition temperature ranges were used [78,79], and as there is an abrupt change in viscosity with temperature, this may be affected by the content of beeswax [80].
The other two effects may have been influenced by the oils and the network between the molecules, as the oils and beeswax have different properties and several kinds of functional groups affecting the viscosity. These effects have been reported in others works. In addition, the higher the oil viscosity, the lower the oleogel viscosity [81,82,83].

4. Conclusions

Soybean and canola bio-oleogels were produced and tested in order to verify their possible use as phase change materials (PCMs). The dynamic DSC test performed for these oleogels samples and considering the heating rates used (1 K/min to 0.125 K/min), showed that bio-oleogels can be reliable PCMs. The content of beeswax combined with the type of oleogel could be associated with different results in the heating rate capacity, enthalpy, and melting temperatures. BC10 (canola and 10% beeswax oleogel) was considered the formulation with the best performance compared to the other oleogel formulations tested, with a total latent heat of 367.6 J/g. This oleogel also presented higher energy storage capacity compared to other PCMs found in the literature. The phase change temperature in the oleogels tested (between −16 and −12 °C) suggested that they can potentially be used as PCMs to preserve or maintain food at cold temperatures in packaging materials or containers in cold chain food. However, the necessity to test the toxicity of the PCM in future research and its efficacy in a practical experiment should be emphasized. Another important factor observed was that the heating rate, as well as the masses utilized in the analysis, can affect the results of DSC tests.

Author Contributions

Conceptualization, S.R.F., C.A.N., A.C., C.M. and M.N.S.; methodology, S.R.F., C.A.N., C.M. and M.N.S.; software, M.N.S. and C.M.; validation, C.A.N., A.C., C.M. and M.N.S.; formal analysis, S.R.F., T.C.G., L.S.K. and N.D.L.; investigation, S.R.F., N.D.L., L.S.K. and M.N.S.; resources, S.R.F., E.K. and C.A.N.; data curation, S.R.F., C.A.N., A.C., C.M. and M.N.S.; writing—original draft preparation, S.R.F. and L.S.K.; writing—review and editing, S.R.F., C.A.N., A.C., C.M., T.C.G. and M.N.S.; visualization, S.R.F., C.A.N., A.C., C.M. and M.N.S.; supervision, S.R.F., E.K. and C.A.N.; project administration, S.R.F., E.K. and C.A.N.; funding acquisition, S.R.F., E.K. and C.A.N. All authors have read and agreed to the published version of the manuscript.

Funding

The authors thank CNPq (grant #433414/2018-3, #204376/2018-1) and FAPEMIG (grant #APQ-03248-17) for financial support.

Data Availability Statement

Data that supports the findings of this study are available from the corresponding author upon reasonable request.

Acknowledgments

The authors would like to thanks the Federal University of Lavras (UFLA), Capes and the Technische Universität Darmstadt for supplying the equipment and technical support for experiments. This study was supported by Capes, Brazil. S.R.F. thanks the National Council for Scientific and Technological Development (CNPq) for their scholarship of Productivity in Technological Development and Innovative Extension.

Conflicts of Interest

The authors declare no conflict of interest. The funders had no role in the design of the study; in the collection, analyses, or interpretation of data; in the writing of the manuscript; or in the decision to publish the results.

References

  1. Nazir, H.; Batool, M.; Bolivar Osorio, F.J.; Isaza-Ruiz, M.; Xu, X.; Vignarooban, K.; Phelan, P.; Inamuddin; Kannan, A.M. Recent developments in phase change materials for energy storage applications: A review. Int. J. Heat Mass Transf. 2019, 129, 491–523. [Google Scholar] [CrossRef]
  2. Aditya, L.; Mahlia, T.M.; Rismanchi, B.; Ng, H.M.; Hasan, M.H.; Metselaar, H.S.; Muraza, O.; Aditiya, H.B. A review on insulation materials for energy conservation in buildings. Renew. Sustain. Energy Rev. 2017, 73, 1352–1365. [Google Scholar] [CrossRef]
  3. Boer, D.; Segarra, M.; Fernández, A.I.; Vallès, M.; Mateu, C.; Cabeza, L.F. Approach for the analysis of TES technologies aiming towards a circular economy: Case study of building-like cubicles. Renew. Energy 2020, 150, 589–597. [Google Scholar] [CrossRef]
  4. Saxena, R.; Rakshit, D.; Kaushik, S.C. Phase change material (PCM) incorporated bricks for energy conservation in composite climate: A sustainable building solution. Sol. Energy 2019, 183, 276–284. [Google Scholar] [CrossRef]
  5. Shi, X.; Memon, S.A.; Tang, W.; Cui, H.; Xing, F. Experimental Assessment of Position of Macro Encapsulated Phase Change Material in Concrete Walls on Indoor Temperatures and Humidity Levels; Elsevier B.V.: Amsterdam, The Netherlands, 2014; Volume 71. [Google Scholar] [CrossRef]
  6. Stritih, U.; Butala, V. Experimental investigation of energy saving in buildings with PCM cold storage. Int. J. Refrig. 2010, 33, 1676–1683. [Google Scholar] [CrossRef]
  7. Wang, X.; Yu, H.; Li, L.; Zhao, M. Experimental assessment on the use of phase change materials (PCMs)-bricks in the exterior wall of a full-scale room. Energy Convers. Manag. 2016, 120, 81–89. [Google Scholar] [CrossRef]
  8. Da Cunha, S.R.L.; de Aguiar, J.L.B. Phase change materials and energy efficiency of buildings: A review of knowledge. J. Energy Storage 2020, 27, 101083. [Google Scholar] [CrossRef]
  9. Alam, T.E.; Dhau, J.S.; Goswami, D.Y.; Stefanakos, E. Macroencapsulation and characterization of phase change materials for latent heat thermal energy storage systems. Appl. Energy 2015, 154, 92–101. [Google Scholar] [CrossRef] [Green Version]
  10. Huang, X.; Zhu, C.; Lin, Y.; Fang, G. Thermal properties and applications of microencapsulated PCM for thermal energy storage: A review. Appl. Therm. Eng. 2019, 147, 841–855. [Google Scholar] [CrossRef]
  11. Sivasamy, P.; Devaraju, A.; Harikrishnan, S. Review on Heat Transfer Enhancement of Phase Change Materials (PCMs). Mater. Today Proc. 2018, 5, 14423–14431. [Google Scholar] [CrossRef]
  12. Liu, D.; Yang, L.; Shang, M.; Zhong, Y. Research progress of packaging indicating materials for real-time monitoring of food quality. Mater. Express 2019, 9, 377–396. [Google Scholar] [CrossRef]
  13. Singh, S.; Gaikwad, K.K.; Lee, Y.S. Phase change materials for advanced cooling packaging. Environ. Chem. Lett. 2018, 16, 845–859. [Google Scholar] [CrossRef]
  14. Singh, S.; Gaikwad, K.K.; Lee, M.; Lee, Y.S. Temperature-regulating materials for advanced food packaging applications: A review. J. Food Meas. Charact. 2018, 12, 588–601. [Google Scholar] [CrossRef]
  15. Arjenaki, N.O.; Soltanizadeh, N.; Hamdami, N. Designing an active phase change material package for thermal and qualitative protection of meat. Food Packag. Shelf Life 2019, 21, 100362. [Google Scholar] [CrossRef]
  16. Hoang, H.M.; Leducq, D.; Pérez Masia, R.; Lagaron, J.; Alvarez, G. Heat transfer modelling of encapsulated phase change materials for food packaging. In Proceedings of the 3rd IIR International Conference on Sustainability and the Cold Chain, ICCC 2014, London, UK, 23–25 June 2014; International Institute of Refrigeration: London, UK, 2014; pp. 405–411. [Google Scholar]
  17. Hoang, H.; Leducq, D.; Pérez-Masia, R.; Lagaron, J.; Gogou, E.; Taoukis, P.; Alvarez, G. Heat transfer study of submicro-encapsulated PCM plate for food packaging application. Int. J. Refrig. 2015, 52, 151–160. [Google Scholar] [CrossRef]
  18. Leducq, D.; Ndoye, F.T.; Alvarez, G. ScienceDirect Phase change material for the thermal protection of ice cream during storage and transportation riau a changement de phase pour la protection Mat e me glac e e pendant l’entreposage et le thermique de cr e transport. Int. J. Refrig. 2014, 52, 133–139. [Google Scholar] [CrossRef]
  19. Melone, L.; Altomare, L.; Cigada, A.; De Nardo, L. Phase change material cellulosic composites for the cold storage of perishable products: From material preparation to computational evaluation. Appl. Energy 2012, 89, 339–346. [Google Scholar] [CrossRef]
  20. Ünal, M.; Konuklu, Y.; Paksoy, H. Thermal buffering effect of a packaging design with microencapsulated phase change material. Int. J. Energy Res. 2019, 43, 4495–4505. [Google Scholar] [CrossRef]
  21. Jeong, S.G.; Jeon, J.; Cha, J.; Kim, J.; Kim, S. Preparation and evaluation of thermal enhanced silica fume by incorporating organic PCM, for application to concrete. Energy Build. 2013, 62, 190–195. [Google Scholar] [CrossRef]
  22. Kabeel, A.E.; El-Samadony, Y.A.; El-Maghlany, W.M. Comparative study on the solar still performance utilizing different PCM. Desalination 2018, 432, 89–96. [Google Scholar] [CrossRef]
  23. Karaipekli, A.; Sari, A. Development and thermal performance of pumice/organic PCM/gypsum composite plasters for thermal energy storage in buildings. Sol. Energy Mater. Sol. Cells 2016, 149, 19–28. [Google Scholar] [CrossRef]
  24. Rasta, I.M.; Suamir, I.N. Study on Thermal Properties of Bio-PCM Candidates in Comparison with Propylene Glycol and Salt Based PCM for sub-Zero Energy Storage Applications. IOP Conf. Ser. Mater. Sci. Eng. 2019, 494, 012024. [Google Scholar] [CrossRef]
  25. Bot, A.; Veldhuizen, Y.S.; den Adel, R.; Roijers, E.C. Non-TAG structuring of edible oils and emulsions. Food Hydrocoll. 2009, 23, 1184–1189. [Google Scholar] [CrossRef]
  26. O’Sullivan, C.M.; Barbut, S.; Marangoni, A.G. Edible oleogels for the oral delivery of lipid soluble molecules: Composition and structural design considerations. Trends Food Sci. Technol. 2016, 57, 59–73. [Google Scholar] [CrossRef] [Green Version]
  27. Pernetti, M.; van Malssen, K.; Kalnin, D.; Flöter, E. Structuring edible oil with lecithin and sorbitan tri-stearate. Food Hydrocoll. 2007, 21, 855–861. [Google Scholar] [CrossRef]
  28. Anonim. DIN 51005:2022-03. Thermal Analysis (TA)—Vocabulary; Text in German and English; Technical report; Anonim: Berlin, Germany, 2022. [Google Scholar] [CrossRef]
  29. Anonim. DIN 51007:2019-04. Thermal Analysis—Differential Thermal Analysis (DTA) and Differential Scanning Calorimetry (DSC)—General Principles; Technical report; Anonim: Berlin, Germany, 2019. [Google Scholar] [CrossRef]
  30. Gschwander, S.; Haussmann, T.; Hagelstein, G.; Sole, A.; Diarce, G.; Hohenauer, W.; Lager, D.; Rathgeber, C.; Hennemann, P.; Lazaro, A.; et al. IEA SHC Task 42/ECES Annex 29, DSC 4229 PCM Standard. Standard to Determine the Heat Storage Capacity of PCM Using hf-DSC with Constant Heating/Cooling Rate (Dynamic Mode))—A Technical Report of Subtask A2.1 of IEA-SHC 42/ECES Annex 29. Technical report, 2015. Available online: https://task42.iea-shc.org/Data/Sites/1/publications/Task4224-Standard-to-determine-the-heat-storage-capacity-of-PCM-vers150326.pdf (accessed on 15 December 2022).
  31. Rommel, M.; Hauer, A.; Helden, W. IEA SHC Task 42 / ECES Annex 29 Compact Thermal Energy Storage. Energy Procedia 2016, 91, 226–230. [Google Scholar] [CrossRef] [Green Version]
  32. Sam, M.N.; Caggiano, A.; Mankel, C.; Koenders, E. A comparative study on the thermal energy storage performance of bio-based and paraffin-based PCMs using DSC procedures. Materials 2020, 13, 1705. [Google Scholar] [CrossRef]
  33. Gendy, A.M.; Jun, H.W.; Kassem, A.A. In vitro release studies of flurbiprofen from different topical formulations. Drug Dev. Ind. Pharm. 2002, 28, 823–831. [Google Scholar] [CrossRef]
  34. Mukherjee, S.; Majee, S.B.; Biswas, G.R. Formulation and in vitro characterisation of soybean oil-hpmck4m based bigel matrix for topical drug delivery. Int. J. Appl. Pharm. 2019, 11, 33–38. [Google Scholar] [CrossRef]
  35. Svečnjak, L.; Baranović, G.; Vinceković, M.; Prđun, S.; Bubalo, D.; Gajger, I.T. N approach for routine analytical detection of beeswax adulteration using ftir-atr spectroscopy. J. Apic. Sci. 2015, 59, 37–49. [Google Scholar] [CrossRef] [Green Version]
  36. Chen, J.Y.; Zhang, H.; Ma, J.; Tuchiya, T.; Miao, Y. Determination of the degree of degradation of frying rapeseed oil using fourier-transform infrared spectroscopy combined with partial least-squares regression. Int. J. Anal. Chem. 2015, 2015, 185367. [Google Scholar] [CrossRef] [PubMed] [Green Version]
  37. Lumakso, F.A.; Rohman, A.; Handoy, M.; Riyanto, S.; Yusuf, F.M. Detection and quantification of soybean and corn oils as adulterants in avocado oil using fourier transform mid infrared (FT-MIR) spectroscopy aided with multivariate calibration. J. Teknol. 2015, 77, 251–255. [Google Scholar] [CrossRef] [Green Version]
  38. Li, J.; Guo, R.; Wang, M.; Bi, Y.; Zhang, H.; Xu, X. Development and Characterization of Compound Oleogels Based on Monoglycerides and Edible Waxes. ACS Food Sci. Technol. 2022, 2, 302–314. [Google Scholar] [CrossRef]
  39. Gin, B.; Farid, M.M. The use of PCM panels to improve storage condition of frozen food. J. Food Eng. 2010, 100, 372–376. [Google Scholar] [CrossRef]
  40. Kozak, Y.; Farid, M.; Ziskind, G. Experimental and comprehensive theoretical study of cold storage packages containing PCM. Appl. Therm. Eng. 2017, 115, 899–912. [Google Scholar] [CrossRef]
  41. Schalbart, P.; Leducq, D.; Alvarez, G. Ice-cream storage energy efficiency with model predictive control of a refrigeration system coupled to a PCM tank. Int. J. Refrig. 2015, 52, 140–150. [Google Scholar] [CrossRef]
  42. Rojas, E.E.G.; Coimbra, J.S.; Telis-Romero, J. Thermophysical Properties of Cotton, Canola, Sunflower and Soybean Oils as a Function of Temperature. Int. J. Food Prop. 2013, 16, 1620–1629. [Google Scholar] [CrossRef]
  43. Holey, S.A.; Sekhar, K.P.C.; Mishra, S.S.; Kanjilal, S.; Nayak, R.R. Effect of oil unsaturation and wax composition on stability, properties and food applicability of oleogels. J. Am. Oil Chem. Soc. 2021, 98, 1189–1203. [Google Scholar] [CrossRef]
  44. Sharma, R.K.; Ganesan, P.; Tyagi, V.V.; Metselaar, H.S.; Sandaran, S.C. Developments in organic solid–liquid phase change materials and their applications in thermal energy storage. Energy Convers. Manag. 2015, 95, 193–228. [Google Scholar] [CrossRef] [Green Version]
  45. Schaake, R.; van Miltenburg, J.; de Kruif, C. Thermodynamic properties of the normal alkanoic acids I. Molar heat capacities of seven odd-numbered normal alkanoic acids. J. Chem. Thermodyn. 1982, 14, 763–769. [Google Scholar] [CrossRef]
  46. Feldman, D.; Shapiro, M.M.; Banu, D.; Fuks, C.J. Fatty acids and their mixtures as phase-change materials for thermal energy storage. Sol. Energy Mater. 1989, 18, 201–216. [Google Scholar] [CrossRef]
  47. Hawes, D.W.; Feldman, D.; Banu, D. Latent heat storage in building materials. Energy Build. 1993, 20, 77–86. [Google Scholar] [CrossRef]
  48. Abhat, A. Low temperature latent heat thermal energy storage: Heat storage materials. Sol. Energy 1983, 30, 313–332. [Google Scholar] [CrossRef]
  49. Himran, S.; Suwono, A.; Mansoori, G.A. Characterization of alkanes and paraffin waxes for application as phase change energy storage medium. Energy Sources 1994, 16, 117–128. [Google Scholar] [CrossRef]
  50. Paris, J.; Falardeau, M.; Villeneuve, C. Thermal storage by latent heat: A viable option for energy conservation in buildings. Energy Sources 1993, 15, 85–93. [Google Scholar] [CrossRef]
  51. Regin, A.F.; Solanki, S.C.; Saini, J.S. Heat transfer characteristics of thermal energy storage system using PCM capsules: A review. Renew. Sustain. Energy Rev. 2008, 12, 2438–2458. [Google Scholar] [CrossRef]
  52. Sharma, A.; Shukla, A.; Chen, C.R.; Dwivedi, S. Development of phase change materials for building applications. Energy Build. 2013, 64, 403–407. [Google Scholar] [CrossRef]
  53. Sari, A.; Sari, H.; Önal, A. Thermal properties and thermal reliability of eutectic mixtures of some fatty acids as latent heat storage materials. Energy Convers. Manag. 2004, 45, 365–376. [Google Scholar] [CrossRef]
  54. Sari, A.; Karaipekli, A.; Eroǧlu, R.; Biçer, A. Erythritol tetra myristate and erythritol tetra laurate as novel phase change materials for low temperature thermal energy storage. Energy Sources Part A Recover. Util. Environ. Eff. 2013, 35, 1285–1295. [Google Scholar] [CrossRef]
  55. Barone, G.; Della Gatta, G.; Ferro, D.; Piacente, V. Enthalpies and entropies of sublimation, vaporization and fusion of nine polyhydric alcohols. J. Chem. Soc. Faraday Trans. 1990, 86, 75–79. [Google Scholar] [CrossRef]
  56. Aydin, A.A.; Aydin, A. High-chain fatty acid esters of 1-hexadecanol for low temperature thermal energy storage with phase change materials. Sol. Energy Mater. Sol. Cells 2012, 96, 93–100. [Google Scholar] [CrossRef]
  57. Haillot, D.; Bauer, T.; Kröner, U.; Tamme, R. Thermal analysis of phase change materials in the temperature range 120–150 °C. Thermochim. Acta 2011, 513, 49–59. [Google Scholar] [CrossRef]
  58. Da Silva, T.L.; Arellano, D.B.; Martini, S. Physical Properties of Candelilla Wax, Monoacylglycerols, and Fully Hydrogenated Oil Oleogels. JAOCS J. Am. Oil Chem. Soc. 2018, 95, 797–811. [Google Scholar] [CrossRef]
  59. Da Silva, T.L.T.; Arellano, D.B.; Martini, S. Interactions between candelilla wax and saturated triacylglycerols in oleogels. Food Res. Int. 2019, 121, 900–909. [Google Scholar] [CrossRef]
  60. Lim, J.; Hwang, H.S.; Lee, S. Oil-structuring characterization of natural waxes in canola oil oleogels: Rheological, thermal, and oxidative properties. Appl. Biol. Chem. 2017, 60, 17–22. [Google Scholar] [CrossRef]
  61. Martins, A.J.; Cerqueira, M.A.; Fasolin, L.H.; Cunha, R.L.; Vicente, A.A. Beeswax organogels: Influence of gelator concentration and oil type in the gelation process. Food Res. Int. 2016, 84, 170–179. [Google Scholar] [CrossRef] [Green Version]
  62. Yi, B.R.; Kim, M.J.; Lee, S.Y.; Lee, J.H. Physicochemical properties and oxidative stability of oleogels made of carnauba wax with canola oil or beeswax with grapeseed oil. Food Sci. Biotechnol. 2017, 26, 79–87. [Google Scholar] [CrossRef] [PubMed]
  63. Öğütcü, M.; Arifoğlu, N.; Yılmaz, E. Preparation and characterization of virgin olive oil-beeswax oleogel emulsion products. JAOCS J. Am. Oil Chem. Soc. 2015, 92, 459–471. [Google Scholar] [CrossRef]
  64. Putra, N.; Prawiro, E.; Amin, M. Thermal properties of beeswax/CuO nano phase-change material used for thermal energy storage. Int. J. Technol. 2016, 7, 244–253. [Google Scholar] [CrossRef] [Green Version]
  65. Amin, M.; Putra, N.; Kosasih, E.A.; Prawiro, E.; Luanto, R.A.; Mahlia, T.M. Thermal properties of beeswax/graphene phase change material as energy storage for building applications. Appl. Therm. Eng. 2017, 112, 273–280. [Google Scholar] [CrossRef]
  66. Fayaz, G.; Calligaris, S.; Nicoli, M.C. Comparative Study on the Ability of Different Oleogelators to Structure Sunflower Oil. Food Biophys. 2020, 15, 42–49. [Google Scholar] [CrossRef]
  67. Doan, C.D.; Tavernier, I.; Okuro, P.K.; Dewettinck, K. Internal and external factors affecting the crystallization, gelation and applicability of wax-based oleogels in food industry. Innov. Food Sci. Emerg. Technol. 2018, 45, 42–52. [Google Scholar] [CrossRef]
  68. Castellón, C.; Günther, E.; Mehling, H.; Hiebler, S.; Cabeza, L.F. Determination of the enthalpy of PCM as a function of temperature using a heat-flux DSC—A study of different measurement procedures and their accuracy. Int. J. Energy Res. 2008, 32, 1258–1265. [Google Scholar] [CrossRef]
  69. Fabiani, C.; Pisello, A.L.; Barbanera, M.; Cabeza, L.F. Palm oil-based bio-PCM for energy efficient building applications: Multipurpose thermal investigation and life cycle assessment. J. Energy Storage 2020, 28, 101129. [Google Scholar] [CrossRef]
  70. Jin, X.; Xu, X.; Zhang, X.; Yin, Y. Determination of the PCM melting temperature range using DSC. Thermochim. Acta 2014, 595, 17–21. [Google Scholar] [CrossRef]
  71. Tan, C.P.; Che Man, Y.B. Differential scanning calorimetric analysis of edible oils: Comparison of thermal properties and chemical composition. JAOCS J. Am. Oil Chem. Soc. 2000, 77, 143–155. [Google Scholar] [CrossRef]
  72. Ravotti, R.; Fellmann, O.; Lardon, N.; Fischer, L.J.; Stamatiou, A.; Worlitschek, J. Investigation of lactones as innovative bio-sourced phase change materials for latent heat storage. Molecules 2019, 24, 1300. [Google Scholar] [CrossRef]
  73. Dutkowski, K.; Fiuk, J.J. International Journal of Heat and Mass Transfer Experimental investigation of the effects of mass fraction and temperature on the viscosity of microencapsulated PCM slurry. Int. J. Heat Mass Transf. 2018, 126, 390–399. [Google Scholar] [CrossRef]
  74. Dutkowski, K.; Fiuk, J.J. Experimental research of viscosity of microencapsulated PCM slurry at the phase change temperature. Int. J. Heat Mass Transf. 2019, 134, 1209–1217. [Google Scholar] [CrossRef]
  75. Ferrer, G.; Barreneche, C.; Palacios, A.; Solé, A.; Fernández, A.I.; Cabeza, L.F. Empirical equations for viscosity and specific heat capacity determination of fatty acids. J. Energy Storage 2017, 10, 20–27. [Google Scholar] [CrossRef] [Green Version]
  76. Ferrer, G.; Gschwander, S.; Solé, A.; Barreneche, C.; Fernández, A.I.; Schossig, P.; Cabeza, L.F. Empirical equation to estimate viscosity of paraffin. J. Energy Storage 2017, 11, 154–161. [Google Scholar] [CrossRef] [Green Version]
  77. Huang, L.; Doetsch, C.; Pollerberg, C. Low temperature paraffin phase change emulsions. Int. J. Refrig. 2010, 33, 1583–1589. [Google Scholar] [CrossRef]
  78. Mu, M.; Basheer, P.A.M.; Sha, W.; Bai, Y.; Mcnally, T. Shape stabilised phase change materials based on a high melt viscosity HDPE and paraffin waxes. Appl. Energy 2016, 162, 68–82. [Google Scholar] [CrossRef] [Green Version]
  79. Wang, F.; Fang, X.; Zhang, Z. Preparation of phase change material emulsions with good stability and little supercooling by using a mixed polymeric emulsifier for thermal energy storage. Sol. Energy Mater. Sol. Cells 2018, 176, 381–390. [Google Scholar] [CrossRef]
  80. Rudra Murthy, V.B.; Gumtapure, V. Thermo-physical analysis of natural shellac wax as novel bio-phase change material for thermal energy storage applications. J. Energy Storage 2020, 29, 101390. [Google Scholar] [CrossRef]
  81. Calligaris, S.; Mirolo, G.; Da Pieve, S.; Arrighetti, G.; Nicoli, M.C. Effect of Oil Type on Formation, Structure and Thermal Properties of γ-oryzanol and β-sitosterol-Based Organogels. Food Biophys. 2014, 9, 69–75. [Google Scholar] [CrossRef]
  82. Fayaz, G.; Goli, S.A.H.; Kadivar, M. A Novel Propolis Wax-Based Organogel: Effect of Oil Type on Its Formation, Crystal Structure and Thermal Properties. JAOCS J. Am. Oil Chem. Soc. 2017, 94, 47–55. [Google Scholar] [CrossRef]
  83. Laredo, T.; Barbut, S.; Marangoni, A.G. Molecular interactions of polymer oleogelation. Soft Matter 2011, 7, 2734–2743. [Google Scholar] [CrossRef]
Figure 1. The formation process of the oleogel: (a) oil molecules; (b) oil molecules with wax molecules in liquid phase; (c) self-assembly of the molecules, forming a network and obtaining the oleogel.
Sustainability 15 02534 g001
Figure 2. Oleogel with 10% canola oil after storage at −5 °C (a); oleogel melting (b); oleogel sample at room temperature being prepared to DSC test in an alumina crucible (c).
Sustainability 15 02534 g002
Figure 3. FTIR spectra of raw materials and oleogels.
Sustainability 15 02534 g003
Figure 4. DSC measurements of canola and soybean oleogels with 10% beeswax (BW): canola oleogel specific heat capacity (a) and enthalpy (b); soybean oleogel specific heat capacity (c) and enthalpy (d).
Sustainability 15 02534 g004
Figure 5. Latent heat of several PCMs: : Schaake et al. (1982) [45], : Feldman et al. (1989) [46], ⯀: Hawes et al. (1993) [47], □: Abhat (1983) [48], ▪: Himran et al. (1994) [49], ▫: Paris et al. (1993) [50], ⭘: Regin et al. (2008) [51], : A. Sharma et al. (2013) [52], ♦: Ahmet Sari et al. (2004) [53], : A. Sari et al. (2013) [54], : Barone et al. (1990) [55], : Aydin and Aydin, (2012) [56], : Haillot et al. (2011) [57].
Sustainability 15 02534 g005
Figure 6. DSC measurements of canola oleogels with different beeswax (BW) contents: specific heat capacity (a) and enthalpy (b) measurements.
Sustainability 15 02534 g006
Figure 7. Specific heat capacity at different heating rates (a); peak comparison (b); and enthalpy measurements (c) of dynamic DSC analysis (latent only).
Sustainability 15 02534 g007
Figure 8. Scattering of specific heat capacities (a) and enthalpy (b); latent only responses (c,d) following the dynamic DSC tests between −40 °C and 60 °C.
Sustainability 15 02534 g008
Figure 9. Viscosity values of studied oleogels with different beeswax contents at 20 °C.
Sustainability 15 02534 g009
Table 1. Formulations of studied oleogels (values in total weight %).
OleogelsBeeswax (%)Soybean (%)Canola (%)
BS4496-
BS6694-
BS8892-
BS101090-
BC44-96
BC66-94
BC88-92
BC1010-90
Table 2. Dynamic DSC information (tests performed at 10 K/min).
PCMSample Mass (mg)Total Latent Heat (J/g)Melting Temperature (Tm)
Canola 10% BW14367.6−13.6
Soybean 10% BW1022.9−16.7
Table 3. Different contents (%) of beeswax used to produce oleogels with canola oil.
Beeswax (%)Sample Mass (mg)Latent Heat (J/g)
423.2112.5
623.3251.8
817.4334.1
Table 4. Canola and 10% beeswax oleogel latent heat measured at different heating rates.
Heating Rate (K/min)Sample Mass (mg)Latent HEAT (J/g)
0.2519.2128.7
0.519.1298.2
119.2359.4
Table 5. Dynamic DSC information of BC10 sample (tests performed at 10 K/min).
PCM Δ h (J/g)Tm Peak 1/ Peak 2 (°C)Tm Onset (°C)Tm Offset (°C)Tc (°C)Tc Onset (°C)Tc Offset (°C)
BC10 (Canola 10% BW)367.6−19.9/−13.6−24.6−4.1168.1−36.8−34.6
Disclaimer/Publisher’s Note: The statements, opinions and data contained in all publications are solely those of the individual author(s) and contributor(s) and not of MDPI and/or the editor(s). MDPI and/or the editor(s) disclaim responsibility for any injury to people or property resulting from any ideas, methods, instructions or products referred to in the content.

