Article

Sustainable Path of Food Security in China under the Background of Green Agricultural Development

Economic College, Hunan Agricultural University, Changsha 410128, China
*
Author to whom correspondence should be addressed.
Sustainability 2023, 15(3), 2538; https://doi.org/10.3390/su15032538
Submission received: 28 December 2022 / Revised: 23 January 2023 / Accepted: 28 January 2023 / Published: 31 January 2023
(This article belongs to the Section Environmental Sustainability and Applications)

Abstract

:
In light of the increasing global food crisis, this study concentrated on the complex causality of sustainable food security in China. In the context of the agricultural green transformation, a comprehensive evaluation system of agricultural green development is constructed on China Yearbooks’ economic data and agricultural greening indices from 2012 to 2020. In addition, the coupling coordination degree model and fuzzy-set quantitative analysis are used to describe the path evolution of sustainable food security development in China. The results revealed that: (1) the comprehensive assessments were increased in recent years, and high score regions changed apparently, from the periphery to midland; (2) China’s green development and agricultural economic potential are currently in a transitional phase from basic to moderate synergy, and the higher coordinated degree is allocating to mid and southern areas during this period, and all of them keeps growing as well; and (3) under modern food security framework, the emphasis of China has gradually shifted from grain output and subsidy policies to high resources utilisation and human capital accumulation. Thus, China’s agricultural green transformation and sustainable food security are mutually reinforcing.

1. Introduction

The outbreak of the COVID-19 pandemic has disrupted the balance between international food production and trade, resulting in a global food crisis. The Food and Agriculture Organization (FAO) reported that the proportion of agricultural grains in Asia’s total sown area has decreased in recent decades, whereas cash crops and aquaculture have increased [1]. Moreover, the agricultural growth rate in developing countries is significantly higher than that in other regions. In addition, they discovered that the incidence of food insecurity in the Asia-Pacific region reached 25.7% in 2020, a 7% increase from 2014, with the greatest increase in South Asia, and the least increase in East Asia. Despite the unstable supply and demand chain of grain on a global scale, China is still able to increase grain production annually. In addition, China manages to maintain a long-term grain self-sufficiency rate of over 90%, thereby preserving agriculture’s resilience [2]. The problem of how China can achieve sustainable food security is gaining increasing international attention. Coordinated agricultural green development (AGD) and economic growth is not only an urgent goal for China’s green economy, but also a crucial factor in achieving the country’s sustainable food security [3]. Therefore, focusing on the pathways to achieving sustainable food security in China has practical significance.
Food security has always been a major strategic issue in terms of national security and livelihood, and it is also the foundation of stability. Previous studies have extensively discussed the current issues concerning China’s food security. For example, analysing the security status of different countries on the basis of availability, utilisation, and stability level of grain supply. It indicates a long-term increase in food production of China, which has effectively reduced the impact of the COVID-19 pandemic on food security in East Asia. Moreover, The Global Report on Food Crises (GRFC) has noted that levels of sudden food insecurity reached a new high, and the number of people suffering from such misery, has increased every year since 2018, particularly in Ethiopia, South Sudan, and Yemen. It not only raises major concerns from worldwide, but also exposes the interconnected nature of the global food system and its vulnerability [4]. Meanwhile, scholars have discussed food security and its evaluation system’s innovation from multiple perspectives, such as market supply and demand and food sovereignty [5,6]. Some of them focused on the constraints and policy effects of grain security on the basis of externalities and spatial effects field [7,8,9,10,11]. However, China’s food security assessment is primarily quantitative from the perspectives of soil bearing capacity, agricultural green total factor productivity (TFP), and ecological welfare, and lacks pertinent qualitative analysis [12,13,14]. Moreover, sustainable food security in China cannot be separated from processing the agricultural green transformation, as green development is the goal, concept, and initiative of developing agriculture. High levels of input, consumption, and pollution are the prominent features of early agricultural production in China; thus, the transformation of agricultural economic growth cannot be delayed. As a result, agricultural green development (AGD), a new model of agricultural modernisation unique to China, was created, and current research indicates that AGD positively contributes to reducing food shortages [15,16,17,18]. In fact, solving the problem of greening agriculture and economy is pertinent not only in China, but also in South Africa, the European Union and other regions [19,20]. However, there still exist few articles on China’s AGD, whereas previous research has focused more on ecological security, agricultural modernisation, and high-quality growth.
Coupled human and natural systems will influence agricultural production activities with a lag, thereby indirectly affecting food security [21,22,23,24]. Meanwhile, Rees (1996) and Wackernagel (2006) [25,26] proposed that the ecological footprint model can be used to measure ecological sustainability level, which not only accelerates the change of agricultural production methods but also addresses food ecological conflicts. Currently, prevalent methods for evaluating comprehensive systems are based on the entropy value method, the analysis hierarchy process (AHP), and so on, and then analyse the influence of single or multiple factors and the time-series change characteristics of such systems using the coupling framework, entropy variation equation, grey correlation method, and interval judgment method [2,3,18]. However, despite the fact that quantitative studies can always explain the direct or indirect relationship between factors within systems, they are only substitution or accumulation relationships of independent variables to state the variation of dependent variables, not complete equivalence relationships [27,28,29]. The qualitative comparative analysis (QCA) approach was first proposed by Ragin (1987) [29] in the 1980s, mainly to address cross-case qualitative comparisons of small samples in sociology, political science, and it has become a burgeoning tool to solve the complexity of causality in the fields of management, economics, and management information systems.
This study contributes to the literature by adapting fsQCA to analyse China’s food security configuration qualitatively. This study offers a novel approach, as previous studies focused more on the direct or indirect effects of multiple variables on grain yield or production potential [13,30,31]. Then, a combination of quantitative and qualitative methods is used to further analyse grain sustainability in China within the realistic framework of green agricultural development and modern grain security evaluation, a topic that has been neglected despite the fact that the aforementioned literature indicates that food security is strongly linked to the green economy.
The remainder of this paper is structured as follows. Section 2 presents the research methods. Section 3 discusses the results and analysis. Section 4 summarises the conclusion and discussion.

2. Materials and Methods

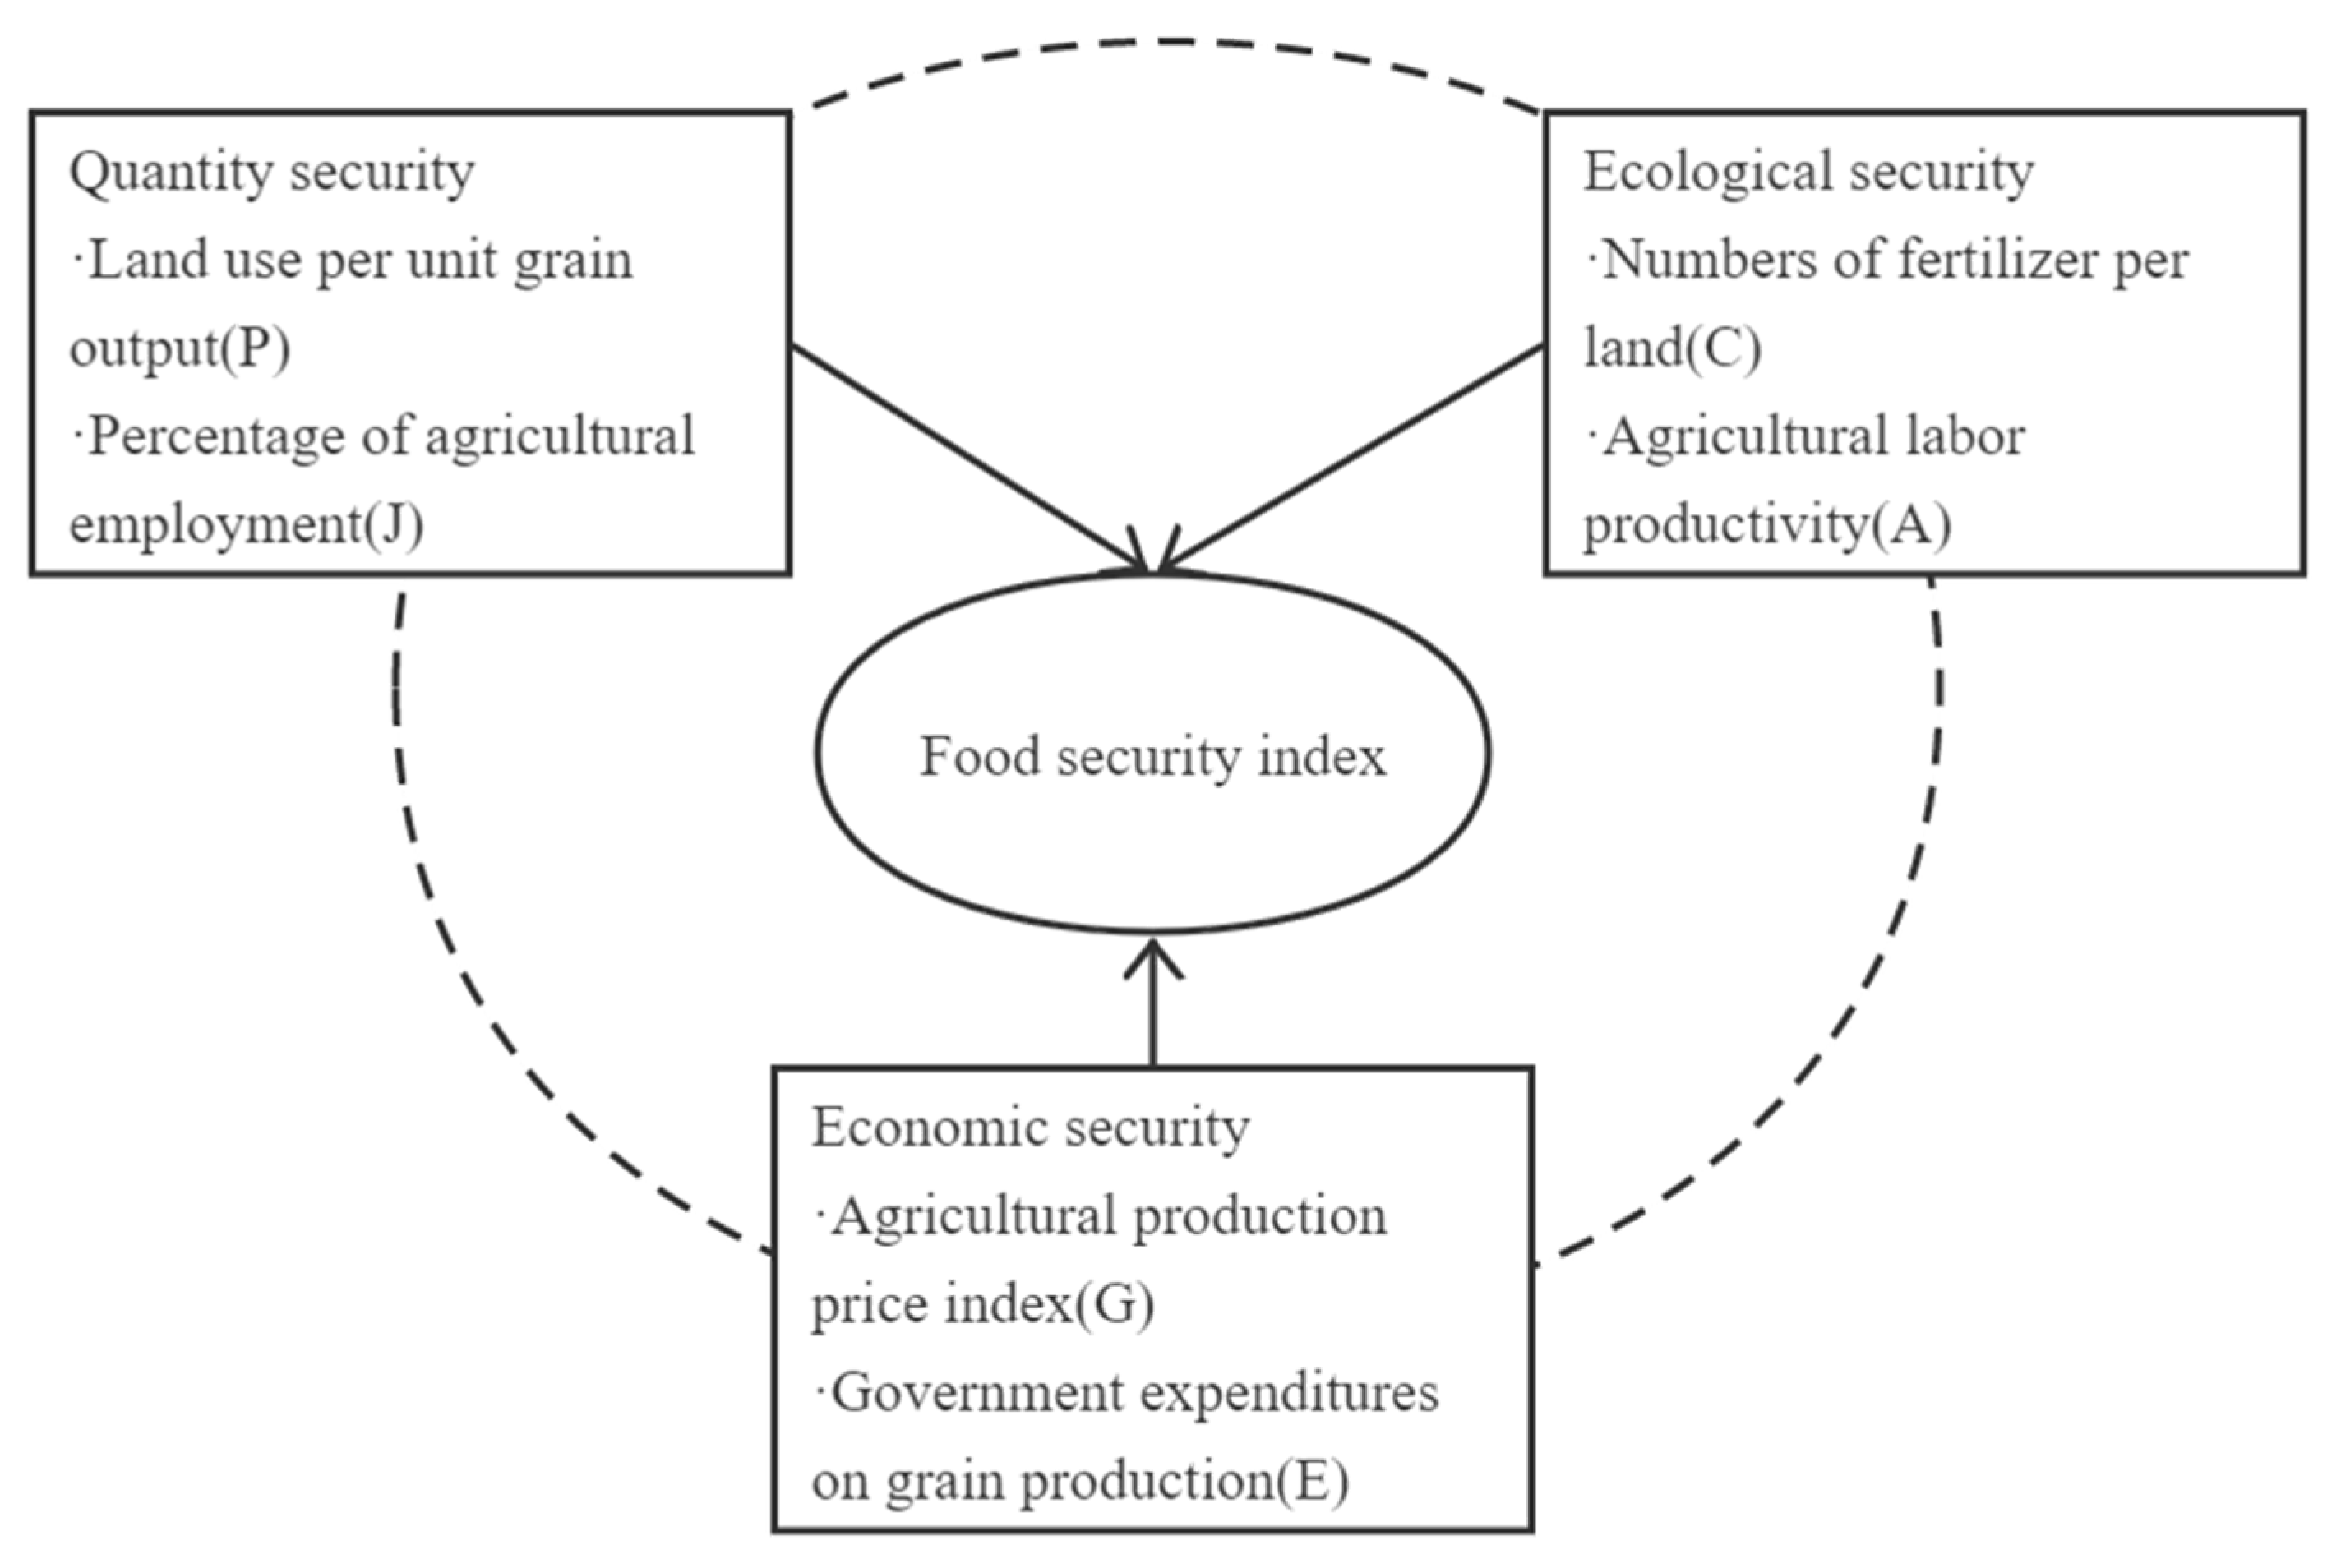
2.1. Framework of Assessment Systems

First of all, measuring the coupling coordination degree of China’s AGD, especially the economic potential, consists of the basement of whole study. With the release of the ‘14th Five-Year Plan for National AGD’ issue [32] the evaluation system was further developed, including indicator selection and calculation, on the basis of data availability. Then, assessment models were used to quantify the changes in the final integrated AGD degree with economic growth, and qualitative analysis was applied to configurations that are transforming food security and sustainability. The framework of whole paper is shown in Figure 1.
Given that many evaluation index systems exist that involve AGD and AEP systems, the secondary indicator was selected by considering the data availability, the national five-year plan, and previous studies [11,15,17,20]. In our research, the entropy method and AHP must be combined with the advantages of the two systems to create a comprehensive index system for evaluating China’s progress. In the process of adjusting AHP variables, three domestic agricultural economics and management professors were consulted in succession, and weight and index adjustments are made on the basis of their input.
Finally, two target layers, eight criterion layers, and 16 indices were constructed, as shown in Table 1. The comprehensive index measurement and evaluation of China’s AGD and AEP systems from 2012 to 2020 will be conducted in the next part.
Target layer comes from the official documents, which focus more on the relationship between greening agriculture and economy. Under target layer, it contains four main connotations, including conserving resource, high quality and efficiency, eco-friendly, and conservation ecology, which have accelerated agricultural green transformation of China in the recent decade. The majority of them are positive indicators. Contrarily, multiple cropping indexes of land (x1), emission intensity of agricultural COD (x5), fertilizer intensity (x6), and occurrence rate of agricultural natural disasters (x15) are negative indices, given that they reduced the farmland fertility significantly [2,8,11,16,31].

2.2. Data Standardisation and Weight Measure

The data used in this study came from the China Statistical Yearbook, the China Environmental Statistical Yearbook, the China Rural Statistical Yearbook, and the China Water Resources Statistical Yearbook, as well as the online data collection on the official website of the National Bureau of Statistics among 2012–2020 (the data of Taiwan, Hong Kong, and Macao are uncounted, which cannot be calculated). Missing data were treated with mean correction. Firstly, China’s AGD and its economic potential (AEP) systems were subjected to a systematised, exhaustive evaluation and coordinated coupling analysis. Secondly, it examined how China achieved the sustainable goal of food security under the dual pressure of agricultural and ecological economic growth from a holistic perspective, thereby contributing to the relevant literature. The green economy, characterised by green agriculture and ecological transformation, has evolved into a global phenomenon [33,34,35,36]. Our findings can provide important implications for policy makers and developing countries to achieve sustainable food security.
Typically, the extreme value method was used to eliminate the impact of dimension on positive and negative standard processing for data [2,31] (as shown in Appendix A, part 1). After calculating AHP and entropy weights, the square roots of the two were divided by their sum to obtain the combined weight (as shown in Appendix A, part 2 and Table A1). Consequently, the bias of the two methods was reduced, which can reflect key points clearly. Then, the standardised data can be weighted and allocated to the integrated AGD degree in connotations and economic scale, as illustrated below:
W j = γ j × δ j / j = 1 m γ j × δ j
In Formula (1), γj represents the weight of AHP; δj indicates that of the entropy method. Wj means the combined one; j for the jth index and m is the number of indications. Meanwhile, we deal with the added value of agriculture, forestry, animal husbandry, and fishery in a logarithmic manner and with standardisation in the next step to eliminate the variable impact of inflation. In addition, Shanghai’s soil erosion control area is 0, which is significantly lower than other provinces. Shanghai was assigned the maximum value amongst the groups, with narrowing differences, and was also standardised.

2.3. Index Calculation and Coupling Coordination Degree Model

The comprehensive evaluation indexes of AGD and AEP can be calculated using specific indicators and combined weights, as shown below:
U j = j = 1 m W j × Y i j   ( i = 1 ,   2 ,   ,   n )
In Formula (2), Uj is the evaluation index in the ith year; the higher the level is, the better the system score is; m is the number of indicators; n is the number of research year; Wj is the combined weight of indicators; Yij is the standardised value of the jth index in the ith year.
Then, on the basis of the comprehensive system evaluation, the coupling coordination degree (CCD) model is introduced to judge the stage changes of such development between AGD, AEP, agricultural green transformation, and ecological civilization construction in China. Various coupling coordination stages are analysed in the following text. The formula is as follows:
C = 2 × ( U 1 × U 2 ) / ( U 1 + U 2 ) 2
T = α U 1 + β U 2
D = ( C × T ) 1 / 2
In Equation (3), C represents the coupling degree; U1 and U2 represent the comprehensive evaluation indexes of the two systems, respectively. T is the participants of the two systems, α and β are the weights of the two, respectively. Moreover, both two systems are considered equally important in this period, so they are made to be α = β = 0.5, α + β = 1. D is the coupled coordination degree, D ∈ [0, 1], the greater it is, the better coupled coordination amongst such systems. With the relevant literature [35,36], the results are divided into 5 levels to demonstrate the differences in the two systems (as shown in Table 2).

2.4. Measurement of the fsQCA Method

On the basis of previous research, fsQCA configuration evaluations will be utilised to assess the complex causalities underlying China’s food security. Fuzzy-set QCA (fsQCA) is one of the most widely used methods in application, which can handle degree changes of continuous variables and fully reflects the causal complexity and multiple concurrency mechanisms between conditions compared with regression analysis [24,27,37]. The fsQCA method is more appropriate for further research on China’s food security configuration by identifying various antecedent configurations and interpreted results, which demonstrate a complete equivalence amongst the whole process variables [28]. The variation reflects the impact of quantitative, ecological, and economic security on the region of interest and also indicates which index had the greatest impact on grain safety. As a result, the modern grain security evaluation framework of China was chosen for this study’s path analysis. As shown in Figure 2, the fsQCA method illuminates configurations for 6 given conditions under 3 dimensions of quantity, ecological, and economic security [10,21,33,34,38].
Given that the data of 31 provinces is a small sample, only 6 antecedent conditions can be selected in this research [26,27]. On the basis of the ecological footprint model, food security index (set for F) was chosen as result variable [10,33]. Firstly, land used per unit grain output (set for P) and percent of primary industry employment (set for J) were utilised to present quantity security, as the two positively impact grain production [9,39]. Next, fertilizer intensity of unit area (set for C) and agricultural labour productivity (set for A) have contrasting effects on ecological security, the former results in serious non-point source pollution, which poses a long-term threat to grain safety [14,30]. Finally, agricultural production price index (set for G) and fiscal expenditures on grain production (set for E) were chosen to represent economic security, which also has conflicts, such as the greater volatility of G, the greater the grain shortage [8,11]. Negative indexes P, C, and G should be standardised as a pre-process (as shown in Appendix A, part 1). In addition, the specific calculation formulas of F and E are provided below.
F = ( Y D ) / Y × 100 %
E = S × G f / G
Index F is constructed by grain yield and demand, that is, the difference, between the grain yield (Y) and the grain demand (D) of the province, accounts for the percentage of Y in Formula (6). Given that China implements extensive grain subsidies and policies, there are no data regarding specific financial subsidies for grain production. Therefore, index E in Formula (7) comprises government expenditures for agriculture, forestry, and water resources (S) and the proportion of grain sown area (G).
According to previous studies, the intersection point of the three calibration anchors was located as 0.5, the full non-membership was 0.05, and 0.95 for full membership [24,26,27]. Considering the obvious lag effect during the agricultural process, a lag period of a year was chosen. For example, all configuration analysis of the 2019 were based on calibration and modelling of 2018. Finally, the following will analyse the food security path and regional differentiation of 2019, as shown in Table 3. However, if all the data are included in the same fsQCA model, the relative ranking of various regions will be affected, and its objectivity will be greatly reduced [39,40,41]. Therefore, fsQCA models were calibrated and established separately for each year.

3. Results and Analysis

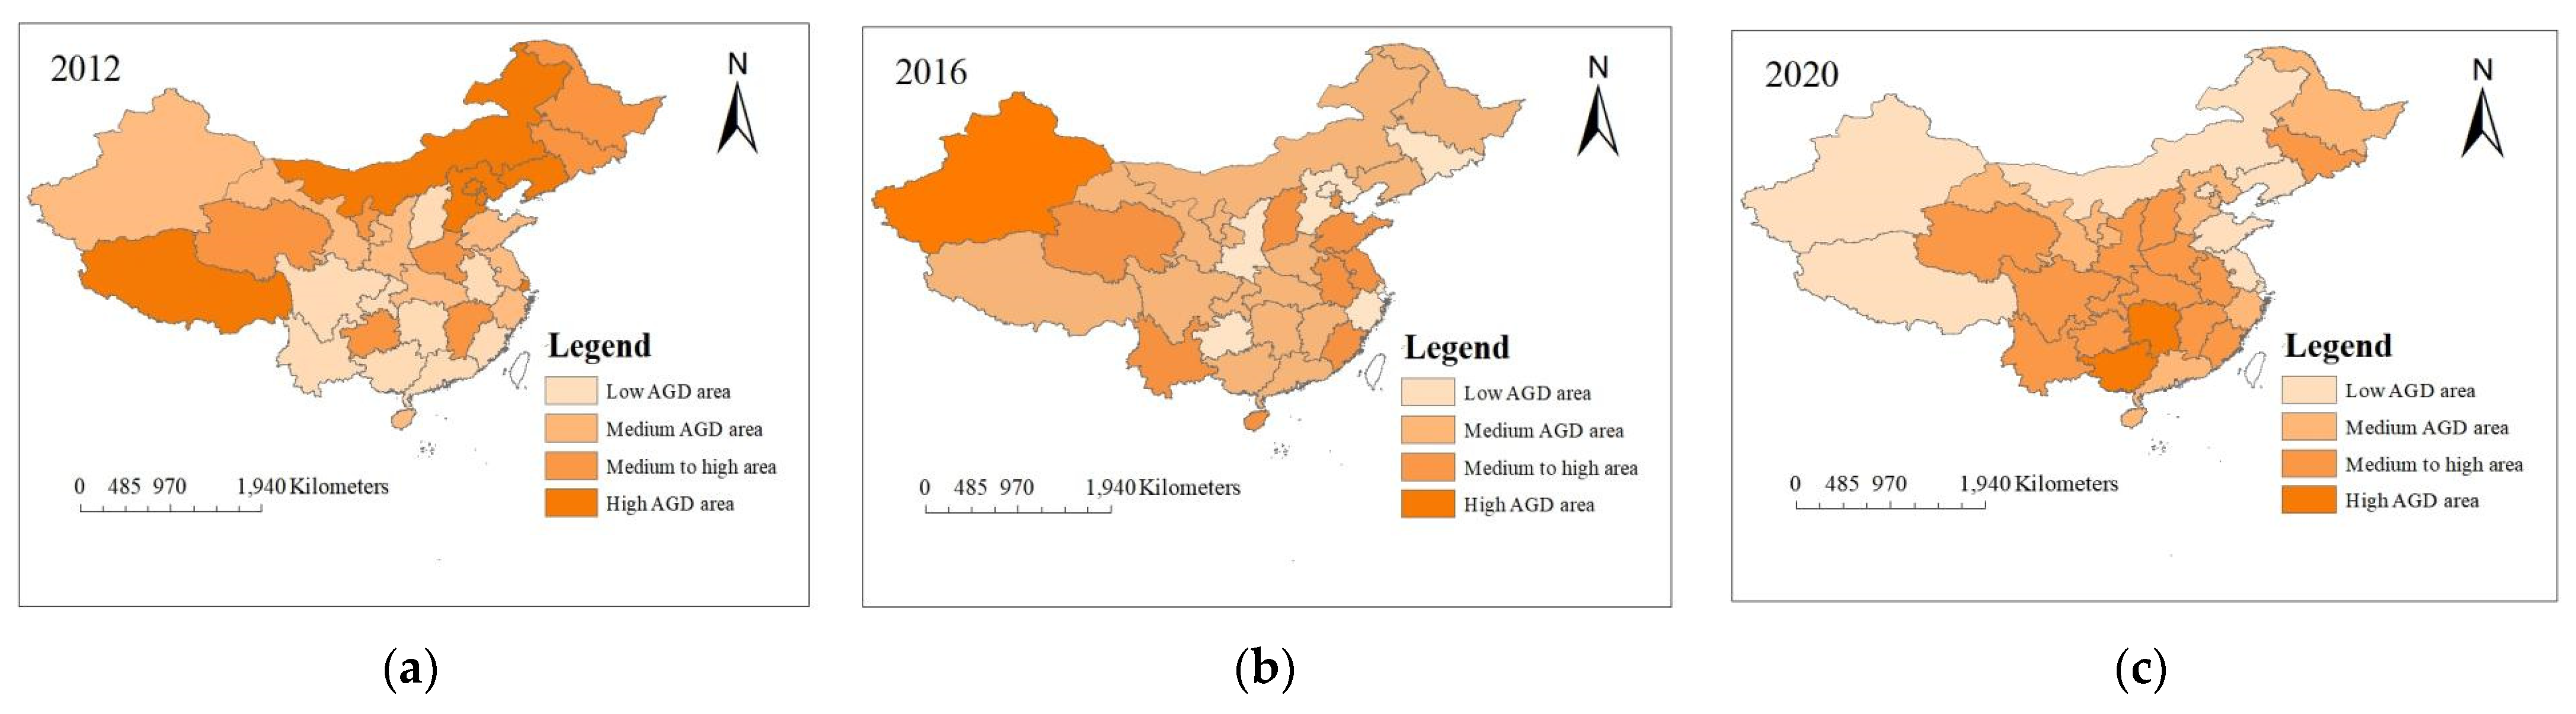
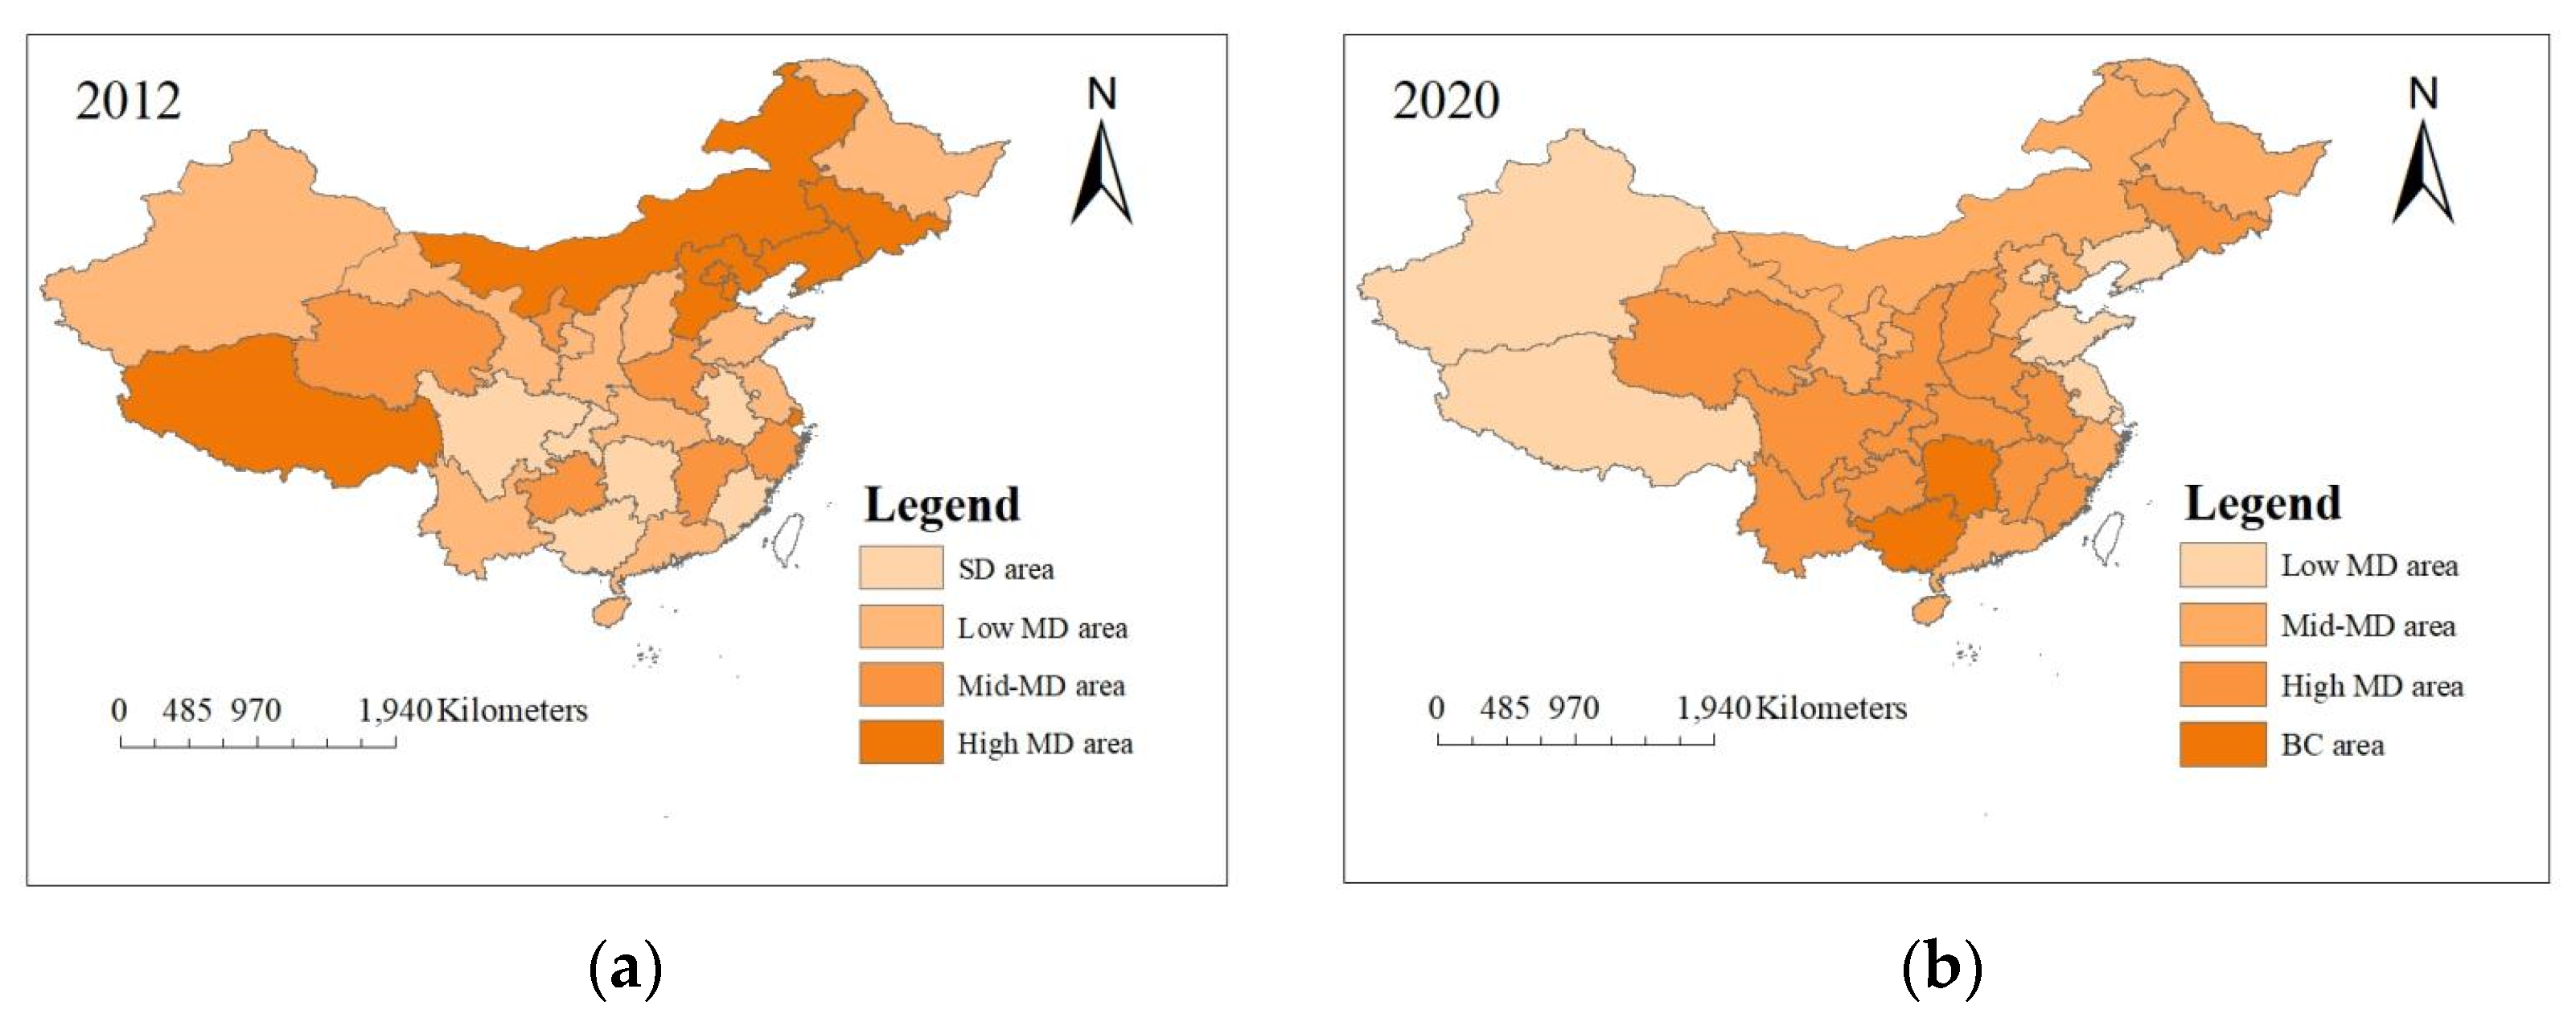
3.1. Quantity Analysis

By measuring comprehensive evaluation and the CCD model, the comprehensive index of integrated AGD degree shows significant growth (from 0.062 to 0.526), and both indices of subsystems exhibit an upward trend in period. The comprehensive assessment index seems to have increased more than the subsystems’ indices. Given the AEP system scores increased in the majority of regions, particularly in agriculturally developed region, such as Guangxi, Hainan, and Hunan. However, the results of the two systems did not always change in the same direction, especially amongst developed regions. Although the opposite result was observed in the central and western regions, with the exception of Qinghai, this may be due. Even though coupling degrees are between 0.8 and 1.0 in the majority of regions, with the exception of Hei Longjiang (0.738) and Hainan (0.733), coordination degree’ sections are increasing from [0.174, 0.291] to [0.410, 0.512] from 2012 to 2020.
The trend of comprehensive evaluation in China between 2012, 2016, and 2020, as shown in Figure 3, indicates that the green transformation range is shifting from economically backward to developed regions. In Figure 3a, high AGD areas can be found amongst north and west regions, which decline in Figure 3b, except for Xizang, and then switch to mid and south lands in Figure 3c. It indicates that agriculture-developed regions, particularly major grain-producing regions, such as Henan, Sichuan, and Wuhan, have begun to place a premium on AGD comprehensive construction, including economic potential and policy guidance. Obviously, such indexes reached or exceeded 0.5 in agriculture provinces, especially Guangxi and Hunan, in 2020.
Next, the changes of CCD model amongst 2012–2020 are revealed in Figure 4.
From 2012 to 2020, China made significant progress in establishing a moderately prosperous society and eradicated all poverty. During this time period, China underwent two significant development phases, the ‘12th Five-Year Plan’ and the ‘13th Five-Year Plan’. Within the remarkable stage that characterises China’s coordinated degree, a similar tendency in time and space appears (as shown in Figure 4). It was relocating to the midland and southern regions, which showed collective growth in the previous decade. Particularly, the majority of provinces gradually increased from (0, 0.2] to (0.4, 0.5], experiencing three stages of serious dissonance, moderate dissonance, and basic coordination. Thus, agricultural economic function dominated the period 2012–2017, and its rapid expansion caused the ecological environment to become overloaded, and a number of pollution issues became prominent. In addition, the agricultural economy slowed until 2018 and began to transition to a green economy characterised by improved quality and efficiency, with only a few eastern regions falling behind. Only two provinces, Hunan and Guangxi, experienced a rapid growth rate of 0.5 or above from 2019 to 2020, entering the moderate coordination stage. In the end, ecological restoration measures were effective in a number of locations, as were the increase in financial investment in environmental governance and the strengthening of relevant policies.
Generally, the green transformation of agriculture and its development potential is significantly greater in the central and western regions than in the eastern, as their economic diffusing effects are likely more direct.

3.2. Qualitative Analysis

Since 2018, China has worked diligently to accelerate the green transformation of agriculture. In this context, ranking and categorising 31 provinces for the years 2013, 2015, 2017, and 2019 (the rest of the results are presented in Appendix A, Table A2). The higher the index, the more secure the food supply. Following that, each year, the top 15 provinces are designated as having high food security, whereas the remaining provinces are designated as absence of high food security, named non-food security areas. Finally, the model results are estimated using the fsQCA software package by year and region.
The ‘necessity’ test of a single condition is a prerequisite for configuration analysis. When results occur, a condition always exists, which must be a necessary condition [27,37]. Thus, the test standard is that the consistency of any conditional variable should be greater than 0.9. Using fsQCA3.0 software, this paper analysed the necessary condition test results of high food security and low food security areas in 2019, as shown in Table 4.
Given all the consistencies are lower than 0.9, so it does not constitute any necessary condition. Next, the sufficient analysis of conditional configuration must be measured by consistency. As Marx et al. (2012) [28] pointed out, the consistency of samples belonging to the same result should be at least higher than 0.75. Thus, considering the number of cases below 20 and their distribution in the truth table, the consistency threshold determined in this study is 0.8, frequency threshold is 1, and the proportional reduction in inconsistency (PRI) threshold is 0.7 [27,28,29]. Thus, there were 15 and 16 cases of provinces with high and non-food security, respectively. Finally, the consistency threshold of 0.85 was used as the robustness test of the estimated results. Table 5 presents the configuration analysis results of six conditions on China grain security index in 2019.
Table 5 exhibits the four groups of configurations with high food security index and four groups with low security index. All of them achieve a consistency greater than 0.9, which is a sufficient condition for corresponding outcomes. The solution coverage for high food security and non-configuration are explained separately at 71% and 67%. The configuration described above assigned robust explanatory values to the result variables. This paper raises the consistency threshold to 0.85 in order to confirm the robustness of the empirical results. Nonetheless, the configuration result does not change, indicating that the interpretation of the result variables by the configuration holds certain rationality.
The analysis of each configuration is shown as below.
1.
The configuration of high food security index regions
There are four main configurations. In H1, J is the core condition, stating that rural areas always enhance labour productivity through capital deepening, and also compensate for the shortage of land utilisation, especially in areas with a relatively perfect agricultural industry chain. It brings a labour force compensation-type configuration, and typical regions include Jiangsu and Heilongjiang, which have a strong agricultural foundation and a high demand for agricultural talent. Next, C plays the core rule in H2, indicating that labour is replaced by capital, which increases the fertilizer input, forming the factor promotion configuration. Configuration H3 lacks a central condition P, namely, in 3a and 3b. In the context of the dual structure of urban and rural areas, agriculturally developed districts always attract the return of rural population through the development of distinctive agriculture and the enlargement of the integration of primary, secondary, and tertiary industries. The Xinjiang Autonomous Region and Shandong Province are the representative regions, due to their national-characteristic agriculture and stable grain production capacity. Ultimately, a traditional factor-promoted type is shaped in configuration H4 indicates that ever-increasing grain output still depends on devoting basic factors of agriculture activities, particularly in areas with low added value of agricultural products. For example, it is primarily located in the labour-intensive and agriculture-oriented provinces of Henan and Yunnan.
2.
The configuration of non-high regions
Four different sets of core conditions are presented as following. Firstly, N1 shows that production capacity cannot be stabilised without sufficient labour, which will disrupt agricultural markets’ prices. Then, ~A is the key condition of N2a and N2b. Raw coverage means that the path explains 14.7% and 27.2% of cases separately, whereas unique coverage means 3.5% and 6.4% of cases can only be interpreted by this path. The fertilizer input, labour force, and policy factors in these configurations are at a relative low level, indicating that basic elements of agricultural production are missing, which are not conducive to ensuring grain security. Thirdly, the absence of vital condition in N3a and N3b is the same as previous configuration. Different from N2, Factor C has occupied an important position. Furthermore, farmers are the main body of agricultural production. Under the continuous rural labour outflow, the growth of market price becomes a general trend. Meanwhile, even if sufficient agricultural production factors are invested, the food security index will remain low. Finally, N4 shows the influence of location disadvantage. As for remote regions, particularly in Xizang and Fujian, even if there is only a problem with insufficient land utilisation and all other conditions are normal, the locational disadvantage will still result in poor performance.
3.
Difference between eastern and mid-western areas
In addition, due to China’s vast landmass, the resource endowment, financial policy, scientific and technological level, economic development, employment ratio, and market demand of China’s 31 provinces vary greatly. Then, they are divided into east and mid-west regions for calibration modelling, and the configuration results are shown in Table 6.
According to the following table, the core conditions of two regions differ significantly, with the eastern regions emphasising economic security and the midwestern regions favouring quantity security. The deficiency of edge conditions, in the two groups of configurations, such as utilisation rate of land and fertilizer input appears, but they will be replaced by core and other conditions to some extent. Meanwhile, the key points of stabling food security in the eastern region lie in G and E indexes. Given that a developed economy creates a favourable policy environment and a high level of agricultural mechanisation, their grain production capacity is assured. In other words, the support from positive policy environment and technical part are desiderated in rural practice, which is consistent with the research results of Shen Jianbo et al. (2020) and Guo Chaoyi et al. (2021) [3,19]. Currently, there are two patterns for remote and central regions. Xinjiang and Nei Monggol Autonomous Regions are expected to be major cases of the J and A indices, as their relatively high agricultural productivity is based on the rising number of workers in the primary industry [32,39]. Regarding midland, the emphasis has shifted to P and G factors, as regional advantages have optimised the agricultural market in recent years, thereby enhancing their grain yield capability, which are in line with the findings of Lu Yonglong et al. (2015) and Huang Jikun et al. (2017) [15,34].
Conclusively, the problems of agricultural non-point source pollution and the declining capability of land in rural China are becoming increasingly serious in recent decades, and they have formed double constrains on the future development of food security and sustainable. Therefore, the overall model estimated results are consistent with the reality of grain production in the eastern and mid-west regions.
As for time perspective, the relative importance of each condition to sustainable grain safety will also change, as shown in Table 7. To reflect the path evolution process of China’s food security index in different periods, we calibrate and model the data of 2013, 2015, and 2017, conducting qualitative comparative analysis in multiple periods [24,27]. Firstly, this study classifies and names the configuration of each year according to key factors; dimensions and conditional completeness (see Table 6 for details). Secondly, the key factors are divided into three levels: production subject, production environment, and production factors, in which indexes P, J, and C are the factor inputs at the micro level, and that of A, G, and E are the environmental impacts from the macro level. Finally, configurations are split into four types, namely, promoting, dominant, substituting, and softening, by examining the conditional characteristics of each state.
In this part, the evaluation process of configuration types between 2012 and 2019 is exhibited in Table 8. China has long been known for its high food self-sufficiency, ranking amongst the top 5% of all countries worldwide. However, international risks have crossed physical barriers and deeply affected domestic food safety, which is manifested as follows: in the early stage, China pursued grain quantity security and paid more attention to improving the yield per unit area of rice, wheat, and corn, as well as the multiple cropping of land. Meanwhile, Huang Jikun (2017) [36] indicated the hidden dangers of food and ecological security caused by the continuous reduction in sown area and cultivated land fertility, and such phenomena were coexisted with the abnormal situations of ‘three simultaneous increases’ of high yield, imports, and inventory. Northeastern areas and central provinces are typical regions. As for the medium term, foreign grain prices have significant transmission and extrusion effects on domestic market prices. In addition, an increasing number of foreign grain enterprises have established a foothold in China’s grain and oil markets, necessitating reforms of economic security dominated by agricultural subsidies. As pointed out by Chi Mingjia et al. (2022) [11], China must expand the implementation scale and scope of ‘green box’ support policies under the WTO framework to release the new efficiency of agricultural subsidy policies. Thus, in 2016, China combined subsidies from superior seed varieties, grain planting, and general subsidies into agricultural support and protection subsidies, and distributed corresponding subsidies to actual grain farmers. The regions with prominent impact of reform above were mainly amongst north and eastern coastal places. In the later period, the domestic grain consumption structure continuously improved, resulting in the optimisation of the crop pattern. Moreover, residents’ consumption demand for personalised, diversified, and green required that environmental protection and high-quality development should be considered by the government. Thus, China shifted to a new green production system that improves overall process quality and efficiency. For example, the use of fertilizers had achieved ‘negative’ growth, and its use ratio was 40.2%, a 5% growth from 2015. Meanwhile, primary industry labour structure was featured obviously. On the one hand, the majority of farmers entered the aging stage, with more than 25% of them over 60 years old [36]. This aging brought a practical problem of ‘who will grow grain’, which had become increasingly prominent. On the other hand, the ‘rural revitalization’ strategy created development opportunities for rural areas in various forms since 2017, attracting citizens and rural populations to the countryside for employment. Since then, the number of professional farmers and family farms increased significantly, and the greenness of agricultural production subjects’ behaviour were constantly improved. Establishing agricultural talent teams, however, necessitates long-term investment to truly realise agricultural production ‘overtaking on the curve’ as a result of technological progress [15,33]. The typical regions are the northern regions and the eastern coastal areas.
In conclude, this study presents five recommendations to achieve a high food security index in China. Firstly, the subjective initiative of agricultural labour force and scientific input of grain production factors recommended by policies should be utilised to its maximum potential. The index of agricultural product prices should always be flexible and manageable under government and market supervision. In addition, promoting green agriculture in Chinese way should continue to be incorporated into national strategy. Finally, the ‘green box’ agricultural subsidies policy must be wild used to strengthen the production enthusiasm of grain farmers.

4. Conclusions and Discussion

Agricultural green development (AGD) and China’s economic potential play a significant role in stabilising long-term grain security during the transition from traditional to modern agriculture. Consequentially, policymakers and agricultural economists are continually interested in comprehending the factors that may influence such a sustainable process in China and their effects. Under the green agriculture background and methodology of these indexes, the purpose of this study was to investigate a new perspective on sustainable grain safety. Firstly, the systematic evaluation can aid in determining the interaction between elements. Given the indices of comprehensive assessment are increasing in all provinces, with obvious variation of the spatial and temporal trend. In particular, the high AGD areas are moving from surrounding to central and southern regions. In addition, these provinces apparently owed more economic potential by comparing two subsystems. Secondly, the results of CCD model showed that China’s AGD is trying to compatible with economic potential constructions, as transferring from basic to moderate synergy stage. Further analysis based on CCD model can also reveal the temporal and spatial evolution trend. Thus, the diffusing effect of agricultural economic potential on the green development has obvious lag and regional differences. Thirdly, the qualitative method presented the variation in the configurations of realising grain sustainable goal from a holistic perspective. Consequently, this paper’s marginal contribution consists primarily of two points. On the one hand, quantitative and qualitative methods are used to investigate the coupling development stage and spatial-temporal variation characteristics of agriculture and the economic system. On the other hand, the focus of food security in China has gradually shifted from grain output and subsidy policies to high resource utilisation and human capital accumulation, according to the configuration framework of the linkage of production subjects, factors, and environment. Although this study has enriched the field of sustainable grain security, it still has the following limitations. Due to China’s vast size and complex terrain, the country’s regions can be divided into those that primarily produce and sell goods and those with a balance between production and marketing for regional analysis. In addition, in-depth research can focus on country-level data derived from the aforementioned results.
Overall, our findings can not only assist policymakers and agricultural economists in China’s current agricultural green transformation, but also serve as a resource for other agricultural nations, particularly those that are promoting agricultural green processes. This study offers three strategic suggestions as follows. At first, green transformation of agriculture is a long-term and sustainable process, which must be included in the national strategic development framework. Then, the cultivation of agricultural talents, such as professional farmers and family farms, are supposed to be accelerated, which are the key body and vital trend of developing national agriculture in the future. Finally, technological advancement has always been a key factor in stabilising food production, and a new mode of modern, high quality and greening should be formed as soon as possible to balance the dual goals of food security and economic development. In conclusion, our empirical findings demonstrate that China’s sustainable food security policy focuses on enhancing the quality and efficiency of agricultural production and attracting talent in the primary industry, which is precisely in line with the objective of coupling and coordinated development of domestic agricultural green and economic potential development, indicating that China’s agricultural green transformation and sustainable food security are mutually reinforcing.

Author Contributions

Conceptualization, methodology, software, formal analysis, resources, data curation, writing—original draft preparation, writing—review and editing, validation, Y.D.; supervision, project administration, F.Z. All authors have read and agreed to the published version of the manuscript.

Funding

This research was funded by National Natural Science Foundation of China: 72073043.

Conflicts of Interest

The authors declare no conflict of interest.

Appendix A

1.
The steps of extreme value method
(1)
Data standardisation.
Direct index is standardized by Formula (A1), and those that are negative can use Formula (A2); both formulas are applied for eliminating the dimensional influence.
Y i j = X i j m i n X i j m a x X i j m i n X i j
Y i j = m a x X i j X i j m a x X i j m i n X i j
As in these equations, Yij is the ith year (i = 1, 2, …, n), number of j(j = 1, 2, …, m) the initial value and standardized value of the index. While ( maxX ij minX ij ) means the difference between the maximum and the minimum value of the index in number of j column.
(2)
Translation of index
Since 0 value appeared in the data after standardized processing above, in order to avoid meaningless calculation of comprehensive evaluation and CCD model, the range interval was translated, that is, the intercept term was added as following.
Y i j = Y i j × 0.99 + 0.01
2.
The process of entropy evaluation method
(1)
Calculating index proportions
The specific gravity P i j of the index in row i and column j can be computed by Formula (A4).
P ij = Y ij / i = 1 n Y ij
(2)
Calculating information entropy
The information entropy e j of column j can be calculated by Formula (A5).
e j = i = 1 n P j l n P j / K
In the Formula (A6), K = ln(n), n means the total years of evaluation. In addition, there is 0 ≤ e j ≤ 1. In addition, when P j = 0, P j l n P j = 0.
(3)
Calculating diversity factor
The diversity factor g j of column j can be calculated by Formula (A6).
g j = ( 1 e j ) / j = 1 m e j
(4)
Calculating weights
The weights W j of each index can be computed by Formula (A7).
W j = g j / j = 1 m g j
3.
The extra tables
(1)
The combination weights
Table A1. Combination weights of two methods.
Index LayerAHP
Weights
Entropy WeightsCombination
Weights
Multiple cropping index of land (x1)0.2350.1010.161
Percent of water-saving irrigated area (x2)0.2350.1520.197
Number of green food labels per unit area (x3)0.2090.1730.199
Average agricultural labour productivity (x4)0.1100.1370.128
Emission intensity of agricultural chemical oxygen demand (COD) (x5)0.0780.1140.099
Fertilizer intensity (x6)0.0700.1490.107
Forest coverage rate (x7)0.0370.0860.059
Soil erosion control area (x8)0.0260.0870.050
Rate of urbanization (x9)0.3650.1810.251
Added value of agriculture, forestry, animal husbandry and fisher (x10)0.2310.1250.166
Rural network coverage (x11)0.1220.1660.139
Agricultural mechanical power per land (x12)0.0910.2030.132
Proportion of effective irrigated area (x13)0.0770.2390.132
Percentage of highway mileage (x14)0.0640.1190.085
Occurrence rate of agricultural natural disasters (x15)0.0300.0720.045
Annual rainfall in the area (x16)0.0200.1340.050
(2)
The calibration points of conditions and results for 2013–2017 years
Table A2. Calibration points of conditions and results during 2013–2017 years.
Conditions and Results201320152017
Full Membership PointIntersection PointFull Non-Membership PointFull Membership PointIntersection PointFull Non-Membership PointFull Membership PointIntersection PointFull Non-membership Point
Outcome variableFood security index0.890.62−0.580.90.64-0.610.90.65−0.84
Quantity security indexLand used per unit grain output10.770.240.990.70.230.980.780.18
Percent of primary industry employment58.6237.026.8853.7236.626.0449.5732.685.51
Ecology security indexFertilizer intensity of unit area0.980.640.220.990.670.220.970.670.2
Agricultural labour productivity5.835.284.486.055.464.826.255.65.01
Economic security indexAgricultural production price index0.910.630.30.90.550.20.980.480.09
Fiscal expenditures on grain production508.98384.81259.52520.72395.62267.66561.09406.68272.59
4.
Acronyms
AGD for agricultural green development.
SD for serious dissonance stage.
MD for moderate dissonance stage.
BC for basic coordination stage.
QCA for the qualitative comparative analysis.
The fsQCA for fuzzy-set QCA.
AEP for China’s economic potential system
CCD model for the coupling coordination degree model

References

  1. FAO. Crop Prospects and Food Situation; Food and Agriculture Organization of the United Nations: Rome, Italy, 2022. [Google Scholar]
  2. Liu, Y.; Sun, D.; Wang, H.; Wang, X.; Yu, G.; Zhao, X. An evaluation of China’s agricultural green production: 1978–2017. China Agric. Econ. Rev. 2018, 10, 78–92. [Google Scholar] [CrossRef]
  3. Shen, J.; Zhu, Q.; Jiao, X.; Ying, H.; Wang, H.; Wen, X.; Xu, W.; Li, T.; Cong, W.; Liu, X.; et al. Agriculture Green Development: A model for China and the world. Front. Agr. Sci. Eng. 2020, 7, 5. [Google Scholar] [CrossRef] [Green Version]
  4. The Global Network Against Food Crises Global Report on Food Crises. 2022. Available online: https://reliefweb.int/report/world/global-report-food-crises-2022 (accessed on 20 January 2023).
  5. Barrett, C.B. Measuring food insecurity. Science 2010, 327, 825–828. [Google Scholar] [CrossRef] [PubMed]
  6. Coates, J. Build it back better: Deconstructing food security for improved measurement and action. Glob. Food Secur. 2013, 2, 188–194. [Google Scholar] [CrossRef]
  7. Norse, D.; Ju, X. Environmental costs of China’s food security. Agric. Ecosyst. Environ. 2015, 209, 5–14. [Google Scholar] [CrossRef]
  8. Jiao, X.; Lyu, Y.; Wu, X.; Li, H.; Cheng, L.; Zhang, C.; Yuan, L.; Jiang, R.; Jiang, B.; Rengel, Z.; et al. Grain production versus resource and environmental costs: Towards increasing sustainability of nutrient use in China. EXBOTJ 2016, 67, 4935–4949. [Google Scholar] [CrossRef] [Green Version]
  9. Svensson, J.; Wang, Y.; Garrick, D.; Dai, X. How does hybrid environmental governance work? Examining water rights trading in China (2000–2019). J. Environ. Manag. 2021, 288, 112333. [Google Scholar] [CrossRef]
  10. Alola, A.A.; Adebayo, T.S.; Onifade, S.T. Examining the dynamics of ecological footprint in China with spectral Granger causality and quantile-on-quantile approaches. Int. J. Sustain. Dev. World Ecol. 2022, 29, 263–276. [Google Scholar] [CrossRef]
  11. Chi, M.; Guo, Q.; Mi, L.; Wang, G.; Song, W. Spatial Distribution of Agricultural Eco-Efficiency and Agriculture High-Quality Development in China. Land 2022, 11, 722. [Google Scholar] [CrossRef]
  12. Fan, M.; Shen, J.; Yuan, L.; Jiang, R.; Chen, X.; Davies, W.J.; Zhang, F. Improving crop productivity and resource use efficiency to ensure food security and environmental quality in China. J. Exp. Bot. 2012, 63, 13–24. [Google Scholar] [CrossRef]
  13. Schindler, J.; Graef, F.; König, H.J. Methods to assess farming sustainability in developing countries. A review. Agron. Sustain. Dev. 2015, 35, 1043–1057. [Google Scholar] [CrossRef] [Green Version]
  14. Jiang, Z.; Wu, H.; Lin, A.; Shariff, A.R.M.; Hu, Q.; Song, D.; Zhu, W. Optimizing the spatial pattern of land use in a prominent grain-producing area: A sustainable development perspective. Sci. Total Env. 2022, 843, 156971. [Google Scholar] [CrossRef] [PubMed]
  15. Liu, J.; Dong, C.; Liu, S.; Rahman, S.; Sriboonchitta, S. Sources of Total-Factor Productivity and Efficiency Changes in China’s Agriculture. Agriculture 2020, 10, 279. [Google Scholar] [CrossRef]
  16. Lu, Y.; Jenkins, A.; Ferrier, R.C.; Bailey, M.; Gordon, I.J.; Song, S.; Huang, J.; Jia, S.; Zhang, F.; Liu, X.; et al. Addressing China’s grand challenge of achieving food security while ensuring environmental sustainability. Sci. Adv. 2015, 1, e1400039. [Google Scholar] [CrossRef] [PubMed] [Green Version]
  17. Wang, J.; Li, Y.; Huang, J.; Yan, T.; Sun, T. Growing water scarcity, food security and government responses in China. Glob. Food Secur. 2017, 14, 9–17. [Google Scholar] [CrossRef]
  18. Liu, F.; Xiao, X.; Qin, Y.; Yan, H.; Huang, J.; Wu, X.; Zhang, Y.; Zou, Z.; Doughty, R.B. Large spatial variation and stagnation of cropland gross primary production increases the challenges of sustainable grain production and food security in China. Sci. Total Environ. 2022, 811, 151408. [Google Scholar] [CrossRef] [PubMed]
  19. Musvoto, C.; Nortje, K.; De Wet, B.; Mahumani, B.K.; Nahman, A. Imperatives for an agricultural green economy in South Africa. S. Afr. J. Sci. 2015, 111, 1–8. [Google Scholar] [CrossRef] [Green Version]
  20. Florea, N.V.; Duică, M.C.; Ionescu, C.A.; Duică, A.; Ibinceanu, M.C.O.; Stanescu, S.G. An Analysis of the Influencing Factors of the Romanian Agricultural Output within the Context of Green Economy. Sustainability 2021, 13, 9649. [Google Scholar] [CrossRef]
  21. Guo, C.; Bai, Z.; Shi, X.; Chen, X.; Chadwick, D.; Strokal, M.; Zhang, F.; Ma, L.; Chen, X. Challenges and strategies for agricultural green development in the Yangtze River Basin. J. Integr. Environ. Sci. 2021, 18, 37–54. [Google Scholar] [CrossRef]
  22. Vitousek, P.M.; Mooney, H.A.; Lubchenco, J.; Melillo, J.M. Human Domination of Earth’s Ecosystems. Science 1997, 277, 6. [Google Scholar] [CrossRef]
  23. Liu, J.; Dietz, T.; Carpenter, S.R.; Alberti, M.; Folke, C.; Moran, E.; Pell, A.N.; Deadman, P.; Kratz, T.; Lubchenco, J.; et al. Complexity of Coupled Human and Natural Systems. Science 2007, 317, 1513–1516. [Google Scholar] [CrossRef] [Green Version]
  24. Carpenter, S.R.; Mooney, H.A.; Agard, J.; Capistrano, D.; DeFries, R.S.; Díaz, S.; Dietz, T.; Duraiappah, A.K.; Oteng-Yeboah, A.; Pereira, H.M.; et al. Science for managing ecosystem services: Beyond the Millennium Ecosystem Assessment. Proc. Natl. Acad. Sci. USA 2009, 106, 1305–1312. [Google Scholar] [CrossRef] [Green Version]
  25. Rees, W.; Wackernagel, M. Urban ecological footprints: Why cities cannot be sustainable—And why they are a key to sustainability. Environ. Impact Assess. Rev. 1996, 16, 223–248. [Google Scholar] [CrossRef]
  26. Wackernagel, M.; Kitzes, J.; Moran, D.; Goldfinger, S.; Thomas, M. The Ecological Footprint of cities and regions: Comparing resource availability with resource demand. Environ. Urban. 2006, 18, 103–112. [Google Scholar] [CrossRef]
  27. Pappas, I.O.; Woodside, A.G. Fuzzy-set Qualitative Comparative Analysis (fsQCA): Guidelines for research practice in Information Systems and marketing. Int. J. Inf. Manag. 2021, 58, 102310. [Google Scholar] [CrossRef]
  28. Marx, A.; Rihoux, B.; Ragin, C. The origins, development, and application of Qualitative Comparative Analysis: The first 25 years. Eur. Pol. Sci. Rev. 2014, 6, 115–142. [Google Scholar] [CrossRef] [Green Version]
  29. Ragin, C.C.; Strand, S.I. Using Qualitative Comparative Analysis to Study Causal Order: Comment on Caren and Panofsky (2005). Sociol. Methods Res. 2008, 36, 431–441. [Google Scholar] [CrossRef]
  30. Kang, S.; Zhang, L.; Trout, T. Special Issue: Improving Agricultural Water Productivity to Ensure Food Security under Changing Environments. Agric. Water Manag. 2017, 179, 1–4. [Google Scholar] [CrossRef]
  31. Liu, X.; Shi, L.; Qian, H.; Sun, S.; Wu, P.; Zhao, X.; Engel, B.A.; Wang, Y. New problems of food security in Northwest China: A sustainability perspective. Land Degrad. Dev. 2020, 31, 975–989. [Google Scholar] [CrossRef]
  32. The Xinhua News Agency. China Unveils 5-Year Plan for Agricultural Green Development; The Xinhua News Agency: Beijing, China, 2022. Available online: http://english.www.gov.cn/statecouncil/ministries/202109/08/content_WS61386c3bc6d0df57f98dfddf.html (accessed on 29 November 2022).
  33. Liu, Y.; Cheng, X.; Li, W. Agricultural chemicals and sustainable development: The agricultural environment Kuznets curve based on spatial panel model. Env. Sci. Pollut. Res. Int. 2021, 28, 51453–51470. [Google Scholar] [CrossRef]
  34. Fiss, P.C. Building Better Causal Theories: A Fuzzy Set Approach to Typologies in Organization Research. AMJ 2011, 54, 393–420. [Google Scholar] [CrossRef] [Green Version]
  35. Ge, D.; Long, H.; Ma, L.; Zhang, Y.; Tu, S. Analysis Framework of China’s Grain Production System: A Spatial Resilience Perspective. Sustainability 2017, 9, 2340. [Google Scholar] [CrossRef] [Green Version]
  36. Huang, J.; Wei, W.; Cui, Q.; Xie, W. The prospects for China’s food security and imports: Will China starve the world via imports? J. Integr. Agric. 2017, 16, 2933–2944. [Google Scholar] [CrossRef]
  37. Qi, Y.; Farnoosh, A.; Lin, L.; Liu, H. Coupling coordination analysis of China’s provincial water-energy-food nexus. Environ. Sci. Pollut. Res. 2022, 29, 23303–23313. [Google Scholar] [CrossRef]
  38. Yang, C.; Zeng, W.; Yang, X. Coupling coordination evaluation and sustainable development pattern of geo-ecological environment and urbanization in Chongqing municipality, China. Sustain. Cities Soc. 2020, 61, 102271. [Google Scholar] [CrossRef]
  39. Du, Y.; Kim, P.H.; Aldrich, H.E. Configurational Effects of Slack and CEO Narcissism on New Venture Innovation Investment. Proceedings 2016, 2016, 12479. [Google Scholar] [CrossRef]
  40. Wang, M.; Wang, K. Exploring Water Landscape Adaptability of Urban Spatial Development Base on Coupling Coordination Degree Model A Case of Caidian District, Wuhan. Sustainability 2021, 13, 1475. [Google Scholar] [CrossRef]
  41. Sigdel, R.; Anand, M.; Bauch, C.T. Convergence of socio-ecological dynamics in disparate ecological systems under strong coupling to human social systems. Theor. Ecol. 2018, 12, 285–296. [Google Scholar] [CrossRef]
Figure 1. Framework of the paper.
Sustainability 15 02538 g001
Figure 2. Food security framework of fsQCA.
Sustainability 15 02538 g002
Figure 3. Changes of comprehensive integrated AGD degree in China from 2012–2020; (a) is the spatial distribution of comprehensive assessment degree in 2012; (b) is that degree in 2016; (c) is that degree in 2020.
Sustainability 15 02538 g003
Figure 4. China’s coordinated degree variations amongst 2012–2020; (a) is the spatial distribution maps of coordinated degree in 2012; (b) is that degree in 2020.
Sustainability 15 02538 g004
Table 1. Comprehensive evaluation index of China’s AGD and economic potential system.
Target LayerCriterion LayerIndex LayerProperty
Agricultural Green Development (AGD) LayerConserving resource Multiple cropping index of land (x1)
Percent of water-saving irrigated area (x2)+
High quality and efficiencyNumber of green food labels per unit area (x3)+
Average agricultural labour productivity (x4)+
Eco-friendlyEmission intensity of agricultural chemical oxygen demand (COD) (x5)
Fertilizer intensity (x6)
Conservation ecologyForest coverage rate (x7)+
Soil erosion control area (x8)+
Agricultural Economic Potential (AEP) LayerUrban-rural integrationRate of urbanization (x9)+
Added value of agriculture, forestry, animal husbandry and fisher (x10)+
R&D inputRural network coverage (x11)+
Agricultural mechanical power per land (x12)+
Infrastructure Proportion of effective irrigated area (x13)+
Percentage of highway mileage (x14)+
ClimateOccurrence rate of agricultural natural disasters (x15)
Annual rainfall in the area (x16)+
Note: ‘+’ means a positive indicator and ‘−’ indicates a negative indicator. Index selecting is referenced from cited references and a government document.
Table 2. Stage features of coordination in the CCD model.
Value Interval of DTypes of CoordinationMeaning
0 < D ≤ 0.2Serious dissonanceWith rapid development of agricultural economy, the ecological environment is overloaded, and ecological pollution occurs frequently.
0.2 < D ≤ 0.4Moderate dissonanceAgricultural economic function occupies absolute superiority, the negative impact of ecological pollution is increasingly serious, which is of concern by the government.
0.4 < D ≤ 0.5Basic coordinationThe progress of agricultural economic construction has slowed down, gradually shifting to green production methods that improve quality and efficiency.
0.5 < D ≤ 0.8Moderate coordinationThe transformation of AGD has been achieved initially, and with the increase in financial investment in environmental governance, ecological restoration has achieved some results.
0.8 < D ≤ 1.0High coordination.Agricultural green transformation and economic development are going to adapt with each other, and achieve sustainable and orderly development.
Table 3. Calibration points of conditions and results in 2019.
Conditions and ResultsFull Membership PointIntersection PointFull Non-Membership Point
Outcome variableFood security index0.890.66−0.98
Quantity security indexLand used per unit grain output0.990.760.21
Percent of primary industry employment42.2331.495.18
Ecology security indexFertilizer intensity of unit area0.970.630.03
Agricultural labour productivity6.415.715.19
Economic security indexAgricultural production price index0.890.470.12
Fiscal expenditures on grain production570.31408.08262.22
Table 4. Consistency and coverage of model in 2019.
Condition VariablesHigh Food Security AreasNon-Food Security Ares
ConsistencyCoverageConsistencyCoverage
Land used per unit grain output(P)0.4700.8010.7840.795
~Land used per unit grain output(~P)0.6930.9700.4921.000
Percent of primary industry employment(J)0.8020.9040.4540.941
~Percent of primary industry employment(~J)0.3820.9230.8110.815
Fertilizer intensity of unit area(C)0.7750.9060.6840.889
~Fertilizer intensity of unit area(~C)0.3970.8910.6570.928
Agricultural labour productivity(G)0.3560.8980.6890.845
~Agricultural labour productivity(~G)0.8450.9340.5420.817
Agricultural production price index(A)0.5170.9150.6580.756
~Agricultural production price index(~A)0.6880.9350.5530.911
Fiscal expenditures on grain production(E)0.4630.9390.7460.762
~Fiscal expenditures on grain production(~E)0.7560.9350.4060.813
Note: ~means the absence of. For instance: ~Land used per unit grain output = absence of high P.
Table 5. Configuration results of high and non-food security index in 2019.
ConfigurationSolutions of High AreasSolutions of Non-High Areas
H1H2H3aH3bH4N1N2aN2bN3aN3bN4
P
J
C
A
G
E
Consistency111110.99111111
Raw coverage0.3080.2400.2600.4370.2140.3290.1470.2720.2050.2030.243
Unique coverage0.0480.0440.0070.0410.0190.0880.0350.0640.0830.0340.081
Solution consistency10.996
Solution coverage0.7140.667
Note: ● = core conditions exist; • = edge conditions exist; ⊗ = lack of core condition; ⨂ = edge conditions is absence, blank sheet says ‘do not care’ [27], the same below.
Table 6. Configuration results of different areas in 2019.
ConfigurationEastern AreasMid-Western Areas
E1E2E3W1aW1bW2aW2bW3
P
J
C
A
G
E
Consistency0.9680.9180.963110.99611
Raw coverage0.2840.3870.2380.2290.1900.2700.2190.201
Unique coverage0.0360.1230.0690.0890.0510.0530.0300.009
Solution consistency0.9350.998
Solution coverage0.4930.459
Note: ● = core conditions exist; • = edge conditions exist; ⨂ = edge conditions is absence.
Table 7. Types of high food security configurations.
Configuration NameDominant TypePromotion TypeSubstitute TypeSoftening Type
FeaturesMultiple conditions are at high levels and key factors can consolidate favourable conditions.The edge conditions are missed, and the key factors have obvious substitution for such condition.Core conditions are missed. With other conditions is relatively better, forming strong substitution of such key conditions.
Factors of grain productionSubjects
EnvironmentEnvironmental enablerEnvironmental substitutionEnvironmental softening
Basic inputFactors promotingFactors substitutionFactors softening
Comprehensive Synthetic developmentSynthetic substitutionSynthetic softening
Table 8. High food security configurations during 2012–2019.
YearConfigurationKey PointsDimensionCompleteness of ConditionTypesTypical Regions
2013P×J×~C×~A×ELand used per unit grain outputBasic inputMissing edge conditionsFactors substitutionJiangsu, Hubei, Hunan, Shandong, Xinjiang, Inner Mongolia
P×~J×~C×A×~G×ELand used per unit grain output, agricultural labour productivityComprehensiveMissing edge conditionsSynthetic substitutionHeilongjiang, Hebei, Henan
~P×J×C×A×G×EAgricultural labour productivityEnvironmentMissing edge conditionsEnvironmental substitutionAnhui, Jilin
2015P×C×A×G×ELand used per unit grain output,
fiscal expenditures on grain production
ComprehensiveComplete conditionsSynthetic developmentAnhui, Shandong
P×~J×C×A×G×ELand used per unit grain output,
fiscal expenditures on grain production
ComprehensiveMissing edge conditionsSynthetic substitutionJiangsu, Hebei, Henan, Jiangxi, Hubei, Xinjiang
~P×C×A×~G×EFiscal expenditures on grain productionEnvironmentMissing edge conditionsEnvironmental substitutionJilin, Inner Mongolia
2017~J×A×EPercent of primary industry employmentBasic inputLacking core pointsFactors softeningHebei, Henan, Anhui, Hubei, Inner Mongolia
~P×J×C×A×G×ELand used per unit grain outputBasic inputLacking core pointsFactors softeningJilin
P×J×C×~A×G×~EAgricultural labour productivity,
fiscal expenditures on grain production
ComprehensiveLacking core pointsSynthetic softeningJiangsu, Jiangxi, Xinjiang
2019~P×J×A×~G×~ELand used per unit grain output, percent of primary industry employmentBasic inputLacking core pointsFactors softeningJiangsu, Heilongjiang
C×A×~G×~EFertilizer intensity of unit areaBasic inputMissing edge conditionsFactors substitutionHubei, Hunan
~P×J×C×A×~G×~EPercent of primary industry employment, fertilizer intensity of unit areaBasic inputLacking core pointsFactors softeningShandong, Anhui, Jiangxi, Xinjiang, Inner Mongolia
J×C×~A×~G×EPercent of primary industry employment, fertilizer intensity of unit areaBasic inputMissing edge conditionsFactors substitutionHenan, Liaoning
Note: The letter denotes to edge condition, while the tilde before it means its absence. Also, the bold and underline indicates core conditions exist, and the tilde before it means lacking of such condition.
Disclaimer/Publisher’s Note: The statements, opinions and data contained in all publications are solely those of the individual author(s) and contributor(s) and not of MDPI and/or the editor(s). MDPI and/or the editor(s) disclaim responsibility for any injury to people or property resulting from any ideas, methods, instructions or products referred to in the content.

