
Experimental Study of the Microscopic Visualization of Gas Clogging during Groundwater Recharge


Abstract
:1. Introduction
2. Experimental Apparatus and Procedures
2.1. Experimental Materials
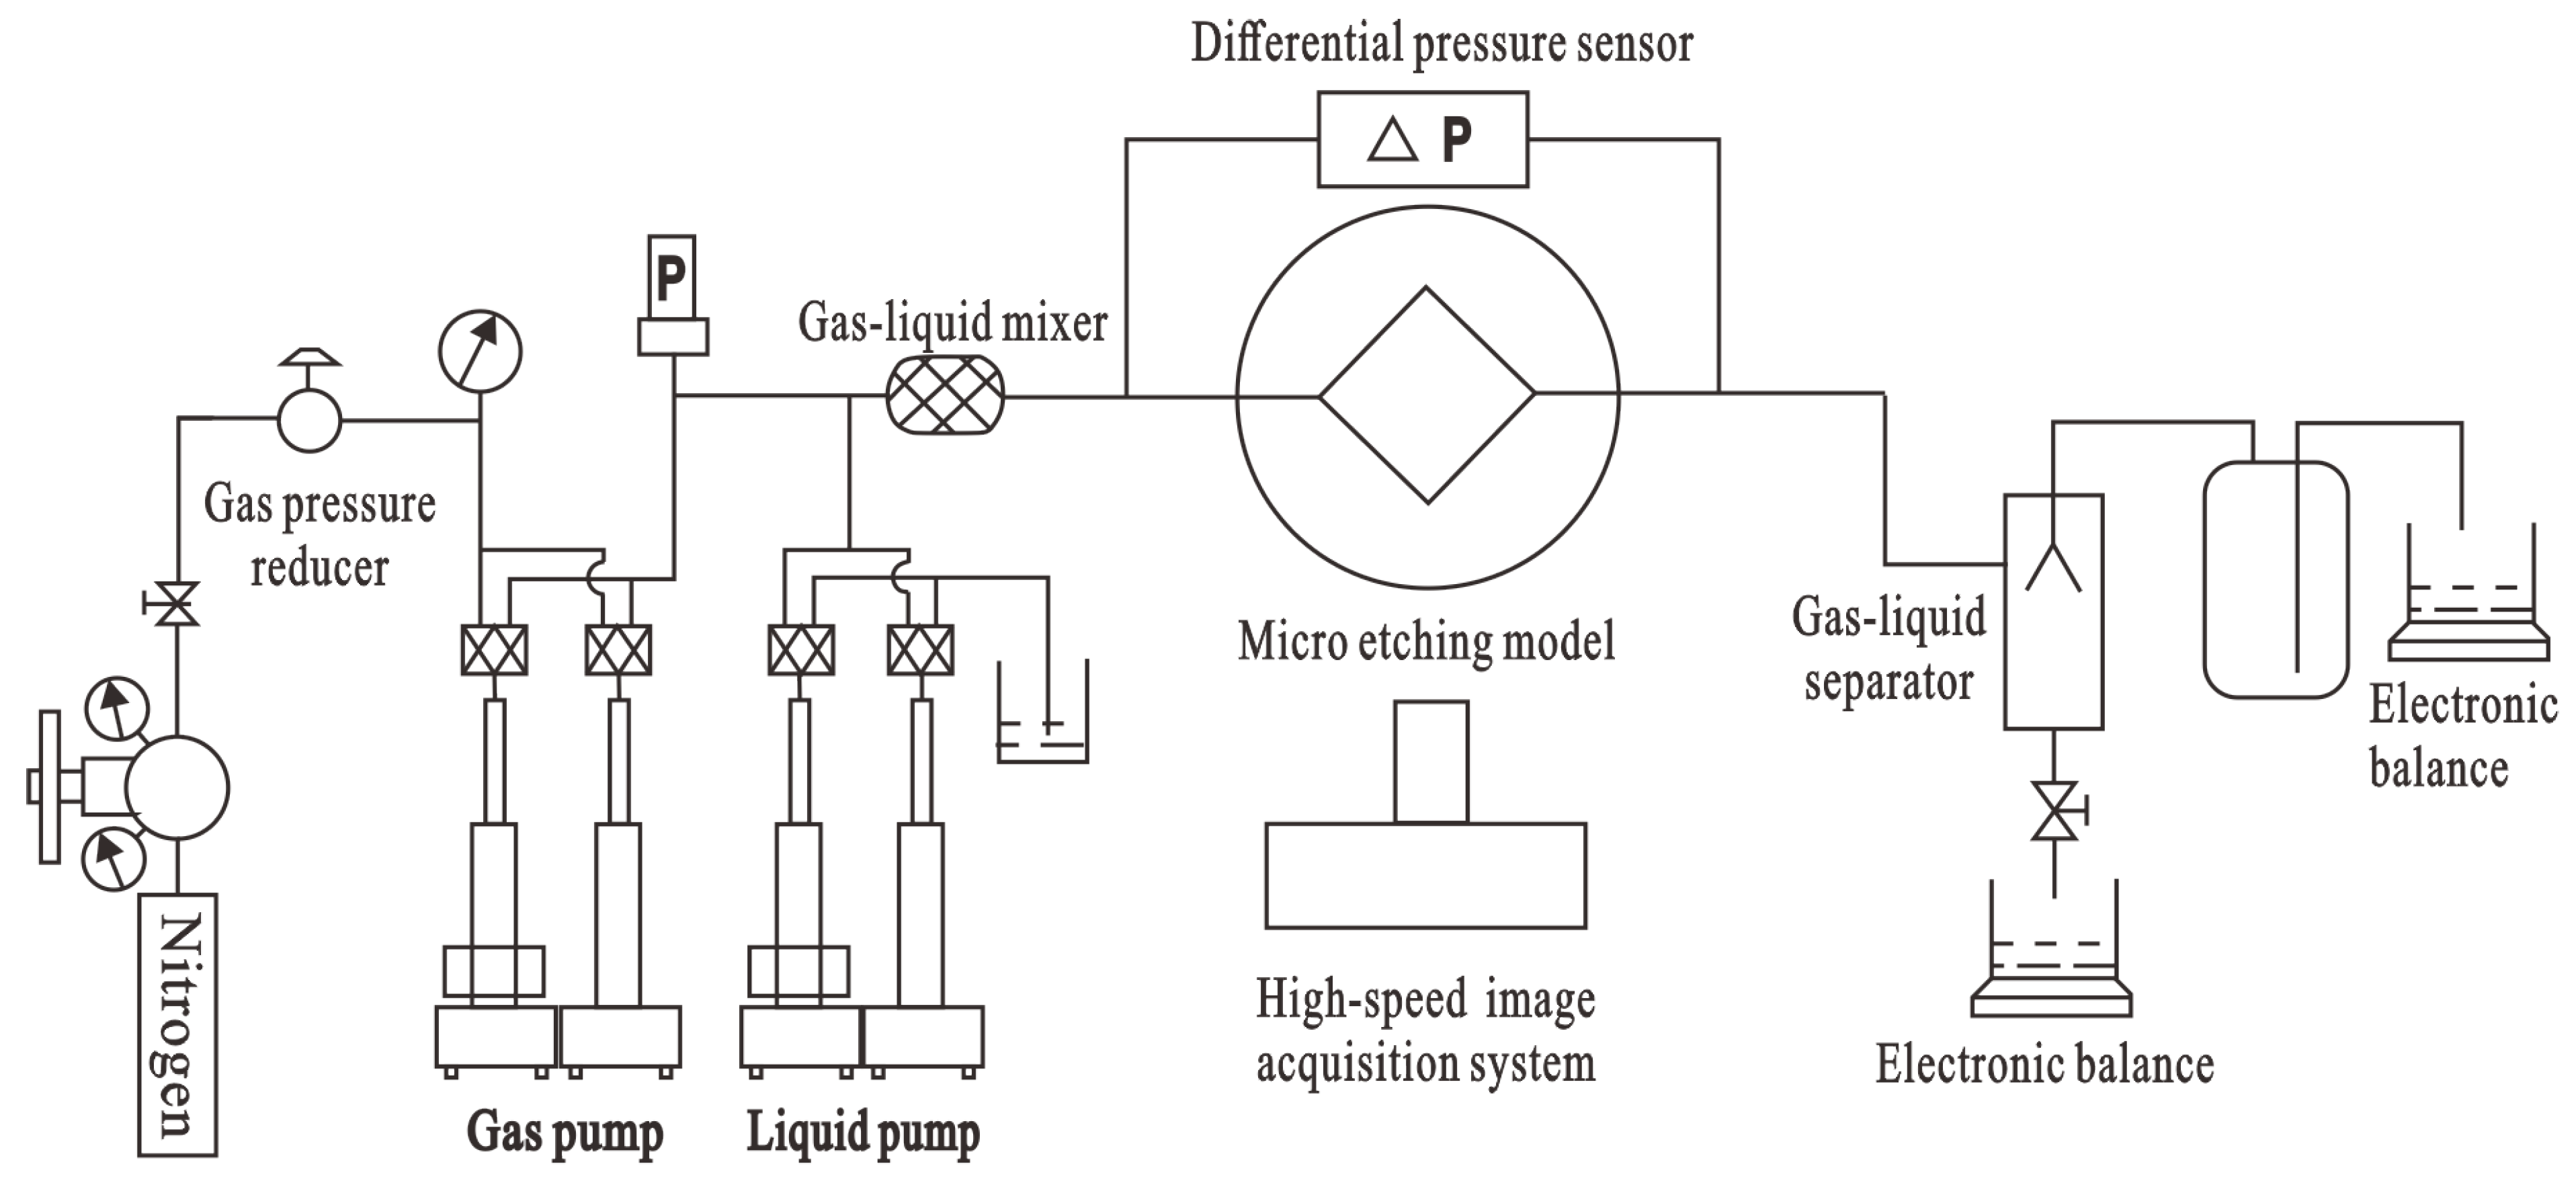
2.2. Experimental Apparatus
2.3. Main Experimental Procedure
3. Results and Discussion
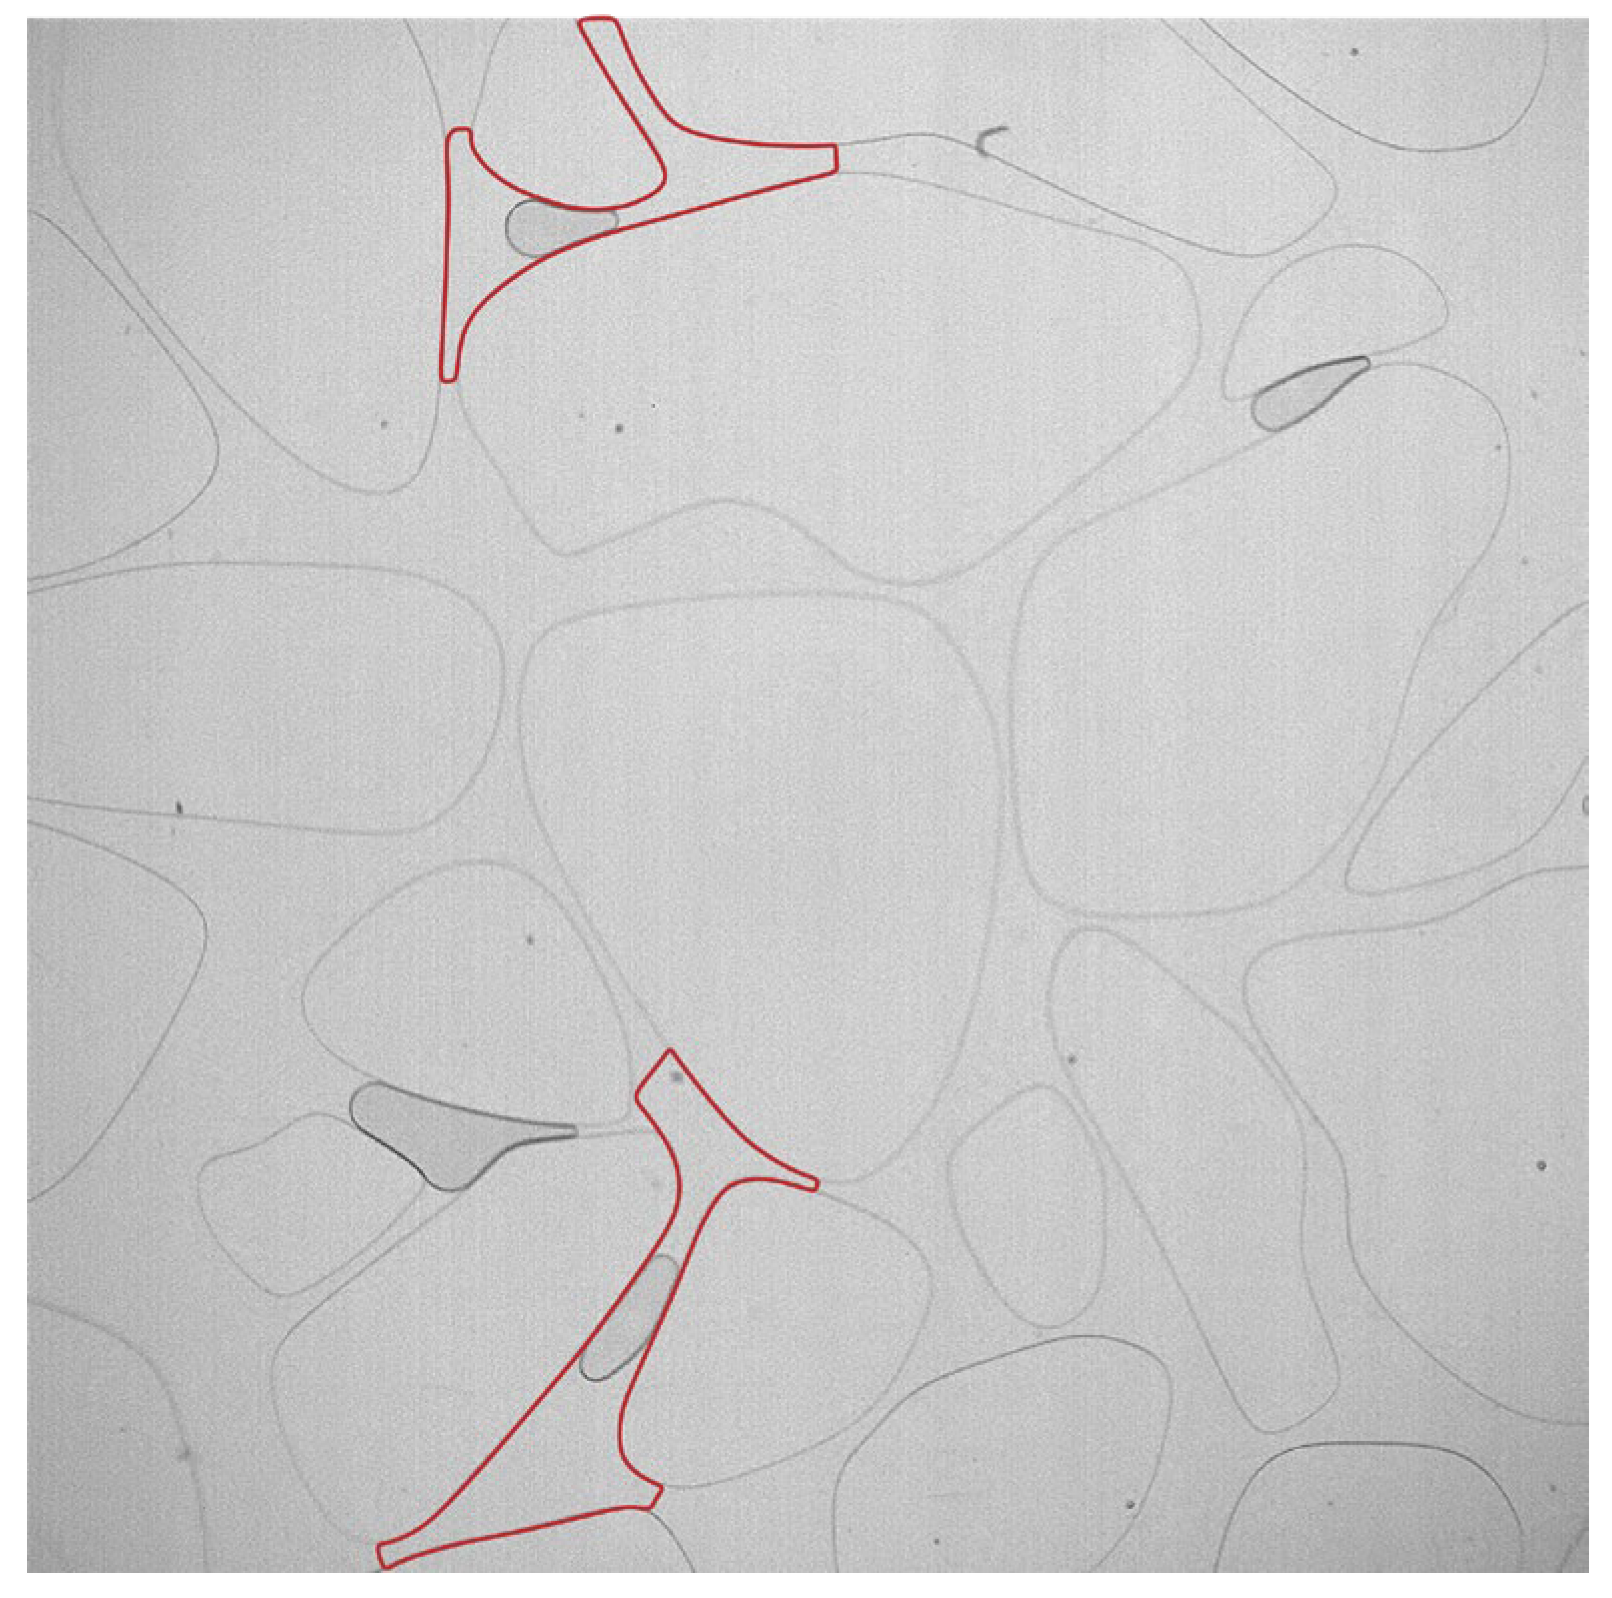
3.1. Formation Mechanism of Different Types of Gas Clogging
3.1.1. Gas Clogging Formed by Bypass Flow
3.1.2. Gas Clogging Formed in the H-Shaped Channel
3.1.3. Gas Clogging Formed at the Blind End and Corner of a Pore
3.1.4. Gas Clogging Formed by Cutoff
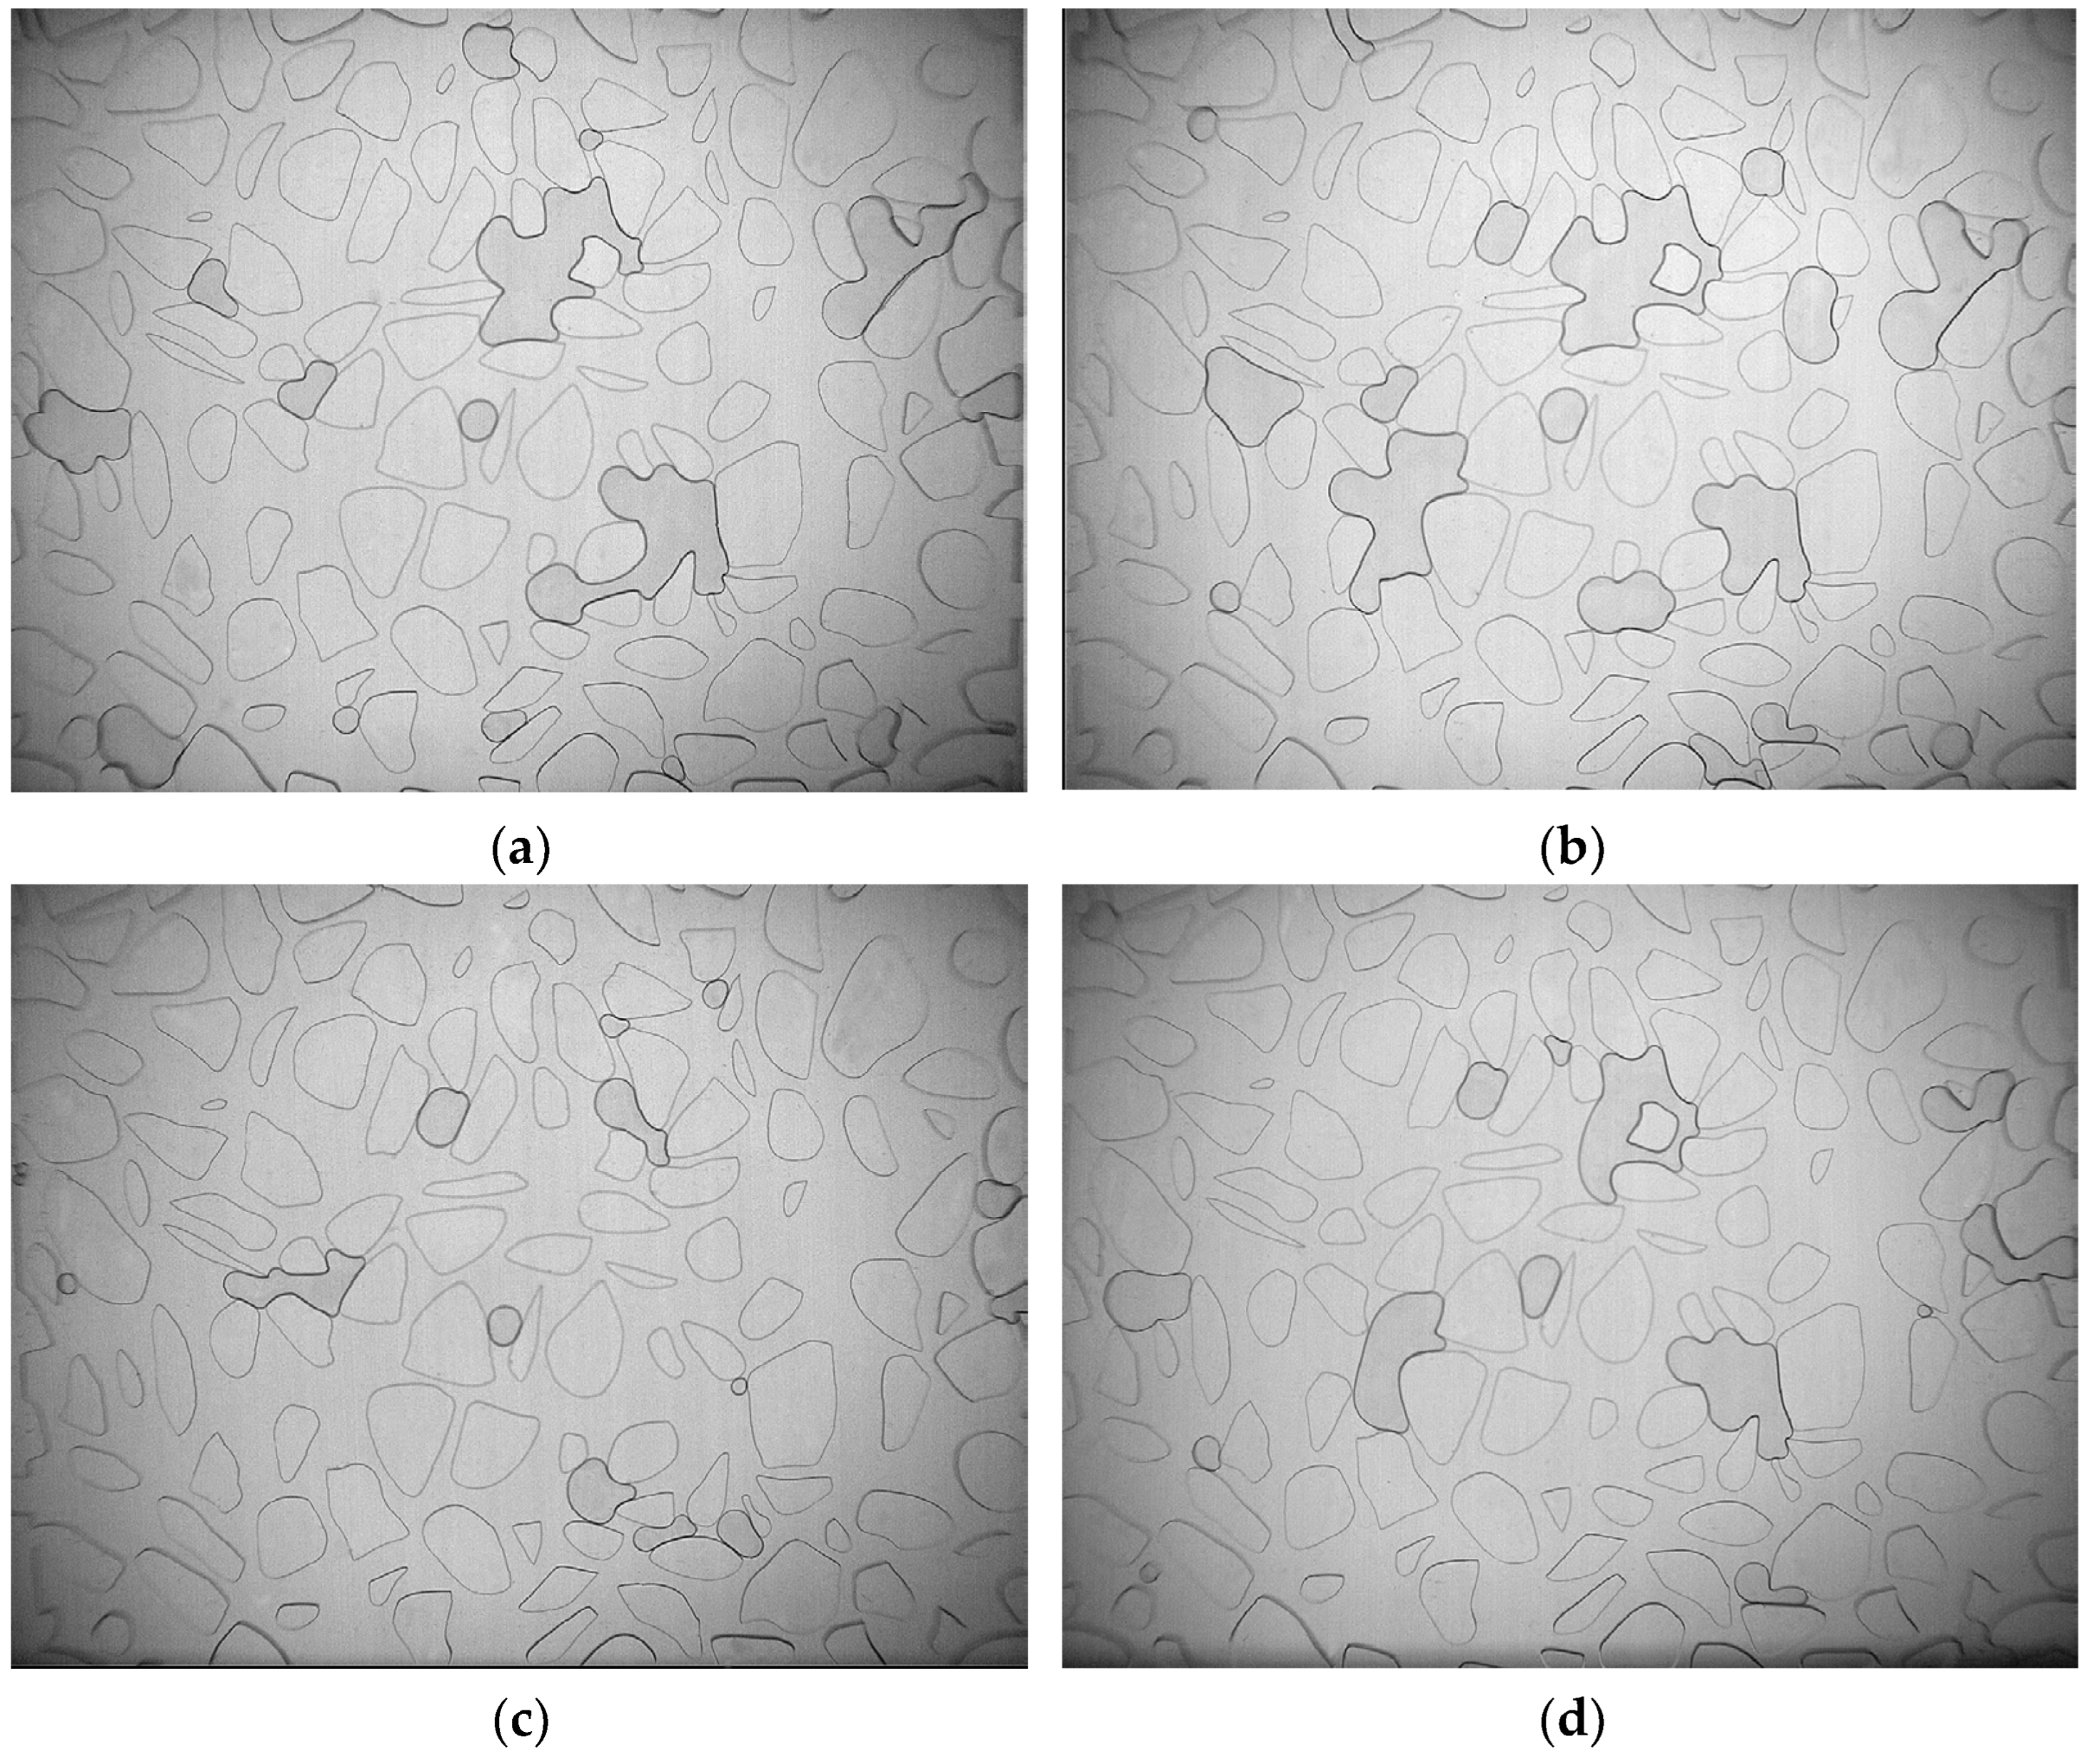
3.2. Quantitative Characterization of Visual Experiments
3.3. Sensitivity Analysis
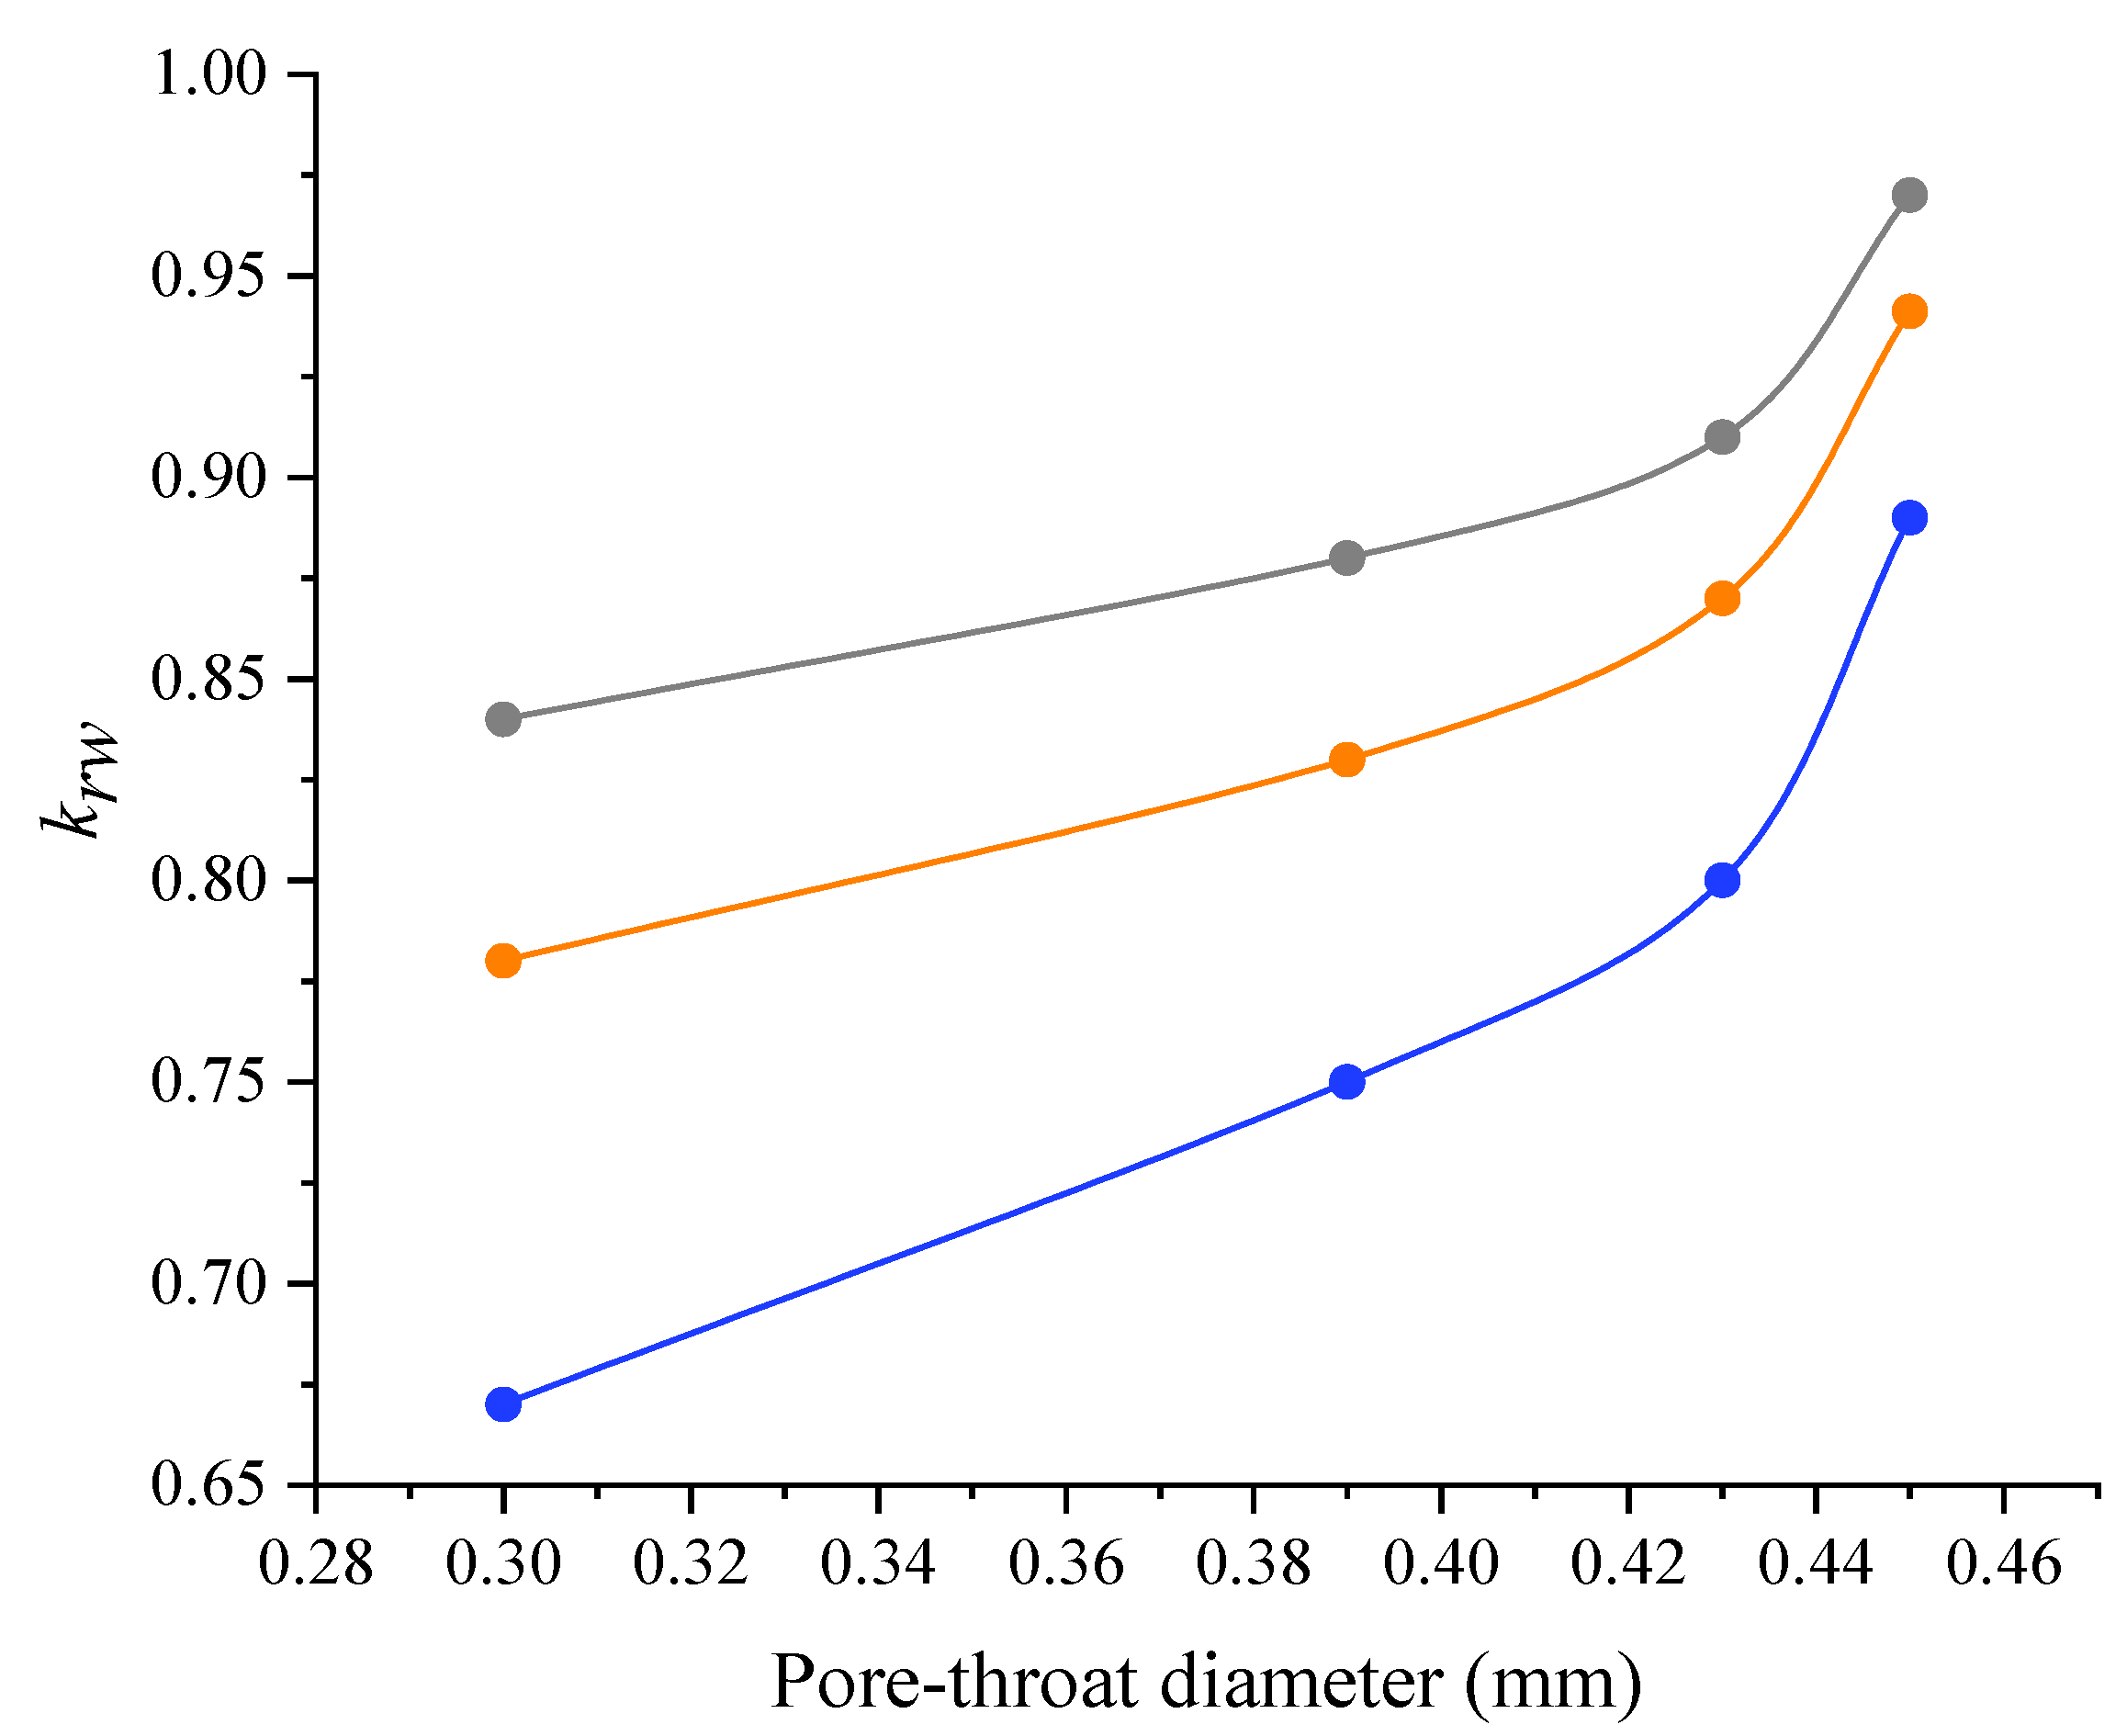
3.3.1. Pore Structure
- Pore–Throat Diameter
- 2.
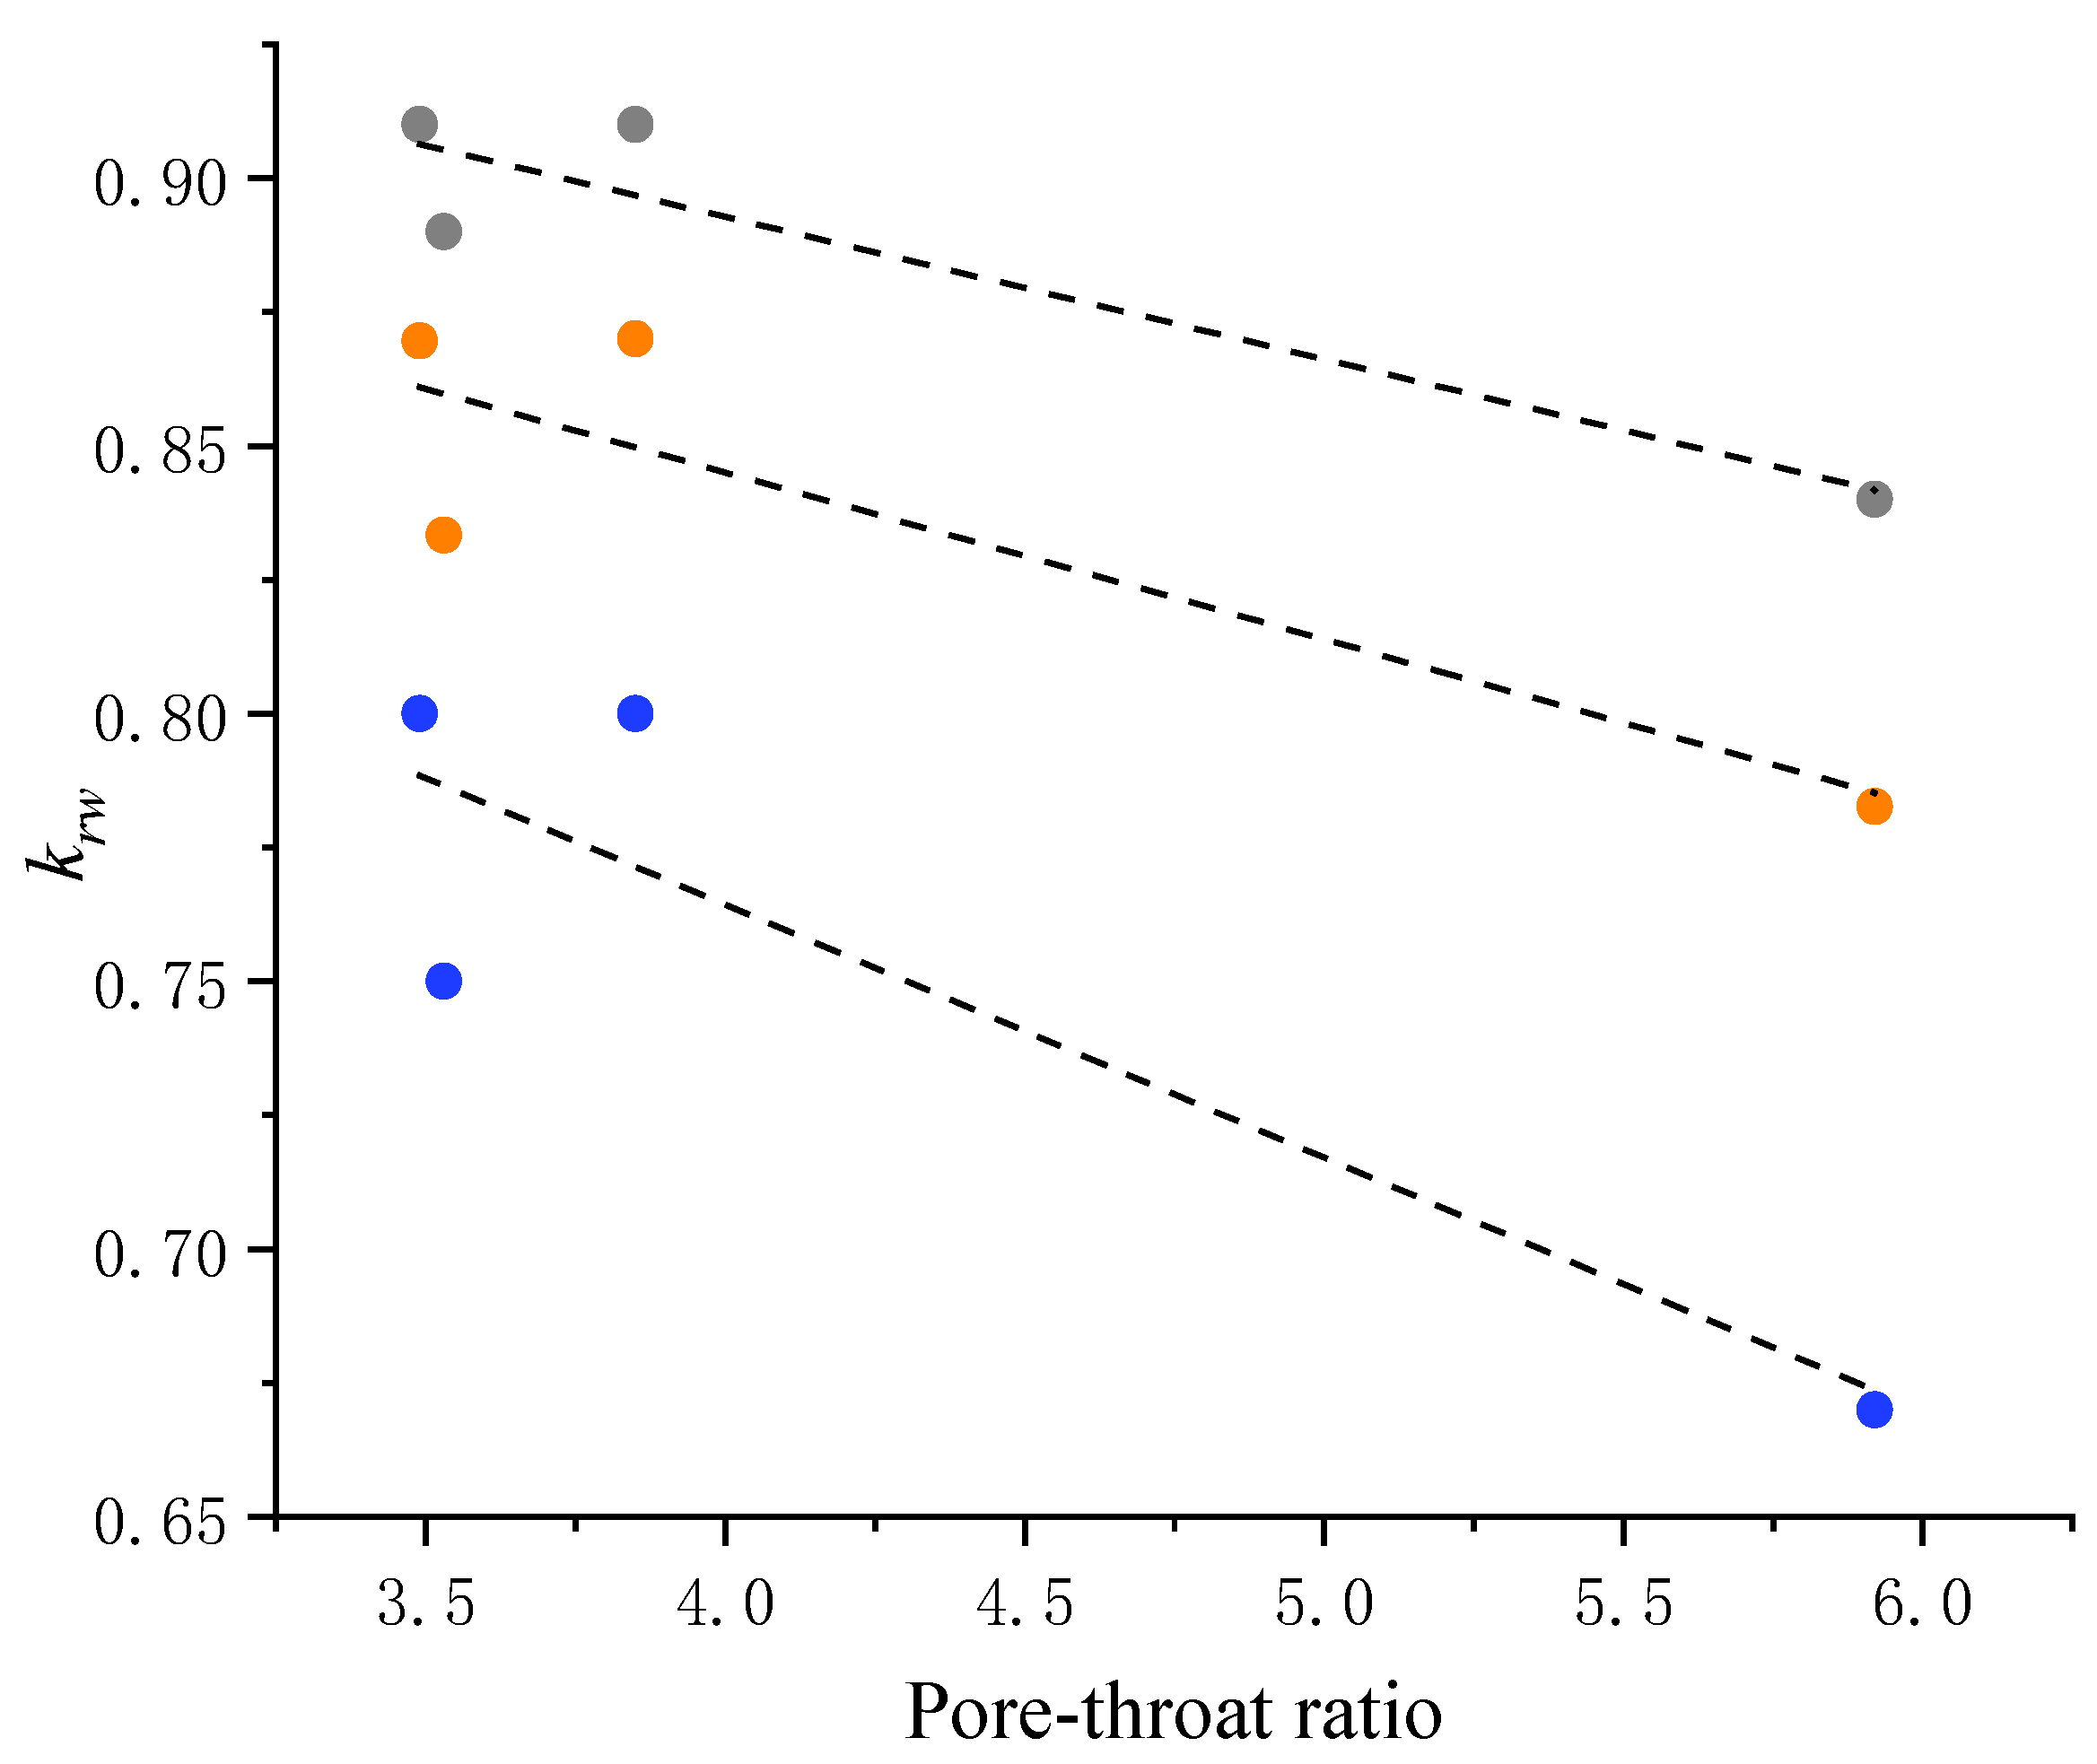
- Pore–Throat Ratio
- 3.
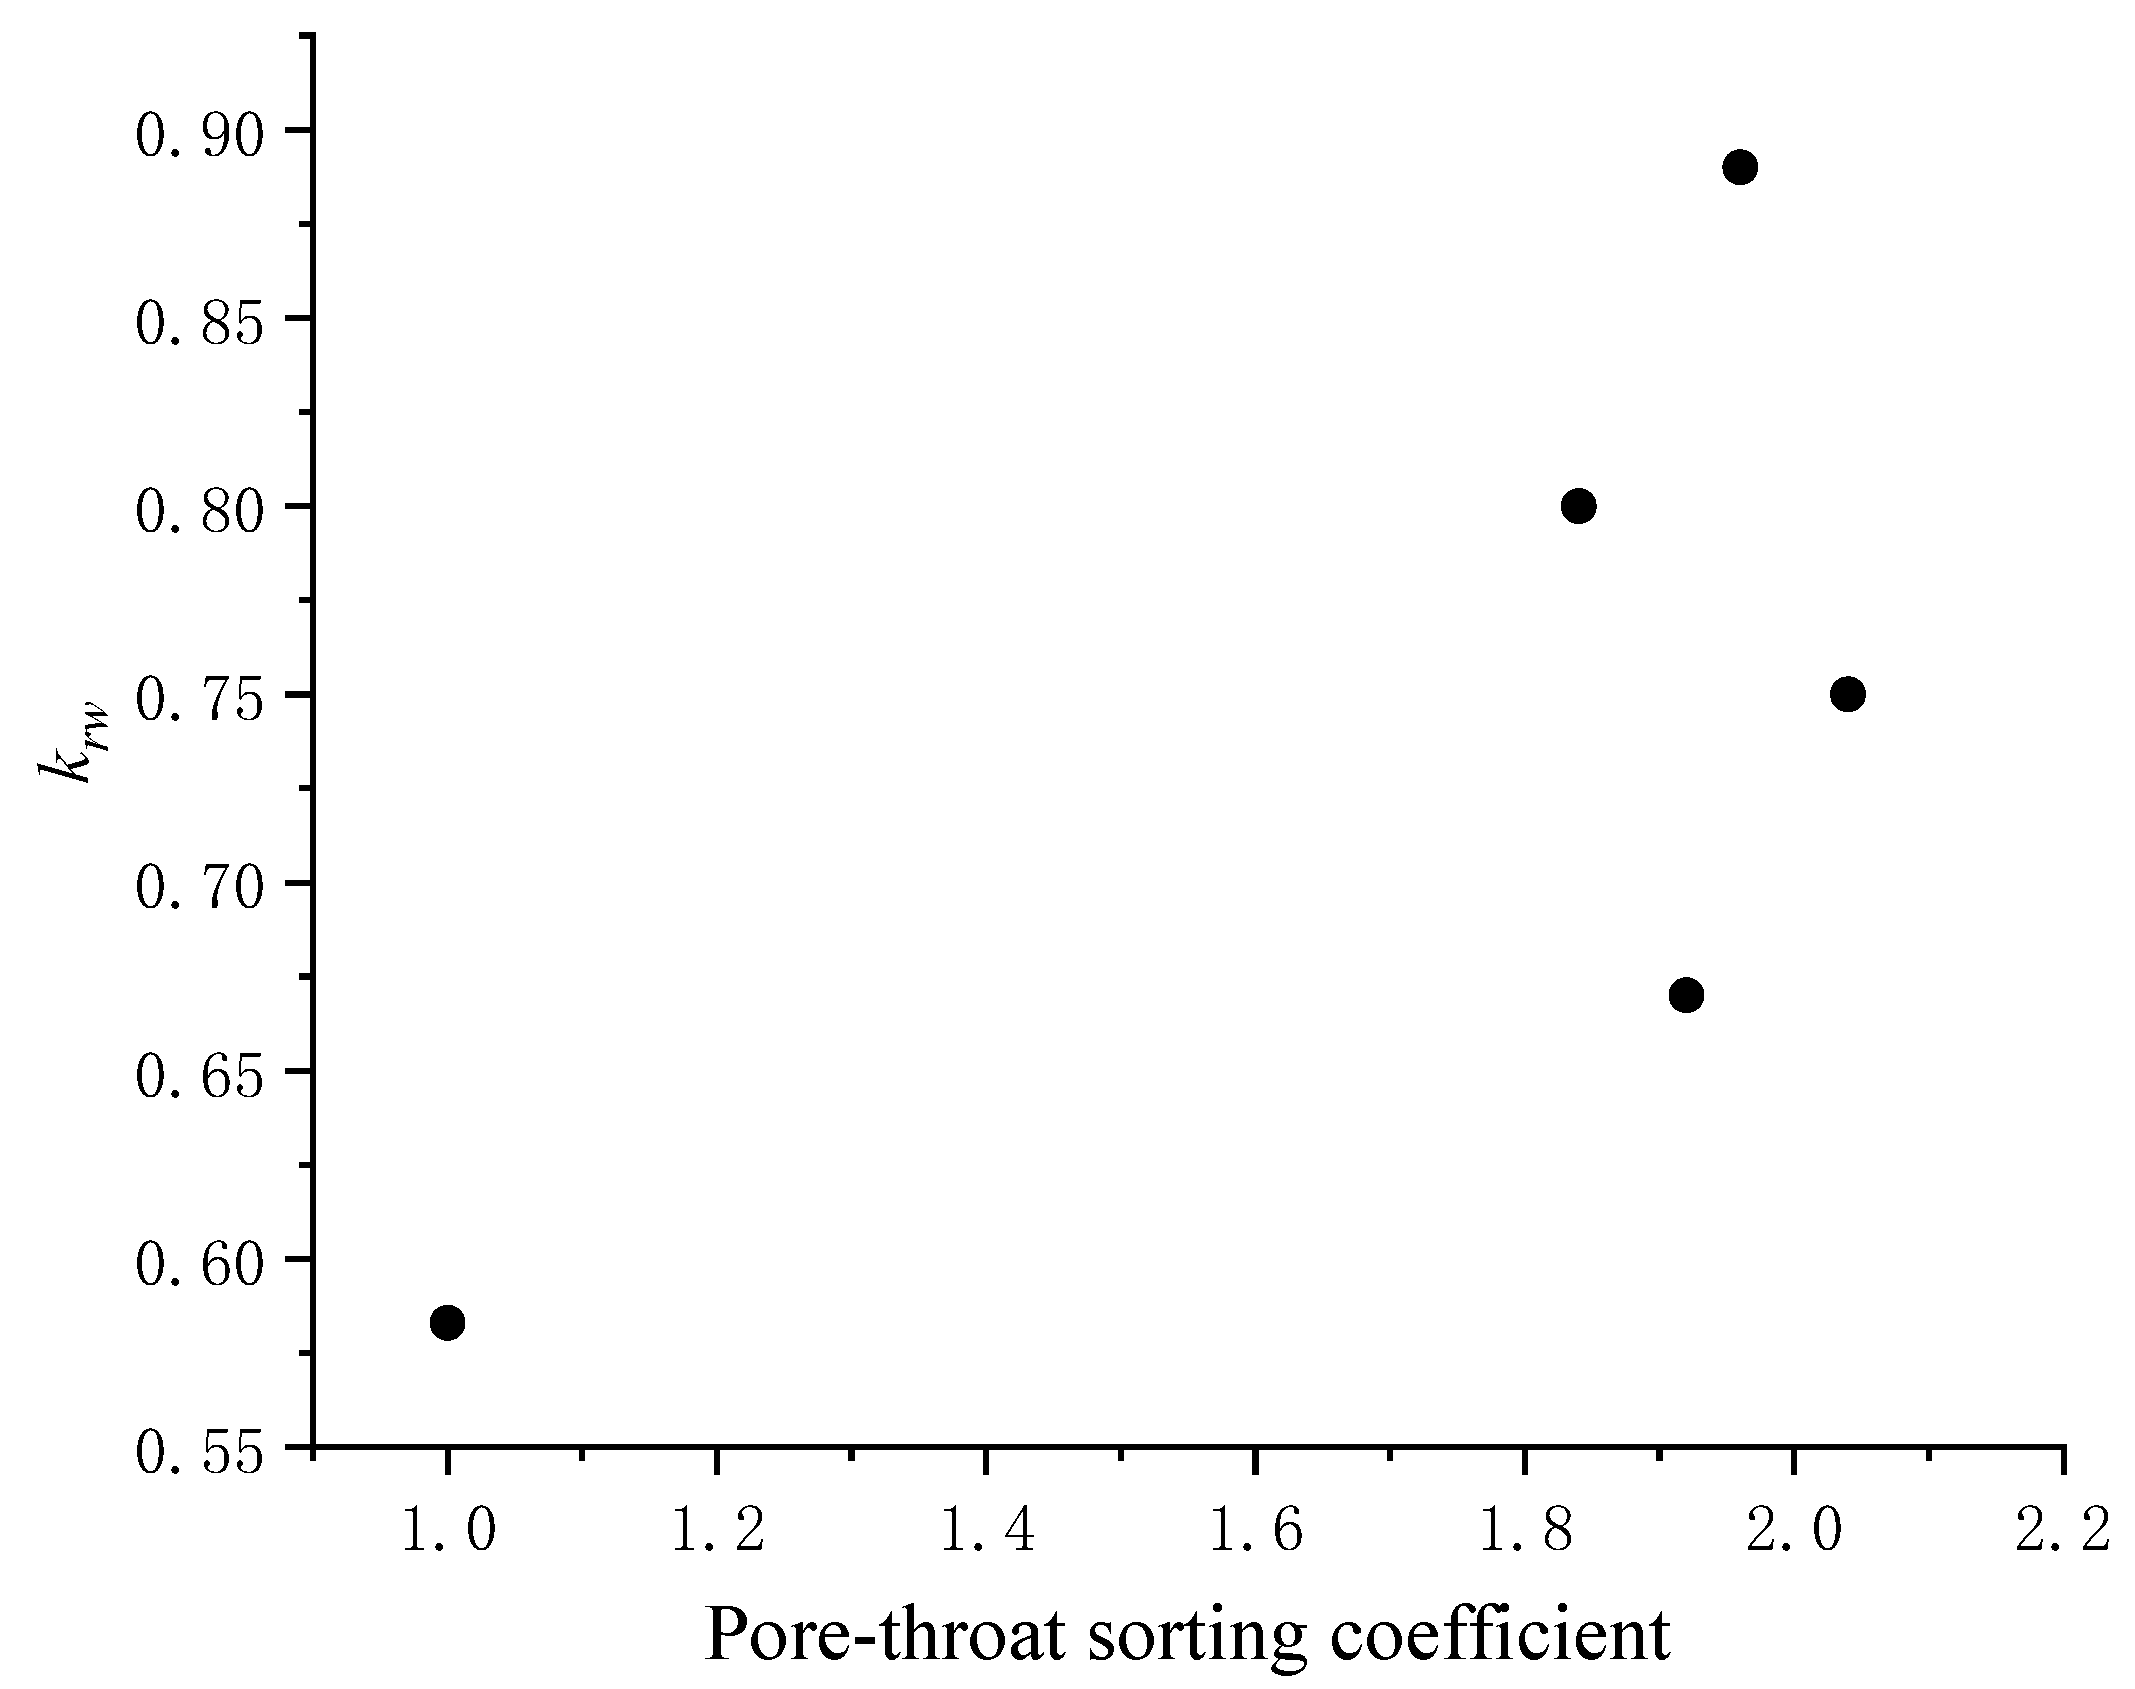
- Pore–throat sorting coefficient
3.3.2. Effect of the Gas–Liquid Ratio
4. Conclusions
Author Contributions
Funding
Data Availability Statement
Acknowledgments
Conflicts of Interest
References
- Çadraku, H.S. Groundwater quality assessment for irrigation: Case study in the Blinaja river basin. Kosovo. Civ. Eng. J. 2021, 7, 1515–1528. [Google Scholar] [CrossRef]
- Kerich, E.C. Households drinking water sources and treatment methods options in a regional irrigation scheme. J. Hum. Earth Future 2020, 1, 10–19. [Google Scholar] [CrossRef]
- Houria, B.; Mahdi, K.; Zohra, T.F. Hydrochemical characterisation of groundwater quality: Merdja plain (Tebessa town, Algeria). Civ. Eng. J. 2020, 6, 318–325. [Google Scholar] [CrossRef]
- Abedin, M.; Jose, M. Improving the Sustainability of Urban Water Management through Innovative Groundwater Recharge System (GRS). Sustainability 2022, 14, 5990. [Google Scholar]
- Epting, J.; Vinnå, L.R.; Piccolroaz, S.; Affolter, A.; Scheidler, S. Impacts of climate change on Swiss alluvial aquifers—A quantitative forecast focused on natural and artificial groundwater recharge by surface water infiltration. J. Hydrol. X 2022, 17, 100140. [Google Scholar] [CrossRef]
- Singh, A.; Panda, S.N.; Uzokwe, V.N.; Krause, P. An assessment of groundwater recharge estimation techniques for sustainable resource management. Groundw. Sustain. Dev. 2019, 9, 100218. [Google Scholar] [CrossRef]
- Du, X.; Lu, Y.; Ye, X. Advances on porous medium clogging and water quality change during artificial recharge of groundwater. J. Eng. Heilongjiang Univ. 2018, 9, 1–6. [Google Scholar]
- Lindsey, G.; Roberts, L.; Page, W. Inspection and maintenance of infiltration facilities. J. Soil Water Conserv. 1992, 47, 481–486. [Google Scholar]
- Shahbaz Akhtar, M.; Nakashima, Y.; Nishigaki, M. Clogging mechanisms and preventive measures in artificial recharge systems. J. Groundw. Sci. Eng. 2021, 9, 181–201. [Google Scholar]
- Fetzer, J.; Holzner, M.; Plotze, M.; Furrer, G. Clogging of an Alpine streambed by silt-sized particles—Insights from laboratory and field experiments. Water Res. 2017, 126, 60–69. [Google Scholar] [CrossRef]
- Hwang, C.; Choi, M.; Han, I.; Hong, J.; Kim, K. Analysis on the physical-chemical clogging possibility in the groundwater artificial recharge area. J. Geol. Soc. Korea 2021, 57, 841–853. [Google Scholar] [CrossRef]
- Baveye, P.; Vandevivere, P.; Hoyle, B.L.; DeLeo, P.C.; Sanchez de Lozada, D. Environmental impact and mechanisms of the biological clogging of saturated soils and aquifer materials. Crit. Rev. Environ. Sci. Technol. 1998, 28, 123. [Google Scholar] [CrossRef]
- Jeong, H.Y.; Jun, S.C.; Cheon, J.Y.; Park, M. A review on clogging mechanisms and managements in aquifer storage and recovery (ASR) applications. Geosci. J. 2018, 22, 667–679. [Google Scholar] [CrossRef]
- Esfahani, A.R.; Batelaan, O.; Hutson, J.L.; Fallowfield, H.J. Combined physical, chemical and biological clogging of managed aquifer recharge and the effect of biofilm on virus transport behavior: A column study. J. Water Process. Eng. 2020, 33, 101115. [Google Scholar] [CrossRef]
- Nan, T.; Shao, J.; Cui, Y. Column test-based features analysis of clogging in artificial recharge of groundwater in Beijing. J. Groundw. Sci. Eng. 2016, 4, 88–95. [Google Scholar]
- Lebon, Y.; François, C.; Navel, S.; Vallier, F.; Guillard, L.; Pinasseau, L.; Mermillod-Blondin, F. Aquifer recharge by stormwater infiltration basins: Hydrological and vadose zone characteristics control the impacts of basins on groundwater chemistry and microbiology. Sci. Total Environ. 2023, 865, 161115. [Google Scholar] [CrossRef]
- Martin, R. Clogging Issues Associated with Managed Aquifer Recharge Methods; IAH Commission on Managing Aquifer Recharge: Sydney, Australia, 2021. [Google Scholar]
- Shu, L.; Zhang, Y.; Xu, Y.; Wu, P.; Atlabachew, A.; Mabedi, E.C. Experimental studies on gas-clogging characteristics during groundwater artificial recharge. Hydrogeol. J. 2017, 28, 756–762. [Google Scholar]
- Xia, X.; Dong, L.; Zhang, A.; Qian, L.; Huang, K. Study of soil permeability considering the gas blocking. J. Chang. Univ. Nat. Sci. Ed. 2012, 1, 55–58. [Google Scholar]
- Du, L. Experimental Research on Gas Clogging in the Process of Aquifer Recharge. Master’ Thesis, University of Jinan, Jinan, China, 2017. [Google Scholar]
- Beckwith, C.W.; Baird, A.J. Effect of biogenic gas bubbles on water flow through poorly decomposed blanketpeat. Water Resour. Res. 2016, 37, 551–558. [Google Scholar] [CrossRef]
- Heilweil, V.M.; Kip Solomon, D.; Perkins, K.S.; Ellett, K.M. Gas-partitioning tracer test to quantify trapped gas during recharge. Ground Water 2004, 42, 589–600. [Google Scholar] [CrossRef]
- Fry, V.A.; Istok, J.D.; Semprini, L.; O’Reilly, K.T.; Buscheck, T.E. Retardation of dissolved oxygen due to atrapped gas phase in porous media. Ground Water 1995, 33, 391–398. [Google Scholar] [CrossRef]
- Heilweil, V.M.; Marston, T. Evaluation of Potential Gas Clogging Associated with Managed Aquifer Recharge from a Spreading Basin, Southwestern Utah, USA; IAH Commission on Managing Aquifer Recharge: Beijing, China, 2013. [Google Scholar]
- Botrel, T.; Isambourg, P. Off Setting Kill and Choke Lines Friction Losses, a New Method for Deep Water Well Control. In Proceedings of the SPE/IADC Drilling Conference, Amsterdam, The Netherlands, 27 February–1 March 2001. [Google Scholar]
- Li, D.W.; Zhang, L.H.; Zhou, K.M.; Guo, L.P. Gas-water two-phase flow mechanism in visual microscopic pore model. J. China Univ. Pet. 2008, 32, 80–83. [Google Scholar]
- Li, M.; Liu, D.; Liu, L. Study on relative permeabilities of oil and water in single micropore. J. Eng. Thermophys. 2020, 41, 668–673. [Google Scholar]
- Wu, H.; Zhang, C.L.; Ji, Y.L.; Liu, R.E.; Wu, H.; Zhang, Y.Z.; Geng, Z.; Zhang, Y.L.; Yang, J.Q. An improved method of characterizing the pore structure in tight oil reservoirs: Integrated NMR and constant–rate–controlled porosimetry data. J. Pet. Sci. Eng. 2018, 166, 778–796. [Google Scholar] [CrossRef]
- Xiao, D.; Jiang, S.; Thul, D.; Huang, W.; Lu, Z.; Lu, S. Combining rate-controlled porosimetry and NMR to probe full-range pore throat structures and their evolution features in tight sands: A case study in the Songliao Basin, China. Mar. Pet. Geol. 2017, 83, 111–123. [Google Scholar] [CrossRef]
- Xu, Y.; He, Y.; Bu, G.; Chen, L.; Liu, L.; Zhu, Y. Establishment of classification and evaluation criteria for tight reservoirs based on characteristics of microscopic pore throat structure and percolation: A case study of Chang 7 reservoir in Longdong area, Ordos Basin. Pet. Geol. Exp. 2019, 41, 51–460. [Google Scholar]


| Type of Gas Clogging | Causes | Mechanism | Mitigation Measures |
|---|---|---|---|
| Gas clogging formed by bypass flow | Capillary force and inertial force | Water reaches channels with different apertures. When capillary force is the main power, water preferentially enters channels with small apertures to form gas clogging in larger channels. When inertial force is the main power, water will preferentially enter the large channel and form gas clogging in the small channel. | Change pressure |
| Gas clogging formed in the H-shaped channel | Capillary force | Water preferentially breaks through the two relatively parallel channels and flows forward, compressing the gas in the bridge into bubbles and forming a gas clogging. | Reduce the pressure to make the gas on the “bridge” expand to the channel on one side or break the pressure balance between the two channels by increasing the pressure to make the gas on the “bridge” flow into the channel on one side. |
| Gas clogging formed at the blind end and corner of a pore | Disconnectivity of channels | No effective connecting channel. | Reduce pressure |
| Gas clogging formed by cutoff phenomenon | Jamin effect | Additional capillary resistance is produced by the Jamin effect in narrow or slender channels. | Increase the pressure and supply the energy to trapped gas |
| Model No. | Particle Size Range (mm) | Minimum Pore Throat Diameter (mm) | Maximum Pore Throat Diameter (mm) | Mean Pore Throat Diameter (mm) | Pore–Throat Sorting Coefficient |
|---|---|---|---|---|---|
| 1 | 1–2 | 0.08 | 1.11 | 0.43 | 1.84 |
| 2 | 2–3 | 0.11 | 1.07 | 0.39 | 2.04 |
| 3 | 3–4 | 0.14 | 0.97 | 0.45 | 1.96 |
| 4 | 5–8 | 0.09 | 1.00 | 0.30 | 1.92 |
Disclaimer/Publisher’s Note: The statements, opinions and data contained in all publications are solely those of the individual author(s) and contributor(s) and not of MDPI and/or the editor(s). MDPI and/or the editor(s) disclaim responsibility for any injury to people or property resulting from any ideas, methods, instructions or products referred to in the content. |
© 2023 by the authors. Licensee MDPI, Basel, Switzerland. This article is an open access article distributed under the terms and conditions of the Creative Commons Attribution (CC BY) license (https://creativecommons.org/licenses/by/4.0/).
Share and Cite
Li, X.; Yue, G.; Huang, J. Experimental Study of the Microscopic Visualization of Gas Clogging during Groundwater Recharge. Sustainability 2023, 15, 2593. https://doi.org/10.3390/su15032593
Li X, Yue G, Huang J. Experimental Study of the Microscopic Visualization of Gas Clogging during Groundwater Recharge. Sustainability. 2023; 15(3):2593. https://doi.org/10.3390/su15032593
Chicago/Turabian StyleLi, Xiaoyuan, Gaofan Yue, and Jin’ou Huang. 2023. "Experimental Study of the Microscopic Visualization of Gas Clogging during Groundwater Recharge" Sustainability 15, no. 3: 2593. https://doi.org/10.3390/su15032593