Article

A Method for Allocation of Carbon Emission Quotas to Provincial-Level Industries in China Based on DEA

1
School of Management, Hefei University of Technology, Hefei 230009, China
2
Zhejiang Economic Information Center, Hangzhou 310006, China
3
School of Accounting and Finance, Anhui Xinhua University, Hefei 230088, China
*
Authors to whom correspondence should be addressed.
Sustainability 2023, 15(3), 2632; https://doi.org/10.3390/su15032632
Submission received: 17 December 2022 / Revised: 18 January 2023 / Accepted: 30 January 2023 / Published: 1 February 2023
(This article belongs to the Special Issue Low Carbon Energy and Sustainability)

Abstract

:
At present, China implements a quota-based trading mechanism to achieve carbon emission reduction, in which the allocation of carbon emission quotas among different provinces is short of considering the influence of unbalanced provincial development. Heterogeneity among the provincial-level three major industries, namely, agriculture, manufacturing and mining, and service industries, is a case in point. To address this insufficiency, this paper proposes a novel parallel data envelopment analysis (DEA) based method for carbon emission quota allocation. The method models each province as a decision-making unit (DMU) and the provincial-level three major industries as parallel sub-decision-making units (SDMUs). A distinguished feature of the method is that it makes explicit tradeoffs between efficiency and equality considerations for policymakers in allocating the carbon quotas among three heterogeneous provincial-level major industries. The empirical results show that the proposed method effectively improves the overall provincial gross domestic product (GDP) potentials through the reallocation of carbon quotas among industries while the equality level is not worse off. This work is helpful for policymakers to achieve a long-term emission reduction target and provides suggestions for improving the initial allocation mechanism of a national carbon trading market.

1. Introduction

Global warming has become a pressing issue that needs to be addressed by all countries. To respond to the threat of climate change, it is universally agreed that greenhouse gases need to be maintained at an adequate level, which led to the successful signing of the Kyoto Protocol in December 1997. Later, 196 members of the United Nations Framework Convention on Climate Change (UNFCCC) negotiated and finally adopted the Paris Agreement at the 2015 United Nations Climate Change Conference in Paris, pledging to limit global warming to 2 °C above pre-industrial levels while pursuing more ambitious efforts to limit the rise of temperature further to 1.5 degrees and arrive at “net zero” greenhouse gas emissions worldwide in the 21st century [1].
The carbon trading market is a critical mechanism for achieving carbon emission reduction. The Kyoto Protocol permits carbon emission quotas to be traded among parties, which opens the possibility of “carbon trading” among countries under different models leading up to the birth of a carbon trading market in the European Union (EU) in 2005 [2]. The existing carbon trading market operation mechanisms fall into two categories: quota-based trading and project-based trading. The quota-based trading model is the most widely adopted one. Included in this category, for example, are the European Union Emissions Trading Scheme (EU-ETS), the Regional Greenhouse Gas Initiative (RGGI), and the Western Climate Initiative (WCI).
China introduced a quota-based national carbon market in 2011 and carried out trading pilot work in seven regions successively (i.e., Beijing, Shanghai, Tianjin, Chongqing, Hubei, Guangdong, and Shenzhen). By the end of 2021, the cumulative volume of carbon quotas traded in the national carbon market achieved 140 million tons. In addition to the development of the national carbon market, some provinces have created local carbon emission trading markets as an indispensable part of China’s carbon market. For example, Zhejiang province has established the first local carbon-inclusive market in the city of Yueqing, where both enterprises and individuals can participate in carbon trading independently [3].
The carbon emissions from China are among the highest in the world, which means China needs more efforts to reduce carbon emissions. According to statistics from British Petroleum (BP) [4], the carbon emissions of China in 2021 were 10,398 tons, far exceeding the shares of other countries. In the meantime, China has set up an ambitious national plan to actively control carbon emissions. For example, to achieve the Intended Nationally Determined Contribution (INDC) target specified in 2015 for addressing climate change, the Chinese Government Work Report proposed a binding constraint for the carbon emission intensity to decline by 18% compared with that of 2020 during the “14th Five-Year” Plan period, i.e., 2021–2025.
Allocation of carbon quotas is a fundamental issue in implementing a carbon trading mechanism [5]. The current carbon quota allocation mechanism in China is facing challenges. Presently, China allocates national carbon reduction targets on a provincial basis. However, this method has called into question the viability of allocation results. For example, the economic development of industrial provinces such as Hebei, Shanxi, and Inner Mongolia heavily depends on high energy-consuming sectors. Under the allocation method, these provinces are in huge carbon emission deficits, i.e., their actual carbon emissions are much larger than their carbon quotas. In the meantime, service industry-oriented regions such as Beijing and Shanghai, where the tertiary industry accounts for a larger share, are found in a “low emission, high quota” situation [6]. In this case, the allocation method is short of considerations of differences in regional industrial structures. It has generated large proportions of emission reductions for some regions, provinces, or municipalities, making it difficult to achieve the targets and causing pain to the economies. Therefore, it is worthwhile and necessary to study an alternative allocation method that considers differences in regional industrial structures. As regions (provinces or municipalities) are different in economic and social development, emission reduction potential varies. Taking into account differences in carbon quota allocation schemes undoubtedly reduces the bias of targets and enhances feasibility.
The differences among the three major industries (i.e., agriculture, manufacturing and mining, and service industries, hereinafter referred to as primary industry, secondary industry, and tertiary industry) in carbon quota allocation have not yet attracted attention in academia. In the literature, scholars propose that policymakers need to consider the criteria of efficiency and equality to better account for the unbalanced development among provinces. Many papers report on the allocation of provincial-level carbon quotas based on these two criteria. They show empirically that the heterogeneity arising from different sectors, regions, or industries has a significant impact on the allocation of carbon quotas [7,8,9,10]. However, they have not provided a quantitative decision tool to incorporate the impact of the uneven development of provinces and the heterogeneity among the three major industries on carbon quota allocation.
Hence, it is necessary to design a suitable mechanism to improve the provincial-level carbon quota allocation in China. In the literature, scholars tend to analyze a production process that simultaneously generates desirable and undesirable products as byproducts (e.g., pollutants) based on the joint-production theory of production economics [11,12]. In addition, as a non-parametric evaluation technique, they often apply the Data Envelopment Analysis (DEA) technique to model joint-production processes with both desirable and undesirable outputs. Some researchers have proposed DEA-based models, taking into account efficiency and equality, and used them in provincial carbon quota allocation in China [13,14]. Regarding the equality criterion, the Gini coefficient is a standard tool widely used to analyze income inequality. Many studies propose to measure the equality of carbon emissions among countries by the Gini coefficient [15,16].
Based on the current studies, in this paper, to model the differences in regional industrial structures, we propose a parallel DEA model to allocate quotas and balance efficiency and equality considerations. Regarding the equality criterion, we draw on existing studies and use the Gini coefficient as an indicator of equality for carbon quota allocation. Regarding the efficiency criterion, this paper aims to maximize the overall desirable output potentials. The parallel DEA-based allocation model can generate more efficient results since it is capable of utilizing the information on the internal structural features of decision-making units (DMUs) [17,18]. Finally, note that even though the three major industries belong to different fields and have their industry characteristics, they utilize similar input factors. Thus, the three major industries are modeled as three parallel sub-decision-making units (SDMUs).
In general, the paper aims to investigate and recommend carbon quota schemes for the three major industries at the provinciallevel in China from the perspective of efficiency and equity. The contributions of this paper are twofold: first, distinct from the previous research, this paper takes into account the differences in the structure and development of the three major industries in each province and provides a more scientific and reasonable carbon quota allocation scheme among provincial industries under the criterion of balancing efficiency and equality. Second, this paper improves the existing DEA models and constructs a parallel structured allocation model based on the DEA model that contains undesirable outputs while introducing the Gini coefficient in the model to ensure the equality of the allocation results.
The rest of this paper is as follows: Section 2 presents the related studies of carbon quota allocation based on the DEA model and the studies of evaluation and allocation based on the parallel structure DEA model. In Section 3, this paper presents a parallel structure DEA allocation model. Section 4 constructs a parallel-structured resource allocation model that balances efficiency and equality by incorporating the Gini coefficient into the model. In Section 5, we show an empirical study involving 30 provincial industrial sectors in China, which is based on the proposed model in this paper. Finally, Section 6 provides the conclusions.

2. Literature Review

2.1. Related Research on Carbon Quota Allocation Based on DEA Models

Many studies have studied the allocation issue based on a single criterion: either efficiency or equality. Gomes and Lins [19] proposed that the ZSG-DEA model is particularly suitable for equilibrium models and used it to analyze the allocation of CO2 emission rights among countries under the Kyoto Protocol. Fang et al. [20] proposed an allocation plan for the provincial carbon quota allocation of China based on the 2030 emission reduction target by improved DEA models. Yang et al. [21] used an environmental DEA model to propose that carbon quotas could be allocated through two principles: incremental efficiency improvements and emissions abatement planning. Mahdiloo et al. [22] proposed a DEA model based on the eco-efficiency values of electricity generators to analyze carbon emissions and carbon quotas.
However, when allocating carbon quotas among regions, there is also a need to consider equality of allocation in addition to efficiency. Kong et al. [23] conducted a study on the allocation of carbon quotas in various geographic regions of China based on the entropy method and DEA model. In this work, the authors introduced an environmental Gini coefficient as a measure of equality of allocation schemes. Chen et al. [9] combined the entropy method, the Super-SBM model, and the ZSG-DEA model and applied them to allocate the 2030 emission abatement target for China. From the perspectives of efficiency, equality, and equity, Zhan et al. [24] constructed a ZSG-SBM-based allocation model to obtain a reasonable scheme for the allocation of carbon quotas among provinces in China in 2019. Cheng et al. [25] considered the implied emissions of inter-provincial power transfer, combined with the DEA model and environmental Gini coefficient, and designed a dynamic carbon quota allocation model. Their model utilized four criteria: egalitarianism, historical responsibility, emission reduction capacity, and emission efficiency. Shojaei and Mokhtar [5] combined environmentally relevant DEA and equilibrium efficient frontier DEA models to integrate a carbon quota allocation scheme and a carbon quota trading scheme into a framework that effectively translates the overall reduction target into a reduction target for each country.
In addition, the differences in industrial structure and economic development among provinces cause concerns in solving the allocation issue. Scholars have studied the allocation of provincial-level carbon quotas in China from the perspective of industries and sectors. Wu et al. [26] used the DEA method to allocate carbon quotas in provincial industrial sectors of China to reduce energy intensity. Li et al. [27] allocated thermal power carbon quotas in 30 provinces in China. Gan et al. [28] integrated a fixed-cost allocation model and a zero-sum DEA model to allocate carbon quotas to the public building sector in China for 2030.
Table 1 summarizes the above research related to carbon quota allocation based on DEA models. As can be seen from Table 1, scholars have balanced equity and efficiency criteria when developing carbon quota schemes in recent years, and this paper is no exception. Next, most of the decision variables in the literature consist of energy consumption, capital stock, and population as input variables, and GDP and carbon emissions as output variables. Some scholars use CO2 as an input in their studies. However, CO2 is a by-product of the production activity, and it would be more in line with the physical production process to consider it as an undesirable product. Some scholars have broken down the emission reduction targets by sector, considering the characteristics of sectors to generate a quota allocation scheme for the sectors in each province. However, no scholars have yet considered the differences among the three major industries in each province. This paper has created a set of quota schemes for the three major industries in each province based on the total amount of carbon quotas in China as a whole, which effectively fills this gap.

2.2. Related Research on Parallel DEA Models

To address the limitations of a ‘black-box’ approach in efficiency measurement, researchers started to model a DMU considering its unique internal parallel structure. Kao [29] constructed a class of parallel structure DEA models to measure the efficiency of a system composed of independent parallel units, helping decision-makers identify inefficient parts and make subsequent improvements. On this basis, scholars continue to innovate parallel structure DEA and apply it to evaluation and improvement work in various fields. Similarly, Storto [30] proposed a more accurate measure of water use efficiency by combining Kao’s parallel structure DEA model with fixed and shared inputs and outputs. Kordrostami [17] improved the parallel model to evaluate data with shared sources and bounded intervals. Lei et al. [31] extended the parallel structure DEA model, treating the Olympic Games as a parallel system to evaluate the efficiency of each participating country. Esmaeilzadeh and Kazemi [18] extended the multi-period DEA model to evaluate the overall and specific period efficiencies of the parallel internal structures in each period. Later, some scholars introduced cross-efficiency, and on the basis of directional distance function(DDF) cross-efficiency evaluation, Lin and Tu [32] proposed a parallel structure DDF efficiency evaluation model. Gan et al. [33] proposed a two-stage parallel tandem network DEA model and applied it to the risk and other assessments in natural disasters.
In contrast to the widespread evaluation studies using the parallel DEA, few studies have applied it to the allocation of resources. Xiong et al. [34] proposed a new DEA method to allocate resources in bidirectional interactive parallel systems. Liu et al. [35] proposed a parallel DEA model considering sub-system preferences and streaming data to provide suggestions for improving the integrated environmental efficiency of the road transport industry. Ang et al. [36] further extended the two-stage DEA model with a parallel structure to propose intra-organizational and inter-organizational resource allocation schemes for two different organizational systems. Xiong et al. [37] combined cross-efficiency with parallel structure DEA to balance organizational goals and individual preferences in the resource allocation process.
Table 2 summarizes the above research related to parallel DEA models. It can be found that since the parallel structure DEA was proposed, scholars have mostly applied it to efficiency evaluation and less to resource allocation. In fact, considering the internal composition structure of decision units in the resource allocation process can effectively identify inefficient sub-units and make targeted improvements. Based on this observation, this paper applies parallel structure DEA to carbon quota allocation based on three major industries to propose a more scientific and reasonable carbon quota allocation scheme.

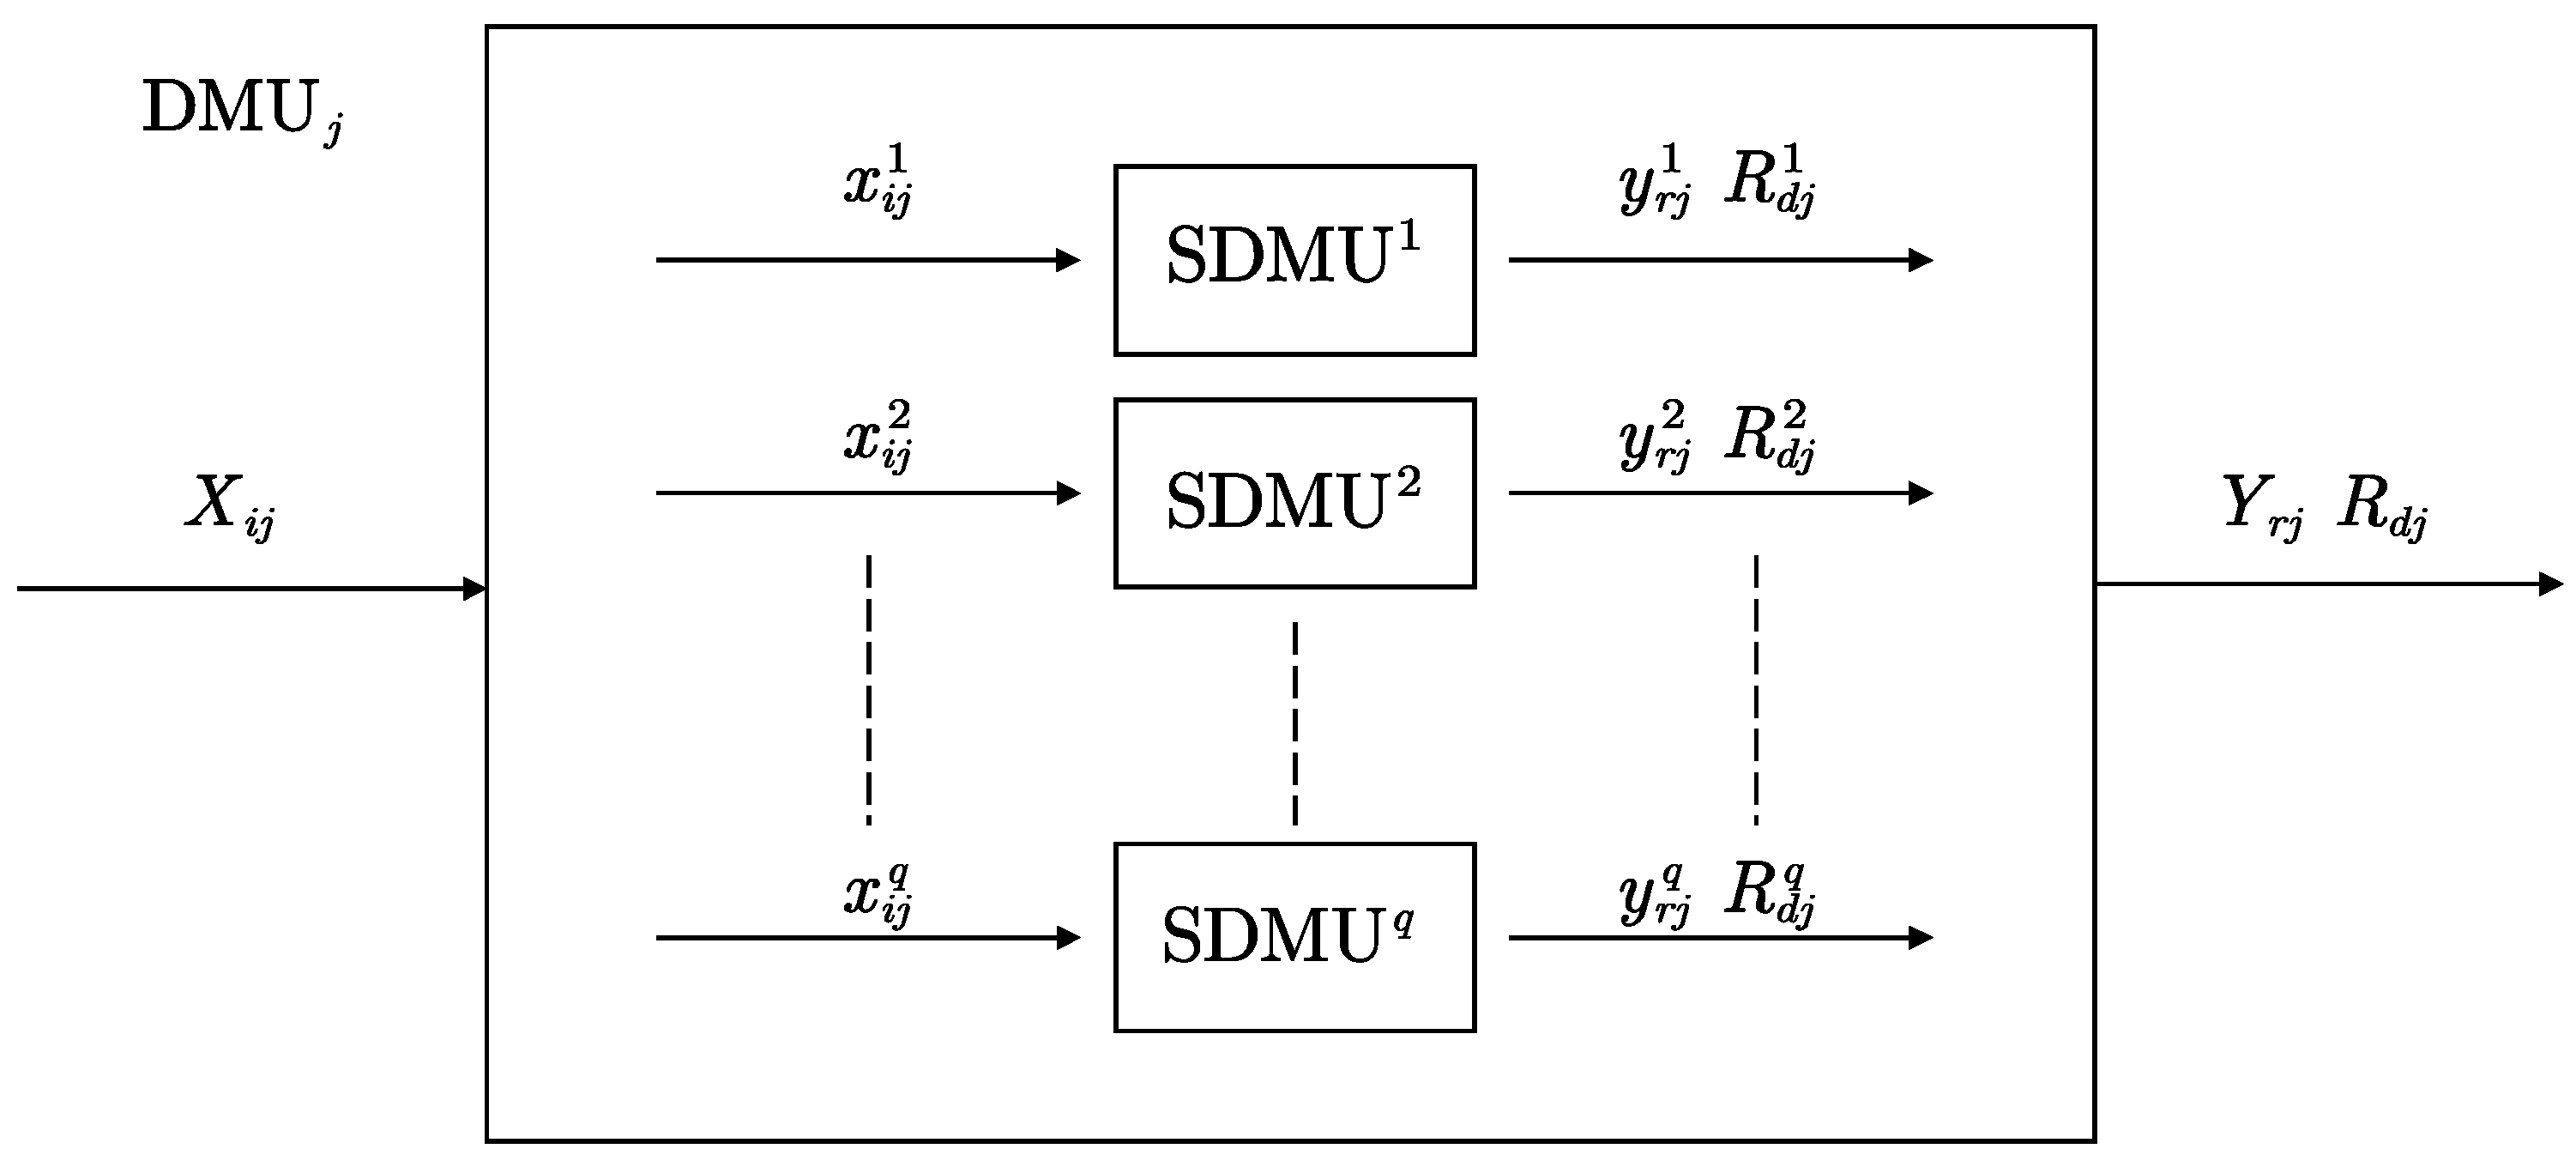
3. Parallel Structure DEA Allocation Model

Suppose there are n  DMU j ( j = 1 , , n ) , where each DMU j contains q parallel SDMU j p ( p = 1 , , q ) , and each DMU and SDMU contains m inputs, s desirable outputs, and l undesirable outputs. As shown in Figure 1, the input, desirable outputs, and undesirable output vectors of the p-th SDMU of DMU j are X i j p ( i = 1 , , m ) , Y r j p ( r = 1 , , s ) , R d j p ( d = 1 , , l ) , then X i j = p = 1 q x i j p , Y r j = p = 1 q y r j p , and R d j = p = 1 q r d j p , respectively. Let B d ( d = 1 , , l ) be the total undesirable output to be allocated, the undesirable output allocated to DMU j is b d j , and the undesirable output allocated to DMU j p within DMU j is b d j p , then B d = j = 1 n p = 1 q b d j p . Note that we only study the one desirable output and one undesirable output production system in this paper that perfectly serves our research purpose. We use the gross domestic product (GDP) as the desirable output and carbon emissions as the undesirable output, which are typical indicators documented in many studies [11,38].
The DEA models designed in this paper all satisfy the following assumptions:
(1)
Variable returns-to-scale (VRS).
(2)
Weak disposability. Reducing the undesirable outputs under the current technology will inevitably reduce the desirable outputs.
(3)
Null joint-ness. The only way to eliminate the undesirable output is to shut down production.
Combing the VRS assumption and the weak disposability and null joint-ness assumptions pose a challenge to modeling in the literature. Zhou et al. [39] proposed a new set of environmental production possibilities to achieve this purpose. In this paper, the parallel allocation model (1) is provided based on the allocation model under the VRS assumption proposed by Feng et al. [38].
max p = 1 q h = 1 n j = 1 n λ h j p y h p s . t . j = 1 n λ h j p x i j p σ h p x i h p i = 1 , , m ;   p = 1 , , q ;   h = 1 , , n j = 1 n λ h j p R j p = R h p b h p p = 1 , , q ;   h = 1 , , n h = 1 n p = 1 q b h p = B j = 1 n λ h j p = σ h p p = 1 , , q ;   h = 1 , , n λ h j p 0 p = 1 , , q ;   h = 1 , , n ;   j = 1 , , n ε σ h p 1 p = 1 , , q ;   h = 1 , , n R h p b h p 0 p = 1 , , q ;   h = 1 , , n
The subscript h denotes the evaluated unit, i.e., the h-th DMU, and λ h j p denotes the weight vector when evaluating the SDMU h p . σ h p is an adjustable variable, a positive number not greater than 1, which is a correction for the weak disposability as well as the null joint-ness. R j p b h p denotes the expected carbon emission level of SDMU h p . B denotes the overall carbon reduction level. The objective of model (1) is to maximize the overall desirable output, i.e., GDP potentials, for a certain level of carbon reduction.

4. Equality-Enhanced Parallel Resource Allocation Model

The Gini coefficient is an important measure of inequality, which has been used to capture the degree of equality in income distribution. Additionally, it has been widely applied to guide resource allocation [8,9,40]. To compute the Gini coefficient, one needs to first identify a service unit, which is the service (or goods) that need to be allocated according to an equality indicator [41,42]. For example, in this paper, we argue that a carbon emission reduction quota should be allocated according to the GDP proportion of a province in the national GDP. In this case, the carbon reduction quota serves as a service unit and the GDP as an equality unit.
Let us denote S j ( j = 1 , , n ) the service units and L j ( j = 1 , , n ) the equality units. According to Mandell [43], the Gini coefficient can be written as the following analytical formula:
G = t k > t l k S t l t S k t S t ,
where l t = L t j L j . From the above formula, it can be seen that G 0 ,   1 .
Below we introduce the Gini coefficient of carbon emissions of the three major industries as an indicator to measure the equality of carbon quota allocation to capture the equality of allocation among the three industries [44]. Specifically, the initial carbon emission of an industry in a province is taken as a service unit and the GDP of the industry in the province is taken as the equality unit before carbon quota allocation. The Gini coefficient of the initial industrial carbon emission indicates the equality of carbon emission allocation in terms of its GDP. Its analytical formula is given below.
G p = t k > t l k p R t p l t p R k p t R t p ,
where l t p = y t p j y j p denotes the proportion of provincial-industry level GDP in the national GDP of industry p. R t p , R k p indicate the carbon emissions of SDMU t p and SDMU k p before the allocation, respectively. Similarly, after the allocation of carbon emission, using the expected carbon emission level as the service unit, the industry carbon emission Gini coefficient is defined as follows:
G p = t k > t l k p R t p b t p l t p R k p b k p t R t p b t p .
To ensure that the equality of the allocation scheme after the carbon quota allocation is not inferior to the initial carbon quota scheme, it is reasonable to require that the after-allocation carbon emission Gini coefficient of the industry is less than or equal to the initial carbon emission Gini coefficient, that is, G p G p . Based on the model (1) and the Gini coefficient of industrial carbon emissions, this paper proposes the equality-enhanced parallel resource allocation model (2). The 5th constraint ensures that the equality of the allocation does not deteriorate. In this way, model (2) is able to combine the efficiency and equality criteria into a model so that the trade-offs between the two criteria can be handled effectively.
max p = 1 q h = 1 n j = 1 n λ h j p y h p s . t . j = 1 n λ h j p x i j p σ h p x i h p i = 1 , , m ;   p = 1 , , q ;   h = 1 , , n j = 1 n λ h j p R j p = R h p b h p p = 1 , , q ;   h = 1 , , n h = 1 n p = 1 q b h p = B j = 1 n λ h j p = σ h p p = 1 , , q ;   h = 1 , , n t = 1 n k > t n | l k p ( R t p b t p ) l t p ( R k p b k p ) | t = 1 n ( R t p b t p ) G p p = 1 , , q λ h j p 0 p = 1 , , q ;   h = 1 , , n ;   j = 1 , , n ε σ h p 1 p = 1 , , q ;   h = 1 , , n R h p b h p 0 p = 1 , , q ;   h = 1 , , n
To transform model (2) to a linear one, we propose the following substitutions of variables:
l k p R t p b t p l t p R k p b k p = z t k p + z t k p t = 1 , , n ;   k > t .
The model (2) can thus be transformed into the linear programming form (3).
max p = 1 q h = 1 n j = 1 n λ h j p y h p s . t . j = 1 n λ h j p x i j p σ h p x i h p i = 1 , , m ;   p = 1 , , q ;   h = 1 , , n j = 1 n λ h j p R j p = R h p b h p p = 1 , , q ;   h = 1 , , n h = 1 n p = 1 q b h p = B j = 1 n λ h j p = σ h p p = 1 , , q ;   h = 1 , , n t = 1 n k > t n ( z t k p + + z t k p ) G p t = 1 n ( R t p b t p ) p = 1 , , q l k p ( R t p b t p ) l t p ( R k p b k p ) z t k p + + z t k p = 0 p = 1 , , q ; t = 1 , , n ;   k > t λ h j p 0 p = 1 , , q ;   h = 1 , , n ;   j = 1 , , n ε σ h p 1 p = 1 , , q ;   h = 1 , , n R h p b h p 0 p = 1 , , q ;   h = 1 , , n

5. Empirical Analysis

5.1. Data Sources and Parameter Specifications

Each province is modeled as a DMU, and the three major industries in the province are considered as SDMUs. The inputs of each industry are capital stock, year-end employment, and energy consumption; the desirable output is GDP, and the undesirable output is carbon emission. Due to the availability of data, this paper collects the data of the year 2019 related to the three major industries of 30 provinces of China (excluding Tibet, Hong Kong, Macao, and Taiwan). The data sources and units of measure are provided as follows:
  • Capital stock (Unit: 100 million RMB): The data are estimated based on statistical data from Historical Information on China’s GDP Accounting 1952–2004, Statistical Yearbook of the Chinese Investment Field, Statistical Communique on National Economic and Social Development of each region, and Statistical Yearbook of each province, using Zhang’s perpetual inventory method [45]. To clarify, in this paper, the gross fixed capital formation since 2002 is selected as the total investment in fixed assets in the calculation of capital stock [46], while the total investment in fixed assets in each region after 2017 is indirectly calculated from Statistical Communique on National Economic and Social Development. The investment deflator for the three industries is adopted from the investment deflator construction method proposed by Zong and Liao [46]. The depreciation rate of fixed assets is set to 9.6%, proposed by Zhang [45]. We chose the year 2000 as the base year, and the base year capital stock of the three industries across regions is calculated by the method proposed by Li [47].
  • Year-end employment (Unit: 10,000 people): The data are extracted from the respective provincial Statistical Yearbook 2020.
  • Energy consumption (Unit: 10,000 tons of standard coal): The amount is calculated based on the comprehensive energy balances of provinces and cities from the China Energy Statistical Yearbook 2020. The 29 energy types involved in the energy consumption calculation were determined by following the guidelines of the Intergovernmental Panel on Climate Change (IPCC) [48] and the China Energy Statistical Yearbook. The conversion coefficients of each energy source were obtained from the National Bureau of Statistics of China. The industrial attribution of each sector is based on the Industrial Classification for National Economic Activities (GB/T 4754-2017) [49] and the Regulations on the Dividing Basis of Three Industries. Finally, the energy consumption of industries in each province was derived from the conversion coefficients of the 29 energy types and the conversion coefficients of each sector.
  • GDP (Unit: 100 million RMB): The data are from the respective provincial Statistical Yearbook 2020.
  • Carbon emissions (Unit: 10,000 tons): The data are calculated based on the energy consumption of provinces and cities from China Energy Statistical Yearbook 2020. Note that the calculation requires first categorizing the 29 energy sources into five major categories: coal, oil, natural gas, electricity, and heating power. Then, the product of the energy consumption of each industrial sector and the corresponding energy carbon emission factor is the carbon emission of that energy category. The emission factors of coal, oil, and natural gas can be obtained directly from the Energy Statistics Yearbook, while the carbon emission factors of electricity and heating power are calculated based on the fuel combustion in the power sector [50].
Specific data for each indicator can be found in Table A1.
Before allocating resources, the total amount of carbon quotas to be allocated needs to be determined. The actual national carbon emissions of the year 2020 are taken as the total amount of carbon quotas targets. According to the 70th edition of the World Energy Statistics Yearbook published by BP [4], the total carbon emissions from China in 2020 would be 9.786 billion tons. According to the “13th Five-Year” Plan to Control Greenhouse Gas Emissions [51], the national carbon intensity was expected to be reduced by 18% in 2020 compared with 2015. The actual result shows that this indicator eventually decreased by 18.8%, which exceeded the target.
Model (3) is applied to obtain the allocation of carbon quotas for the three major industries in 30 Chinese provinces in the year 2020. Before running the model, it is also useful to limit the allowed range of variation of carbon quotas for each SDMU. To this end, we run model (3) with different range restrictions to obtain total GDP potentials. Figure 2 reports the results.
As can be seen from Figure 2, the total GDP potentials gradually increase as the range of the carbon emission reduction ratio is broadened. However, too large a percentage of emission reductions would make the program impractical, if not infeasible. This paper finally fixes the upper and lower bounds of carbon emissions for SDMUs at [0.5, 1.5] of the initial carbon emissions.

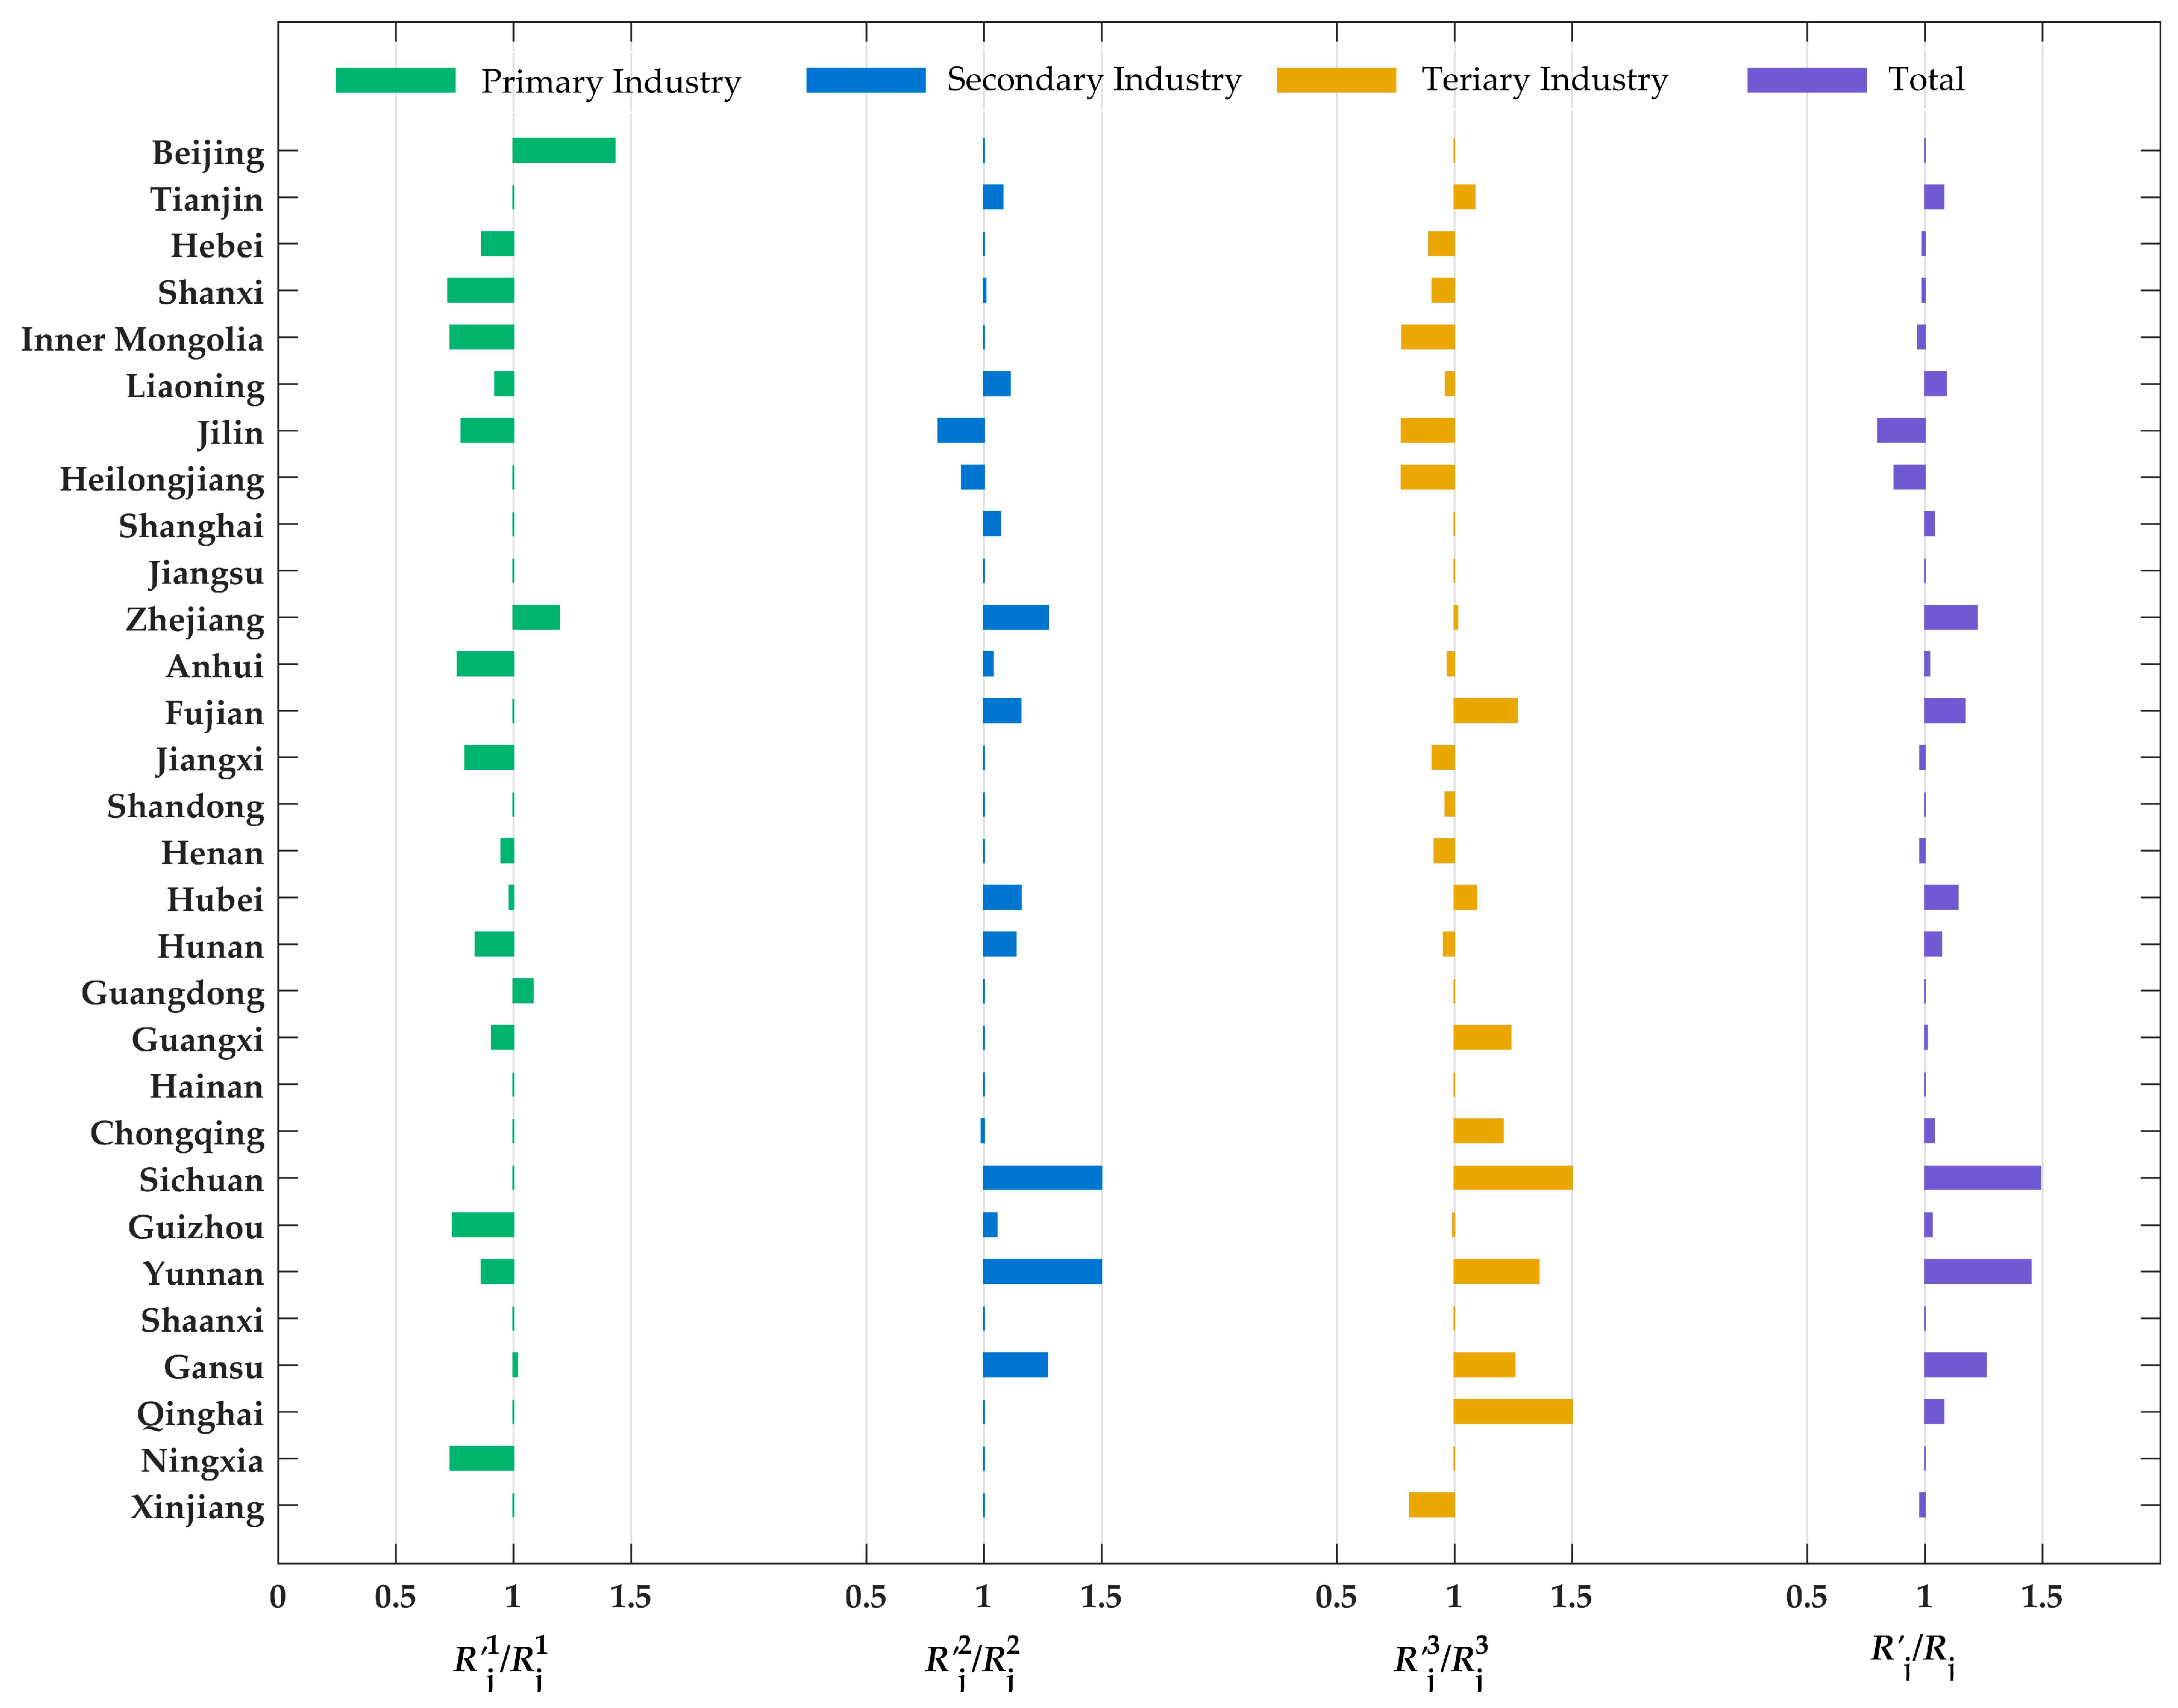
5.2. Analysis of the Results

The results show that the total GDP potential is 119.9006 trillion RMB, which is a significant increase from the actual national total GDP of 98.3635 trillion RMB in 2020. The Gini coefficients of carbon emissions for each industry after the allocation are the same as those before the allocation, and the Gini coefficient of carbon emissions among provinces decreases by 0.0233 after the carbon quota allocation. Namely, the resulting allocation result is more equal to the initial allocation scheme, as shown in Table 3.
Table 4 reports the carbon quota allocation results. In Table 4, the columns R j 1 , R j 2 , and R j 3 are allocated carbon quotas (in 10,000 tons) for the primary, secondary, and tertiary industries by region. The relative changes are shown in columns ( R j p / R j p ) and visually displayed in Figure 3. The column R j indicates the total carbon quotas by region after the allocation (in 10,000 tons) ( R j 1 + R j 2 + R j 3 ).
Table 4 and Figure 3 indicate that the resulting reductions for provinces or municipalities show different features. In the primary industry, Beijing has the largest proportion of incremental emissions, followed by Zhejiang, Guangdong, and Gansu; 14 provinces, including Ningxia and Shanxi, need to reduce emissions, with Shanxi having the largest proportion of emission reductions. In the secondary industry, only Jilin, Heilongjiang, and Chongqing need to reduce emissions, and 13 provinces, such as Sichuan and Yunnan, need to increase emissions, with Sichuan and Yunnan having the largest proportion of emissions increase. In the tertiary industry, 10 provinces, such as Qinghai and Sichuan, need to increase emissions, and Qinghai and Sichuan have the largest proportion of increased emissions; and 13 provinces, such as Tianjin and Inner Mongolia, need to reduce emissions, of which Inner Mongolia, Jilin, and Heilongjiang have the largest proportion of reductions. It should be noted that the overall allocation scheme is basically in line with the current situation of regional industrial development (for example, heavy industrial regions such as Shanxi, Inner Mongolia, and Liaoning, whose carbon quota allocation is still dominated by the secondary industry).
The total amount of carbon quotas to be allocated is higher than the total amount of carbon emissions in 2019, which is the main reason for the increases in carbon quotas for industries in the majority of regions in Figure 3. Among them, the carbon before and after the allocation of the three major industries in Jiangsu, Hainan, and Shaanxi do not change; the ratio ( R j p / R j p ) of the three major industries in Zhejiang and Gansu is greater than 1 after allocation. Put differently, they have obtained more carbon quotas and occupy a favorable position in the carbon trading market. The post-allocation ratios ( R j p / R j p ) of the remaining regions show a great variation. For example, the primary industries in Hubei and Yunnan need to reduce carbon emissions, and the secondary and tertiary industries need to increase carbon emissions to reach their optimal GDP potentials. This implies that the differences among industries have an effect on the outcome of the allocation process, which is anticipated.
It is worth noting that regional industrial carbon quota changes can be expressed in absolute and relative terms. When the initial carbon emissions quantity is large, even a small relative change to the proportion of carbon emissions can lead to a larger absolute change in quantity. In that case, it is a great challenge to implement emission reductions for regional industries. To address this issue, regional industries that are to receive fewer carbon quotas can first consider coordinating industries to better use quotas within the region; if their carbon quotas have dropped significantly from the pre-allocation level, and they fail to meet the emission reduction targets through internal coordination, they may obtain more carbon quotas through carbon trading mechanisms. For example, the increase in carbon quotas for the secondary industry in Shanxi is much smaller than the reductions in the primary and tertiary industries, and the reductions in carbon quotas for the secondary industry in Chongqing is smaller than the increase for the tertiary industry. The provinces with sufficient carbon emission quotas, such as Hubei, Sichuan, and Yunnan, can profit from carbon trading.
Since regional differences are prominent in China, many policies need to be specified at the regional level. The Development Research Center of the State Council divided China into eight comprehensive economic zones based on resources, regional development, and other factors (as shown in Table A2 [23]). Below we analyze the regional carbon quota allocation results based on this classification. The specific quota results are shown in Table 5 and Figure 4. From Table 5, it can be found that the regions with the largest total carbon quotas before and after allocation are both northern coastal regions, and the smallest total carbon quotas are both northwestern regions.
In addition, the allocation of industrial carbon quotas has the feature that the primary industry and the secondary industry are respectively allocated the lowest amount of quotas and the highest amounts of quotas in all regions. Among the primary and secondary industries, the northern coastal region obtains the highest amount of carbon quotas. This is because the Northern coastal has two large industrial provinces, Shandong and Hebei. Finally, based on the breakdown of the tertiary industry quotas, it can be seen that the eastern coastal region gets the highest amount of carbon quotas, which is due to the rapid commercial and financial development of Shanghai, Jiangsu, and Zhejiang, which have a large share of the national GDP.
Figure 5 visualizes the changes in the proportion of each regional industry before and after the allocation. From the perspective of the nation, the carbon quotas of the southern coastal, eastern coastal, Middle Yangtze River, northwestern, and southwestern regions have significantly increased, while the carbon quotas of the northern coastal, Middle Yellow River, and northeastern regions have decreased. From an industrial perspective, the carbon quotas of all regions in the secondary industry rise. The reason for this is that the secondary industry occupies the largest share of the national economy, and its corresponding carbon emissions will also rise when the overall carbon emissions rise. Secondly, the carbon quotas for the primary and tertiary industries in the northeastern, Middle Yangtze River, Middle Yellow River, and northern coastal regions shrink, which means these regions are under greater pressure to reduce carbon emissions. In contrast, the southern coastal and eastern coastal regions have a positive growth in carbon quotas for all industries, which could be due to better geographical location, along with the advantages of early opening-up policies.

6. Conclusions

From the perspectives of efficiency and equality, this paper considers CO2 as an undesirable output and proposes a parallel DEA resource allocation model considering industrial structure characteristics of regions, and conducts an empirical study on the allocation of provincial-level carbon quotas for the three major industries in China. The method provided in this study can implement carbon emission quota allocation in pursuit of maximizing macro performance. This is a useful modification to the current carbon emissions trading market in China, which is gradually expanding its coverage. The methodology we provide assesses regional carbon emission efficiencies from a more comprehensive perspective and also facilitates more scientific and precise guidance for local governments to improve carbon emission control and improve environmental sustainability. In addition, the Chinese government has clearly proposed to transit from the dual control of total energy consumption and energy intensity to the dual control of total carbon emissions and carbon intensity. This implies that the scope of inclusion of carbon emission control is expanding from trading enterprises to the whole society. The method provided in this study can be a powerful reference for formulating and decomposing carbon emission control targets by sub-region and industry.
The empirical results show that the equality of the resulting allocation scheme is the same as that of the actual carbon emissions allocation scheme, while the total GDP potentials is substantially increased compared to the initial total GDP. The results show the effectiveness and rationality of the proposed method. For example, carbon quotas in Shandong, Inner Mongolia, and other heavy industrial regions are still dominated by secondary industries. Furthermore, the resulting allocation scheme takes into account regional industrial characteristics. In addition, the carbon quotas of Jiangsu, Hainan, and Shaanxi remain unchanged before and after the allocation. In the meantime, the carbon quotas of Jilin and Heilongjiang have declined disproportionately. Particularly, carbon quota allocations for all three major industries in Jilin have declined significantly after allocation, indicating that it will face greater pressure in the future to purchase carbon quotas from provinces other than emission reduction provinces, while Zhejiang and Gansu obtain more carbon quotas after the allocation and can sell on their carbon quotas. From the regional allocation results, the southern coastal and eastern coastal regions have received more carbon quotas, and government departments will have a more flexible capacity in formulating emission reduction policies for the relevant regions. The Middle Yellow River and northeast regions have seen a disproportionate decline in carbon quotas and face greater pressure to reduce emissions than other regions with lower carbon quotas for a single industry.
According to the above empirical results, four policy implications are proposed:
  • The Gini coefficient for carbon emissions in both primary and tertiary industries was less than 0.3 before the allocation was made, making the allocation scheme relatively equal. The Gini coefficient for carbon emissions in the secondary industry is 0.3835, which is a reasonable allocation scheme, but there is still a large gap from the levels of other industries. Policymakers should further improve the equality level of carbon quota allocation schemes between provinces, which will make it more reasonable for provinces to set carbon quota schemes within industries.
  • Due to the disproportionate emission abatement among and within provinces for the three major industries after carbon quota allocation, the allocation scheme can be implemented through carbon quota trading between provinces. Therefore, policymakers need to provide policies for industry emission reductions and accelerate the establishment and improvement of provincial and municipal carbon trading markets.
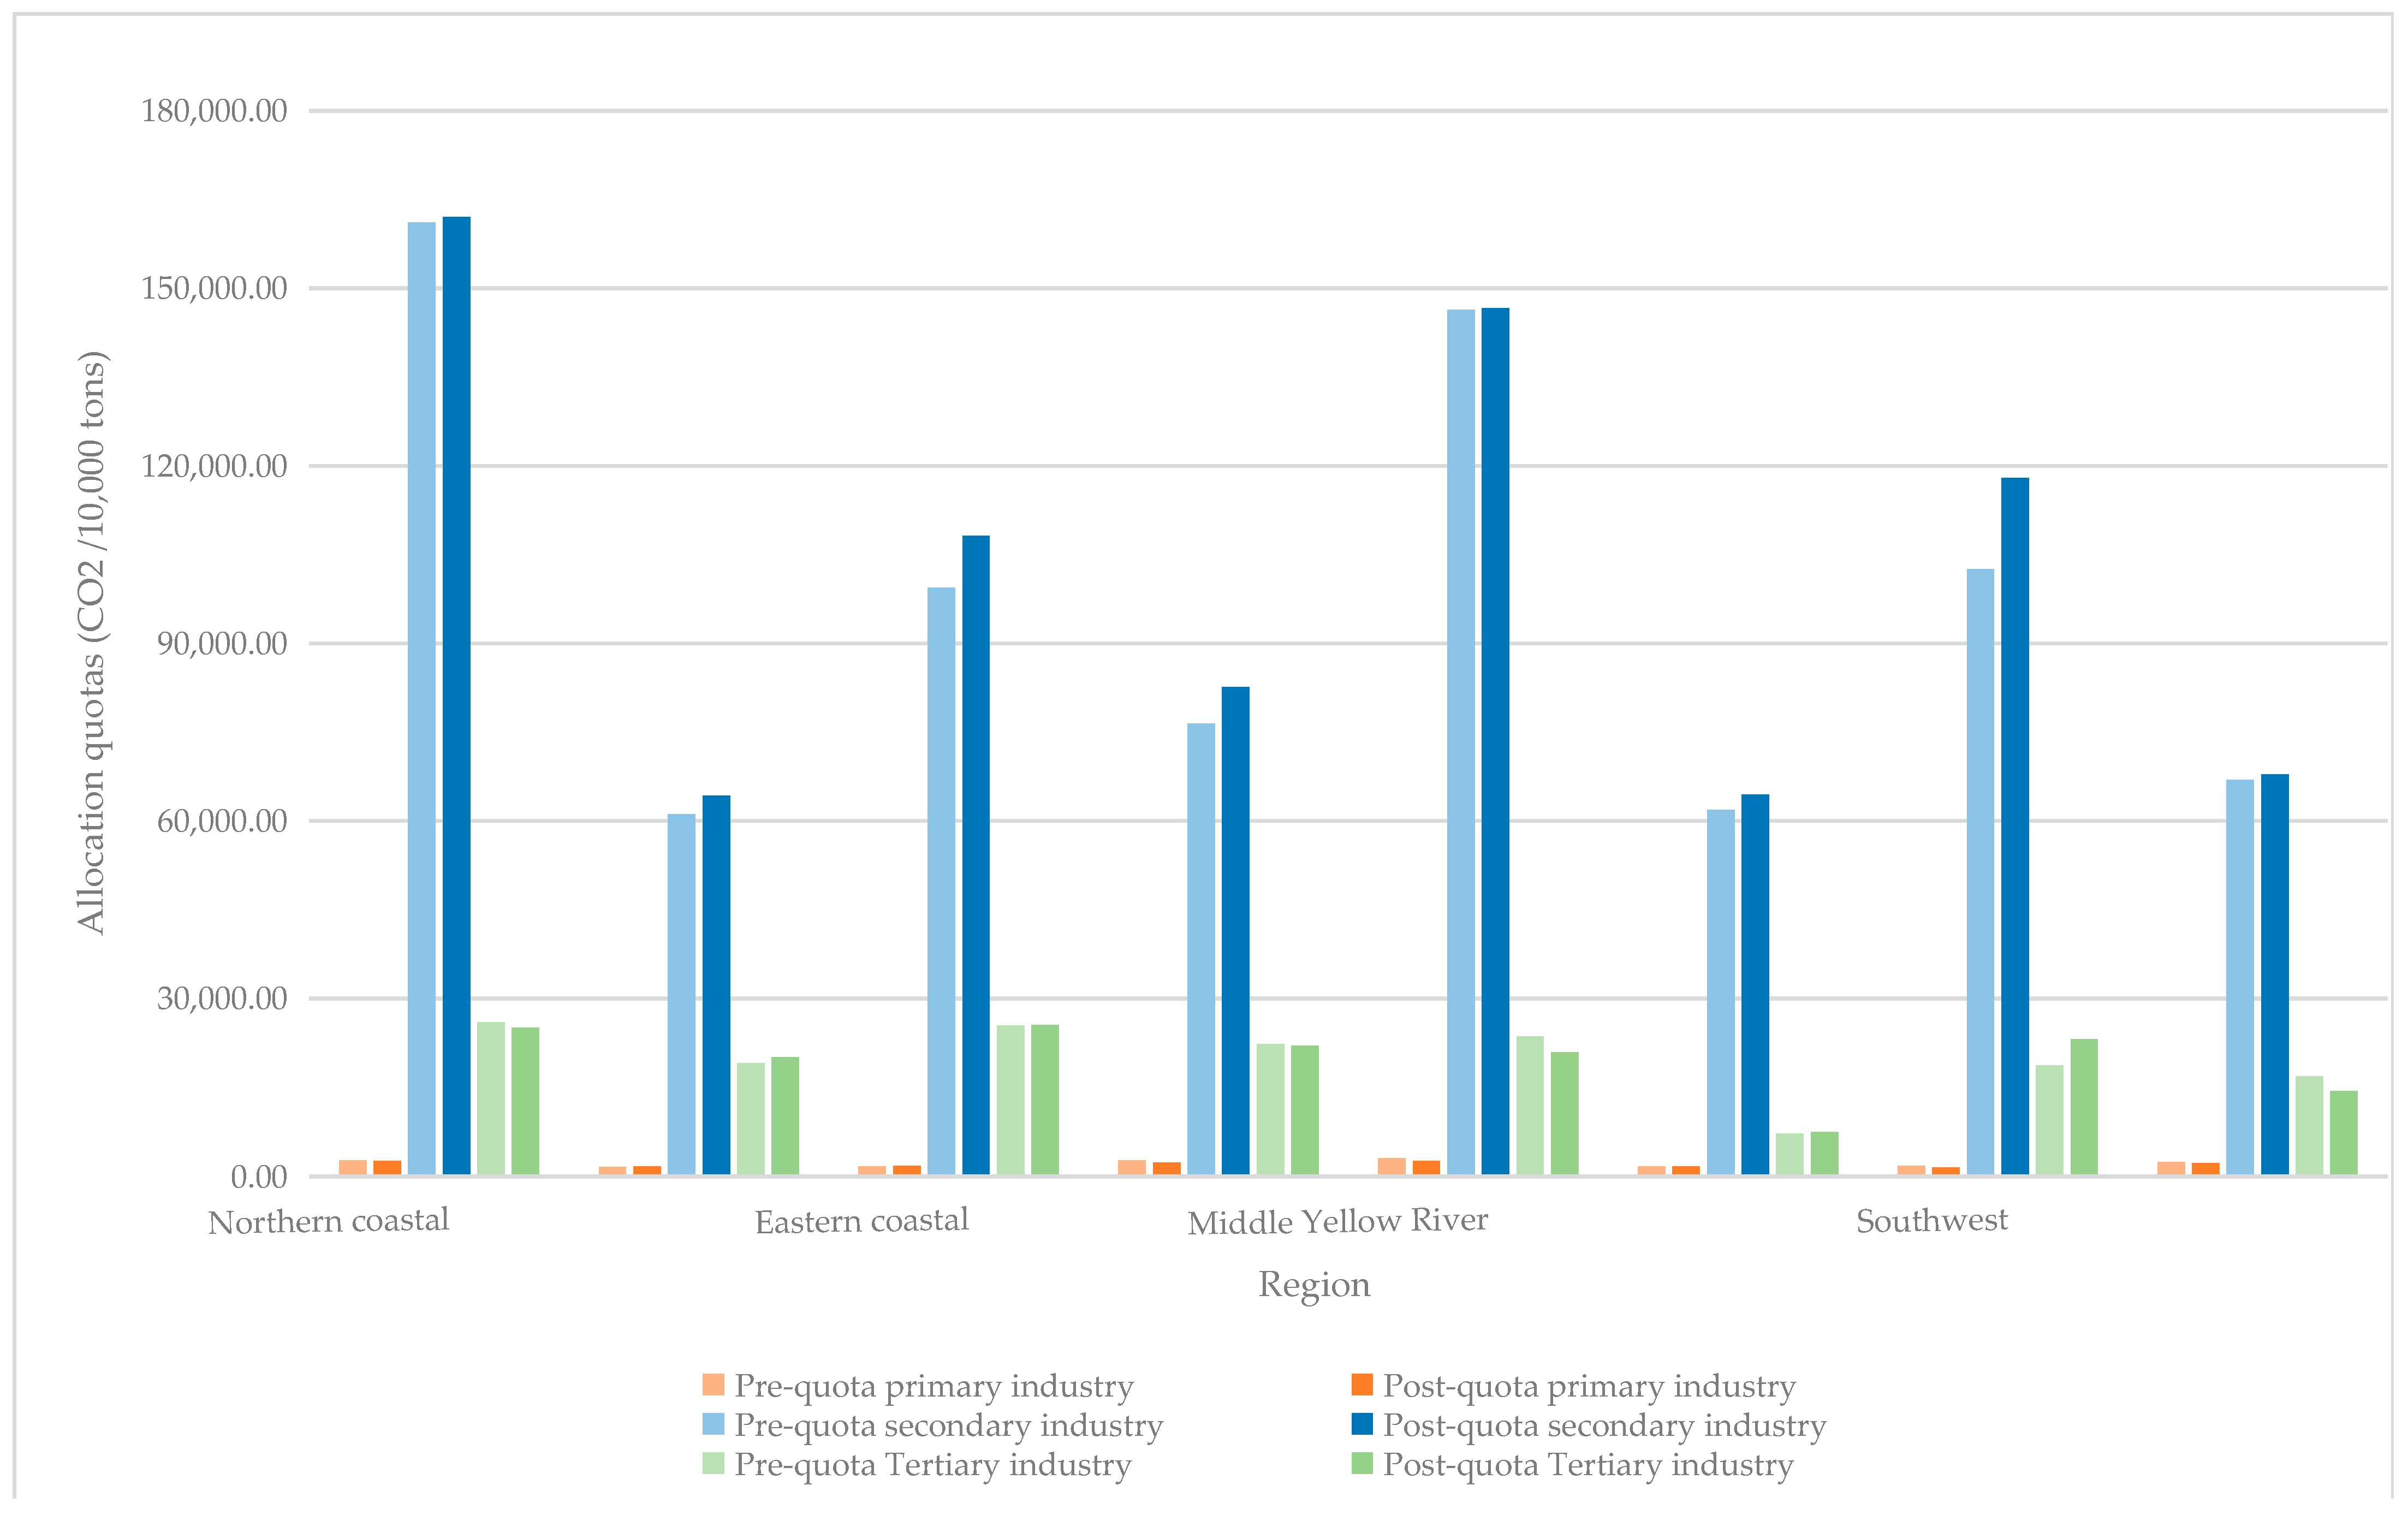
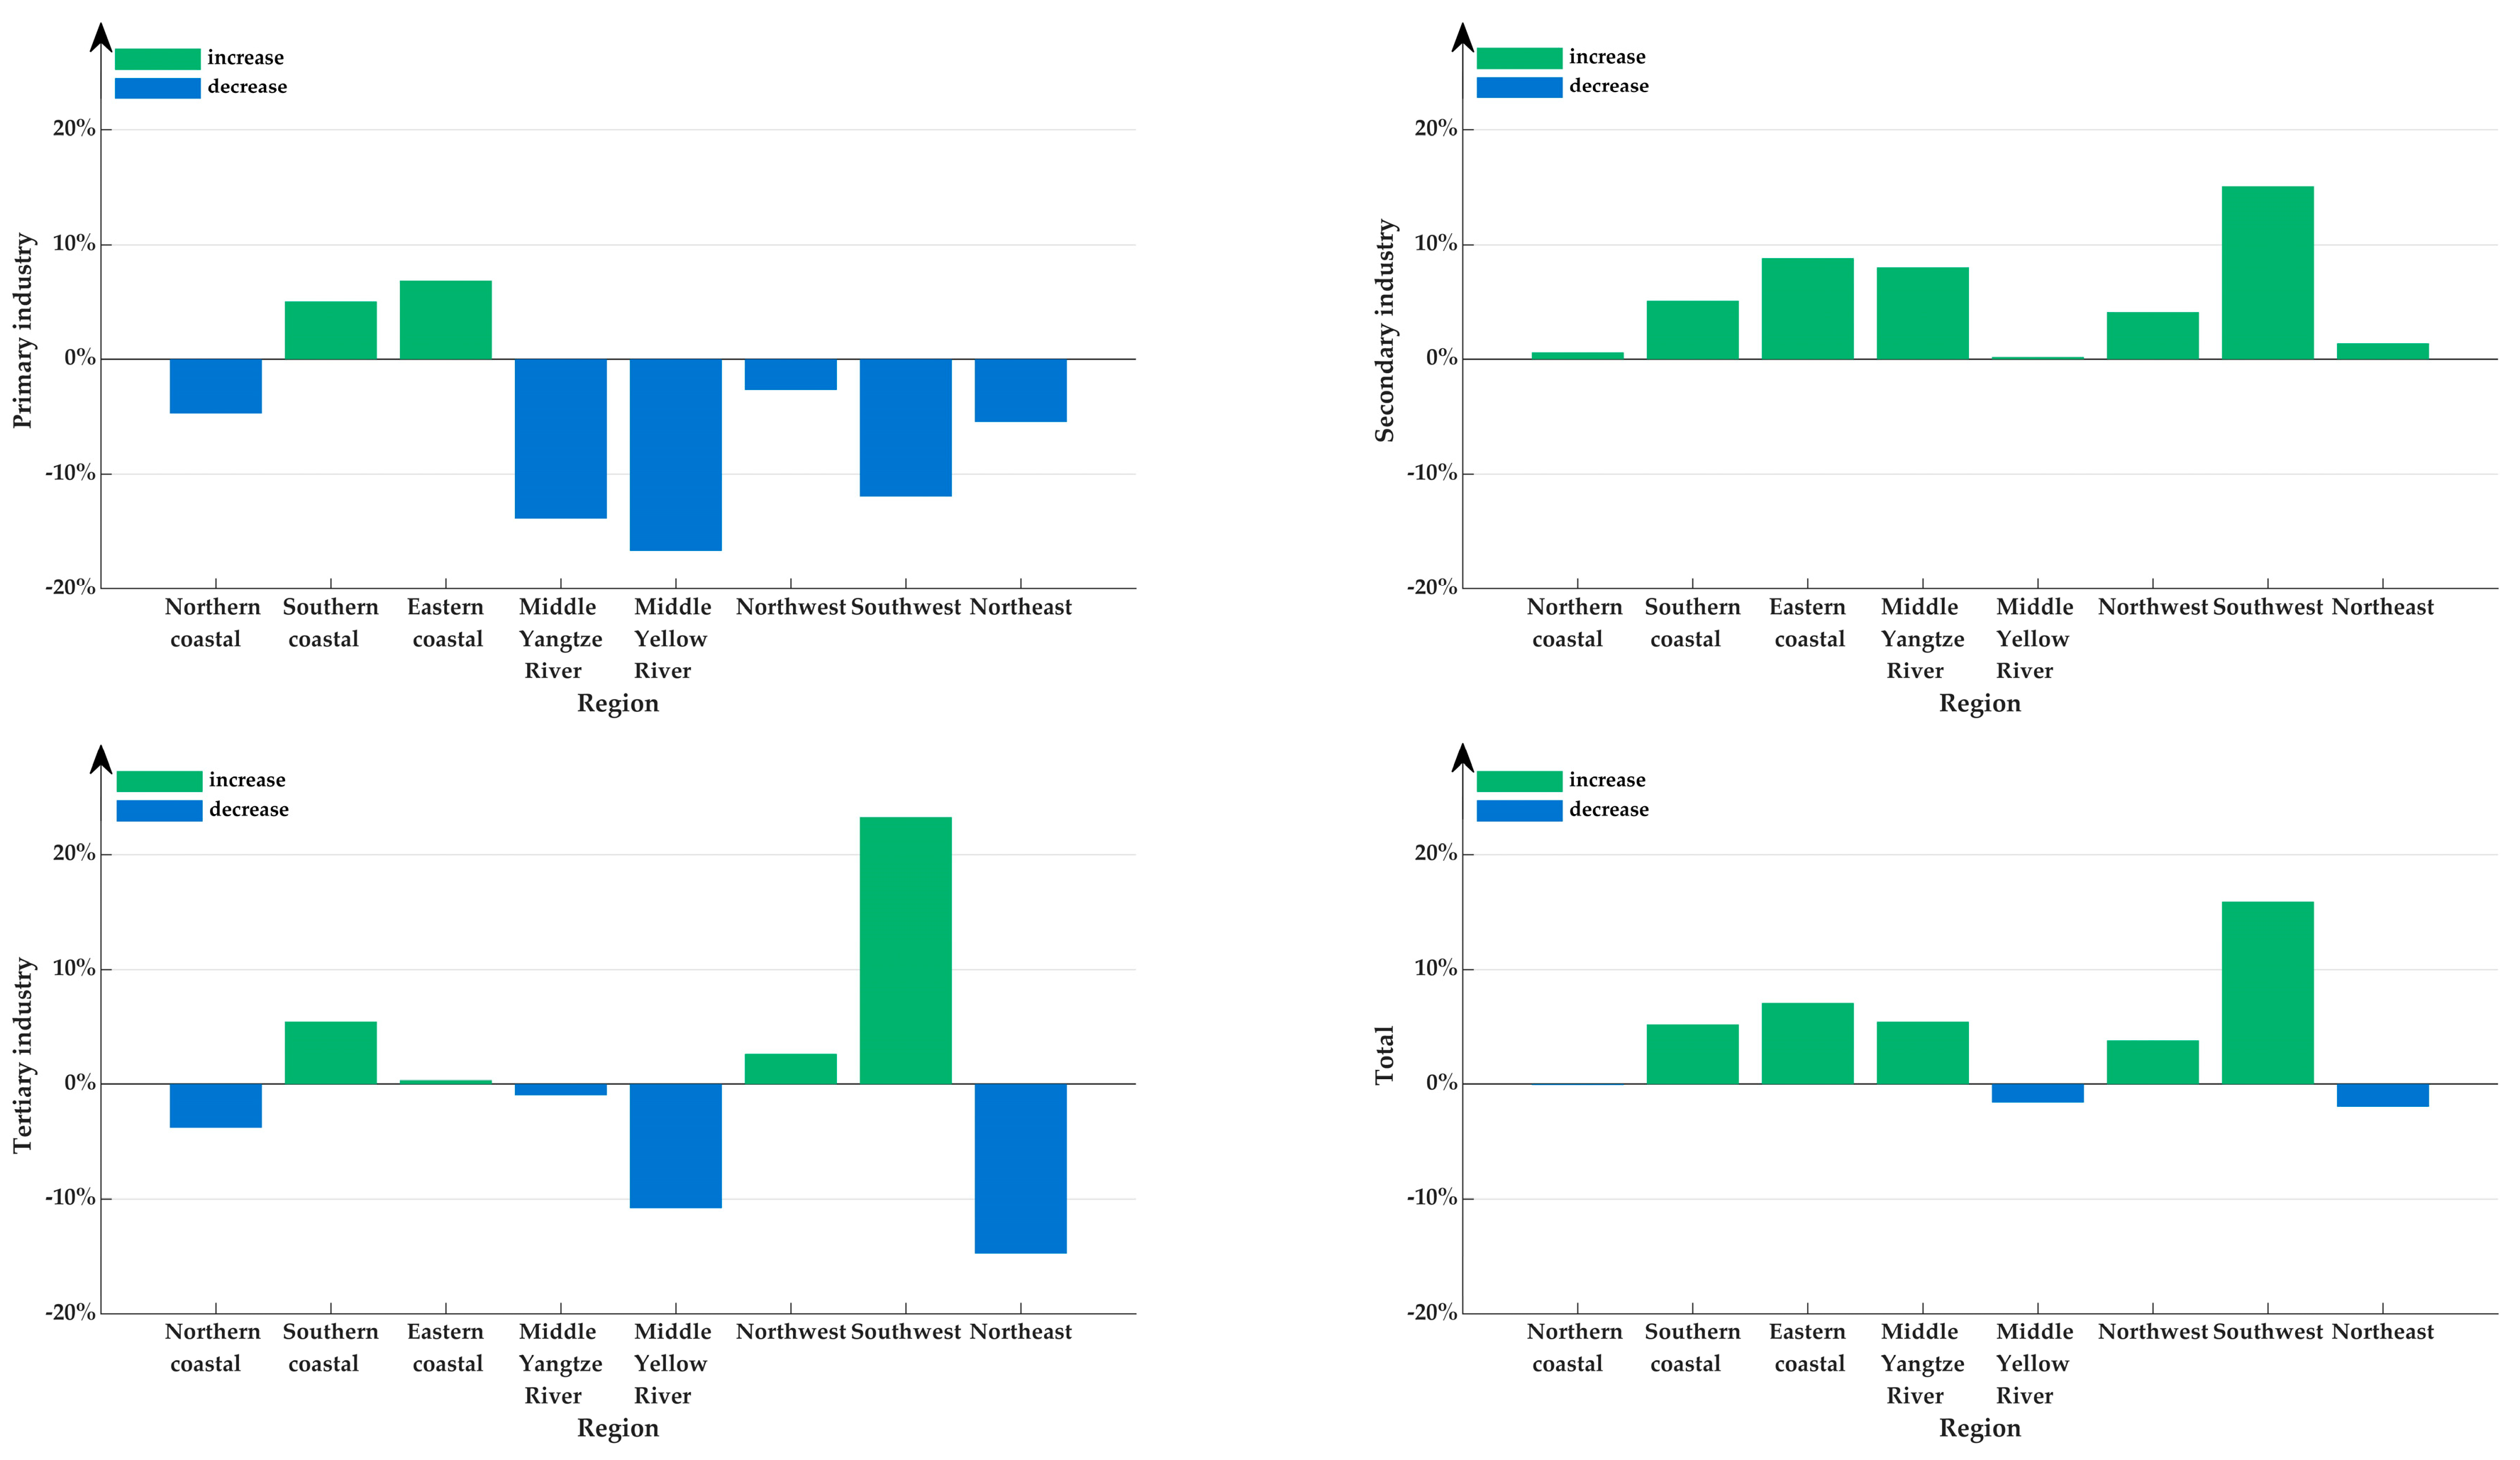
  • Judging from the regional allocation results, the southern coastal and eastern coastal regions have the same trend of industrial carbon quota changes. By contrast, the changes in the rest of the regional industrial carbon quota changes are mixed. Therefore, if policymakers are to fully consider industrial factors when formulating regional carbon emission reductions and trading policies, our work suggests establishing a regional carbon trading market in the mixed region first.
  • The centralized parallel resource allocation model proposed in this paper is applicable to any situation that has a by-product resource allocation in a parallel state. An example is the allocation of carbon quotas for regional enterprises.
One limitation of this paper is that the equality of the allocation among provinces is not considered in the process of conducting the allocation of carbon quotas among the three major industries at the provincial-level in China. In addition, for future research directions, this paper will consider the impact of equity criteria other than the Gini coefficient on the allocation scheme among SDMUs. Meanwhile, for any carbon quota allocation scheme, how to effectively promote the carbon quotas market and improve the trading mechanism is also a subsequent research direction.

Author Contributions

Conceptualization, C.F.; methodology, software, formal analysis, writing—original draft preparation and writing—review and editing, C.F. and R.Z.; data curation, validation, R.Z.; investigation and resources, C.F., J.D., X.X. and M.P.; funding acquisition, super-vision, C.F. and J.D. All authors have read and agreed to the published version of the manuscript.

Funding

This research was supported by the National Natural Science Foundation of China (71971072; 71771074; 72188101; 71971074).

Institutional Review Board Statement

Not applicable.

Informed Consent Statement

Not applicable.

Data Availability Statement

The data that support the findings of this study are available upon request to the corresponding author.

Conflicts of Interest

The authors declare no conflict of interest.

Appendix A

Table A1. Specific data for the selected indicators.
IndustryDMUCapital Stock
(100 Million RMB)
Year-End Employment
(10,000 People)
Energy Consumption
(10,000 Tons of Standard Coal)
GDP
(100 Million RMB)
Carbon Emissions
(10,000 Tons)
Primary
industry
Beijing323.4042.4055.24113.6966.22
Tianjin938.2358.2888.86185.23197.11
Hebei4084.021331.15491.733518.441186.49
Shanxi2423.45666.70284.67824.72743.83
Inner
Mongolia
2734.12556.80354.961863.19981.01
Liaoning968.75619.43290.672177.77631.36
Jilin1628.23466.20152.711287.32378.70
Heilongjiang2139.59564.10591.783182.451410.22
Shanghai45.4140.8041.16103.8884.43
Jiangsu943.61734.51506.604296.281035.46
Zhejiang849.03406.83352.232097.38609.39
Anhui1847.831346.90219.902915.70480.87
Fujian2223.87548.85208.392596.23371.96
Jiangxi1339.34700.80127.182057.56288.98
Shandong2952.411652.60593.265116.441315.58
Henan5471.542277.00461.624635.401020.05
Hubei1991.661164.00385.943809.09750.89
Hunan2547.641409.24482.563646.951201.66
Guangdong1333.431300.61553.664351.261006.37
Guangxi2112.271388.00187.023387.74318.01
Hainan122.85586.1298.601080.36269.50
Chongqing1607.42451.0684.281551.42175.67
Sichuan2243.661716.00229.224807.24353.63
Guizhou1437.161074.91200.892280.56466.35
Yunnan2132.481394.83249.533037.62482.66
Shaanxi345.04787.00176.441990.93385.54
Gansu3056.46820.80201.001050.48342.23
Qinghai1151.28105.4018.62301.9024.03
Ningxia257.28148.1071.38279.93195.40
Xinjiang333.79484.47462.941781.751188.75
Secondary industryBeijing952.54172.501580.325715.062267.74
Tianjin25,792.49272.555211.094969.1811,986.47
Hebei62,275.081390.7926,324.6213,597.2668,542.18
Shanxi15,846.41396.2013,455.757453.0937,598.43
Inner
Mongolia
29,490.71209.3018,643.846818.8855,674.47
Liaoning31,860.75702.3016,365.099531.2441,176.28
Jilin33,379.44302.304361.344134.8212,444.33
Heilongjiang15,416.11306.805028.463615.2113,362.38
Shanghai10,023.36335.675910.9910,299.1613,124.44
Jiangsu122,170.382011.9623,511.1244,270.5157,531.02
Zhejiang46,904.761764.2714,586.8426,566.6028,782.79
Anhui51,712.111261.008993.7815,337.9023,300.02
Fujian46,728.42909.659505.9620,581.7420,043.12
Jiangxi36,912.06867.306257.0610,939.8317,535.92
Shandong110,415.252116.7031,515.2328,310.9278,277.87
Henan66,301.251919.0012,991.9723,605.7934,005.57
Hubei52,501.13841.009570.1619,098.6219,360.87
Hunan42,405.87810.047294.8914,946.9816,298.45
Guangdong61,762.012471.6219,156.0943,546.4338,158.48
Guangxi23,448.31492.0020,749.687077.4351,485.34
Hainan2211.97223.181209.501099.032923.80
Chongqing26,747.95434.064745.999496.8410,378.17
Sichuan39,316.511334.7011,205.8417,365.3317,497.41
Guizhou9762.50376.074840.016058.4510,696.94
Yunnan15,193.68426.807691.577961.5812,485.36
Shaanxi1627.87330.007932.4211,980.7519,069.25
Gansu21,560.75233.704836.172862.429500.40
Qinghai10,015.4567.342989.381159.753525.22
Ningxia5457.1663.506212.281584.7217,060.94
Xinjiang5628.07187.2312,639.314795.5031,797.70
Tertiary
industry
Beijing3845.401058.103709.7329,542.535327.54
Tianjin14,267.74565.731305.528949.872734.29
Hebei64,126.011460.523311.0517,988.827617.26
Shanxi24,430.66839.602078.668748.874934.46
Inner
Mongolia
29,532.47564.902365.048530.466408.66
Liaoning32,789.991152.033415.7113,200.446971.17
Jilin27,067.56687.901365.436304.683763.80
Heilongjiang23,487.59905.902419.366815.036203.85
Shanghai6831.78999.734388.8427,752.288740.16
Jiangsu74,062.871998.734928.8651,064.7310,012.72
Zhejiang33,741.371704.013753.5933,687.766703.15
Anhui43,444.861776.102248.4318,860.384816.71
Fujian29,792.691322.762309.7719,217.033921.21
Jiangxi39,892.461063.801783.0711,760.114137.22
Shandong86,292.232218.604900.9637,640.1710,351.40
Henan76,920.302365.003508.9126,018.017850.82
Hubei40,491.861543.003812.6222,920.606558.39
Hunan34,773.711447.203481.2521,158.196839.82
Guangdong39,301.273378.027590.2759,773.3813,409.46
Guangxi30,664.27973.001733.3810,771.972946.38
Hainan1461.2069.54657.003129.541791.42
Chongqing18,231.52819.421734.9112,557.513143.89
Sichuan30,459.091838.303332.5224,443.254030.67
Guizhou11,228.78598.422770.728430.335761.27
Yunnan12,421.511168.752162.7312,224.552944.92
Shaanxi1582.38948.002119.7711,821.494377.22
Gansu22,054.19495.001153.904805.401987.67
Qinghai11,561.99157.46513.071504.30725.24
Ningxia4879.75173.70403.431883.831003.21
Xinjiang6096.11658.421457.587019.863585.35
Table A2. China regional distribution.
RegionProvince
Northern coastalBeijing, Tianjin, Hebei, Shandong
Southern coastalFujian, Guangdong, Hainan
Eastern coastalShanghai, Jiangsu, Zhejiang
Middle Yangtze RiverAnhui, Jiangxi, Hubei, Hunan
Middle Yellow RiverShanxi, Inner Mongolia, Henan, Shaanxi
NorthwestGansu, Qinghai, Ningxia, Xinjiang
SouthwestGuangxi, Chongqing, Sichuan, Guizhou, Yunnan
NortheastLiaoning, Jilin, Heilongjiang

References

  1. Adoption of the Paris Agreement; Report No.FCCC/CP/2015/L.9/Rev.1; UNFCCC: Bonn, Germany, 2015.
  2. Development of EU ETS (2005–2020). Available online: https://climate.ec.europa.eu/eu-action/eu-emissions-trading-system-eu-ets/development-eu-ets-2005-2020_en (accessed on 17 December 2022).
  3. Zheng, H.; Liu, S. The First Local Carbon Market in the Yangtze River Delta Was Tried out in Yueqing, and the First Batch of 37 Carbon Assets Were Traded on Site, Totaling More Than 10,000 Tons. Available online: http://www.yueqing.gov.cn/art/2021/9/18/art_1322069_59171764.html (accessed on 11 October 2022).
  4. CO2 Emissions from Fuel Combustion. Available online: https://yearbook.enerdata.net/co2/emissions-co2-data-from-fuel-combustion.html (accessed on 6 January 2023).
  5. Shojaei, T.; Mokhtar, A. Carbon Mitigation by Quota Allocation. J. Environ. Manag. 2022, 304, 114097. [Google Scholar] [CrossRef] [PubMed]
  6. Tian, Y.; Lin, Z. Provincial Distribution of China’s Carbon Emission Rights and Assessment of Its Emission Reduction Potential under the Paris Agreement. J. Nat. Resour. 2021, 36, 921–933. [Google Scholar] [CrossRef]
  7. Dong, F.; Long, R.; Yu, B.; Wang, Y.; Li, J.; Wang, Y.; Dai, Y.; Yang, Q.; Chen, H. How Can China Allocate CO2 Reduction Targets at the Provincial Level Considering Both Equity and Efficiency? Evidence from Its Copenhagen Accord Pledge. Resour. Conserv. Recycl. 2018, 130, 31–43. [Google Scholar] [CrossRef]
  8. Yang, B.; Li, X.; Su, Y.; Liu, C.; Xue, F. Carbon Quota Allocation at the Provincial Level in China under Principles of Equity and Efficiency. Carbon Manag. 2020, 11, 11–23. [Google Scholar] [CrossRef]
  9. Chen, F.; Zhao, T.; Xia, H.; Cui, X.; Li, Z. Allocation of Carbon Emission Quotas in Chinese Provinces Based on Super-SBM Model and ZSG-DEA Model. Clean Technol. Environ. Policy 2021, 23, 2285–2301. [Google Scholar] [CrossRef]
  10. Chen, Y.; Wang, M.; Feng, C.; Zhou, H.; Wang, K. Total Factor Energy Efficiency in Chinese Manufacturing Industry under Industry and Regional Heterogeneities. Resour. Conserv. Recycl. 2021, 168, 105255. [Google Scholar] [CrossRef]
  11. Feng, C.; Chu, F.; Ding, J.; Bi, G.; Liang, L. Carbon Emissions Abatement (CEA) Allocation and Compensation Schemes Based on DEA. Omega 2015, 53, 78–89. [Google Scholar] [CrossRef]
  12. Baumgärtner, S.; Dyckhoff, H.; Faber, M.; Proops, J.; Schiller, J. The Concept of Joint Production and Ecological Economics. Ecol. Econ. 2001, 36, 365–372. [Google Scholar] [CrossRef]
  13. Wen, L.; Zhang, E. Regional Allocation of Carbon Emissions in China Based on Zero Sum Gains Data Envelopment Analysis Model. Environ. Eng. Res. 2016, 21, 91–98. [Google Scholar] [CrossRef]
  14. Li, F.; Emrouznejad, A.; Yang, G.; Li, Y. Carbon Emission Abatement Quota Allocation in Chinese Manufacturing Industries: An Integrated Cooperative Game Data Envelopment Analysis Approach. J. Oper. Res. Soc. 2020, 71, 1259–1288. [Google Scholar] [CrossRef] [Green Version]
  15. Groot, L. Carbon Lorenz Curves. Resour. Energy Econ. 2010, 32, 45–64. [Google Scholar] [CrossRef]
  16. Jorgenson, A.; Schor, J.; Huang, X. Income Inequality and Carbon Emissions in the United States: A State-Level Analysis, 1997–2012. Ecol. Econ. 2017, 134, 40–48. [Google Scholar] [CrossRef]
  17. Kordrostami, S. Efficiency Decomposition in Parallel Production Systems with Shared Sources on Interval Data: An Illustration of Iranian Banks. Int. J. Biomath. 2014, 7, 1450059. [Google Scholar] [CrossRef]
  18. Esmaeilzadeh, A.; Kazemi Matin, R. Multi-Period Efficiency Measurement of Network Production Systems. Measurement 2019, 134, 835–844. [Google Scholar] [CrossRef]
  19. Gomes, E.G.; Lins, M.P.E. Modelling Undesirable Outputs with Zero Sum Gains Data Envelopment Analysis Models. J. Oper. Res. Soc. 2008, 59, 616–623. [Google Scholar] [CrossRef]
  20. Fang, K.; Zhang, Q.; Long, Y.; Yoshida, Y.; Sun, L.; Zhang, H.; Dou, Y.; Li, S. How Can China Achieve Its Intended Nationally Determined Contributions by 2030? A Multi-Criteria Allocation of China’s Carbon Emission Allowance. Appl. Energy 2019, 241, 380–389. [Google Scholar] [CrossRef]
  21. Yang, M.; An, Q.; Ding, T.; Yin, P.; Liang, L. Carbon Emission Allocation in China Based on Gradually Efficiency Improvement and Emission Reduction Planning Principle. Ann. Oper. Res. 2019, 278, 123–139. [Google Scholar] [CrossRef]
  22. Mahdiloo, M.; Ngwenyama, O.; Scheepers, R.; Tamaddoni, A. Managing Emissions Allowances of Electricity Producers to Maximize CO2 Abatement: DEA Models for Analyzing Emissions and Allocating Emissions Allowances. Int. J. Prod. Econ. 2018, 205, 244–255. [Google Scholar] [CrossRef]
  23. Kong, Y.; Zhao, T.; Yuan, R.; Chen, C. Allocation of Carbon Emission Quotas in Chinese Provinces Based on Equality and Efficiency Principles. J. Clean. Prod. 2019, 211, 222–232. [Google Scholar] [CrossRef]
  24. Zhan, D. Allocation of Carbon Emission Quotas among Provinces in China: Efficiency, Fairness and Balanced Allocation. Environ. Sci. Pollut. Res. 2022, 29, 21692–21704. [Google Scholar] [CrossRef]
  25. Cheng, Y.; Gu, B.; Tan, X.; Yan, H.; Sheng, Y. Allocation of Provincial Carbon Emission Allowances under China’s 2030 Carbon Peak Target: A Dynamic Multi-Criteria Decision Analysis Method. Sci. Total Environ. 2022, 837, 155798. [Google Scholar] [CrossRef] [PubMed]
  26. Wu, J.; Zhu, Q.; Liang, L. CO2 Emissions and Energy Intensity Reduction Allocation over Provincial Industrial Sectors in China. Appl. Energy 2016, 166, 282–291. [Google Scholar] [CrossRef]
  27. Li, R.; Tang, B. Initial Carbon Quota Allocation Methods of Power Sectors: A China Case Study. Nat. Hazards 2016, 84, 1075–1089. [Google Scholar] [CrossRef]
  28. Gan, L.; Ren, H.; Cai, W.; Wu, K.; Liu, Y.; Liu, Y. Allocation of Carbon Emission Quotas for China’s Provincial Public Buildings Based on Principles of Equity and Efficiency. Build. Environ. 2022, 216, 108994. [Google Scholar] [CrossRef]
  29. Kao, C. Efficiency Measurement for Parallel Production Systems. Eur. J. Oper. Res. 2009, 196, 1107–1112. [Google Scholar] [CrossRef]
  30. lo Storto, C. Measuring the Efficiency of the Urban Integrated Water Service by Parallel Network DEA: The Case of Italy. J. Clean. Prod. 2020, 276, 123170. [Google Scholar] [CrossRef]
  31. Lei, X.; Li, Y.; Xie, Q.; Liang, L. Measuring Olympics Achievements Based on a Parallel DEA Approach. Ann. Oper. Res. 2015, 226, 379–396. [Google Scholar] [CrossRef]
  32. Lin, R.; Tu, C. Cross-Efficiency Evaluation and Decomposition with Directional Distance Function in Series and Parallel Systems. Expert Syst. Appl. 2021, 177, 114933. [Google Scholar] [CrossRef]
  33. Gan, L.; Wang, L.; Hu, Z.; Lev, B.; Gang, J.; Lan, H. Do Geologic Hazards Affect the Sustainability of Rural Development? Evidence from Rural Areas in China. J. Clean. Prod. 2022, 339, 130693. [Google Scholar] [CrossRef]
  34. Xiong, B.; Wu, J.; An, Q.; Chu, J.; Liang, L. Resource Allocation of a Parallel System with Interaction Consideration Using a DEA Approach: An Application to Chinese Input–Output Table. INFOR Inf. Syst. Oper. Res. 2018, 56, 298–316. [Google Scholar] [CrossRef]
  35. Liu, H.; Yang, R.; Wang, Y.; Zhu, Q. Measuring Performance of Road Transportation Industry in China in Terms of Integrated Environmental Efficiency in View of Streaming Data. Sci. Total Environ. 2020, 727, 138675. [Google Scholar] [CrossRef] [PubMed]
  36. Ang, S.; Liu, P.; Yang, F. Intra-Organizational and Inter-Organizational Resource Allocation in Two-Stage Network Systems. Omega 2020, 91, 102009. [Google Scholar] [CrossRef]
  37. Xiong, X.; Yang, G.; Zhou, D.; Wang, Z. How to Allocate Multi-Period Research Resources? Centralized Resource Allocation for Public Universities in China Using a Parallel DEA-Based Approach. Socio-Econ. Plan. Sci. 2022, 82, 101317. [Google Scholar] [CrossRef]
  38. Feng, C.; Ying, S.; Xiao, X.; Ding, J.; Liang, L. Study of Allocation and Compensation of Regional Carbon Emission Right in Zhejiang Province. J. Syst. Eng. 2020, 35, 577–587. [Google Scholar]
  39. Zhou, P.; Ang, B.W.; Poh, K.L. Measuring Environmental Performance under Different Environmental DEA Technologies. Energy Econ. 2008, 30, 1–14. [Google Scholar] [CrossRef]
  40. Fang, G.; Liu, M.; Tian, L.; Fu, M.; Zhang, Y. Optimization Analysis of Carbon Emission Rights Allocation Based on Energy Justice—The Case of China. J. Clean. Prod. 2018, 202, 748–758. [Google Scholar] [CrossRef]
  41. Berne, R.; Stiefel, L. The Measurement of Equity in School Finance: Conceptual, Methodological, and Empirical Dimensions; Johns Hopkins University Press: Baltimore, MD, USA, 1984; ISBN 978-0-8018-3148-5. [Google Scholar]
  42. Coulter, P.B. Measuring the Inequity of Urban Public Services Methodological Discussion with Applications. Policy Stud. J. 1980, 8, 683–698. [Google Scholar] [CrossRef]
  43. Mandell, M.B. Modelling Effectiveness-Equity Trade-Offs in Public Service Delivery Systems. Manag. Sci. 1991, 37, 467–482. [Google Scholar] [CrossRef]
  44. Wu, G.; Liu, J.; Yang, L. Dynamic Evolution of China’s Agricultural Carbon Emission Intensity and Carbon Offset Potential. China Popul. Resour. Environ. 2021, 31, 69–78. [Google Scholar]
  45. Zhang, J.; Wu, G.; Zhang, J. The Estimation of China’ s Provincial Capital Stock: 1952–2000. Econ. Res. J. 2004, 10, 35–44. [Google Scholar]
  46. Zong, Z.; Liao, Z. Estimates of Fixed Capital Stock by Sector and Region: 1978–2011. J. Guizhou Univ. Financ. Econ. 2014, 3, 8–16. [Google Scholar]
  47. Li, R. The Calculation of China’s Capital Stock of Three Industries. Humanit. Soc. Sci. J. Hainan Univ. 2010, 28, 47–52. [Google Scholar] [CrossRef]
  48. IPCC Guidelines for National Greenhouse Gas Inventories. Available online: https://www.ipcc-nggip.iges.or.jp/public/2006gl/vol2.html (accessed on 24 November 2022).
  49. GB/T 4754—2017: 2017; Industrial Classification for National Economic Activities. National Bureau of Statistics: Beijing, China, 2017.
  50. Xu, X.; Zhao, T.; Liu, N.; Kang, J. Changes of Energy-Related GHG Emissions in China: An Empirical Analysis from Sectoral Perspective. Appl. Energy 2014, 132, 298–307. [Google Scholar] [CrossRef]
  51. Notice of the State Council on the Issuance of the 13th Five-Year Plan for Controlling Greenhouse Gas Emissions. Available online: http://www.gov.cn/zhengce/content/2016-11/04/content_5128619.htm (accessed on 6 January 2023).
Figure 1. Parallel structure system.
Sustainability 15 02632 g001
Figure 2. Schematic diagrams of the relations between the total GDP potentials and the value range of the carbon emission reduction ratio.
Sustainability 15 02632 g002
Figure 3. Change in industrial carbon emission ratio of each province before and after allocation.
Sustainability 15 02632 g003
Figure 4. Comparison of carbon quota allocation results for regional industries.
Sustainability 15 02632 g004
Figure 5. The proportion of regional industry quota changes before and after.
Sustainability 15 02632 g005
Table 1. This paper vs. the literature of carbon quota allocation based on DEA models.
ReferenceAllocation GuidelinesVariableSectorsUndesirable Output (CO2)
EfficiencyEqualityInputOutput
Energy ConsumptionCapital StockPopulationOthersGDPCO2 EmissionOthers
Gomes and Lins [19] (2008)
Fang et al. [20] (2019) Historical carbon emissions Population, energy intensity et al.
Yang et al. [21] (2019)
Mahdiloo et al. [22] (2018) Fuels Generated electricity, SO2, NOX and CO2ElectricitySO2, NOX and CO2
Kong et al. [23] (2019)
Chen et al. [9] (2021)
Zhan et al. [24] (2022)
Cheng et al. [25] (2022) CO2 Population and Energy consumption
Shojaei and Mokhtar [5] (2022)CO2
Wu et al. [26] (2016) Industry
Li et al. [27] (2016) CO2 Population and thermal powergenerationPower
Gan et al. [28] (2022) CO2, HDD and CDD in 2030 The added value of the tertiary industry in 2030Public buildings
This paper Three major industries
Note: Where √ indicates that the item is included in the literature.
Table 2. This paper vs. the literature of parallel DEA models.
ReferenceAllocation GuidelinesResource AllocationSectors
EfficiencyEqualityCarbon Quota AllocationOthers
Kao [29] (2009)
Lo Storto [30] (2020) Urban water industry
Kordrostami [17] (2014)
Lei et al. [31] (2015)
Esmaeilzadeh and Kazemi [18] (2019)
Lin and Tu [32] (2021)
Gan et al. [33] (2022)
Xiong et al. [34] (2018)
Liu et al. [35] (2020) Road transport industry
Ang et al. [36] (2020)
Xiong et al. [37] (2022)
This paperThree major industries
Note: Where √ indicates that the item is included in the literature.
Table 3. Comparison of carbon emission Gini coefficient before and after allocation.
Primary Industry Gini CoefficientSecondary Industry Gini CoefficientTertiary Industry Gini CoefficientProvincial
Gini Coefficient
Initial Gini coefficient0.29120.38350.22910.3444
Post-quota Gini coefficient0.29120.38350.22910.3211
Table 4. Results of industrial carbon quota allocation by region.
DMU R j 1 R j 2 R j 3 R j 1 / R j 1 R j 2 / R j 2 R j 3 / R j 3 R j R j / R j
Beijing94.742267.745327.541.431.001.007690.021.00
Tianjin197.1112,943.252970.171.001.081.0916,110.531.08
Hebei1028.7168,542.186791.900.871.000.8976,362.790.99
Shanxi537.7437,884.064471.110.721.010.9142,892.910.99
Inner Mongolia717.0955,674.474993.320.731.000.7861,384.880.97
Liaoning582.4545,750.926709.270.921.110.9653,042.641.09
Jilin295.1110,047.892918.420.780.810.7813,261.420.80
Heilongjiang1410.2212,113.034808.621.000.910.7818,331.870.87
Shanghai84.4314,022.988740.161.001.071.0022,847.571.04
Jiangsu1035.4657,531.0210,012.721.001.001.0068,579.201.00
Zhejiang727.8236,645.426789.411.191.271.0144,162.661.22
Anhui366.6624,180.584676.350.761.040.9729,223.591.02
Fujian371.9623,178.094962.811.001.161.2728,512.861.17
Jiangxi229.5817,535.923749.890.791.000.9121,515.390.98
Shandong1315.5878,277.879957.181.001.000.9689,550.631.00
Henan967.7434,005.577185.790.951.000.9242,159.100.98
Hubei739.0122,413.647174.580.981.161.0930,327.241.14
Hunan1008.6818,489.626532.780.841.130.9626,031.081.07
Guangdong1089.8238,158.4813,409.461.081.001.0052,657.761.00
Guangxi289.2351,485.343650.960.911.001.2455,425.531.01
Hainan269.502923.801791.421.001.001.004984.731.00
Chongqing175.6710,274.483792.681.000.991.2114,242.821.04
Sichuan353.6326,246.116046.001.001.501.5032,645.741.49
Guizhou346.2611,283.825727.820.741.050.9917,357.901.03
Yunnan417.5218,713.563997.920.871.501.3623,129.001.45
Shaanxi385.5419,069.254377.221.001.001.0023,832.011.00
Gansu347.8912,053.752497.291.021.271.2614,898.941.26
Qinghai24.033525.221087.861.001.001.504637.111.08
Ningxia143.2517,060.941003.210.731.001.0018,207.401.00
Xinjiang1188.7531,797.702908.241.001.000.8135,894.690.98
Total16,741.21814,096.68159,062.11
Table 5. Regional industry carbon quota results in China.
ProvincePre-Quota AllocationPost-Quota Allocation
Primary
Industry
Secondary
Industry
Tertiary
Industry
TotalPrimary
Industry
Secondary
Industry
Tertiary
Industry
Total
Northern coastal2765.40161,074.2626,030.49189,870.162636.15162,031.0425,046.79189,713.98
Southern coastal1647.8361,125.4019,122.0981,895.331731.2864,260.3720,163.6986,155.34
Eastern coastal1729.2899,438.2525,456.03126,623.551847.71108,199.4225,542.28135,589.42
Middle Yangtze River2722.4076,495.2522,352.14101,569.792343.9482,619.7622,133.61107,097.30
Middle Yellow River3130.43146,347.7123,571.16173,049.302608.11146,633.3421,027.45170,268.90
Northwest1750.4161,884.267301.4770,936.141703.9364,437.617496.6173,638.14
Southwest1796.32102,543.2118,827.13123,166.661582.31118,003.3023,215.38142,801.00
Northeast2420.2866,982.9916,938.8286,342.092287.7767,911.8414,436.3184,635.92
Disclaimer/Publisher’s Note: The statements, opinions and data contained in all publications are solely those of the individual author(s) and contributor(s) and not of MDPI and/or the editor(s). MDPI and/or the editor(s) disclaim responsibility for any injury to people or property resulting from any ideas, methods, instructions or products referred to in the content.

