1. Introduction
Developing countries in South Asia, including Bangladesh, have shown a constant growth over last decade. Bangladesh has been maintaining steady macroeconomic growth for last two decades by prudential financial, and credit management, and this trend is continuing. If we compare with other South Asian countries of SAARC, the growth rate of Bangladesh is more than other countries. According to the World Bank [
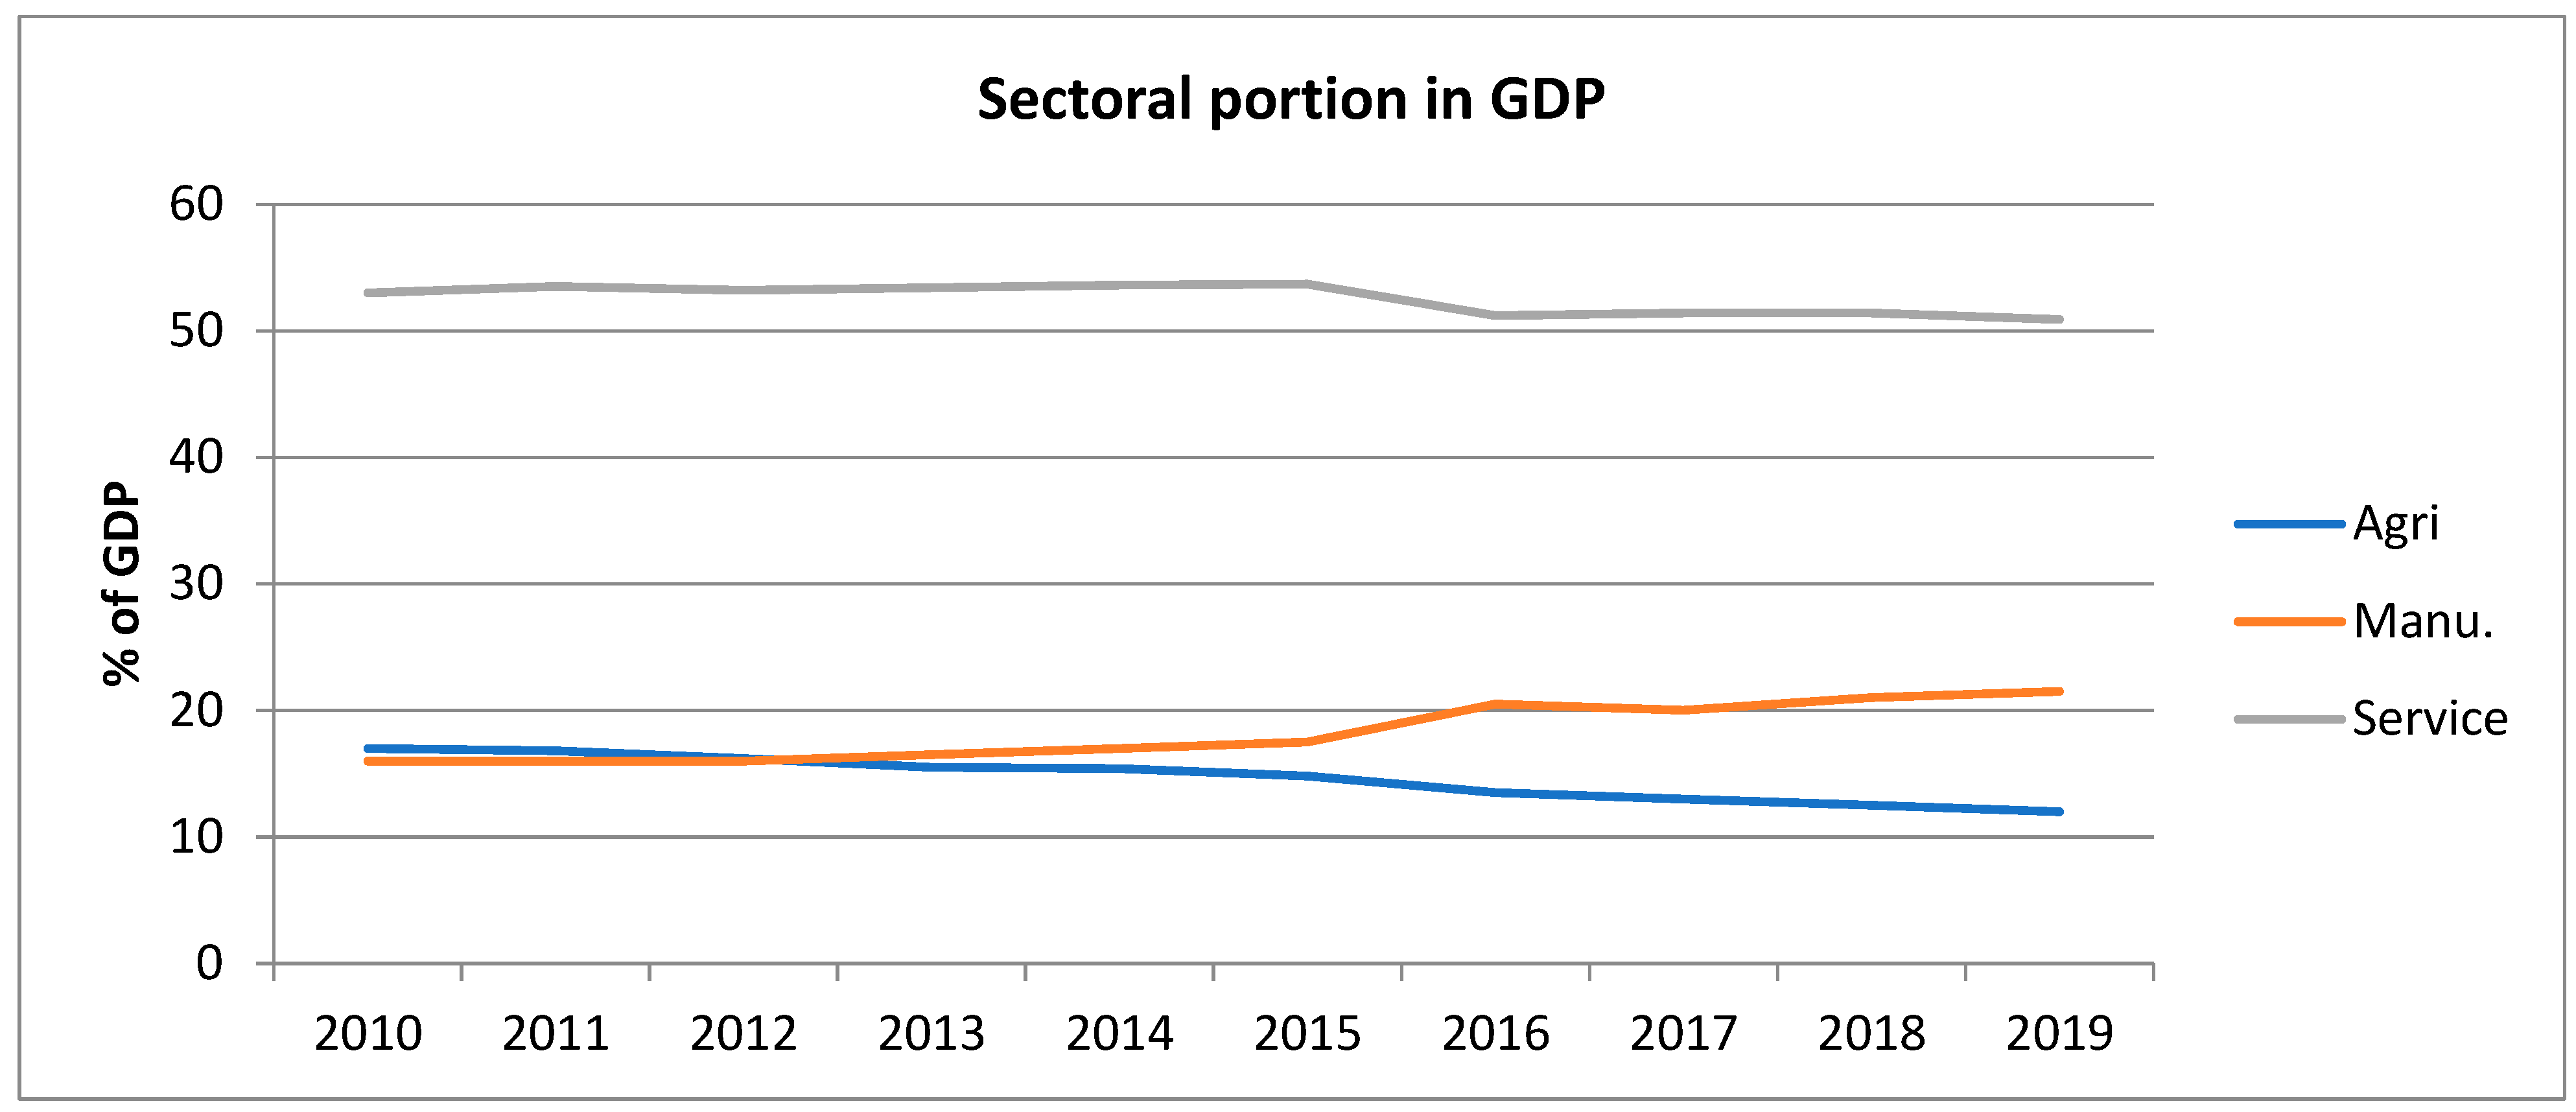
1], Bangladesh has a steady annual growth rate over 6% on average for the last 15 years. Previously, in the GDP of Bangladesh, the agriculture sector contributed around one-third during the 1980s and the 1990s. During the same period, the service sector’s share in GDP rose from one third to almost half. Since then, it has been constant for the last two decades. In recent times, the agriculture share in GDP has been reduced to 12.5% from 17% of GDP from 2010 to 2018. The contribution of manufacturing sectors had grown from 16% to 21% within this same time period. A comparative figure is shown in
Figure 1, which shows within this time period that the Bangladesh economy is depending more on manufacturing growth, while the service sector was constant and the agriculture share declined. In the competitive international market, many buyers are now choosing Bangladesh as their destination for the manufacturing production because of available cheap labor and low production cost [
2]. Bangladesh has been enjoying duty free entry in the EU and some advanced economies, it also has a favorable geographic condition and huge domestic market; all of these have attracted foreign investors [
2]. Despite Bangladesh’s amazing growth for the last few years, the diversification of manufacturing is not yet present in the economy. The main exporting products of Bangladesh are mainly textile and readymade garments, which depend on low waged, inexperienced workers. Between 2000 and 2015, 80% of export growth was due to textile sector for Bangladesh. [
3] This created millions of employment opportunities and Bangladesh became the second largest exporter of textile in 2014 [
3]. Although Bangladesh has a lot of issues that it needs to address for development, now it can be seen as an emerging star in respect of economic growth in South Asia.
After its independence in 1971, at first Bangladesh had taken state owned policies to recover the shattered economy, although it was discontinued after few years. During the 1980s, there was a wave of rapid privatization and permission was granted for foreign-private collaboration without any restriction [
4]. After restoring democracy during the 1990s, there was a wave of liberalization, which expanded the service sector much more than manufacturing [
5]. In this decade, annual growth rate was stable and first reached the level of around 4–5% constantly [
1]. The democratic governments in the 1990s had tried to restore economic stability. Government controlled the expenditure and increased revenue collection, which led to lowered budget deficit and controlled inflation. During last few decades, much infrastructure was developed for connectivity, such as the construction of roads and bridges. To facilitate business, port capacity was increased and regular electricity supply was ensured for most of the country in the last few years. To ensure food security, agricultural inputs were subsidized. Special credit facility has been provided to SME and export oriented sectors [
6]. All of these initiatives have resulted in the increasing trend of annual GDP growth in the last two decades, which was around 5–6% constantly [
1].
If we look into the highest output sectors of Bangladesh in 2017 from the input-output table published by ADB [
7], we would see the first two places are obtained by textile and construction, while the traditional most important sector, agriculture, is in third place. Food is the only manufacturing sector in the top 10 highest output sectors other than textiles. High value added service sectors have been increasing outputs and gained importance in recent times, such as inland and water transport, along with traditionally important service sectors such as public administration and community service. The presence of the construction and real estate sector in the top output sectors indicate the infrastructural development process is happening by various government and private entities. We could find only two manufacturing sectors in the top 10 total output sector- textiles and food, both labor intensive industries. As Aggarwal and Kumar [
8] commented, Bangladesh is adept at traditional labor intensive and processing sectors such as textile, food etc., which involves low technology similar to other South Asian countries. Moussir and Chatri [
9] pointed out that during the take off period of developing countries into developed countries, these countries need to diversify away from agriculture, natural resources, and labor intensive low technology oriented sectors. Countries which are trapped into low and middle income could not shift their production structure from these traditional manufacturing sectors [
9].
Bangladesh has been free of domestic conflicts since 1997, when the peace accord was signed between indigenous people in the Chittagong Hill Tracts and the Bangladesh government. Recently, Bangladesh has been facing two-fold challenges, which could make the country vulnerable in near future. One major issue was to give shelter to the Rohingya refugees; another issue is being one of the most vulnerable countries in world due to climate change effect. Ahmed et al. [
10] commented that developing countries are now facing not only climate related issues, but also different forms of violence and conflict. These countries are already resource poor and with climate related pressure the development process could be hampered. Zhou et al. [
11], in their research, commented that a strong relation exists between regional stability and climate shock. Environment shocks could exacerbate the present condition and countries may have conflicts due to this. Schleussner et al. [
12] commented that countries vulnerable from climate change could not sustain development as their socio-economic condition is also under stress from environmental disasters. A UN ESCAP report [
13] estimated that Bangladesh lost 11.3 billion USD due to various climates related disasters in 2020. Ozaki [
14] has estimated Bangladesh would have incurred a financial loss of about 2.2% of its GDP due to climate related disasters. He commented that although Bangladesh has improved its disaster management system, for which loss of life is significantly lower in the recent disasters, still the economic impact of these hazards are huge. Another dimension of challenge has been created by the Rohingya refugees. The Center for Policy Dialogue (CPD), a Bangladeshi think-tank, has estimated in 2019 that Bangladesh has to spend 1.2 billion USD per year for supporting around 1.1 to 1.2 million of refugees. With a massive decline in the expected support from international donors and this estimated cost gets increased due to inflation and new Rohingya population, it would be a huge burden for Bangladesh to spend huge amount of money to support these destitute refugees. Now, Bangladesh needs to formulate economic policies prudently so that its economic growth is sustained and these challenges would not affect to the growth. Our research is one attempt to find a way to maintain economic growth from a sectoral perspective, despite facing challenges from environmental disasters and refugee problem.
Blinc et al. [
15] defined sustainable development as the future generations should have the same or more opportunity for development as it is now. The SDG goal 16 talks about peace, justice and strong institutions for ensuring sustainable development. The SDG goal 16 is quite interrelated with goals 8 and 9, which are promoting sustainable growth through a focus on labor intensive and high value added sectors and sustainable industrialization. We have found labor intensive low technology manufacturing and high value added service sectors as key sectors for growth in Bangladesh and other South Asian LDCs. This is in accordance with the achievement of goal 8 and 9, which is important to achieve goal 16, which aims to eradicate inequality in society with justice. According to Chopra et al. [
16], Bangladesh has a higher SDG index than regional neighbors of India and Pakistan. It indicates the situation of Bangladesh for achieving SDGs is better than its neighbor countries. The Bangladesh government is aiming now to prioritize industrial diversification to achieve high economic growth, which will eventually lead to attain goal 8 and 9 of the SDGs 2030. Our findings of some new prospective manufacturing sectors could help to achieve these goals if these sectors could prosper with effective policy support.
The main objective of this paper is to disentangle the process of economic growth in Bangladesh by identifying some prospective accelerating sectors which could help to achieve sustainable development. To create effective policy to support the key industries in one country, we need to analyze the structural change in the recent periods. There is a need to properly identify the key sectors, which enabled Bangladesh to keep up the steady growth rate. This will help to formulate an effective strategy for sustainable growth of these sectors. It may be of equal importance to investigate the contributing factors liable for growth of particular industry. A comparison of economic structure of Bangladesh with similar feature Asian developing countries could show us the actual growth situation of Bangladesh. Using input-output analysis, it is possible to analyze the economic structure of Bangladesh and its neighboring Asian countries, which can help to identify situation of Bangladesh in these sectors. Lastly, we discussed how Bangladesh could achieve sustainable development in future with existing structure of economic development. Some policy implications related to policy support for prospective growth sectors is discussed in the conclusion.
There are many macroeconomic variables, which could be attributed to the steady growth of Bangladesh, but there are no studies about this in the sectoral level. This study is the one of the first studies to identify the key accelerating sectors which are enabling Bangladesh to pull itself up by bootstraps from a sectoral approach. We selected five other lower income developing countries (LIDCs) along with Bangladesh from the South and South-East Asia region, which have similar per capita GDP (a range of 1000 to 2000 USD) between our estimated time periods between 2011 and 2017. All of these countries also enjoyed constant high annual growth in this time period. In
Table 1 we showed the annual growth rate of these countries over last decade.
The main objective of our research is to identify key sectors in Bangladesh in between 2011 and 2017. We disentangle the production growth of these sectors using a novel decomposition approach, which we term difference of differences (DOD) decomposition modifying the conventional decomposition. We have conducted similar analysis in five other LIDCs and compare their economic structure with Bangladesh. In this analysis, a commonality could be found among countries’ leading growth sectors. Next, we identify the factors that contribute to sectoral acceleration or deceleration, such as technological change or final demand change. Then, by further decomposition of the final demand effect, we determine the contribution of the consumption, investment, and export effects on the acceleration part of DOD decomposition. The paper will then constitute the following five sections.
Section 2 will discuss previous literature reviews and a theoretical framework for SDA, and our modified technique.
Section 3 will discuss SDA methodology and the novel decomposition approach to measure the difference in output difference of two periods. We show the results in
Section 4, while in
Section 5 analysis of the results are given, identifying leading sectors, and some general discussion about the sectoral growth of Bangladesh.
Section 6 will offer some policy implications and concluding remarks.
2. Theoretical Framework
Mercer-Blackman et al. [
3] analyzed how diversified economic sectors of Bangladesh in comparison with the U.S.A., China, India, and Vietnam using linkage effects from I-O tables provided by ADB. They concluded that Bangladesh is heavily depended on the textile sector in the manufacturing sector and needs to diversify its industrialization for sustainable growth. Norbua et al. [
17], who have used the similar input-output analysis methodology by Mercer-Blackman et al. [
3], have also conducted a similar analysis. They also finalized that Asian LIDCs, including Bangladesh, have very weak linkage among their sectors and should enhance their backward and forward linkages for sustainable development. Arif and Inaba [
2] compare FDI spillover effect on the productivity of firms in Bangladesh and Vietnam. They found Bangladesh firms gain productivity through intra-industry linkages, while Vietnam firms increase their productivity through backward linkage. Although their paper showed aggregate comparison between two countries, they showed the percentage of FDI in firm ownership as descriptive statistics which indicate sectors attracting most FDIs. Our main difference from these studies is that we are focused on analyzing the structural transformation or change in growth process from a structural decomposition approach, while they only take into account the descriptive statistics and linkage effects among the sectors from input-output table. Our attempt to analyze the economic structural change of Bangladesh in a detailed sectoral level is probably one of the first studies in this regard. As the input output tables for Bangladesh was not available previously, it was quite difficult to determine key sectors in Bangladesh economy through input output analysis. Identifying the prospective growth sector of the Bangladesh economy, which could achieve sustainable development in the longer run, with a novel input-output approach, would be a significant contribution of this paper.
We use mainly structural decomposition analysis (SDA) to determine leading sectors for the economic growth of Bangladesh and other South Asian countries. Rose and Casler [
18] commented that the SDA approach showed interdependence among sectors for the growth of production, which is not possible to capture by aggregate level econometric estimation. To measure the acceleration and deceleration of the steadily growing sectors of these countries, we modify the classic decomposition method using the average of polar decomposition suggested by Dietzenbacher and Los [
19].This conventional decomposition could not measure the dynamic acceleration or deceleration of two adjacent timeframes. Therefore, we introduce a simple approach to measure this, which we believe could indicate the long-run acceleration/deceleration of sectors. With this new methodology, we measure the difference in output change during two periods. We name it difference of differences (DOD) decomposition approach because it measures the difference value of two adjacent time frames’ output change.
Many previous papers have used different forms of structural decomposition analysis to analyze the economic structure of a single country or a group of countries. Some notable studies are by Skolka [
20], Barker [
21], Martin and Holland [
22], Liu and Saal [
23], Dietzenbacher and Hoekstra [
24], and Roy et al. [
25], among others. Some recent studies have used different econometric methods with panel data to analyze the structural transformation of economies over time. Some examples of this type of research are by Carmignani and Mandeville [
26], Erumban et al. [
27], Brondino [
28], Moussir and Chatri [
9] etc. Some of the previous studies who have used different forms of SDA, a method similar to ours, include Oosterhaven and Linden [
29], Guilhoto et al. [
30], Wang et al. [
31], and Magacho et al. [
32], etc. The main difference of these studies from ours is that they used mainly two period traditional SDA, focusing on the speed of growth using 1st difference of output change, while we used three period data with an additional mid-point year to calculate the acceleration of growth using 2nd difference of output change. These previous studies mainly focused to capture the growth pattern by analyzing the speed of growth. Our main contribution to the existing SDA literature is that our SDA approach focuses on not just the speed of growth of gross output but on its acceleration/deceleration. This is important to identify constantly growing sectors over the long run, which is not possible with the traditional SDA method. To determine the contributing factors for growth in the long run, we have to take account the acceleration of a sector, not only speed. A sector could be growing in a certain time period, but to define it as constantly growing we have to take consideration of its growth pattern for at least two consecutive time periods. We have modified the traditional SDA technique which could capture this phenomenon by taking into account the acceleration of the sectors.
3. Data and Methodology
We have used National I-O tables from ADB [
7,
33] of 2011, 2014, and 2017 in Bangladesh and five other Asian countries for input output analysis and structural decomposition analysis. Previously, there are only few Asian countries included in the World Input Output Table, such as Japan, Korea, China, India, Indonesia etc. Recently, ADB has published national input output tables for emerging economies in Asia from 2010 to 2017 [
7,
33]. Many countries, such as Bangladesh, Malaysia, Nepal, Philippines, Cambodia, Pakistan, Mongolia, Lao PDR, and Vietnam etc., are included in this list. So, it is now possible to analyze the economic structure of these countries using input output tables. We have taken a three year difference between our two calculated time period; 2011–2014and 2014–2017. Generally, structural transformation takes place within few years in a country. To capture this phenomenon previous studies using similar SDA method by Wang et al. [
31] and Magacho et al. [
32] have taken three to five years difference between two time periods in their calculations. As we have national input-output tables for a limited number of years, following these previous studies we have taken the above mentioned two time periods for our analysis. National I-O tables from ADB consist of 35 sectors, which are shown in the
Appendix A Table A1 with abbreviation, which we used throughout the paper. We deflated the data using GDP deflator to get the constant price inputs, otherwise changes in input coefficients will capture price change between this time periods.
First, we analyze the economic structure of Bangladesh with descriptive statistics such as linkages to learn about key sectors according to linkage effects. Then, the objective of this paper is to find the key sectors of Bangladesh economy and compare economic structure with five other Asian countries using demand side decomposition analysis. For this purpose, Leontief Inverse and Final Demand must be determined first. The sectoral output vector
x depends on the size of final demand vector
f and the technical relation matrix with products
A as follows:
This can be expressed using Leontief Inverse:
Here,
is the usual Leontief Inverse,
L. Next, we analyze backward linkage (BL) and forward linkage (FL) in this study to determine influential sectors in the economy of a country. We use the 2017 I-O tables of the Bangladesh as example to identify backward and forward linkages using Equation (2) following Miller and Blair [
34] to see the inter linkage among sectors.
BL and FL could be defined as:
Here, n is the number of industries, is the sum of elements in the Leontief inverse matrix, . is the row sum and is the column sum of the Leontief inverse matrix.
For supply side analysis, backward linkage models are used which was first introduced by Hirschman [
35]. According to Slim, Secretario and Suan [
36] Linkages reflect the dependence of industries on one-another in an economy and measure the potential stimulus that will be induced in other industries arising from an increase in activity in a particular industry. Fransman [
37] commented to analyze competitiveness among countries analysis of processing factors for transforming inputs into outputs like technical change coefficients should be used. Markusen and Venables [
38] suggested that backward linkages are likely to strengthen supplying industries and may reduce input cost. They also concluded that backward and forward linkages are measurement of competitiveness.
To identify leading sectors in a country we first calculate the top 10 sectors by output growth. First, we use 1st order difference of output growth
in two periods, e.g., 2011 to 2014 to calculate output growth by sector. However, this could not catch the dynamic acceleration or deceleration of two adjacent time periods. Additionally, one sector could be increasing in 1st time period, but might be decreasing in output over 2nd time period. If we take only one time period difference
it might not be enough as it only gives us a smaller picture. So, it might be misleading to only use 1st order difference to find leading sectors. We are mainly interested in identifying sectors which are growing over both adjacent time periods like
. In this regard we use 2nd order difference
, which will take the difference between
. According to our previous research Huq and Ichihashi [
39], if the 2nd order difference is positive, there is high possibility the sector is constantly growing over the both time periods. After calculating 2nd order difference, we could able to identify some top sectors which are not present in the top sectors of 1st order difference.
It is usual to decompose the output growth with the help of input output table which is termed as structural decomposition analysis. A general decomposition could be done by decompose the output growth into technical change (TC) and final demand change (FDC). It was introduced by seminal work of Dietzenbacher and Los [
19] which could analyze the structural change using I-O table. According to them, Change in gross output:
where
denotes technical change and
denotes final demand change.
= the vector of final demands in year t,
= (
I −
At)
−1, Leontief inverse for year t. Technical change denotes the change in output if the input coefficient or Leontief inverse is changed while the final demand is constant. The second part shows the change in output due to the final demand change if the technology is constant.
This conventional decomposition could not capture the dynamic acceleration or deceleration of two different timeframe as we discussed earlier. So, we introduce a simple approach to capture it namely DOD decomposition, which could capture factors contributing to the long run acceleration/deceleration of sectors. The components of the DOD decomposition are proposed to capture, when applied to study the process of change in an economy, features that are not considered in a traditional SDA. For the DOD decomposition methodology, we mainly followed the methodology part from our previous research [
39] in which we described the methodology part in more details. We implemented a simple technique modifying classic decomposition method where we take the difference of two periods of output change. The basic equation of DOD decomposition following our method from Huq and Ichihashi [
39] is as follows:
Then, we expand the Equation (4) with the help of Equation (3) as follows:
Finally, the equation for DOD decomposition would be like following:
This DOD could be decomposed into three parts, which could indicate as different portions of increase or decrease in output change. We have named these parts as direct increment, previous increment and accelerating part. Direct increment shows the increase due to most recent year’s influence while accelerating part can be stated as symbiosis effect of two time period difference on the output change. Similar to direct increment, previous increment will show the oldest year’s influence. As we discussed in our previous research [
39],
could be positive if both
&
are positive. These two terms indicate the 2nd order difference of technology and final demand change between the two adjacent time periods. If the recent time period has increased more than the previous time period in context of technology or final demand change,
&
would be positive. This will eventually make direct increment more than previous increment and
would become positive. Accelerating part could show currently which sectors are accelerating in the long term. Currently, it could be one of the potential industries which should be supported by policy and incentives. If the acceleration is interpreted as positive, then we can say the sector is accelerating; otherwise, it is decelerating, or falling behind. Top sectors which have highest accelerating part could be said constantly growing sectors.
If we analyze the equation of DOD decomposition, we will see the acceleration part contains the new information which could not be found from traditional SDA’s 1st order difference decomposition. In our previous research [
39], we showed acceleration part is very important to determine whether a sector is accelerating or decelerating. Regarding the approach to a solution for the growth pattern, traditional SDA shows us the linear solution with two points of time. In our modified DOD technique, we could show the non-linear solution with an additional mid-point year along with the traditional SDA [
39]. In addition to this, traditional SDA could be termed as to identify any sector’s growth in shorter run. For example- in our study it would contain growth between 2011 and 2014 or 2014 to 2017. On the other hand, the DOD technique would identify acceleration in longer run, like in our study it takes into account the acceleration between 2011 and 2017.
Next, to find out the fundamental contributing factors behind the growth we decomposed the accelerating part into technical & final demand effect as following:
In the last step, Final Demand effect (FDE) is further decomposed into consumption, investment, and export effects to see the actual contribution from these factors to a sector’s growth like following:
The results from the last equation would show us the contributing factors behind the acceleration of sectors. We can also compare in a specific commonly leading sector what is the main contributing factor among countries.
Lastly, we make a comparison of some key sectors of Bangladesh with other five countries. As Bangladesh is used as reference in this comparison ratio, it was put into denominator. All these countries have different population size, so we adjust the comparison ratio for production with the population ratio of a particular country. So, we will get a comparison in per capita level which will give us a picture of competitiveness of these sectors of Bangladesh economy with other countries. With the DOD output change comparison ratio, we will get a 2nd order comparison ratio which will show us the accelerating or decelerating growth situation of countries. This comparison ratio could indicate a sector’s competitiveness with other similar economic structure countries in the long run. If we take only one period difference and compare them between countries, the competitiveness might not be actually inferred. With two adjacent time period difference of difference, we would be able to compare the situation of a particular sector with reference to a particular country. If we could compare main manufacturing sectors with regional neighbors, we could find out whether other countries’ production is catching up or decreasing.
We applied the comparison ratio to calculate for difference of difference decomposition of ∆
2xt from our previous methodological research [
39] as follows:
Here,
indicates the difference of
and
,which are adjusted by population ratio of the countries in 2011.
indicates similar 2nd order difference for Bangladesh economy. We used a comparison index first introduced in our previous research [
39] to actually capture the competitiveness of a particular sector with respect with Bangladesh economy which we showed in the
Appendix A Table A2. There are eight types of situation to indicate the growth pattern in these sectors, which are detailed in
Table A2.
4. Results
The input-output table provides the linkages between production and trade. Mercer-Blackman et al. [
3] commented that in an I-O framework these effects could be seen through forward and backward linkages. Khan [
40] explained that by backward linkage we could learn about the demand-driven connections to upstream sectors, while forward linkage shows supply-driven connections to downstream sectors. We use the I-O table of 2017 of Bangladesh to identify Backward and Forward linkage using Equation (2). We identify the top 10 sectors with highest Backward and Forward linkages in Bangladesh and showed result in the
Table 2 as an example. Similar results could be obtained for previous years and top industries were mostly same for the countries. According to Khan [
40], the main reason to find out the highest linkage sectors is that an increase in investment or production in these sectors will spread much effect in other sectors. The most common sectors which are highly influencing having high Backward Linkage Effect means the inputs of these sectors mostly come from other sectors in the economy. The common sectors which are influenced by other sectors having highest Forward Linkage Effect indicates other sectors use inputs from these sectors mainly. This indicates the importance of these sectors in the economy of a country according to linkage effects. From the below table we can see textile, construction and metal sectors in Bangladesh have both high backward and forward linkage. This indicates the importance of these sectors in Bangladesh economy.
Then, we applied the Equations (3) and (5) for calculating
, respectively, into the national I-O tables for Bangladesh. The results are shown in three tables in
Table 3,
Table 4 and
Table 5. In
Table 3 where we showed detailed decomposition for
first two columns depict the direct increment and total acceleration part. The last two columns show the results of the previous increment and the total 2nd order difference in output. We used Equation (6) to further decompose the acceleration part into technical effect and final demand effect and Equation (7) to decompose the final demand effect into consumption, investment, and export effect. All these results are shown in the middle columns of the tables.
Table 4 and
Table 5 show similar detailed decomposition for
in two time periods of 2014–2017 and 2011–2014.
Lastly, we applied the Equations(3) and (5) for calculating
, respectively, into the national I-O tables for the six countries of Bangladesh, Vietnam, Pakistan, Nepal, Lao PDR, and Cambodia for the years of 2011, 2014, and 2017 to make a comparative overview for the economic structures of these countries. We sorted the top 10 sectors according to
. These results are shown in three tables in
Table 6. From here, we could identify there are some sectors that could not be found in calculation of 1st order difference, but they exist in the 2nd order difference results. The detailed results of decomposition for the five countries other than Bangladesh can be found in
Appendix A Table A3.
We found some common sectors from these results of 2nd order difference of output growth, which could be attributed to these countries’ high growth rate. Food is a common manufacturing sector in all these countries. Textile and basic metal are other manufacturing sectors commonly found among most of the countries. Inland transport and electricity are common service sectors found accelerating in most countries. Construction is also commonly accelerating among all the countries. Except for Vietnam, all other countries top sectors mainly consist of service sectors. Retail and wholesale trade, hotel and restaurant, air and auxiliary transport, financial intermediation, post and telecommunication are some of the common service sectors found in these countries. Bangladesh is now developing some dynamic service sectors, such as inland transport and renting of machineries and equipment, along with traditional service sectors, such as, public administration, education, etc. It indicates Bangladesh is now also improving in high value added service sectors.
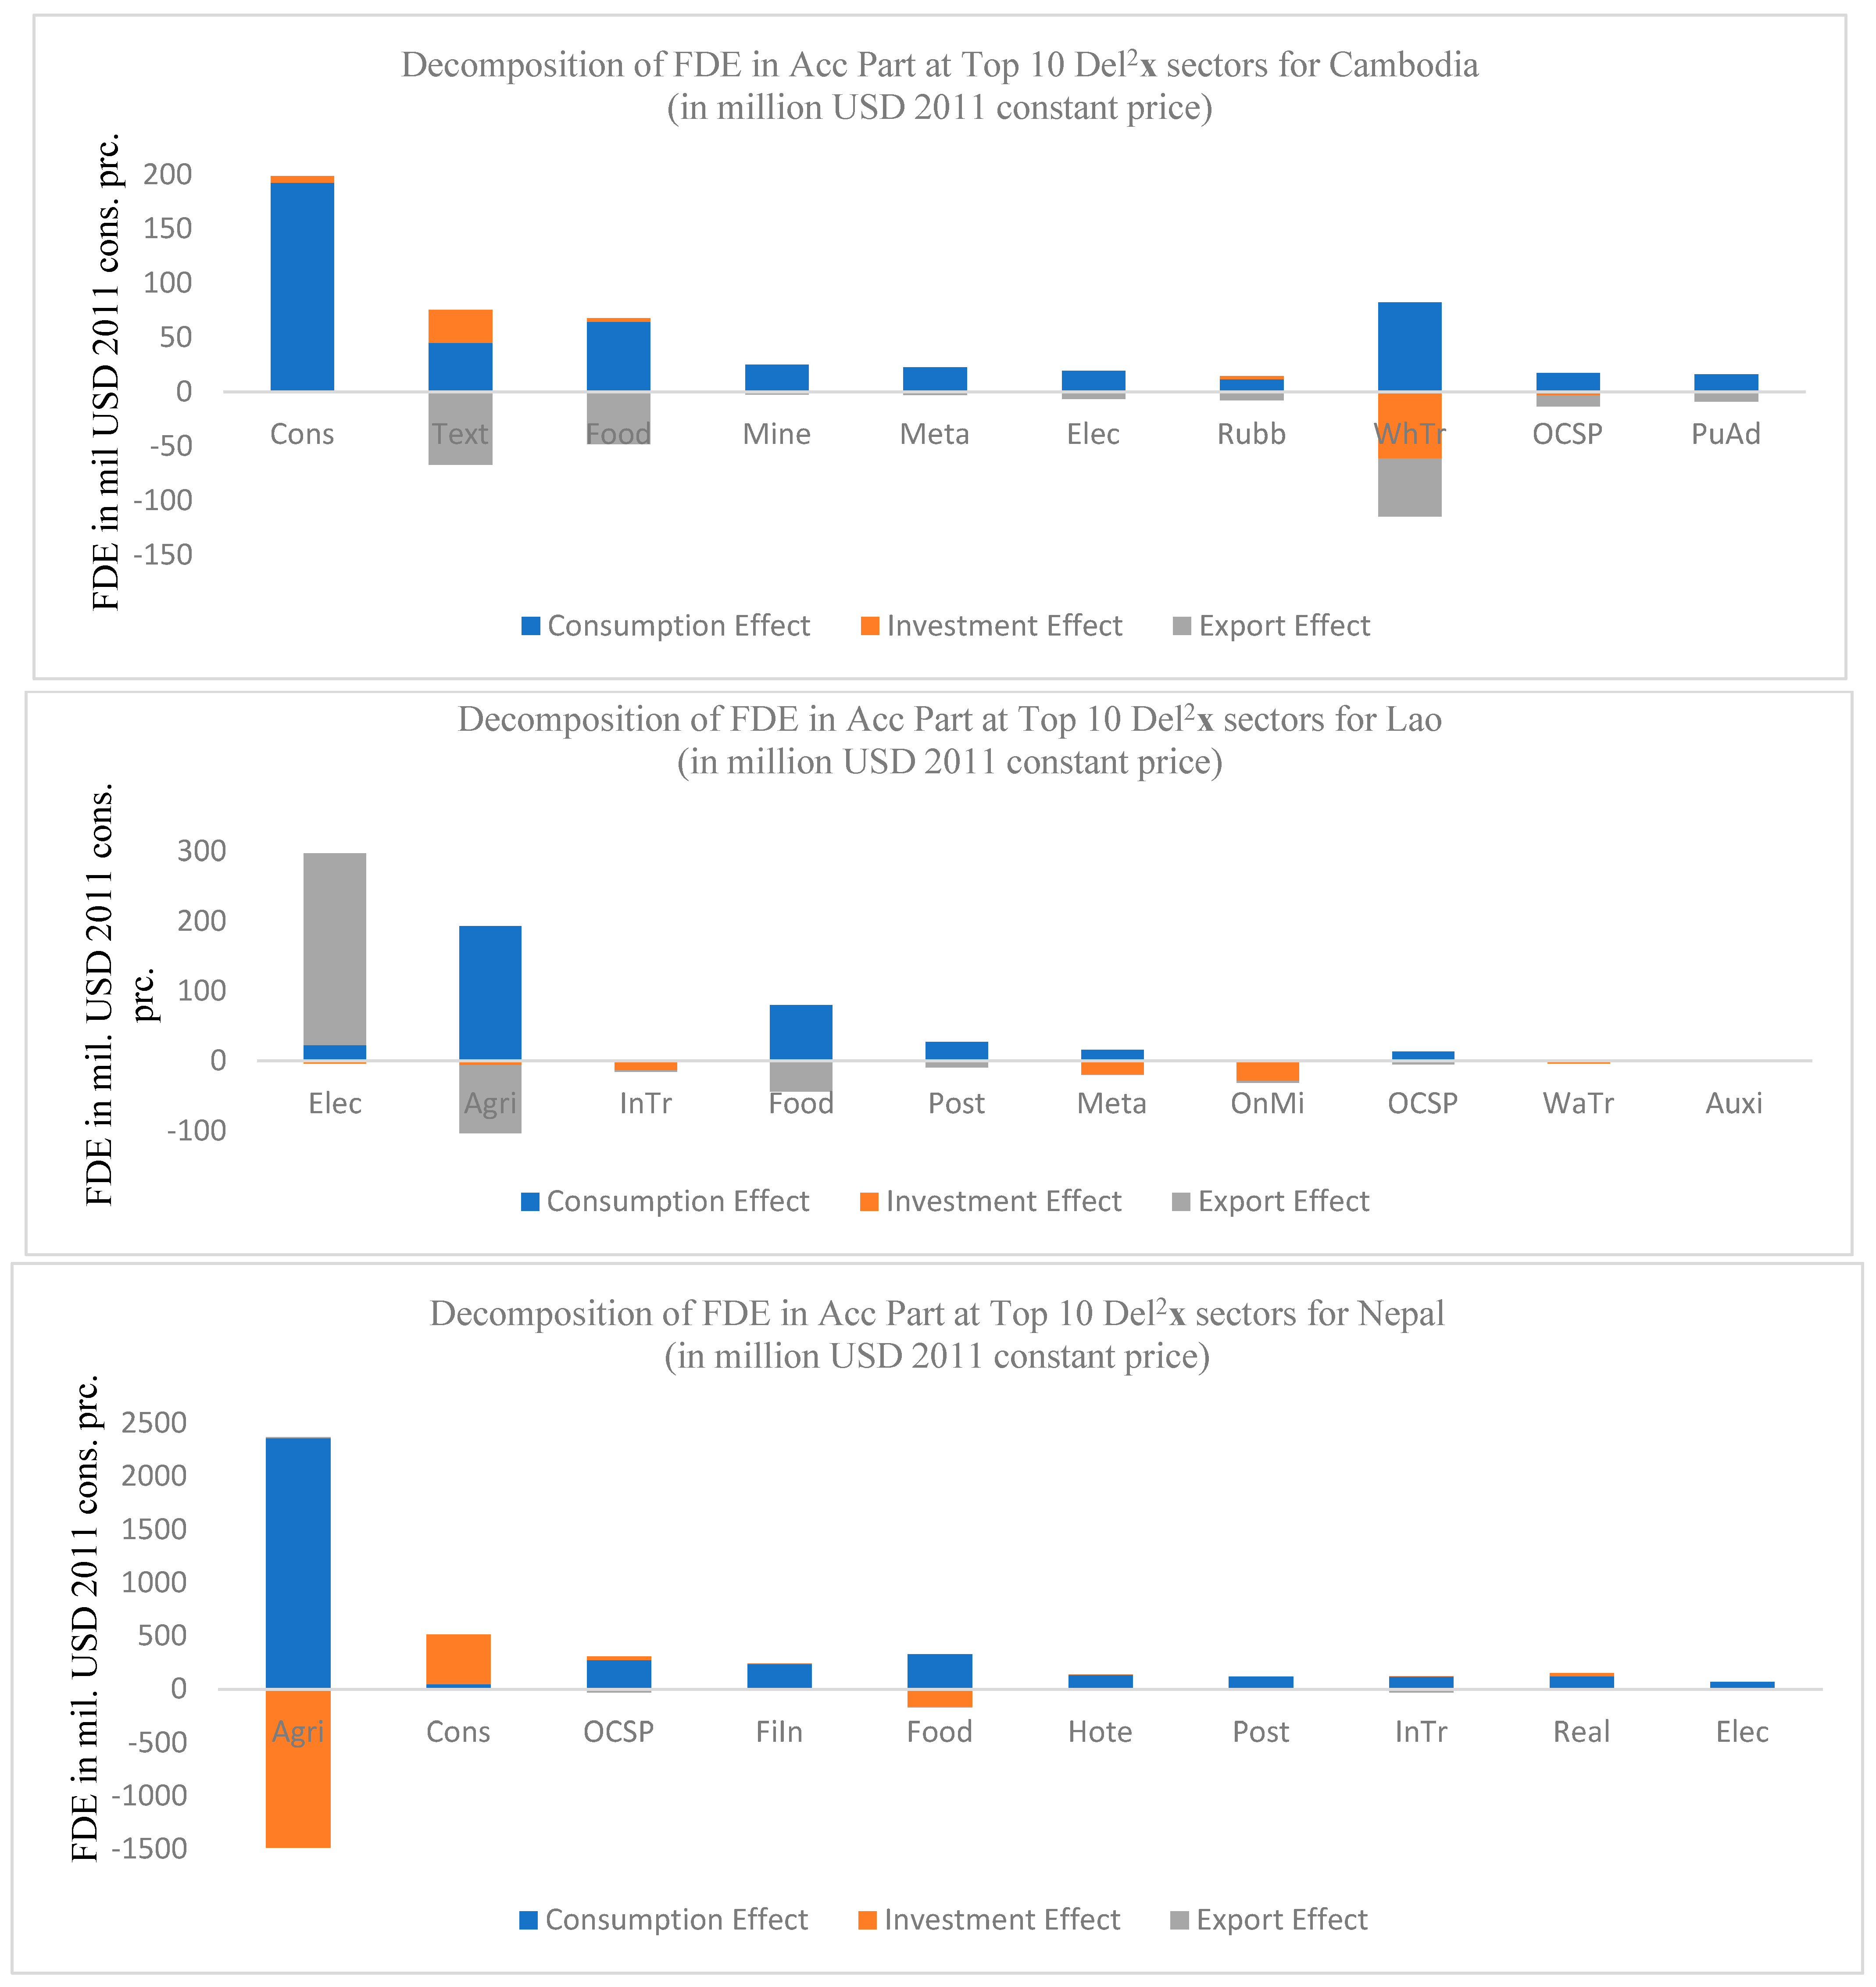
We obtained mixed results when we investigate further into final demand part of the acceleration effect for these six countries using Equations (6) and (7), which is shown in
Figure 2. For all countries except Vietnam, growth is mainly dependent on the consumption effect. It could lead into the assumption that these Asian countries are now growing a large domestic market and some manufacturing and service sectors are quickly growing to serve the demand of domestic population. Except Lao, all these countries have a huge population which will explain the domestic demand drive. For Vietnam, most of the industries are export effect driven. In Vietnam, there are some unique industries which are different than others. Maybe we can only compare its economic growth pattern with countries like China or Malaysia Acceleration in the food sector can be explained by the shifting focus of primary agriculture to industrialization in these developing countries. Additionally, to feed the huge population, food processing sectors have to become stronger very quickly.
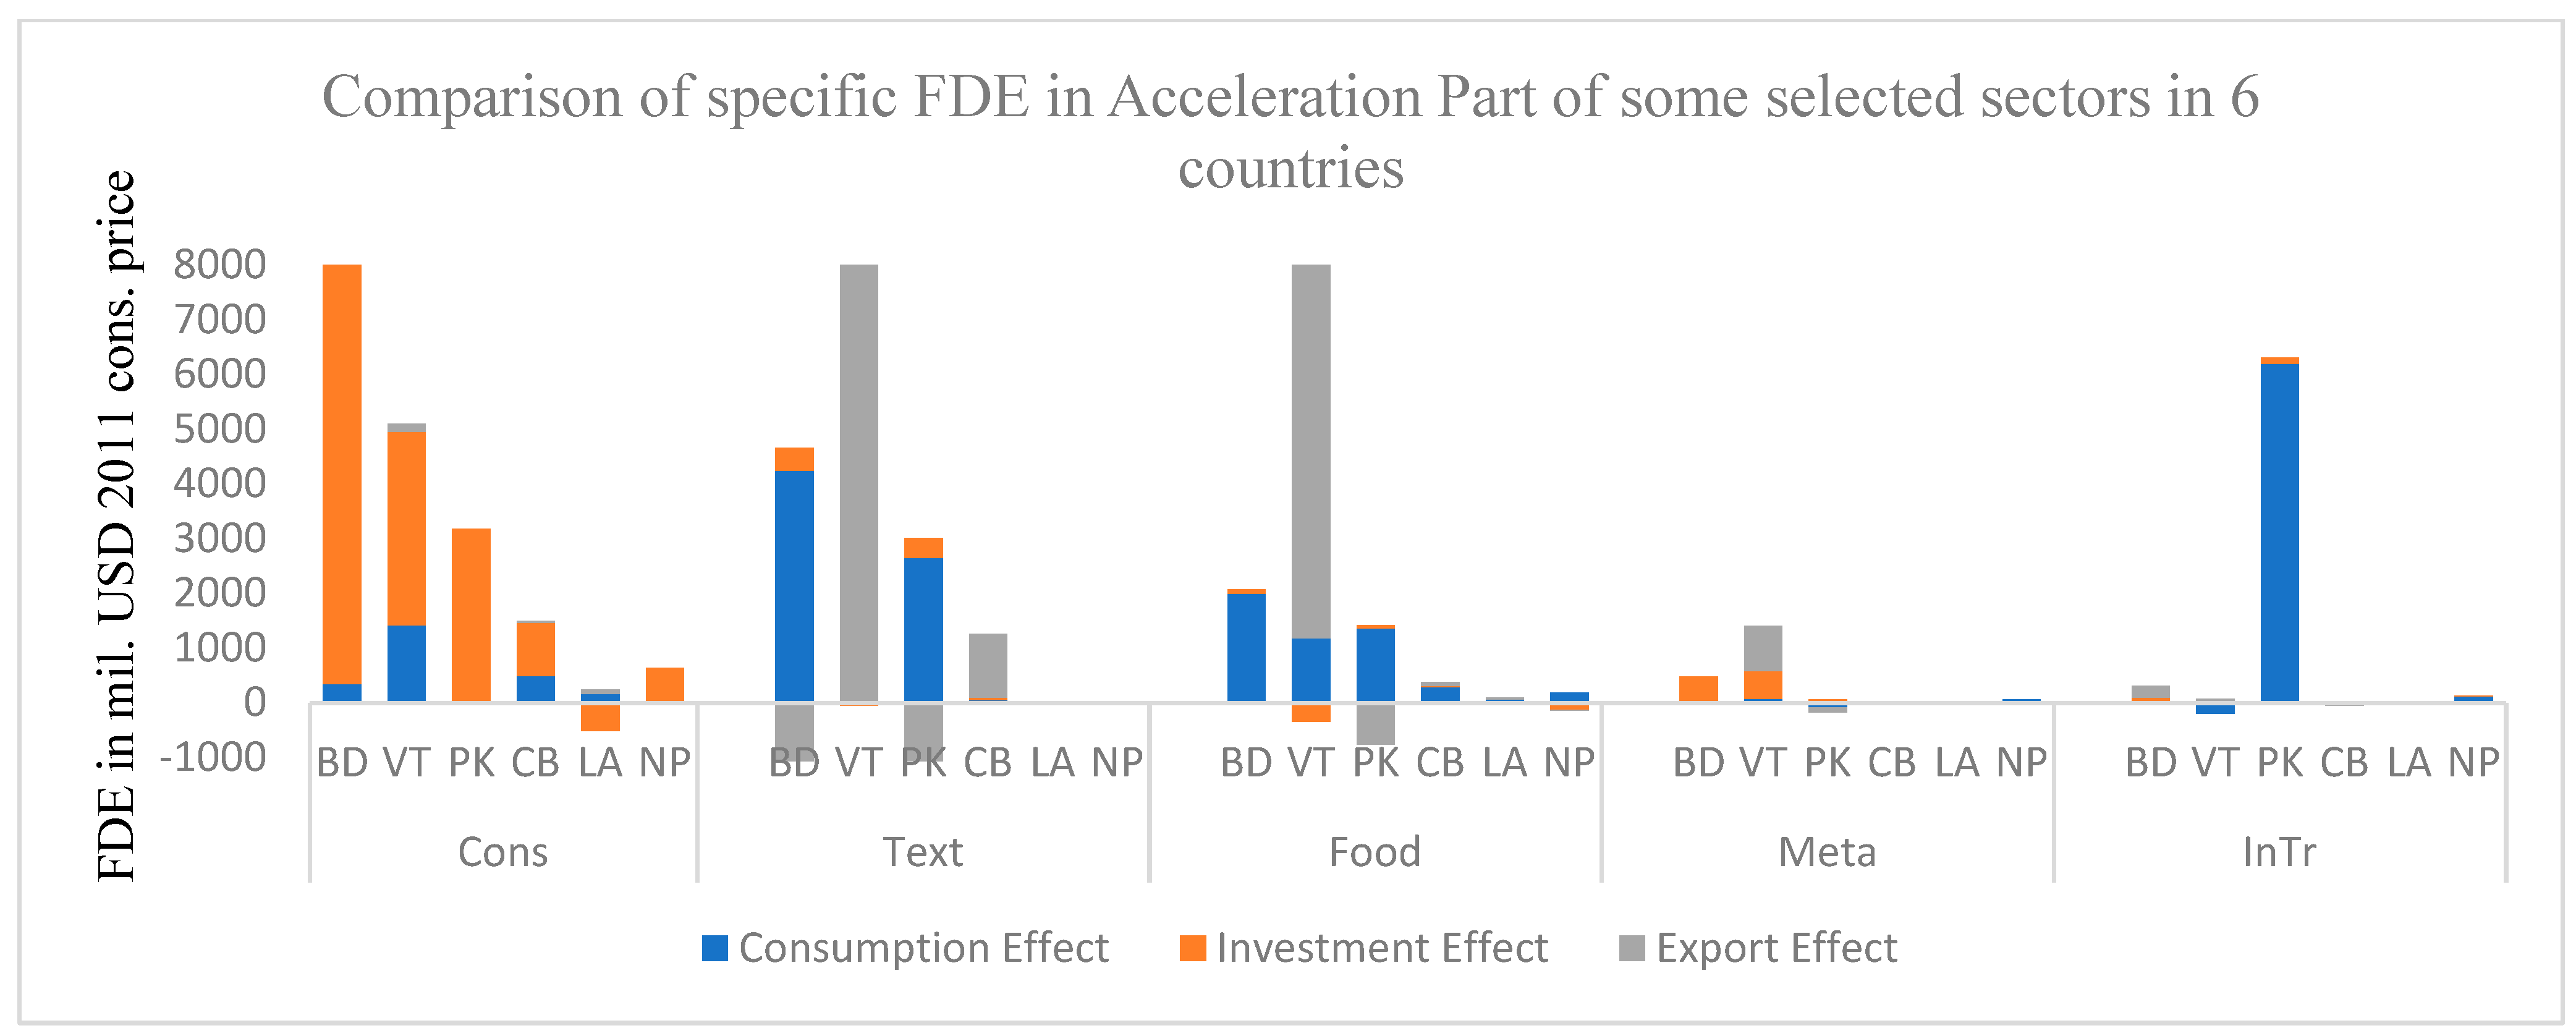
We tried to compare the contributing effect for growth in some common sectors in
Figure 3. As we can see, the investment effect is dominant for growth in construction sector. Textile and food sectors are mainly consumption demand driven, except for Vietnam, which depends on export growth. Inland transport growth is also due to consumption effect mainly. We obtained mixed results among countries for growth in basic metal sector.
Lastly, we compare Bangladesh’s economy as a reference country to those of other five countries using Equation (8). To do so, we classify their sectoral growth into eight categories, predicated on contrasts against outcomes in Bangladesh (acceleration/ deceleration, gap narrowing/widening, Bangladesh’s sector accelerating/decelerating etc.) which is described in
Appendix A Table A2. We are mainly interested to compare some top accelerating manufacturing sectors found from DOD technique (by 2nd order output difference) in Bangladesh economy with respect to other economies, which is shown in
Table 7.
Comparing at sectoral level shows most of Vietnamese sectors are type 1, which means both countries output is increasing but in Vietnam growth is bigger. Between Pakistan and Bangladesh, mostly sectors are type 5 or 6, which means Bangladesh has more advancement than Pakistan. The main sectors normalized by population ratio in Cambodia are type 2, except food. So, in per capita level, Cambodia is doing better in the food sector than Bangladesh. For comparing with Lao, mostly sectors are type 1 or 5. This means Bangladesh has more advancement than Lao in textile and manufacturing NEC, while Lao has more advancement in food and metal in per capita level. For comparing with Nepal, there is a mix of type 1 and 2 for all sectors. This shows the constant growth for these two countries in these sectors.
5. Discussion
As we can see from the results, the economy in other countries heavily depends upon only one or two manufacturing sectors, except Vietnam. For Bangladesh, it mainly depends on the export earnings from the textile sector. This lack of diversity in manufacturing makes their economy vulnerable to external change, like that experienced during the pandemic. Bangladesh, in its latest five-year plan, also tried to emulate Vietnam’s growth by pinpointing few strategies like- incentive to export production rather than import substitutions, attracting FDI for more export growth and diversify export sectors with new sectors and new destination countries.
We could see the growth of these countries is mainly service based, while rapid growth countries’ advancement in last few decades was mainly industrialization based. Felipe and Kumar [
41] commented that to follow the path of advanced economies developing countries need to diversify its export products. According to them, agriculture based South Asian countries need to investment more to diversify their export products. Thus, they could only escape from the situation of middle income countries in this region. After analyzing structural transformation of Asian countries, they showed Korea was able to successfully attain higher comparative advantage while Philippines could achieve this for only electronics equipment sector. According to Rodrik [
42], for sustainable growth in the long run, countries need to diversify manufacturing sector and promote industrialization quickly. He commented that manufacturing is different than service and agriculture in these countries. As the global value chain is wide spread now, manufacturing sectors must care for competition even if they only produce for domestic use. Policy, institutions, and country-specific characteristics could be factors influencing the rapid growth of poor countries. Khan [
40] stated that over the last three decades these South Asian LIDCs have experienced a major structural shift. One difference he found in their development way from other developed countries is that they have shifted from agriculture to service sectors, mainly without developing the manufacturing sectors.
There could be a question about whether the service based growth of Bangladesh and these South Asian countries would be sustainable in long run. Recent studies from Castaldi [
43] and Maroto-Sanchez and Cuadrado-Roura [
44] found that growth would not necessarily be declined because of rise in service sector. An example could be given as IT sector’s role on growth revival in some advanced economies like the U.S.A. in late 1990s. Rodrick [
45] also confirmed service sectors could play behind the economic growth if they are highly tradable and technologically dynamic like-tourism, financial intermediation etc. Carmignani and Mandeville [
26] supported this hypothesis by showing that for African countries, the expansion of service sector from agriculture sector was not main detrimental factor. Rather, the reallocation of economic activity from agriculture to non-manufacturing industry sectors such as mining was damaging for growth, which they termed as a “resource curse”. In the early 20th century, industrialization was the main way to develop for the developing country. Recently, we have also seen growth in the service sector in Bangladesh, and their growth is also linked to manufacturing [
46].
We have found in the 2nd order output some new manufacturing sectors that could be labeled as the prospective sectors for the near future. We found basic metal and manufacturing NEC and recycling sectors in Bangladesh as prospective accelerating sectors. The basic metal sector includes the production of iron, steel, other precious and non-ferrous metals, the casting of metal, the manufacturing of fabricated metal, and the manufacturing of structural metal products, which are very essential for the industrialization. Manufacturing NEC and recycling sectors include the production of general purpose machinery-engine, turbine, compressors, power-driven tools etc., special purpose machinery for agriculture, food, textiles etc., industries, the repair of machineries and recycling [
47]. These sectors are growing constantly over the last decade, which indicates Bangladesh is slowly developing in the manufacturing sector as well. This also shows high potential of Bangladesh to transform from labor intensive manufacturing sector to technology oriented manufacturing sectors. In the last 20 years, the agriculture industry in Bangladesh has increased production very little in real terms, but the food processing sectoral output increased almost three times. It could indicate a structural shift from primary agricultural production to more manufacture-oriented food processing industry. Acceleration in food sector is driven by the consumption effect as Bangladesh has a very big domestic market with a population of 180 million. The food processing sector is growing to meet up the demand of this large population. The advancement in the recycling manufacturing is also essential for sustainable development. Different forms of recycling and up cycling will help to achieve environmental sustainability in economic activities [
48].
According to the Bangladesh Planning Commission’s [
49] report, the Bangladesh Government is trying to promote inclusive and sustainable economic growth by formulating development oriented policies that will support to production. To achieve goal 8 of SDG, which is sustained, inclusive, and sustainable development, and decent work, Bangladesh is achieving a steady economic growth rate over last decade while the unemployment rate is going down. Our results showed Bangladesh is now depending on labor intensive and high value added sectors for economic growth, which is in accordance with goal 8.2 of SDG. To achieve goal 9 of building resilient infrastructure, the inland transport sector and construction sector is growing very quickly. Bangladesh is now promoting the manufacturing sector to achieve goal 9’s other component, promoting inclusive and sustainable industrialization. Our result also suggested that now medium and high technology oriented manufacturing and service sectors are growing. Additionally, we also showed from our DOD technique some prospective manufacturing sectors could be found which could grow in Bangladesh in near future with proper policy support. These sectors would help to achieve goal 9.2 of SDG, promoting sustainable industrialization with increasing share of manufacturing sectors in GDP. To achieve goal 16 of SDGs, the Rohingya crisis could be a big issue. It is affecting the peace and stability situation of not only Bangladesh, but the whole region. For sustainable development, which is the main component of SDG goal 16, peace, justice, and effective governance should be ensured. By achieving goals 8 and 9, it would be easier for Bangladesh to achieve goal 16, with more economic strength.
Elkington [
50] proposed that sustainable development encompasses two other dimensions along with economic development-social and environmental. Environmental aspect concentrates to preserve non-renewable resources and social development concentrates on human well-being, social justice, and equity [
51]. Gu et al. [
52] tried to investigate the relation of entrepreneurship and high quality economic development from economic, environmental, and social perspective of sustainable development. They found there is a mutual relation among economic growth, environmental degradation, and social advancement. Sustainable development not only encompasses the economic growth, rather it includes multidimensional advancements in societal issues. If we take the textile sectors’ growth of Bangladesh, it has 5 million workers, of whom 90% are women. Although there are many criticisms about low wage in this sector, these have empowered rural and poor women in Bangladesh. These women have now become economically independent and can contribute to their family. Advancement into light engineering manufacturing and transport services could create a huge opportunity for inexperienced and half experienced labors to transfer into these sectors from traditional sectors, such as agriculture. These factors have economically empowered the rural poor people, which led to ensure social development and equity in Bangladesh.
6. Conclusions
With frequent climate change related disaster shocks and a huge burden of refugees from a neighbor country, Bangladesh needs to formulate effective strategies to support its most prospective sectors to ensure sustainable development. Our technique of DOD decomposition could identify accelerating sectors over recent time periods. In this regard, the policy-makers could provide financial and policy supports to these new promising sectors. We could take the example of the textile sector in Bangladesh, which consists of more than 80% of the total export of this country. The Bangladesh Government is providing cash incentive for encouraging textile producers to export their products. This policy support has affected the rapid growth of the textile sector in recent times. So, sector specific policies could be taken for the newly accelerating sectors. We have found new promising sectors like basic metal, and manufacturing NEC and recycling, which could be very crucial for rapid industrialization of Bangladesh. As labor is cheap, necessary skills have been strengthened to repair machinery equipment. It might shed some light why these sectors are growing in Bangladesh.
Bangladesh, in its latest five-year plan, is targeting to diversify manufacturing sectors. Although there is debate one country should not be only focused on one manufacturing sector rather diversify its product, rapid transformation from dependence of one sector might not be easy. In Bangladesh, the textile sector includes 8% of entire labor force of Bangladesh [
53] and most of them are women. Reducing policy support to this sector would have lots of social and economic repercussions as unemployment for poor women and increase poverty. Rather, it would be beneficial to use the trained labor force to diversify products and create more value addition. In the last five-year plan for 2016–2020, the Bangladesh Government has chosen some thrust sectors or prospective sectors and set an objective to provide different incentives to these sectors. These sectors include textile, leather, telecommunications, chemical and transport equipment. From our DOD decomposition technique, we have found some sectors which are constantly growing over last decade in Bangladesh economy as food, basic metal, the renting of machineries and equipment, and manufacturing NEC and recycling sectors. Our findings are in accordance with the ADB report [
54], where they found with descriptive statistics that light engineering sectors as prospective sector for Bangladesh recently. It would be recommended to support these prospective accelerating sectors with financial support and effective policy initiatives, like which is now being providing to the textile and other traditionally important sectors. Bangladesh has little resources to provide these policy supports to key sectors so the Government should be very careful about which sectors should be prioritized. Without an effective national policy to support most promising sectors, Bangladesh might not be able to achieve sustainable development in the near future.
A limitation for analyzing the economic structure in developing countries like Bangladesh is that there are many small firms and a huge informal economy exists, which might not be represented in output growth or GDP calculation. Many small firms did not need to pay tax as they do not have any tax liabilities and use cash-based transactions, so it is quite impossible for statistical organizations to capture their activities. Additionally, Bangladesh has been earning a lot of foreign currency from its expatriate workers. For Bangladesh, remittance is almost two third of export earnings according to the World Bank data for 2020 [
1]. However, as this phenomenon could not be captured by I-O tables, we could not consider this fact in this study. In this paper, we have taken change in output growth to show the transformation of economic structure. In the future, we want to expand our study to analyze change in value added and non-property type income like labor income. Unfortunately, there is data limitation for labor income, which would be essential for the effective decomposition of growth in value added. If more data-enriched input-output table is available for Bangladesh and other developing countries, we can analyze the decomposition of value added using similar methodology.
Previously, countries tried to make policy in an aggregate level. Our proposed technique could identify accelerating sectors over recent time periods. New, promising sectors found from our method, such as basic metal and manufacturing NEC and recycling, are very important for the rapid industrialization of Bangladesh. These sectors could contribute more to economic growth with proper policy supports as they are growing already without any supports. Resources are scarce in Bangladesh and policy-makers have to take prudential decision to provide policy support with limited resources. Our method could be an effective tool for identifying sectors with high growth potential. It might not be possible for Bangladesh to emulate the development strategy of Asian advanced nations, due to its huge uneducated population. Bangladesh should formulate prudent economic policy focusing on its key sectors for ensuring constant growth, facing the challenges of climate related disasters and the huge burden of refugees.


