Abstract
The purpose of this research is to demonstrate the trends of crashes, injuries, and fatalities under the effect of the lockdown and observe the deviation of these trends from the anticipated values that would have been seen without the impact of the lockdown. To that end, data on road collisions, injuries, and fatalities in Bangladesh were compiled over four years (from January 2016 to May 2020) using the dataset from the Accident Research Institute (ARI). The pre-pandemic and lockdown period during the pandemic were included in the selected study period. To compare the observed values of the number of crashes, injuries, and fatalities to the forecasted values, which were meant to show assumed conditions without the emergence of the COVID-19 pandemic, different Autoregressive Integrated Moving Average (ARIMA) time series models were developed for each first-level administrative divisions (Dhaka, Chattogram, Khulna, Barishal, Rajshahi, Sylhet, Rangpur, and Mymensingh). Due to the mobility restrictions, the observed number of collisions, injuries, and deaths remained below the expected values, with a discernible high difference throughout the entire lockdown in Dhaka and Chattogram. In contrast, in the case of other divisions (Khulna, Barishal, Rajshahi, Sylhet, Rangpur, and Mymensingh), it remained under the expected trend for most of the lockdown period but not entirely. The mobility was not eliminated, resulting in a non-zero crash, injury, and fatality records across all divisions. In multiple instances, we observed that actual collision, injury, and fatality rates were higher than expected. Additionally, various divisions exhibited varying patterns of crashes, injuries, and fatalities during stay-at-home orders. Poor performance has been noted in terms of overall road safety during the pandemic era. Given the possibility of future waves of COVID-19 cases and other pandemics, the results of the current study can be used by local authorities and policymakers to improve road safety.
1. Introduction
The COVID-19 pandemic is a prolonged worldwide outbreak of the coronavirus disease 2019 (COVID-19), which is caused by severe acute respiratory syndrome coronavirus 2 (SARS-CoV-2). In December 2019, an outbreak in Wuhan, China, led to the discovery of this new virus [1]. There were attempts to contain it, but they failed, leading the virus to spread to other parts of China and eventually the entire world. The epidemic was declared an international public health emergency on 30 January 2020 and a pandemic on 11 March 2020 by the World Health Organization (WHO) [2]. One of the worst in history, this pandemic has resulted in more than 624 million people affected and 6.56 million confirmed deaths as of 15 October 2022 [3,4].
Most countries have deployed lockdowns to reduce the spread of the virus and potential casualties. Public transit stations and automobiles are regarded as the most prone areas for the transmission of COVID-19 due to the small amount of available space [5]. Since air travel and heavy traffic were two of the main factors driving the spread of the virus, one of the regulations enforced was a restriction on personal movement [6].
At the same time, road accidents are one of the most significant transportation issues, causing material loss, financial losses, human harm, and casualties [7]. According to the WHO, more than 1.35 million people worldwide lose their lives to traffic-related accidents yearly, and up to 50 million people are injured [8]. As the eighth-highest cause of mortality globally and the first significant cause of death for children and young adults between the ages of 5 and 29, road crashes may be seen as a severe yet undervalued global public health issue [8].
The rapid spread of this virus posed a severe concern for Bangladesh, a developing country in South Asia with a high population density [9]. The first national lockdown in Bangladesh, which started on 26 March 2020 and was eventually lifted on 30 May due to economic difficulties, lasted for 66 days. Ambulances, trucks, covered buses, and vehicles conveying drugs, gasoline, and perishable products were the only modes of public transit still operating in the nation [10]. It quickly became apparent that road traffic flow and congestion decreased when people were only allowed to leave the house for specific essential needs. There were predictions that the drop in vehicle traffic volume would lead to fewer highway collisions, fatalities, and injuries, and road users would be less likely to be engaged in collisions due to decreased traffic [11].
The current research is anticipated to add additional information to the increasing body of knowledge about the varied effects of the COVID-19 pandemic on the road safety scenario of Bangladesh. Considering this, the research question to be addressed in this research paper is how the total number of road collisions, fatalities, and injuries were affected due to the COVID-19 pandemic lockdown in different parts of Bangladesh. For this study, we have analyzed the crash statistics of the eight first-level administrative divisions of Bangladesh: Dhaka, Chattogram, Khulna, Barishal, Rajshahi, Sylhet, Rangpur, and Mymensingh.
The above question will provide more insight into the correlation between containment orders and the rate of crashes and accompanying injuries and fatalities. In this way, the study builds on the most recent research, primarily focused on before-and-after comparisons by conducting a time series analysis. As a result, comprehensive explanations and conclusions about road safety statistics in a period when health is at stake and constantly changing are possible, which can aid the decisions made by local authorities and policymakers to improve road safety.
The rest of this paper is structured as follows: Section 2 provides a brief literature review of studies regarding the impact of the COVID-19 pandemic on the number of road collisions, injuries, and fatalities, concentrating on studies that investigated global crash patterns during the pandemic. Next, in Section 3, the relevant theories of time series forecasting analyses are included in the methodological approach, along with the study area description, the source of data, and statistical analysis. Section 4 provides details of the model development and analysis results. Then, based on the results, a discussion on the impact of the COVID-19 pandemic on road traffic crashes, injuries, and fatalities and the associated reasons behind the obtained trends have been presented in Section 5. The last section presents the summary of the findings, recommended policies, and limitations.
2. Literature Review
During the COVID-19 epidemic, several countries implemented varying degrees of restrictions to prevent and monitor the spread of the coronavirus. Factors linked to virus infection risks such as safety and security, sanitation, infection concern, social distancing, passengers wearing face masks, online pre-paid ticket systems, and door-to-door services have been prioritized [12]. These constraints significantly impact peoples’ lives, social connections, and economic situations. For instance, there was a drastic decrease in travel frequency. The number of daily and weekly travels dropped substantially during the epidemic, particularly during the lockdown, including weekends [13,14]. People preferred active modes and cars over public transportation [15]. It was observed that fear of infection and perceived risk affected travel habits, frequency, and mode selection.
Due to the global epidemic’s mobility restrictions, fewer vehicles were on the road than usual, leading to a decline in traffic crashes. In Greece, there was a 41% drop in the total number of traffic fatalities in March 2020, along with 41%, 8%, and 42% drops in the number of fatal, serious, and minor injuries, respectively [16]. According to a study conducted in Tarragona, Spain, there was a reduction in accidents on both urban and interurban roads [17]. According to a study conducted when Louisiana was on lockdown, the stay-at-home order resulted in a 47 percent drop in overall traffic incidents, while accidents involving injury and inattentive drivers fell by 46 and 43 percent, respectively [18]. The at-home order was implemented in Turkey in the middle of March 2020, and a 35% decline in crashes involving death or disability was reported [19]. By analyzing traffic crash statistics of fifteen nations, a reduction in the crash–fatality ratio has been found due to strict law enforcement to ensure restrictions on work and recreational activities during the lockdown [20].
Contrary to the conclusions of these studies, numerous researchers claimed that there was little to no change in crash statistics during the coronavirus epidemic. According to studies on road safety in Nepal during the pandemic, there was less of a decline in fatalities, injuries, and collisions than was initially predicted [21]. The number of traffic fatalities in Northern Ireland was the same as before the epidemic, even with a lower crash rate during the pandemic [22]. While minor injury crashes decreased in Missouri, fatal crash trends remained the same [23]. Additionally, traffic crash fatalities have been rising in numerous ways. According to a study conducted in Alabama, even though vehicle miles traveled and traffic numbers had drastically decreased during the lockdown, there had been an increase in fatalities, major injury crashes, and overall crashes [24]. During the pandemic, an increase in fatality was also reported in Queensland, Australia [25]. The reasons for this poor road safety situation can be attributed to risky maneuvers while driving, drunk driving, and speeding [26,27,28]. In Poland, during the lockdown, although the number of crashes and fatalities decreased, the number of people killed per collision increased when compared to previous years [29].
Regardless of the contributing factors, the restrictive measures taken to stop the community transmission of the coronavirus could have either positive or negative effects on road safety. Therefore, it is essential to investigate how those actions affected the patterns of road traffic crashes. As Bangladesh experienced a drastic reduction in mobility after the announcement of the lockdown in March 2020, it is expected that the accident statistics will change in patterns compared to the pre-pandemic situation. The purpose of this research is to demonstrate the trends of crashes, injuries, and fatalities under the effect of the lockdown and observe the deviation of these trends from the anticipated values that would have been seen without the lockdown. In this research, the ARIMA time series model has been employed to forecast crash patterns for all the administrative zones of Bangladesh.
To the best of our knowledge, most researchers studying the impacts of the pandemic on traffic safety have only used the total crash data for an entire country or state as their data source. In this study, we have identified the crash patterns of the eight administrative zones of Bangladesh during the pandemic lockdown. In addition, in the road safety literature, very few studies have targeted developing countries. This study will be a valuable addition to road safety research by addressing the research gap concerning the traffic safety situation in different zones of a developing country during the pandemic. In addition, this research will help to decide on various policies that need to be implemented during future waves or similar phenomena to keep crash numbers and fatalities to a minimum.
3. Methodology
3.1. Study Area
This study was conducted in Bangladesh, a developing nation in South Asia with a large population. In recent years, the rising frequency and severity of traffic crashes have become a significant concern for researchers and policymakers. Eight first-level administrative divisions (Figure 1) make up Bangladesh as of 2022: Dhaka, Chattogram, Khulna, Barishal, Rajshahi, Sylhet, Rangpur, and Mymensingh [30]. For this study, we analyzed each division individually.
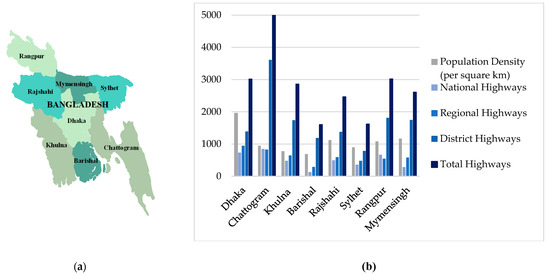
Figure 1.
(a) Divisions of Bangladesh. (b) Population density and road lengths of each division.
Figure 1b shows the estimates of population density per kilometer square, length of the national highway (that links the capital to regional administrative centers, ports on the sea and land, and the Asian highway), regional highway (roads that connect a district’s administrative center, the main river, and land ports without using a national highway), Zilla highways that are also known as district highways (single primary connection to a national or regional highway that travels the shortest distance among district headquarters and subdistrict headquarters), and total road length in terms of kilometers for each administrative zones of Bangladesh [31]. It is apparent that Dhaka has the highest population density, with almost 2000 people per square kilometer. Similarities have been found in Rajshahi, Rangpur, and Mymensingh, where the population density is between 1000 and 1200 people per square kilometer, compared to fewer than 1000 in Chattogram, Khulna, Barishal, and Sylhet.
Chittagong has the highest road length comprising more than 5000 km in terms of total road length. Dhaka and Rangpur account for approximately 3000 km, whereas Khulna, Rajshahi, and Mymensingh range between 2500 and 3000 km. Lastly, Barishal and Sylhet stand at around 1500 km.
3.2. Data Collection and Preparation
The Accident Research Institute (ARI), governed by the Bangladesh University of Engineering and Technology, sourced the data used in this study. In Bangladesh, the most trustworthy and valid source of crash information is the ARI. The obtained dataset included crash reports from January 2016 to May 2020, which was selected as the study period for this investigation. In the dataset, we found columns specifying several pieces of information such as date, number of injuries, number of fatalities, vehicles involved, and administrative division of the crash location.
We have separated the reports based on each administrative division. The final data set included weekly estimates of the total traffic collisions, injuries, and fatalities for each divisional zone. The primary purpose of this divisional approach was to understand the effect of the COVID-19 lockdown on the crash patterns in different regions of the country.
3.3. SARIMA (Seasonal Autoregressive Integrated Moving Average) Model
The Seasonal Autoregressive Integrated Moving Average (SARIMA) model was used to model the data for crash, injury, and fatality of each of the eight divisions. SARIMA is an extension to ARIMA that permits the modeling of the seasonal parameters of the time series. Because of its high efficiency and robust theoretical base, it has been successfully used in intervention-impacted crash pattern analysis [32,33,34,35]. The procedures outlined by Bisgaard and Kulahci, (2011), Box and Jenkins, (1976), and Essi, (2018) were used while analyzing the SARIMA time series [36,37,38]:
- Time Series Decomposition
- Stationarity Test
- ACF and PACF Plots (Autocorrelation and Partial Autocorrelation Plots)
- Seasonal ARIMA modeling (SARIMA Modeling)
- Model Diagnosis
- Test for Error Estimates
- Forecasting
Box and Jenkin introduced the ARIMA (p, d, q) model in 1976, and it is highly advantageous to predict non-seasonal time-series data, mainly stationary time series [33]. The three parameters of the ARIMA model are represented as p = order of autoregressive (AR) term, d = degree of differencing or integration (I), and q = order of moving average (MA) term.
The general mathematical model for ARIMA can be written as follows—
where yt = the observed value at time t in the time series, δ = constant term, φi = i-th autoregressive coefficient (AR), θj is the j-th moving average coefficient (MA), and et = uncorrelated residuals.
In the cases when the dataset exhibits seasonal patterns, the SARIMA (p, d, q) ∗ (P, D, Q)s model could be used by incorporating seasonal fluctuations, (P, D, Q)S, in the ARIMA(p, d, q) model. Here, P = order of seasonal autoregressive (AR) term, D = degree of seasonal differencing or integration (I), and Q = order of seasonal moving average (MA) term.
In the case of time series modeling, the series should be stationary so that it can be modeled with fewer parameters and allows for easy interpretation due to its three properties: constant mean, constant variance, and constant covariance. To check whether the dataset used in this study was stationary, the Augmented Dickey–Fuller (ADF) test was carried out.
The Hyndman-Khandakar approach, which includes unit root tests, minimization of the Akaike information criterion (AIC), and maximum likelihood estimation (MLE), was used to determine the parameters of p, d, and q of the no-seasonal component and P, D, and Q of the seasonal part of the SARIMA model [39]. Based on R programming language packages, this automatic algorithmic search has been developed [40,41].
Attempts have been made to identify the best model with the help of the Akaike information criterion (AIC) and the Bayesian information criterion (BIC), which are frequently employed as a criterion for model selection [42]. The log-likelihood of model fit and the number of independently modified parameters within the model are the foundations of the AIC model selection approach [43]. BIC, another model selection criterion that is based on the likelihood of the tested model, follows the same concept [44]. Better model fit is indicated by lower AIC and BIC values. However, BIC is well known for being more accurate than AIC in stationary autoregressive processes and predicting future values from the observed values [45].
Model diagnostics was performed to inspect the presence of autocorrelation by plotting the residuals, known as residual plots. This can also be accomplished by utilizing the Ljung–Box test for white noise, which explicitly tests for the presence of autocorrelation [46]. The presence of autocorrelation indicates an unfit model, which can be rectified by choosing other orders of AR and/or MA. This trial-and-error process aims to find the simplest model that fits well and has acceptable autocorrelation and seasonality controls.
Following the development of the ARIMA models on the testing and validation sets, the forecasts were assessed using well-known forecasting error estimates including:
- Mean Error (ME)
- Root Mean Squared Error (RMSE)
- Mean Absolute Error (MAE)
- Mean Percentage Error (MPE)
- Mean Absolute Percentage Error (MAPE)
After identifying the best fit SARIMA model using the data of the pre-pandemic period, the values during the pandemic were predicted using the same model parameters (Figure 2).

Figure 2.
Flowchart for ARIMA model development.
4. Results
4.1. Preliminary Analysis
A total of 12,471 road traffic collisions, 20,527 injuries, and 23,111 fatalities were reported throughout the 231-week observation, which spanned from January 2016 to March 2020. The following are the summary statistics (Table 1) for total road traffic collisions, total injuries, and total fatalities throughout the study period by each division.

Table 1.
Total number of crashes, injuries, and fatalities by each division.
The RTC (road traffic collisions/crashes), injury, and fatality statistics for each of the eight divisions are shown in Table 2 by their minimum, mean, median, and maximum values. It is worth noting that the lowest value for crashes in the divisions of Dhaka, Chattogram, Barishal, Rajshahi, and Rangpur was not zero during the lockdown. Additionally, the minimal number of injuries in Dhaka, Barishal, Rajshahi, and Rangpur was not zero. These figures show that, despite the strict restrictions on mobility during the lockdown, the same patterns did not occur in different areas across the country. The most accidents and injuries during lockdown occurred in Dhaka, with 20 and 25, respectively. The highest fatality was recorded in Chattogram, where it was 27.
Table 2.
Summary statistics of RTC, injury, and fatality dataset.
4.2. Basic Time Series Plots
Figure 3 presents the basic time series plots of total RTCs, injuries, and fatalities. There are, in total, 24 time series comprising three variables (RTC, injury, and fatality) for the eight divisions (Dhaka, Chattogram, Khulna, Barishal, Rajshahi, Sylhet, Rangpur, and Mymensingh). From the plots, it is evident that during the lockdown, the number of crashes, injuries, and fatalities experienced a downfall to some degree. However, further analyses are carried out in the following sections to better understand the actual deviation from the anticipated values.

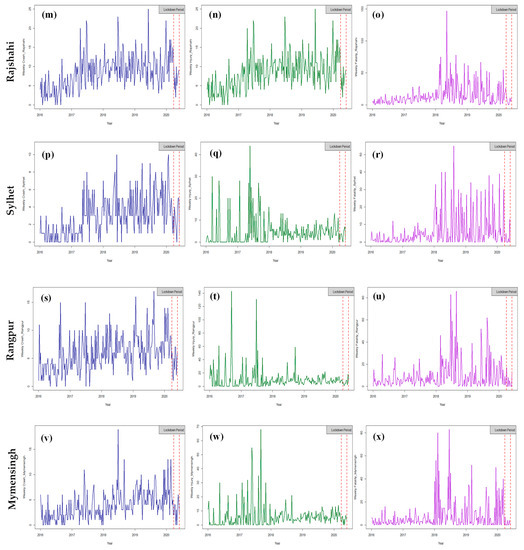
Figure 3.
Time series plot of RTCs, injuries, and fatalities in Dhaka (a–c), Chattogram (d–f), Khulna (g–i), Barishal (j–l), Rajshahi (m–o), Sylhet (p–r), Rangpur (s–u), and Mymensingh (v–x).
4.3. Test of Stationarity
ARIMA modeling requires that the data to be stationary, so that mean and variance do not change over time. Hence, the data were required to be tested to confirm stationarity. In this study, we utilized the Augmented Dickey—Fuller test. The hypothesis of the ADF test states that stationarity is confirmed at a p-value less than 0.05. We conducted the test for each time series—crash, fatality, and injury for the eight zones. We found that in the case of crash and fatality, all the time series were non-stationary as they exhibited p-values larger than 0.05 in all eight divisions. However, the injury time series were stationary in all the zones except Chattogram and Khulna.
Non-stationary time series can be converted into stationary time series with the help of differencing. We applied first-order differencing to all the non-stationary time series mentioned above. After the first-degree differencing, the ADF test was conducted again on the differenced time series. This time all the previously non-stationary time series showed p-values less than 0.05. Hence, at this stage, we can conclude that all the time series were stationary, and no further differencing was required. Finally, the data was ready for the next steps of modeling.
4.4. Fitting Time Series Models (ACF/PACF PLOTS)
Figure 4, Figure A2, Figure A3, Figure A4, Figure A5, Figure A6 and Figure A7 (see Appendix A) illustrate the ACF and PACF plots for the RTC, injury, and fatality time series before and after first-order differencing for all the zones. In the case of the ACF and PACF plots for the injury time series of the zones Dhaka (Figure 4c,d), Khulna (Figure A2c,d), Barishal (Figure A3c,d), Sylhet (Figure A5c,d), Rangpur (Figure A6c,d), and Mymensingh (Figure A7c,d), the ACF plots have dropped off to zero quickly, which indicates the stationary nature of the data.

Figure 4.
ACF and PACF plots of RTCs (a,b), injuries (c,d), and fatalities (e,f) in Dhaka.
4.5. Model Selection
We employed an automated technique to identify the best ARIMA model components. This automated approach was accomplished by the auto.arima() function in the forecast package for Rstudio software (Version 3, Joseph J. Allaire, Vienna, Austria) [41]. This algorithm repeatedly evaluates alternative ARIMA models to find the one with the lowest AIC or BIC, applying several constraints to prevent convergence issues. For our model, we prespecified d = 1 (to induce stationarity) in the cases where it was necessary. In addition, we used D = 1 (due to seasonality) values as we identified seasonality associated with the time series in all 24 cases. However, we allowed the algorithm to choose the most suitable values for p, q, P, and Q. Table 3 shows the model selected for each division concerning the total number of crashes, injuries, and fatalities, along with the AIC and BIC values. In addition, Table 4 shows each selected model’s error estimates (ME, RMSE, MAE).
Table 3.
Model Parameters.
Table 4.
Error Estimates of the Selected Models.
4.6. Model Diagnostics
In this section of model diagnosis, we conducted the Ljung—Box test. In all the cases, the p-values were greater than 0.05, and the null hypothesis was not rejected for the Ljung–Box test. Hence, we concluded that the selected models were a good fit having no residual correlations.
4.7. Forecasting
Figure 5, Figure 6, Figure 7, Figure 8, Figure 9, Figure 10, Figure 11 and Figure 12 show the forecasted plots, which are the outcomes of this study (the clear global images can be found in the supplementary material). In the plots, the red line indicates the fitted plots, the green line shows the forecasted values that would have occurred if there was no pandemic lockdown, and the blue line indicates the accrual values. After the diagnostic test, the models were fitted for the pre-lockdown period (221 weeks). Then, the pandemic’s lockdown period (10 weeks) was projected and compared to actual values.

Figure 5.
Fitted plot of (a) crash, (b) injury, and (c) fatality cases with predicted values for Dhaka.
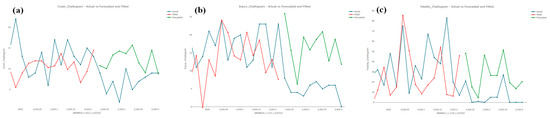
Figure 6.
Fitted plot of (a) crash, (b) injury, and (c) fatality cases with predicted values for Chattogram.
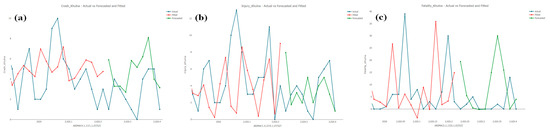
Figure 7.
Fitted plot of (a) crash, (b) injury, and (c) fatality cases with predicted values for Khulna.

Figure 8.
Fitted plot of (a) crash, (b) injury, and (c) fatality cases with predicted values for Barishal.
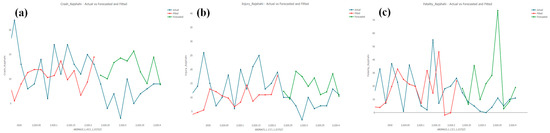
Figure 9.
Fitted plot of (a) crash, (b) injury, and (c) fatality cases with predicted values for Rajshahi.
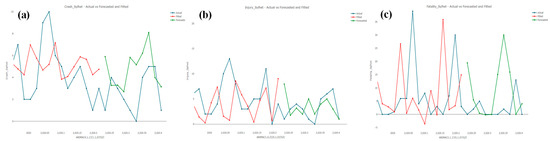
Figure 10.
Fitted plot of (a) crash, (b) injury, and (c) fatality cases with predicted values for Sylhet.
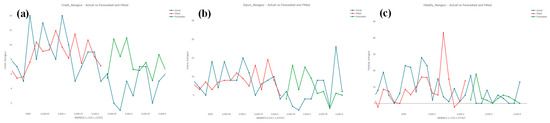
Figure 11.
Fitted plot of (a) crash, (b) injury, and (c) fatality cases with predicted values for Rangpur.
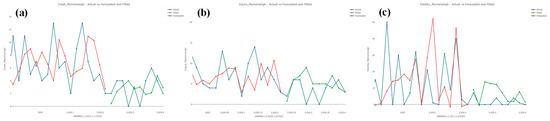
Figure 12.
Fitted plot of (a) crash, (b) injury, and (c) fatality cases with predicted values for Mymensingh.
In Dhaka and Chattogram, the number of crashes, injuries, and fatalities did not exceed the predicted values throughout the lockdown period. The recorded numbers of injuries and fatalities in Khulna, Sylhet, and Rangpur were higher than expected near the conclusion of the lockdown, even though the crash numbers were lower during that time. Although the crash and injury rates in Barishal were higher about three weeks before the suspension of the containment order, both expected and actual values were identical in the last week. The projected crash and injury values in Rajshahi only coincided with the actual levels in the lockdown’s last week. However, the number of fatalities was more than expected. About two weeks before the lockdown ended in Mymensingh, the number of crashes, injuries, and fatalities surpassed the anticipated numbers.
5. Discussion
The primary findings of this study are addressed in this section. In this study, we utilized the seasonal ARIMA models to forecast the expected conditions without the impact of the COVID-19 pandemic throughout the containment order period. It should be clear that the forecasted values derived from the models would have been seen without the COVID-19 pandemic. The predicted values were then compared to the actual data (i.e., number of road collisions, injuries, and fatalities) for each first-level administrative division of Bangladesh. Thus, a significant accomplishment of the current study is that time series were modeled to examine how the COVID-19 epidemic has affected road safety in Bangladesh.
We have discussed the key findings of the results based on the four scenarios in the following:
Positive impacts of lockdown: According to the findings, crash statistics were positively impacted by the containment measures (lockdown). The observed number of collisions, injuries, and fatalities stayed below the projected values, with a noticeably high differences throughout the confinement period in the Dhaka and Chattogram divisions. In the other divisions (Khulna, Barishal, Rajshahi, Sylhet, Rangpur, and Mymensingh), the crash, injury, and fatality numbers remained below the predicted values for the majority of the lockdown period. The primary justification for such a finding is the correlation between decreased mobility and a drop in crash incidences, confirmed by numerous studies conducted worldwide, including Bangladesh [17,47,48].
Non-zero crash statistics: The non-zero crash statistics indicate the presence of mobility during the lockdown. A study in Bangladesh revealed that around 50% of the population choose not to stay at home or isolate themselves as per the order from the government, with around 4.5% of people reported traveling every day [14,49,50]. Hence, it is evident that mobility was not reduced as much as it should have been under the effect of the containment order. Even the law enforcers reported continuous struggle to contain people at home during lockdown even after regular patrolling [51]. The reason for this is that people went through several financial challenges in the form of an increase in the cost of daily necessities, loss of employment and income, reduced food intake, and so on [49,52]. Furthermore, the government of Bangladesh did not provide any official financial support to the people in need to support their stay-at-home period. The people of Bangladesh generally rely less on the government and have better expertise in surviving natural calamities. As a result, people chose to go out and earn as much as possible to support their families. Hence, people maintained a considerable level of mobility which was the root cause of non-zero crashes, injuries, and fatalities throughout the country during the lockdown.
Observed values exceeding the forecasts: In many cases, we observed a higher observed number of crashes (Barishal and Mymensingh), injuries (Khulna, Barishal, Sylhet, Rangpur, and Mymensingh), and fatalities (Khulna, Rajshahi, Rangpur, and Mymensingh) when compared to the predicted values which represents the situation without the impact of the pandemic. This finding can be attributed to the high driving speed adopted by the drivers. The reduced mobility resulting from the containment order induced a sense of safety among the drivers and allowed them to speed [22,53]. Hence, they are more likely to adopt high speeds, particularly unsafe ones, which leads to high crash occurrences. Numerous studies have been conducted in different countries such as Malaysia, Qatar, the USA, and Japan. These studies have documented a rise in speed-related crashes causing injury and fatality during the pandemic, which reinforces the findings of our study [23,34,54,55]. In Poland, researchers have analyzed each traffic zone with a specific speed limit [29]. Reports showed that during the lockdown, the area with a speed limit of 60 kmph, 70 kmph, and 90 kmph experienced a rise in the number of crashes by 58%, 15%, and 27%, respectively [29].
In addition, the Bangladesh government allowed the reopening of the markets and shopping centers on 10 May 2020, approximately three weeks ahead of 30 May 2022 (the official closure of the stay-at-home order nationwide) [56]. This could be why an increase in the crash, injury, and fatality statistics was recorded in six divisions (Khulna, Barishal, Rajshahi, Sylhet, Rangpur, and Mymensingh) out of the eight throughout the final three weeks of lockdown.
Dissimilar crash patterns among different zones: One of the key findings is the unique patterns of crashes, injuries, and fatalities in each district. For example, in Dhaka and Chattogram, the observed values were less than the predicted values throughout the lockdown; in other divisions, the actual values surpassed the predicted values at different times. The reason for this can be attributed to the presence of a large amount of built-up areas in the Dhaka and Chattogram zones. A study in Poland showed that the crash share significantly increased by 27% in built-up areas [29]. In addition, in the latter case, the timings of a particular pattern (actual numbers being higher or lower than the forecasts) for one division did not match the timing of other zones. For example, in the Khulna, Sylhet, and Rangpur divisions, the actual values of injury and fatality were higher than the predicted values near the end of the lockdown. However, in the Mymensingh division, the injury and fatality values were higher than the anticipated numbers about two weeks before the endpoint of the lockdown. These dissimilarities in patterns can be attributed to the unequal response to COVID-19 countermeasures imposed by the government [57]. Additionally, each zone has a different population density and road length from another zone, which may contribute to a variable mobility rates and varied crash patterns.
6. Conclusions
This study contributes to the lack of studies on crashes during the COVID-19 pandemic lockdown in developing countries like Bangladesh. The findings convincingly illustrated the effects of the pandemic on the overall crash, injury, and fatality figures during a lockdown. To conduct this study, we have utilized seasonal ARIMA models. The study area of Bangladesh has been divided into eight first-level administrative divisions. The time series models (Seasonal ARIMA) for each division’s crash, injury, and fatality numbers were developed, totaling twenty-four cases. We compared the predicted values in the outcome, considering a no lockdown situation with the actual values.
The results obtained from this study have demonstrated crucial information regarding the road safety situation in Bangladesh during the lockdown. In the divisions of Dhaka and Chattogram, the observed number of collisions, injuries, and deaths remained below the expected values, with a discernible high difference throughout the entire containment duration. In contrast, in the case of the other divisions (Khulna, Barishal, Rajshahi, Sylhet, Rangpur, and Mymensingh), it remained so for most of the lockdown period. The drastic drop in mobility was found to be associated with such outcomes. However, people made trips for different purposes, neglecting the government order. As a result, the mobility was not reduced to zero resulting in non-zero crash, injury, and fatality records throughout all the divisions. In several cases, we confirmed higher actual values of crashes, injuries, and fatalities compared to the predicted values indicating a situation without the confinement order. This is primarily due to the high and unsafe driving speeds adopted by the drivers due to less traffic on the road. Furthermore, different divisions have experienced different responses to the COVID-19 measures, resulting in a dissimilar crash, injury, and fatality patterns in the different divisions.
6.1. Policy Recommendation
6.1.1. Maintaining Safe Speed
Although Bangladesh has a set of laws governing speed limits, they are not strictly adhered to, and exceeding the speed limit when driving is quite prevalent. On highways, the maximum speed limit is 80 km/h in Bangladesh. According to studies, lowering the speed limit from 90 km/h to 70 km/h can minimize fatal crashes by one-third [58]. Hence, the speed limit should be set at no more than 70 km/h to promote road safety during the pandemic phase, primarily when mobility is restricted. Furthermore, to achieve an advanced level of safety and efficiency, the speed limit can be implied based on traffic situation and type of roadway. For example, in Poland, to tackle the issues associated with traffic safety, the authorities have imposed speed limits of 120 kmph, 110 kmph, 80 kmph, and 50 kmph in expressways, carriageways, outside built-up areas, and inside built-up areas, respectively, during the containment period of the pandemic [59]. This legislation should be adequately enforced in Bangladesh to achieve the desired degree of safety.
6.1.2. Pedestrian Safety
As a result of the global epidemic, there were fewer vehicles on the roads, which caused traffic to move faster and pedestrians to be tempted to cross the road against the traffic laws. This is the root cause of the surge in pedestrian crashes during the lockdown in several parts of the world [60,61]. Lowering the speed limit, as suggested in the previous section, can aid in reducing pedestrian-related collisions during the pandemic [59]. Furthermore, the government can utilize ITS systems and sidewalk extensions to enhance pedestrian safety during a pandemic or other exceptional traffic conditions [61].
6.1.3. Financial Support from the Government
During the pandemic, people in Bangladesh have not received any financial support from the government or other organizations. People whose income is most affected during economic disturbances should receive financial help from their employers or the government. They will undoubtedly feel more financially secure using this approach, and positive mental health can be ensured. This proposition will help in avoiding unsafe driving practices [62].
6.1.4. Safety Campaign
It is unpredictable how the epidemic may affect road safety. Large-scale campaigns and seminars can be planned to improve societal acceptability by promoting awareness of the possible road safety hazards (such as speeding) that could occur during the pandemic or any situation comparable to the pandemic [63]. This strategy may be quite helpful in controlling and improving travel behavior, especially within a short period.
6.2. Limitation
Finally, as a part of the limitation of our study, the outcomes were restricted to some degree because the dataset lacked some crucial information. The age of the driver, the mental health condition of the driver, the outside weather situation, the condition of the vehicle and road, the prevalence of drugs or alcohol, and other factors were all unknown. Due to the unavailability of such records, the effects of driving and environmental factors in crash occurrences cannot be brought to light. Furthermore, animal–vehicle collision is an important factor to be considered both for Bangladesh and other countries of the world [64,65]. In future research, the impact of containment strategies on animal–vehicle collisions can be addressed.
Supplementary Materials
The following supporting information can be downloaded at: https://www.mdpi.com/article/10.3390/su15032675/s1, global adjustment and clear images.
Author Contributions
Conceptualization, S.I., A.S.H. and S.H.I.; methodology, S.I.; software, S.I.; validation, S.I.; formal analysis, S.I.; investigation, S.I.; resources, A.S.H.; data curation, S.I.; writing—original draft preparation, S.I., R.S.T. and S.H.I.; writing—review and editing, S.I., A.S.H., R.S.T. and S.H.I.; visualization, S.I.; supervision, A.S.H. and S.I.; project administration, A.S.H. and S.I.; funding acquisition, S.I., A.S.H., R.S.T. and S.H.I. All authors have read and agreed to the published version of the manuscript.
Funding
This research received partial funding from Bangladesh University of Business and Technology.
Institutional Review Board Statement
Not applicable.
Informed Consent Statement
Not applicable.
Data Availability Statement
The data presented in this study are available on request from the corresponding author.
Acknowledgments
Authors would like to acknowledge the Accident Research Institute (ARI), BUET for providing the dataset required for conducting this study.
Conflicts of Interest
The authors declare no conflict of interest.
Appendix A

Figure A1.
ACF and PACF plots of RTCs (a,b), injuries (c,d), and fatalities (e,f) of Chattogram.
Figure A1.
ACF and PACF plots of RTCs (a,b), injuries (c,d), and fatalities (e,f) of Chattogram.


Figure A2.
ACF and PACF plots of RTCs (a,b), injuries (c,d), and fatalities (e,f) of Khulna.
Figure A2.
ACF and PACF plots of RTCs (a,b), injuries (c,d), and fatalities (e,f) of Khulna.


Figure A3.
ACF and PACF plots of RTCs (a,b), injuries (c,d), and fatalities (e,f) of Barishal.
Figure A3.
ACF and PACF plots of RTCs (a,b), injuries (c,d), and fatalities (e,f) of Barishal.


Figure A4.
ACF and PACF plots of RTCs (a,b), injuries (c,d), and fatalities (e,f) of Rajshahi.
Figure A4.
ACF and PACF plots of RTCs (a,b), injuries (c,d), and fatalities (e,f) of Rajshahi.


Figure A5.
ACF and PACF plots of RTCs (a,b), injuries (c,d), and fatalities (e,f) of Sylhet.
Figure A5.
ACF and PACF plots of RTCs (a,b), injuries (c,d), and fatalities (e,f) of Sylhet.


Figure A6.
ACF and PACF plots of RTCs (a,b), injuries (c,d), and fatalities (e,f) of Rangpur.
Figure A6.
ACF and PACF plots of RTCs (a,b), injuries (c,d), and fatalities (e,f) of Rangpur.


Figure A7.
ACF and PACF plots of RTCs (a,b), injuries (c,d), and fatalities (e,f) of Mymensingh.
Figure A7.
ACF and PACF plots of RTCs (a,b), injuries (c,d), and fatalities (e,f) of Mymensingh.

References
- Jiang, S.; Du, L.; Shi, Z. An Emerging Coronavirus Causing Pneumonia Outbreak in Wuhan, China: Calling for Developing Therapeutic and Prophylactic Strategies. Emerg. Microbes Infect. 2020, 9, 275–277. [Google Scholar] [CrossRef] [PubMed]
- WHO-Convened Global Study of Origins of SARS-CoV-2: China Part. Available online: https://www.who.int/publications/i/item/who-convened-global-study-of-origins-of-sars-cov-2-china-part (accessed on 20 October 2022).
- The Pandemic’s True Death Toll | The Economist. Available online: https://www.economist.com/graphic-detail/coronavirus-excess-deaths-estimates (accessed on 20 October 2022).
- Dong, E.; Du, H.; Gardner, L. An Interactive Web-Based Dashboard to Track COVID-19 in Real Time. Lancet Infect. Dis. 2020, 20, 533–534. [Google Scholar] [CrossRef] [PubMed]
- Musselwhite, C.; Avineri, E.; Susilo, Y. Editorial JTH 16—The Coronavirus Disease COVID-19 and Implications for Transport and Health. J. Transp. Health 2020, 16, 100853. [Google Scholar] [CrossRef] [PubMed]
- Wu, J.T.; Leung, K.; Leung, G.M. Nowcasting and Forecasting the Potential Domestic and International Spread of the 2019-NCoV Outbreak Originating in Wuhan, China: A Modelling Study. Lancet 2020, 395, 689–697. [Google Scholar] [CrossRef]
- Sekadakis, M.; Katrakazas, C.; Michelaraki, E.; Kehagia, F.; Yannis, G. Analysis of the Impact of COVID-19 on Collisions, Fatalities and Injuries Using Time Series Forecasting: The Case of Greece. Accid. Anal. Prev. 2021, 162, 106391. [Google Scholar] [CrossRef]
- Road Traffic Injuries. Available online: https://www.who.int/news-room/fact-sheets/detail/road-traffic-injuries (accessed on 20 October 2022).
- Islam, S.; Islam, R.; Mannan, F.; Rahman, S.; Islam, T. COVID-19 Pandemic: An Analysis of the Healthcare, Social and Economic Challenges in Bangladesh. Prog. Disaster Sci. 2020, 8, 100135. [Google Scholar] [CrossRef]
- Bangladesh Imposes Total Lockdown over COVID-19. Available online: https://www.aa.com.tr/en/asia-pacific/bangladesh-imposes-total-lockdown-over-covid-19/1778272 (accessed on 20 October 2022).
- Catchpole, J.; Naznin, F. Impact of COVID-19 on Fatal Crashes in Australia. In Journal of Integrated Mobility: New Knowledge Applications in Australasian Transport; ARRB Group Limited: Port Melbourne, Australia, 2020. [Google Scholar]
- Abdullah, M.; Dias, C.; Muley, D.; Shahin, M. Exploring the Impacts of COVID-19 on Travel Behavior and Mode Preferences. Transp. Res. Interdiscip. Perspect. 2020, 8, 100255. [Google Scholar] [CrossRef]
- Zhang, N.; Jia, W.; Wang, P.; Dung, C.H.; Zhao, P.; Leung, K.; Su, B.; Cheng, R.; Li, Y. Changes in Local Travel Behaviour before and during the COVID-19 Pandemic in Hong Kong. Cities 2021, 112, 103139. [Google Scholar] [CrossRef]
- Iqra, S.H.; Islam, S.; Huq, A. Factors Affecting Mobility Patterns during Official Lockdown Period in Bangladesh: A Case of COVID-19. J. Transp. Health 2021, 22, 101163. [Google Scholar] [CrossRef]
- de Vos, J. The Effect of COVID-19 and Subsequent Social Distancing on Travel Behavior. Transp. Res. Interdiscip. Perspect. 2020, 5, 100121. [Google Scholar] [CrossRef]
- Katrakazas, C.; Michelaraki, E.; Sekadakis, M.; Yannis, G. A Descriptive Analysis of the Effect of the COVID-19 Pandemic on Driving Behavior and Road Safety. Transp. Res. Interdiscip. Perspect. 2020, 7, 100186. [Google Scholar] [CrossRef]
- Saladié, Ò.; Bustamante, E.; Gutiérrez, A. COVID-19 Lockdown and Reduction of Traffic Accidents in Tarragona Province, Spain. Transp. Res. Interdiscip. Perspect. 2020, 8, 100218. [Google Scholar] [CrossRef]
- Barnes, S.; Beland, L.-P.; Huh, J.; Kim, D.; Barnes, S.; Beland, L.-P.; Huh, J.; Kim, D. The Effect of COVID-19 Lockdown on Mobility and Traffic Accidents: Evidence from Louisiana; Global Labor Organization (GLO): Essen, Germany, 2020. [Google Scholar]
- COVID-19 Lockdowns and Decline in Traffic Related Deaths and Injuries | IZA—Institute of Labor Economics. Available online: https://www.iza.org/publications/dp/13278/covid-19-lockdowns-and-decline-in-traffic-related-deaths-and-injuries (accessed on 24 October 2022).
- Gupta, M.; Pawar, N.M.; Velaga, N.R. Impact of Lockdown and Change in Mobility Patterns on Road Fatalities during COVID-19 Pandemic. Transp. Lett. 2021, 13, 447–460. [Google Scholar] [CrossRef]
- Sedain, B.; Pant, P.R. Road Traffic Injuries in Nepal during COVID-19 Lockdown. F1000Research 2021, 9, 1209. [Google Scholar] [CrossRef]
- Vandoros, S.; Papailias, F. Empty Streets, Speeding and Motor Vehicle Collisions during COVID-19 Lockdowns: Evidence from Northern Ireland. MedRxiv 2021. [Google Scholar] [CrossRef]
- Qureshi, A.I.; Huang, W.; Khan, S.; Lobanova, I.; Siddiq, F.; Gomez, C.R.; Suri, M.F.K. Mandated Societal Lockdown and Road Traffic Accidents. Accid. Anal. Prev. 2020, 146, 105747. [Google Scholar] [CrossRef]
- Adanu, E.K.; Brown, D.; Jones, S.; Parrish, A. How Did the COVID-19 Pandemic Affect Road Crashes and Crash Outcomes in Alabama? Accid. Anal. Prev. 2021, 163, 106428. [Google Scholar] [CrossRef]
- Catchpole, J.; Naznin, F. Impact of COVID-19 on Road Crashes in Australia. In Australian Road Research Board; ADVI: Sydney, Australia, 2020; pp. 1–8. [Google Scholar]
- Vingilis, E.; Beirness, D.; Boase, P.; Byrne, P.; Johnson, J.; Jonah, B.; Mann, R.E.; Rapoport, M.J.; Seeley, J.; Wickens, C.M.; et al. Coronavirus Disease 2019: What Could be the Effects on Road Safety? Accid. Anal. Prev. 2020, 144, 105687. [Google Scholar] [CrossRef]
- Chand, S.; Yee, E.; Alsultan, A.; Dixit, V.V. A Descriptive Analysis on the Impact of COVID-19 Lockdowns on Road Traffic Incidents in Sydney, Australia. Int. J. Environ. Res. Public Health 2021, 18, 11701. [Google Scholar] [CrossRef]
- Prasetijo, J.; Zhang, G.; Jawi, Z.M.; Mahyeddin, M.E.; Zainal, Z.F.; Isradi, M.; Muthukrishnan, N. Crash Model Based on Integrated Design Consistency with Low Traffic Volumes (Due to Health Disaster (COVID-19)/Movement Control Order). Innov. Infrastruct. Solut. 2021, 6, 22. [Google Scholar] [CrossRef]
- Bajor, M. Basic Statistics of Road Safety in Poland during the Mobility Restrictions due to the Coronavirus Pandemic. Analysis Period: 16 March–20 April 2020. Years 2015–2020; Poland, 2020. [Google Scholar]
- Divisions of Bangladesh. Wikipedia. Available online: https://en.wikipedia.org/wiki/Divisions_of_Bangladesh (accessed on 9 November 2022).
- Roads and Highways, Bangladesh. RHD Zone, Circle and Division-wise Road Length (km) Roads and Highways Department, Bangladesh; 2022. Available online: https://www.rhd.gov.bd/Documents/RHD_Zone_Circle_Divisionwise_Road_Length.pdf (accessed on 9 November 2022).
- Sekadakis, M.; Katrakazas, C.; Michelaraki, E.; Kehagia, F.; Yannis, G. Analysis of the Impact of COVID-19 on Collisions, Fatalities and Injuries Using Time Series Forecasting: The Case of Greece. Accid. Anal. Prev. 2021, 162. [Google Scholar] [CrossRef] [PubMed]
- Hossain, A. Intervention Time Series Approach in Rumble Strips Study. 2020.
- Inada, H.; Ashraf, L.; Campbell, S. COVID-19 Lockdown and Fatal Motor Vehicle Collisions Due to Speed-Related Traffic Violations in Japan: A Time-Series Study. Injury Prevention 2021, 27, 98–100. [Google Scholar] [CrossRef] [PubMed]
- Hossain, A.; Rahman, A.; Associate, R.; Sun, X. Roadway Crash Trend Analysis with Innovative Trend Analysis and Mann-Kendall Test. 2022. [Google Scholar] [CrossRef]
- Bisgaard, S.; Kulahci, M. Time Series Analysis and Forecasting by Example; John Wiley & Sons: Hoboken, NJ, USA, 2011; Volume 366. [Google Scholar]
- Box, G.E.P.; Jenkins, G.M.; Reinsel, G.C.; Ljung, G.M. Time Series Analysis: Forecasting and Control, 5th ed.; Wiley: Hoboken, NJ, USA, 2015. [Google Scholar]
- Wiri, L.; Essi, I.D. Seasonal Autoregressive Integrated Moving Average (SARIMA) Modelling and Forecasting of Inflation Rates in Nigerian (2003–2016). Int. J. Appl. Sci. Math. Theory 2018, 2, 16–28. [Google Scholar] [CrossRef]
- Hyndman, R.; Athanasopoulos, G. Forecasting: Principles and Practice; OTexts: Melbourne, Australia, 2018. [Google Scholar]
- R Core Team. R: A Language and Environment for Statistical Computing; R Core Team: Vienna, Austria, 2021. [Google Scholar]
- Hyndman, R.J.; Khandakar, Y. Automatic Time Series Forecasting: The Forecast Package for R. J. Stat. Softw. 2008, 27, 1–22. [Google Scholar] [CrossRef]
- Mohammed, E.A.; Naugler, C.; Far, B.H. Emerging Business Intelligence Framework for a Clinical Laboratory Through Big Data Analytics. In Emerging Trends in Computational Biology, Bioinformatics, and Systems Biology: Algorithms and Software; Tools, 2015; pp. 577–602. [Google Scholar] [CrossRef]
- Akaike, H. A New Look at the Statistical Model Identification. IEEE Trans. Autom. Control 1974, 19, 716–723. [Google Scholar] [CrossRef]
- Schwarz, G. Estimating the Dimension of a Model. The Annals of Statistics. 1978, 6, 461–464. [Google Scholar] [CrossRef]
- Medel, C.A.; Salgado, S.C. Does the Bic Estimate and Forecast Better than the AIC? Rev. Análisis Económico 2013, 28, 47–64. [Google Scholar] [CrossRef]
- Ljung, G.M.; Box, G.E.P. On a Measure of Lack of Fit in Time Series Models. Biometrika 1978, 65, 297. [Google Scholar] [CrossRef]
- Vandoros, S. COVID-19, Lockdowns and Motor Vehicle Collisions: Empirical Evidence from Greece. Inj. Prev. 2022, 28, 81–85. [Google Scholar] [CrossRef]
- Huq, A.; Islam, S. A Bayesian Structural Time Series Model for Assessing Road Traffic Accidents during COVID-19 Period. In Proceedings of the 6rd International Conference on Civil Structural and Transportation Engineering (ICCSTE’21), Niagara Falls, ON, Canada, 17–19 May 2021; p. 166. [Google Scholar]
- Rahman, M.M.; Khan, S.J.; Sakib, M.S.; Halim, M.A.; Rahman, F.; Rahman, M.M.; Jhinuk, M.J.; Nabila, N.H.; Yeasmin, M.T.M. COVID-19 Responses among General People of Bangladesh: Status and Individual View toward COVID-19 during Lockdown Period. Cogent Psychol. 2021, 8, 1860186. [Google Scholar] [CrossRef]
- Wadood, M.A.; Mamun, A.; Rafi, M.A.; Islam, M.K.; Mohd, S.; Lee, L.L.; Hossain, M.G. Knowledge, Attitude, Practice and Perception Regarding COVID-19 among Students in Bangladesh: Survey in Rajshahi University. MedRxiv 2020, 3, 67–79. [Google Scholar] [CrossRef]
- Bangladesh Police Struggle Enforcing Pandemic Shutdown. Available online: https://www.newagebd.net/article/104228/bangladesh-police-struggle-enforcing-pandemic-shutdown (accessed on 27 November 2022).
- Rahman, M.T.; Akter, S.; Rana, M.R.; Sabuz, A.A.; Jubayer, M.F. How COVID-19 Pandemic Is Affecting Achieved Food Security in Bangladesh: A Perspective with Required Policy Interventions. J. Agric. Food Res. 2022, 7, 100258. [Google Scholar] [CrossRef]
- Alhajyaseen, W.K.M.; Almukdad, A.; Hussain, Q.; Almallah, M.; al Malki, M.A.; Singaravelu, J.; Zammataro, S. Road Safety Status during COVID-19 Pandemic: Exploring Public and Road Safety Expert’s Opinions. Int. J. Inj. Control Saf. Promot. 2021, 29, 135–151. [Google Scholar] [CrossRef]
- Muley, D.; Ghanim, M.S.; Mohammad, A.; Kharbeche, M. Quantifying the Impact of COVID-19 Preventive Measures on Traffic in the State of Qatar. Transp. Policy 2021, 103, 45–59. [Google Scholar] [CrossRef]
- Meyer, M.W. COVID Lockdowns, Social Distancing, and Fatal Car Crashes: More Deaths on Hobbesian Highways? Camb. J. Evid. Based Polic. 2020, 4, 238–259. [Google Scholar] [CrossRef]
- Ahamed, H.; Hasan, K.T.; Islam, M.T.; Galib, F.C. Lockdown Policy Dilemma: COVID-19 Pandemic versus Economy and Mental Health. J. Biomed. Anal. 2020, 3, 37–58. [Google Scholar] [CrossRef]
- Unequal Response to Mobility Restrictions: Evidence from the COVID-19 Lockdown in the City of Bogotá | United Nations Development Programme. Available online: https://www-dev.undp.org/latin-america/publications/unequal-response-mobility-restrictions-evidence-covid-19-lockdown-city-bogot%C3%A1 (accessed on 27 November 2022).
- de Pauw, E.; Daniels, S.; Thierie, M.; Brijs, T. Safety Effects of Reducing the Speed Limit from 90 Km/h to 70 Km/h. Accid. Anal. Prev. 2014, 62, 426–431. [Google Scholar] [CrossRef]
- Bajor, M.; Nawara, E. Basic Statistics of Road Safety in Poland during the Mobility Restrictions due to the Coronavirus Pandemic. Clothoid; Poland, 2020. [Google Scholar]
- Ronald Rosen & Ohr, P.A. COVID Lockdown Led to Rise in Pedestrian Accidents. Available online: https://www.rosenohrlaw.com/blog/lockdown-rise-in-pedestrian-accidents/ (accessed on 29 November 2022).
- Cirianni, F.M.M.; Comi, A.; Luongo, A.S. A Sustainable Approach for Planning of Urban Pedestrian Routes and Footpaths in a Pandemic Scenario. TeMA J. Land Use Mobil. Environ. 2022, 15, 125–140. [Google Scholar] [CrossRef]
- Supporting People and Companies to Deal with the COVID-19 Virus: Options for an Immediate Employment and Social-Policy Response | OECD Policy Responses to Coronavirus (COVID-19) | OECD ILibrary. Available online: https://www.oecd-ilibrary.org/employment/supporting-people-and-companies-to-deal-with-the-covid-19-virus-options-for-an-immediate-employment-and-social-policy-response_d33dffe6-en (accessed on 3 November 2022).
- Dermawan, W.B.; Nusraningrum, D. Road Safety Campaigns to Reduce Traffic Accidents for Young Road Users. ICCD 2019, 2, 601–606. [Google Scholar] [CrossRef]
- Kabir, M.A. Fate of Animals on Road in Bangladesh. J. Dairy Vet. Anim. Res. 2018, 7, 167–169. [Google Scholar] [CrossRef]
- Krukowicz, T.; Firlag, K.; Chrobot, P. Spatiotemporal Analysis of Road Crashes with Animals in Poland. Sustainability 2022, 14, 1253. [Google Scholar] [CrossRef]


Disclaimer/Publisher’s Note: The statements, opinions and data contained in all publications are solely those of the individual author(s) and contributor(s) and not of MDPI and/or the editor(s). MDPI and/or the editor(s) disclaim responsibility for any injury to people or property resulting from any ideas, methods, instructions or products referred to in the content. |
© 2023 by the authors. Licensee MDPI, Basel, Switzerland. This article is an open access article distributed under the terms and conditions of the Creative Commons Attribution (CC BY) license (https://creativecommons.org/licenses/by/4.0/).