Article

The Acceptance Model of Smart City Service: Focused on Seoul

Department of Architectural Engineering, Kwangwoon University, Seoul 01897, Republic of Korea
Sustainability 2023, 15(3), 2695; https://doi.org/10.3390/su15032695
Submission received: 19 October 2022 / Revised: 17 January 2023 / Accepted: 31 January 2023 / Published: 2 February 2023

Abstract

:
The goal of providing smart city services is not only simply building smart technology and infrastructure but also improving the quality of life of citizens who use smart city services and have positive experiences. This requires establishing service supply strategies considering citizens’ satisfaction levels by identifying the factors that affect the will or behavior of citizens who use smart city services. However, decision making regarding smart city policies and service supply in Korea is conducted through the central government-centered top-down mode, which lacks the consideration of how to improve citizens’ satisfaction levels or their intention to use technology. Thus, we proposed an acceptance model for smart city services, which is a theoretical model that offers a foundation for a model to evaluate the interaction levels of citizens toward smart city services based on the technology acceptance model, which is the most widely used tool to evaluate what factors affect the acceptance and use of information technology and system-based services. In addition, we defined research models by discussing previous studies that proposed factors that affect the acceptance of smart city and U-City services and urban public services. To empirically verify the research models proposed herein, we surveyed citizens in Seoul and conducted structural equation modeling using AMOS 28. As a result, we derived a total of eight factors (Quality, User Characteristics, Positive Attitude, Perceived Risk, Social Influence, Perceived Ease of Use, Perceived Usefulness, and Acceptance Intention) that affected the acceptance of smart city services and 42 assessment items from these factors. The results of this study are expected to be foundational data for establishing policies and systems for the improvement of citizens’ interaction level and continuous use of smart city services.

1. Introduction

With the rapidity of global urbanization, smart cities are being evaluated as a key element to ensure competitiveness at the national level, such as by solving urban problems and improving citizens’ quality of life. In recent years, smart city functionality has only been applied in new towns. However, providing smart city services is expanding to solve urban problems in combination with state-of-the-art technologies in various fields including safety, behavior, and transport, even targeting existing cities since 2017.
According to the International Telecommunication Union [1], the smart city concept has 116 various definitions, which vary between countries and industries and have multiple meanings. However, its unified common definition is a city that provides services and platforms to solve urban problems and improve quality of life using advanced technologies such as information and communication technology (ICT) and the Internet of Things (IoT). In Korea, smart city services are defined as those that collect information about a city’s main functions such as administration, transportation, welfare, environment, and preventing and managing disasters; in addition, it provides collected information either as is or integrated, through smart city infrastructure, etc. under Subparagraph 2, Article 2 in the Enforcement Decree of the Act on the Promotion of Smart City Development, and Industry [2].
Meanwhile, compared to the maturity of smart city technologies and services, the interaction level of the smart city technologies and services felt by citizens is always low, which is a limitation. This is because most smart-city-related policies and projects so far have been conducted through a top-down mode centered on central and local governments. Since policies and projects have focused on technical achievements or building infrastructure and intensively tackled problems at the national level, services considering the interaction level felt by citizens or the improvement of the intention to use technology are not sufficiently provided. According to the Korea Agency for Infrastructure Technology Advancement (KAIA) [3], smart technologies, facilities, care, etc. must be built to successfully implement smart city services, but such services that are not wanted by or interact with citizens will ultimately be turned away and regarded as useless. Thus, the KAIA stressed that improving the interaction level felt by citizens is important, and this can be conducted by identifying the problems through the direct use of citizens and implementing a transparent resolution process.
U-City before smart city refers to a city that provides ubiquitous city services that are needed anytime and anywhere through ubiquitous urban infrastructure built with communication as the main technology for new city development [4]. Beak [5] compared and analyzed U-City and Smart City in terms of Business Perspective, Technological Perspective, and User Perspective. In this study, a smart city is not limited to infrastructure construction and technology development but aims to provide services to solve urban problems and improve the quality of life of citizens by grafting cutting-edge technology to existing cities. The difference between a U-city and a smart city is that citizens of smart cities are active participants who play a leading role, not passive customers. In other words, U-Cities and smart cities are similar in that they apply new technologies to cities, but there is a difference in the importance of citizen participation.
The European Commission analyzed successful elements of smart city communities in around 300 nations, and their analysis results derived the ‘citizens’ as the most key element [6]. That is, the citizenry, which is one of the main components of smart cities, is the reason and purpose for the smart city’s existence. Thus, services that consider citizens should be derived and active participation is absolutely needed. Cohen [7] categorized smart city development largely into three phases. Most smart cities were converted into consumer-centered services until 2015, which was a stage to create services where citizens participated and interacted with the cooperation of public and private sectors. Furthermore, smart cities were defined as urban platforms as a kind of social innovation system, using the fact that citizens themselves defined and solved problems and shared in the benefits. It is essential to provide smart city services by considering the interactivity of citizens to solve urban problems and improve citizens’ quality of life, which are the ultimate goals of smart cities.
According to the research result of analyzing the research trends of the papers registered since 2017, when smart city was used as a legal term in earnest, smart city theory and concept research was the largest (63.5%, 109 papers), and the evaluation index for smart cities was only 2% (7 papers) for the past three years [8]. In the author’s previous study [9], because of adding and analyzing the research trends for 2020 and 2021 under the same conditions as the above studies, the number of studies on smart city evaluation indicators increased, but it was still low at 4.2% (10 papers).
The research trend also shows that the analysis study results [10] of 11,527 keywords in papers whose subject was smart cities in both Korea and other countries in 2000–2020, which was determined by referring to global academic paper data, exhibited that the ‘service’ keyword had the largest proportion, and keyword items involving citizen-centric innovation and sustainability such as ‘citizen’, ‘problem’, ‘sustenance’, and ‘approach’ accounted for 22.4%, which was the largest proportion. That is, many studies have been conducted to spread services that are directly related to citizens such as citizen-centric platforms, citizen’s demand analysis, and the citizen participation-type problem-solving Living Lab. Moreover, Jeong [11] comparatively analyzed the promotion of smart cities, finding that the consideration of the sector of smart city service acceptance and sustainability had expanded gradually.
The goal of the development of a new technology is not the end of development, but continuous use. When new information technology is applied in various fields, factors affecting the intention to use are identified, and based on this, an evaluation model is developed and used to establish an introduction plan [12].
The TAM proposed by Davis [13] is a refined model based on the theory of reasoned action (TRA) and theory of planned behavior (TPB) to be made suitable to explain computer use behavior.
TAM defines that ‘Perceived Usefulness’ and ‘Perceived Ease of Use’ for new technology positively or negatively affect ‘Attitude Toward Using’, ‘Behavioral Intention to Use’ is affected by attitude, and intention affects ‘Actual System Use’. And ‘Perceived Usefulness’ and ‘Perceived Ease of Use’ are affected by external factors. Here, the external variables are viewed as the factors that affect the perceived usefulness and perceived ease of use of information technology, the intention to use technology, and behaviors. External variables may vary depending on the type of information technology.
This has been recognized as a simple and highly explanatory model to explain the recipient’s information technology acceptance and use behavior. Since this model is focused on discovering the extent to which the causal relationship between users’ attitudes, intentions, and actual use affects the acceptance process for a specific technology, a large number of subsequent studies have been conducted in Korea and overseas.
Thus, this research, as a foundation to develop an index for evaluating users’ interaction level with smart city services, aims to determine the influencing factors of smart city service acceptance based on the technology acceptance model (TAM), which is the most widely used tool when analyzing influencing factors to adopt and use information technology and system-based services and derive implications by analyzing the influence relationship between the influencing factors of smart city service acceptance and the intention of smart city service acceptance.

2. Material and Methods

Previously, through a review of smart city services and related literature, the necessity of managing the level of citizens’ perceptions of smart city services for a successful smart city was confirmed. Based on these social and academic backgrounds, the research objective was to identify factors that have a significant effect on smart city service use intention and to empirically verify which mechanisms influence those factors on smart city acceptance. The method of data collection and data analysis are as follows.

2.1. Data Collection

We targeted the Seoul region, which is expected to incorporate many smart city services, using the derived assessment items. The subjects of this study were citizens over 20 years old living in Seoul and were expected to have access to smart city services more than any other region. As for the sampling method used in this research, among the probabilistic sampling methods, when the population was divided into several heterogeneous groups, the proportional stratified sampling method was used, which randomly selects a sample according to the proportion of each group. In this research, gender and age were collected at the same rate so that the factors influencing smart city service acceptance and the influence relationship between smart city service acceptance were not affected. The questionnaire consisted of (1) basic information: gender, age; (2) the perception of smart cities (using a 5-point Likert scale); and (3) the perception level of acceptance-influencing factors and the Acceptance Intention of smart city services (using a 5-point Likert scale). The data were collected using survey questionnaires for 12 days from 28 January to 8 February in 2022 through an online survey platform. The statistical characteristics of the respondents from the 450 samples collected are presented in Table 1. It was found that 63.2% of the respondents were aware of the smart city, and for the reliability of the answer, the survey was conducted after sufficiently explaining the definition and field of the smart city service to the respondents.

2.2. Data Analysis

Previous studies that derived the factors that influence acceptance in various fields are discussed based on technology-acceptance-related theories and TAM, thereby deriving what factors affect the acceptance of smart city services and factors’ assessment items. Additionally, we define the main factors that affect smart city service acceptance through exploratory factor analysis, and the smart city service acceptance model is defined based on the TAM. The proposed smart city service acceptance model is empirically verified through structural equation modeling (SEM) using AMOS 28.

3. Results

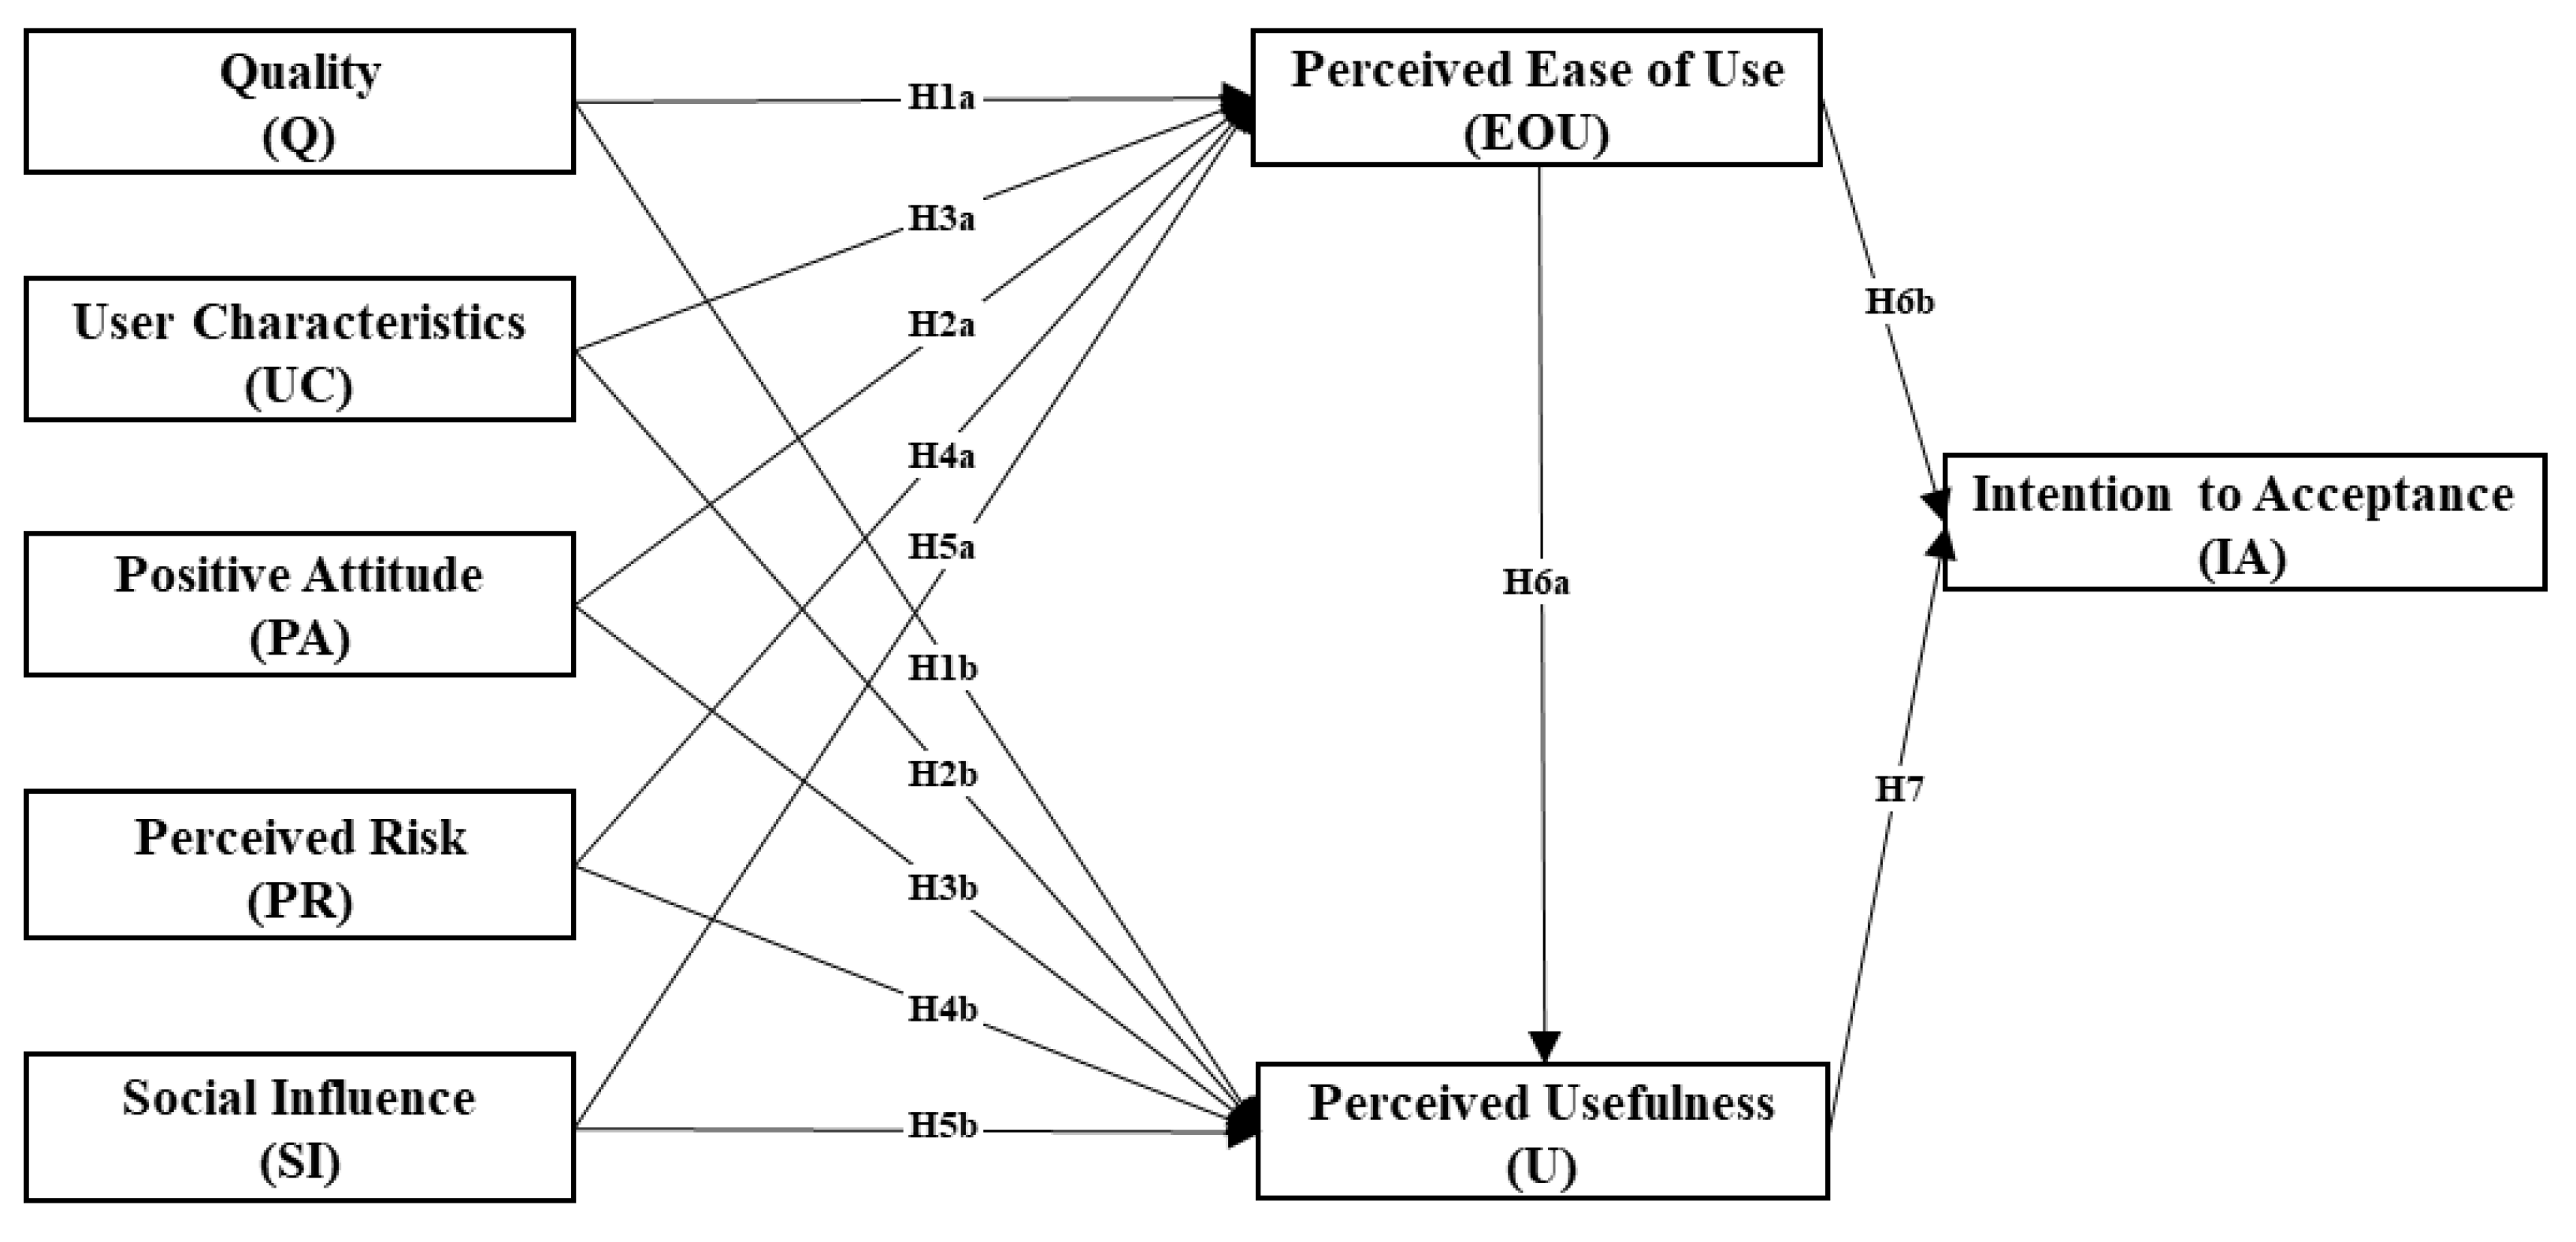
3.1. Proposed Model and Research Hypotheses

Smart cities are cities that improve the performance of urban infrastructure using ICT, provide services for the improvement of the quality of life of citizens based on the created information, and present the solutions to urban problems along with citizens with a consumer-centric rather than supplier-centric attitude.
However, since the construction of smart cities in Korea has been mostly promoted based on new towns, a top-down project approach led by the central government has been used. Thus, it has been difficult to develop citizen-centric services where citizens can feel satisfaction through the reflection of characteristics of existing individual cities and opinions from consumers. The strategy of this supplier-centric smart city construction and uniform installation of intelligence facilities has degraded cost effectiveness and caused citizens to have lower satisfaction with smart cities. It has also limited the discovery of various services due to the lack of policy and institutional basis that can accept creative ideas from citizens and private companies or reflect their demands. It is necessary for the performance evaluation of smart cities to not only evaluate a quantitative level of supplier-centric technology factor applications, but also to have a qualitative system to assess the interactivity of citizens towards the services.
Thus, this study empirically aims to verify the acceptance mechanisms of smart city services based on TAM [13,14,15], which has been most widely used as a tool to analyze the factors that affect the adoption and use of information technology and system-based services, and is based on the development of an evaluation index of interactivity of users toward smart city services.
Based on the discussion results of not only previous studies on the factors that affect the Acceptance Intention of smart cities and U-Cities but also previous studies that presented the factors that affect users to accept public services, the present study proposes a research model and research hypotheses for the empirical verification of smart city service acceptance models using a total of eight latent constructs and a total of 42 observed indicators, as shown in Figure 1 and Table 2.
The present study also verified the model of the structural equation using the two-stage approach proposed by Anderson and Gerbing [16] using AMOS 28. First, the fitness, validity, and reliability of the measurement models were verified through confirmatory factor analysis (CFA). Second, hypotheses between the factors were verified using the structural model.
More details of each latent construct are presented in Section 3.1.1, Section 3.1.2 and Section 3.1.3.

3.1.1. External Variables: A Critical Factor for Smart City Service

To derive the factors that significantly influence the Acceptance Intention of smart city services, this study examines not only previous studies on the factors that affected the Acceptance Intention of smart city and U-City services, but also previous studies that proposed the factors that affected the acceptance of public services of citizens. Table 3 presents the discussed results.
An exploratory factor analysis was conducted to group 31 assessment items of external variables that affected the acceptance of smart city services considered in previous studies into the critical factors. Factor analysis is a statistical method to group a large number of variables into a small number of hypothetical variables, which are factors. The main purpose is to reduce the number of variables into a smaller number of factors by identifying the types of interactions between variables. In addition, the basic principle of factor analysis is to group items that are highly interactive into a single factor and to maintain the mutual independence between factors [27]. To verify whether a dataset is fit for factor analysis, it is necessary to check the sample size and the strength of the relationship among the factors [28]. Hair et al. [29] claimed that the right sample size was four to five times the number of measurement variables. Nunnalyy [30] proposed that the sample size should be at least 10 times the number of variables, but because it was difficult to satisfy this requirement, he suggested that at least five times the number of variables was appropriate for the sample size in general. In this study, since the number of measurement variables was 31, the same size in this study was suitable for the factor analysis. In addition, Bartlett’s test of sphericity [31] was needed to see whether the correlation matrix was an identity matrix, and the Kaiser–Myer–Olkin (KMO) [32] test was also needed to check whether the numbers of variables and samples used in the analysis were suitable. The p-value from Bartlett’s test of sphericity should be statistically significant below 0.05, and the KMO value should be 0.6 or larger. In this study, Bartlett’s test of sphericity result was significant, and the KMO value was 0.939, which indicated that the samples used in this study were suitable for the factor analysis.
Principal component analysis was used as a model to extract factors. It has been most widely used in general among the factor extraction models, and its purpose is to reduce the number of variables into a smaller number of factors while minimizing factor information loss. A varimax rotation was used, which was focused on the interpretation of factors as several variables were prevented from being loaded on a single factor. The factor analysis identified that the number of factors whose eigenvalue was one or larger was five, and the percentage of variance explained by the derived factors was 61.728%. The measurement variables were grouped into one of the five factors based on the criterion where the factor loading value was greater than 0.5 [33]. To measure the same concept with many variables, an internal consistency test was needed. In the present study, this was tested using Cronbach’s α coefficient. All five factors showed 0.8 or greater, indicating a good level of internal consistency.
  • Factor 1: Quality of Smart City Service (Q)
The total variance explanatory power of the Quality of Smart City Service was 35.735%, indicating it as the most important factor among the five factors. The Quality of Smart City Service was composed of ‘Suitability’ (Q1, Q2), which refers to the degree of suitability to the daily living and demands of users [24,34]; ‘Interaction’ (Q3, Q4, Q5), which refers to the degree of rapid response and facilitation of operating organizations when demands occur [22]; ‘System Quality’ (Q6, Q7), which refers to the performance needed to be equipped with in systems required for the use of smart city services; and ‘Information Quality’ (Q8, Q9, Q10, Q11, Q12), which refers to information accuracy, up-to-datedness, needs, sufficiency, and rapidness that should be contained in the information provided when using smart city services. In the information system success model proposed by DeLone and McLean [35], ‘System Quality’ and ‘Information Quality’ are defined as the first factors that must be solved to lead to the success of the information system and the most widely used components as the outcome variables of information system quality. Accordingly, smart city services can be viewed as one of the information systems that are defined as services to provide collected and linked urban information to citizens.
  • Factor 2: User Characteristics of Smart City Service (UC)
The total variance explanatory power of the User Characteristics of Smart City Service was 9.080%, indicating that it was the second most important factor. The User Characteristics factor consisted of ‘Self-Efficacy’ (UC1, UC2, UC3, UC4), which refers to self-confidence in using smart city services, and ‘Personal Innovation’ (UC5, UC6, UC7), which refers to the personal intention to attempt the use of new information technology.
  • Factor 3: Positive Attitude of User (PA)
The total variance explanatory power of the Positive Attitude of the User was 7.458%, which was derived as the third most important factor. It consisted of assessment items of a positive emotional degree for positive smart city service use and the degree to which users believe that their personal data will be safe from tampering or misuse. The Positive Attitude of users in their 20s and 40s, who are actively using SNS, can be greatly influenced by broadcasting or internet media [36].
  • Factor 4: Perceived Risk (PR)
The total variance explanatory power of Perceived Risk was 5.763%. This factor refers to the perceived security level of systems provided in smart city services. The items that measured the Perceived Risk of security consisted of a degree of concern about the leakage of sensitive information and the intrusion of external viruses and a degree of perception that the system and technology to prevent this are insufficient [37]. Security risk may be viewed as the System Quality, but the smart city services in this study were based on the personal information collection of citizens, which is why it was derived as a separate factor (as security and personal information protection become important issues).
  • Factor 5: Social Influence (SI)
The total variance explanatory power of Social Influence was 3.688%. This factor had the lowest importance among the five factors, but it was derived as one of the important factors that affected the acceptance of smart city services. Social Influence consisted of assessment items that measured the degree to which people are forced to use smart city services by an external force, or others who are important to them, such as family, friends, and colleagues.
The assessment items of the five main factors are presented in Table 4.

3.1.2. Internal Variables

  • Perceived Ease of Use (EOU)
Perceived Ease of Use refers to the degree to which a person believes that using a particular information system is not difficult or free of effort [13,14,15].
  • Perceived Usefulness (U)
Perceived Usefulness refers to the extent to which a user expects a particular technology or service to improve their work performance [13,14,15]. The assessment items consisted of improving quality of life, reducing city service operating costs, solving urban environmental problems, and securing citizens’ safety, which were the expected effects of a smart city.
The assessment items of Perceived Ease of Use and Perceived Usefulness are summarized in Table 5.

3.1.3. Intention to Accept Smart City Service

The ‘acceptance’ can be largely divided into neutral acceptance, which is the acceptance in response technique, and acceptance above neutral. Neutral acceptance means acknowledgment of a thing as it is without evaluating or judging the expression of the other party to continue the speech of the other party, which refers to the acceptance as it is regardless of the positive or negative effects. The acceptance above neutral has the same meaning as positive respect, which refers to the approach with favor admitting its value. This means trust is formed as a prerequisite of acceptance and users accept its value and use degree. Acceptance in this study refers to acceptance above neutral.
As discussed above, the ultimate goal of smart cities is to improve the quality of life of citizens by solving urban problems. Thus, smart city services are deemed to be accepted when individuals have a positive experience of smart city services, thereby using them continuously and recommending them to surrounding people to diffuse the use of services. Thus, Table 6 presents the assessment items of the Intention to Accept (IA) the smart city services defined in this study.

3.2. Model Validation

To determine the goodness of fit of the proposed model, the ratio of X2 to the degree of freedom (df), root mean square residual (RMR), parsimonious goodness of fit index (PGFI), the Tucker–Lewis index (TLI), comparative fit index (CFI), and root mean square error of approximation (RMSEA) [38] were used. For the acceptance level of the determination index, the criteria suggested by previous studies were referred to.
The goodness of fit of the proposed model and acceptance level were compared (see Table 7). First, the measurement model showed that the majority of the model fit indices satisfied the acceptable level, while TLI and CFI, which did not satisfy the allowable level, also showed a close result to the acceptable level. Thus, the data collected in this study were determined to fit the proposed research model. Next, the goodness of fit of the structural model exhibited that the majority of them also satisfied the acceptable level as the same as shown in the measurement model, and indices that did not satisfy the allowable level were also close to the allowable level. That is, the hypotheses can be tested based on the structural model.

3.2.1. Measurement Model

To verify the measurement model, convergent and discriminant validity tests were conducted. First, convergent validity can be tested using factor loading (0.5 or greater) [29] derived from the CFA results, the composite reliability of measures (0.6 or greater) [41], and the average variance extracted (AVE) (0.5 or greater) [30]. The factor loading was not deleted, although ‘Q6’ was 0.499 because the number was close to the acceptance criterion of 0.5 and satisfied the requirements of the exploratory factor analysis results, as explained in Section 3.1.1. In addition, the composite reliability value (0.6 or greater) and AVE value (0.5 or greater) in the ‘Perceived Ease of Use’ factor did not satisfy the acceptance criteria, at 0.586 and 0.488, respectively; however, the numbers were close to the determination criteria, and they were considered one of the important factors in TAM, which was the basis of this study. Thus, they were not deleted as they played an important role in our study model (see Table 8). Second, to verify the discriminant validity, whether the AVE value was greater than the square of the correlation between factors [42] was checked, and the results showed that all the factors satisfied the criteria (see Table 9). Thus, the research model proposed in this study was found to be statistically significant.

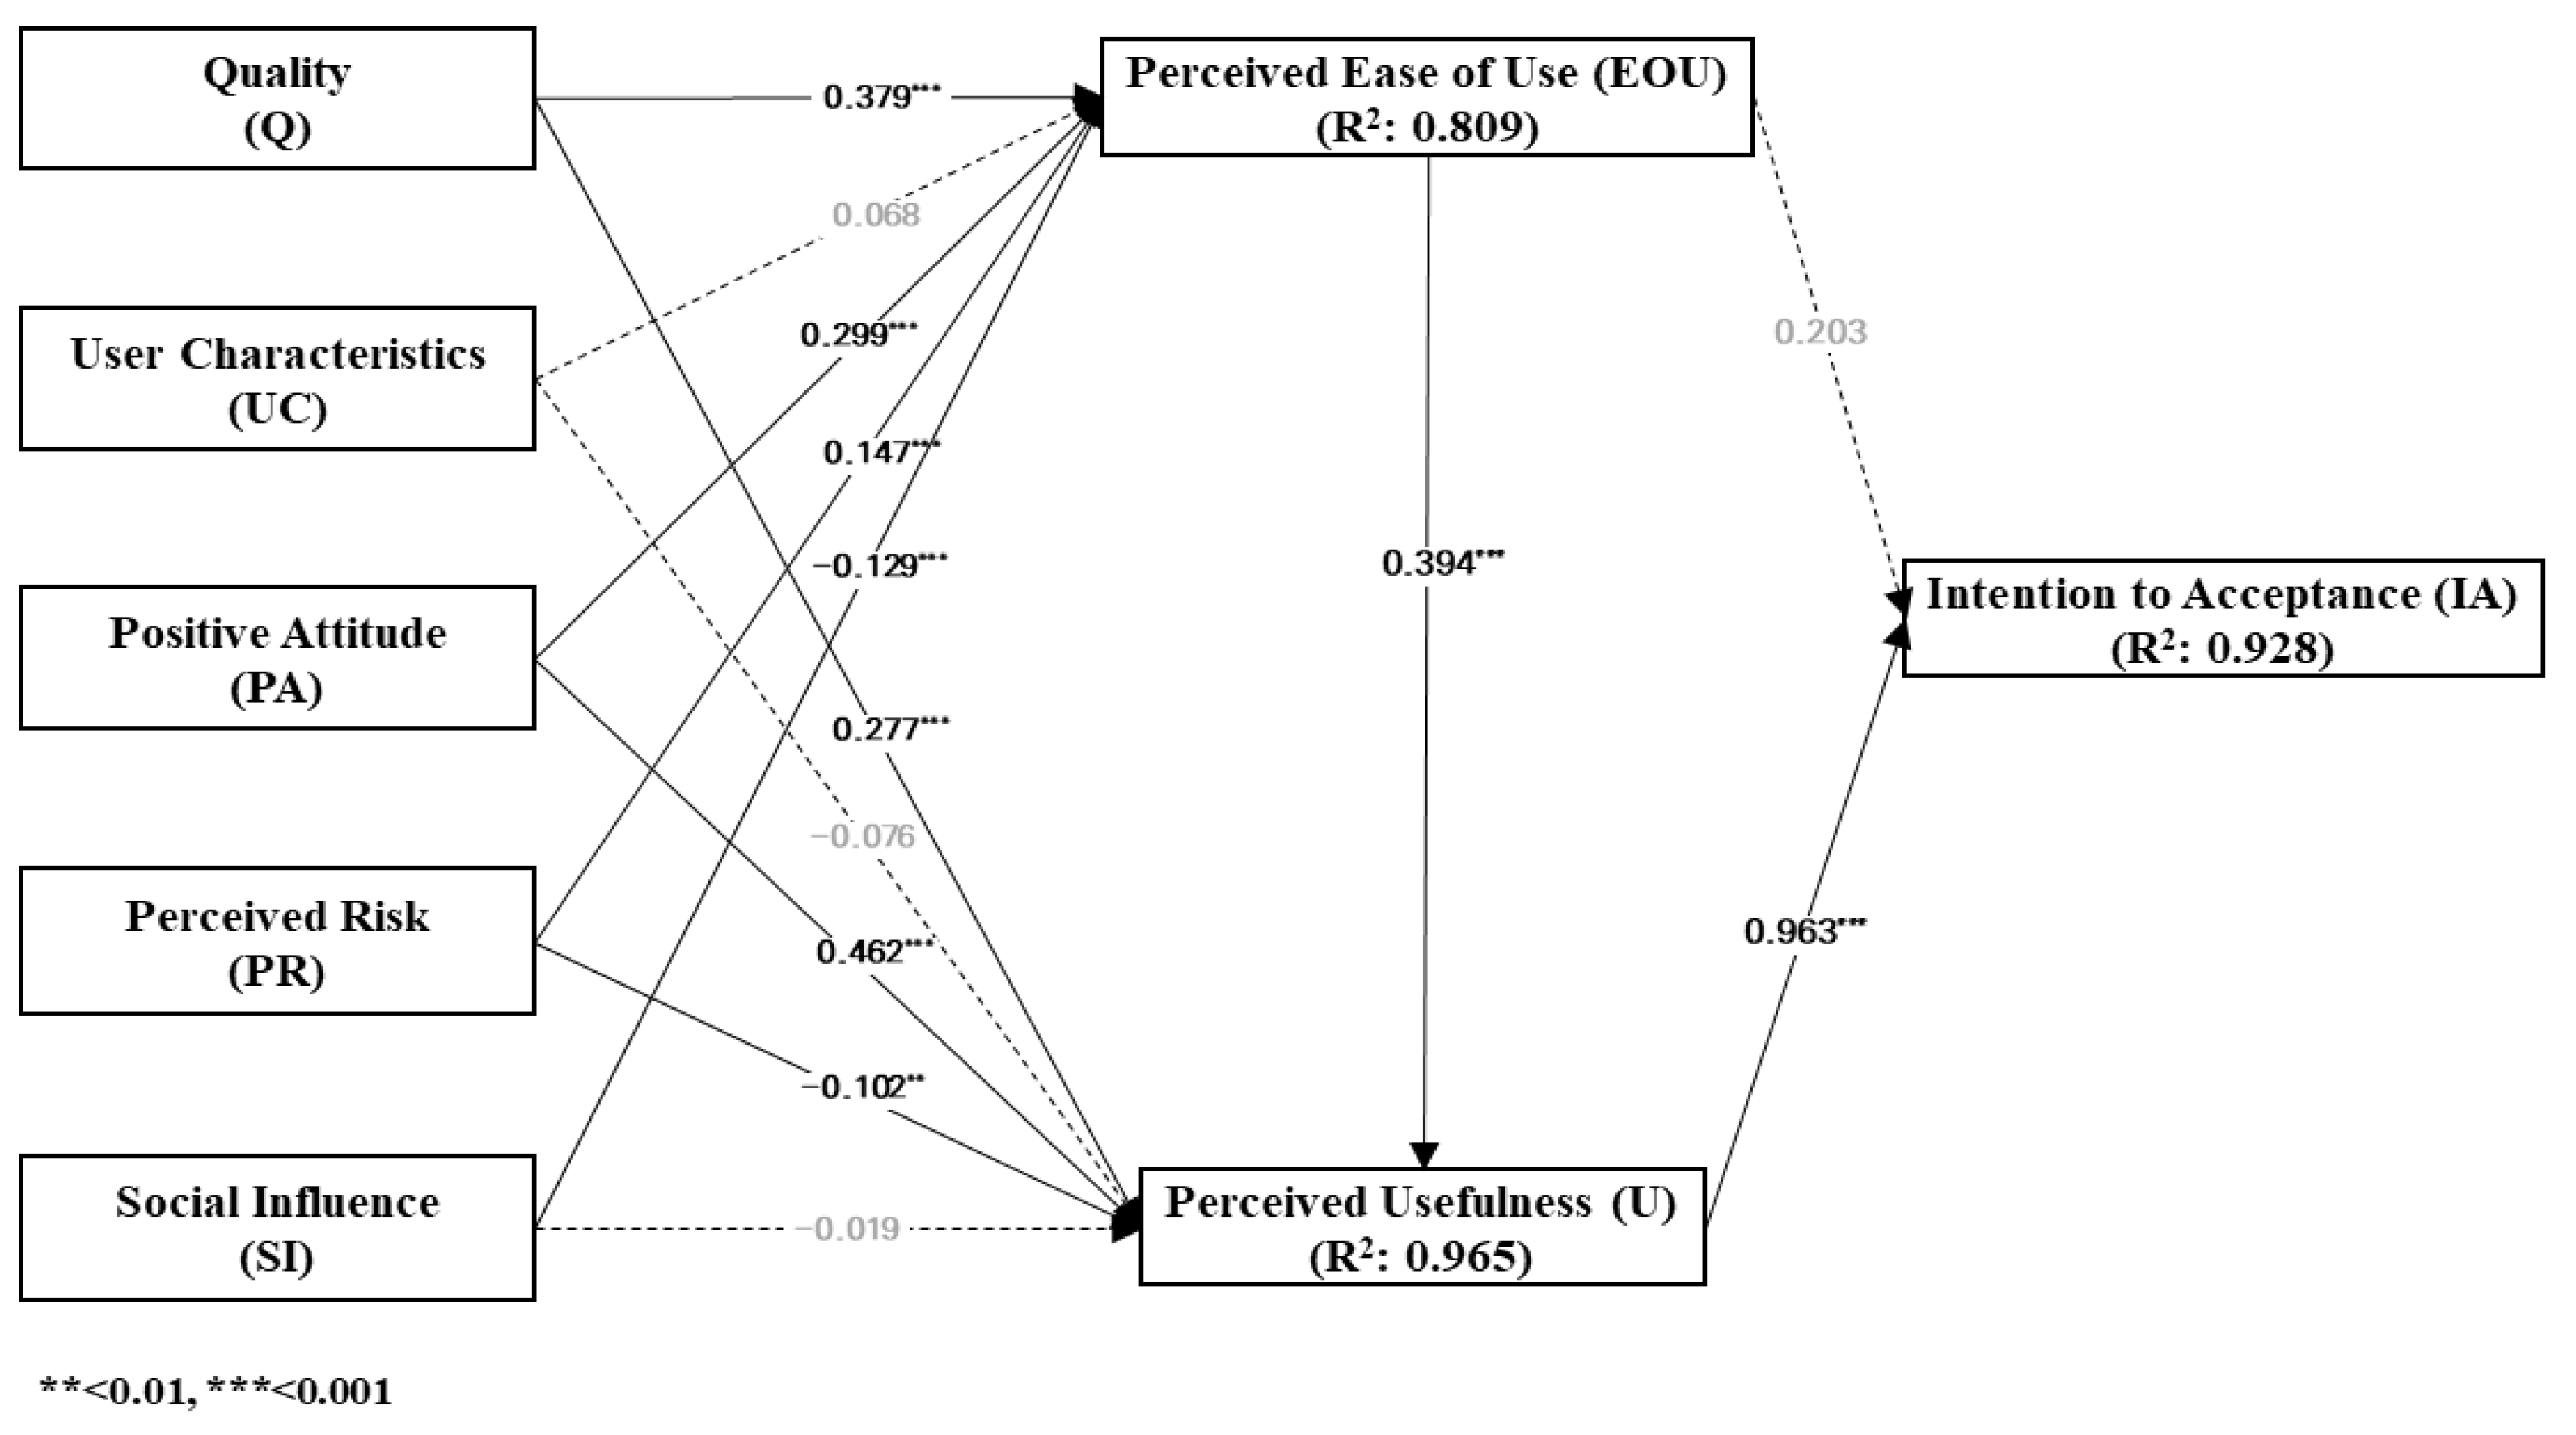
3.2.2. Structural Model

Figure 2 shows the verification results of the hypotheses, which contain the standardized path coefficients (the strength of the relationship between independent and dependent variables and the squared multiple correlations for an endogenous construct) that refer to the percentage of variation in the dependent variable explained by variation in the independent variables.
The hypotheses (H1a, H1b) regarding the Quality of Smart City Service were statistically significant (γ = 0.379 and γ = 0.277, respectively), which means that improving the Quality of Smart City Services had a positive impact on their Perceived Ease of Use and Perceived Usefulness. In addition, H3a and H3b, which were related hypotheses of the Positive Attitude of Users, were also statistically significant (γ = 0.299 and γ = 0.462, respectively). That means that the more positive an attitude the user had toward the smart city services, the larger the Perceived Ease of Use and Perceived Usefulness were. H4a and H4b, which were hypotheses representing the relationship between the Perceived Risk and Perceived Ease of Use as well as Perceived Usefulness, were also supported (γ = 0.147 and γ = −0.102, respectively). Note that there was an inversely proportional relationship between Perceived Risk and Perceived Usefulness. That means as the Perceived Risk increased, the degree of Perceived Usefulness was lower. H5a was also statistically supported (γ = −0.129). This means that as the Social Influence increased, the degree of Perceived Ease of Use decreased. On the contrary, H5a was not supported, which is interpreted as showing that even with high Social Influence, the Perceived Usefulness was not statistically significant. On the other hand, the User Characteristics did not significantly affect either the Perceived Ease of Use and Perceived Usefulness of smart city services.
Hypothesis H6a, which represented the relationship between the Perceived Ease of Use and Perceived Usefulness, was statistically significant (β = 0.394), and the relationship between the Perceived Ease of Use and Intention to Accept had an indirect impact only through the Perceived Usefulness. Finally, H7, which represented the relationship between Perceived Usefulness and Intention to Accept, was statistically significant (β = 0.963). This indicated that Perceived Usefulness was an important factor in the Intention to Accept smart city services.
H1a, H3a, H4a, and H5a explained 80.9% of the variance of the Perceived Ease of Use, and H1b, H3b, and H4b also explained 96.5% of the variance of the Perceived Usefulness. In addition, our analysis results revealed that the Perceived Usefulness explained 92.8% of the variance of the Intention to Accept. The direct, indirect, and total effects of each construct are presented in Table 10.

4. Discussion

4.1. Good Model Fit of the Research Model

The analysis results of the measurement and structural models of the “acceptance model of smart city service” proposed in this study showed that the goodness-of-fit indices of both models satisfied the allowable levels. The CFA results verified that the convergent and discriminant validities of the proposed model were satisfied. In addition, R2 values of the Intention to Accept smart city services, Perceived Ease of Use, and Perceived Usefulness were greater than 80%, which indicates that the configuration of the constructors derived in this study were fit to define the acceptance model of smart city services. That is, the factors included in the proposed model were the main factors that affected the acceptance of smart city services.

4.2. Relationship between Internal Variables and Intention to Accept

The hypothesis test results of Perceived Usefulness, Perceived Ease of Use, and Intention to Accept smart city services were analyzed, and we found that Perceived Usefulness had a significant impact on the Intention to Accept smart city services while Perceived Ease of Use had an indirect impact on the Intention to Accept smart city services through Perceived Usefulness. The factor that had the largest impact on Perceived Usefulness was Perceived Ease of Use. This meant that the efforts to make citizens perceive that smart city services can help the improvement of quality of life, the reduction in urban service operating costs, the resolution of urban environmental problems, and secure the citizen’s safety were needed, and the Perceived Ease of Use was important to perceive the usefulness to raise the intention of citizens to accept smart city services.

4.3. Relationship between External Variables and Internal Variables

The hypothesis test results on the relationship of external variables that affected the acceptance of smart city services with Perceived Usefulness and Perceived Ease of Use were analyzed, and we found that all variables, except for user’s personal characteristics, had an impact on Perceived Ease of Use or Perceived Usefulness. The quality improvement of smart services had the most important and significant impact on Perceived Ease of Use whereas the Social Influence had a negative impact. This analysis result confirms the need for the following factors to be reflected in establishing strategies of smart city service supply because they can have a positive impact on the Perceived Ease of Use of citizens: smart services are suitable for daily living and the demand for users (Suitability); the response of operating organizations is facilitated when difficulties occur or demand is generated during the service use (Interaction); the higher the computability with devices owned by users is and the stabler the connection is when using smart city services (System Quality); and the higher the information accuracy, up-to-datedness, needs, sufficiency, and rapidness (Information Quality). On the other hand, the analysis results showed that if the user is forced to use the services by surrounding people or policies without such consideration, it may increase the use rate at first but have a negative impact on the Perceived Ease of Use over time.
The external variable that had the most significant impact on Perceived Usefulness was the user’s Positive Attitude. This means that smart services were perceived as useful as users were positive about the service use, users thought they were ahead of others, more users obtained access to positive advertisements from the media, and the higher the trust of the providing institutions was. In contrast, the Perceived Risk had a negative correlation with the Perceived Usefulness. This means that the degree of the Perceived Usefulness was lower as personal information was exposed or the higher the concern of virus or external intrusion was, or users perceived that technologies or policies were yet insufficient to prevent such risks no matter how useful the smart city service provided was.
To make citizens perceive that smart city services are useful to increase the intention to accept smart city services, the quality level of smart city services (such as the suitability with existing daily living and demand as much as possible without too much effort to use smart city services, compatibility with devices, and connection reliability) should be ensured. In addition, strategies of public relations through social networking services or public media were needed for users to know the expected effects that can be obtained from the use of smart services to have a Positive Attitude toward smart city services. Systems and technologies that can address the concern about security such as sensitive information leakage and the external intrusion of viruses are needed, as most smart city services were customized to individuals or specific groups. Along with this, public relations are needed to advertise this address. As such, the Perceived Ease of Use can be improved through the Positive Attitude of users toward the services when the usefulness and safety of smart city services are advertised, whereas the forced use of services may have an adverse impact as the Social Influence had a negative impact on the Perceived Ease of Use.

5. Conclusions

Smart cities are defined as cities that provide services and platforms for the solution of urban problems and for improvements in quality of life using advanced technologies such as ICT and IoT. That is, the goal of providing smart city services is not only simply building smart technology and infrastructure, but also improving the quality of life of citizens to use smart city services and have a positive experience. To achieve this, it is necessary to establish service supply strategies considering citizens’ satisfaction levels by identifying the factors that affect the intentions or behavior of citizens who use smart city services.
As exhibited in the definition of smart city services, the required information is collected according to the urban problems to be solved, thereby providing collected information or providing information by linking them, which can be viewed as a kind of information system. Thus, we propose an acceptance model of smart city services, which is a theoretical model that can be the foundation of the model to evaluate the satisfaction levels of citizens toward the smart city services, based on the TAM, which was the most widely used analysis tool of factors that affected the acceptance and use of information technology and system-based services. Based on the empirical verification results of the proposed research models targeting Seoul City, we derived a total of eight factors (Quality, User Characteristics, Positive Attitude, Perceived Risk, Social Influence, Perceived Ease of Use, Perceived Usefulness, and Intention to Accept) that affected the acceptance of smart city services, and 42 assessment items by the factors.
Through the model proposed in this study, factors that affect the acceptance of smart city services were identified, and the relationship between the factors was verified. Thus, the usability of smart city services can be evaluated based on the proposed model. That is, it is possible to know which factors need to be further managed to increase the use of smart city services, whether the level of improvement of the factors that need improvement will be effective, in what order the improvement of the factors will be effective, etc., through the usability evaluation of smart city services, which can be guidelines to establish effective improvement plans of smart city services. Furthermore, the effects of policies to secure the sustainability of smart city services can also be assessed.
In recent years, the performance of smart city services has been measured and a pilot system to certify the performance level has been put in place for cities [11]. The smart city service acceptance model proposed in this study can also be applied to this performance measurement process for certification.
In this research, the survey was conducted only for the Seoul region. However, it will also need to be conducted in other regions (ex. Busan and Sejong, etc.) where smart cities are under construction to know the difference in smart city services regionally. Although the overall Intention to Accept smart city services was investigated in this research, research on the difference by service sectors is also needed. Moreover, studies on the proposal of guidelines to improve smart city services by regions and smart city services are also needed through research that verifies the priority and improvement effects using a usability evaluation of smart city services.

Funding

This work was supported by the National Research Foundation of Korea (NRF) grant funded by the Korean government (MEST) (NRF-2020R1I1A1A01071545). This work was also supported by the Research Resettlement Fund for the new faculty of Kwangwoon University in 2021.

Institutional Review Board Statement

Not applicable.

Data Availability Statement

The data presented in this study are available upon request from the corresponding author.

Conflicts of Interest

The author declares no conflict of interest.

References

  1. International Telecommunication Union. Smart Sustainable Cities: An Analysis of Definitions; Technical Report of the Focus Group on Smart Sustainable Cities, SSC-0146 Version Geneva; International Telecommunication Union: Geneva, Switzerland, 2014; Available online: https://www.itu.int/md/T13-SG05-141208-TD-GEN-0785 (accessed on 19 October 2022).
  2. Enforcement Decree of the Smart City Act, No. 31779. 2021. Available online: https://www.law.go.kr/LSW/lsInfoP.do?efYd=20210617&lsiSeq=232801#0000 (accessed on 3 March 2022).
  3. Shin, H.K. The President’s Emphasis on Smart City…It’s Going to Be the Top 3 Strategies. Mail Business News Korea. 6 September 2017. Available online: https://www.mk.co.kr/news/it/view/2017/09/596991/ (accessed on 22 December 2021).
  4. Han, D.H.; Kim, K.S.; Leem, C.S. A Study on the Affecting Factors of U-City Service Acceptance. J. Soc. E-Bus. Stud. 2014, 19, 53–74. [Google Scholar] [CrossRef]
  5. Beak, N.C. Smart City Infrastructure Construction Strategy: Focusing on Performance Indicators for Investment Expansion. Mon. KOTI Mag. Transp. 2017, 228, 13–20. [Google Scholar]
  6. Lee, J.Y.; Kim, S.S.; Kim, E.R.; Park, J.S.; Lee, M.Y.; Lee, S.W. A Study on Construction and Application Approaches of Smart City Maturity and Potential Diagnostic Models; KRIHS: Yeongi-gun, Republic of Korea, 2016. [Google Scholar]
  7. Cohen, B. The 3 Generations of Smart Cities, inside the Development of The Technology Driven City. 2015. Available online: https://www.fastcompany.com/3047795/the-3-generations-of-smart-cities (accessed on 20 December 2021).
  8. Lee, W.J.; Lee, S.K. Key Factors Affecting Acceptance of Smart City Service: Focused on Seoul. J. Archit. Inst. Korea 2022, 38, 233–242. [Google Scholar]
  9. Ju, Y.C.; Lee, E.W.; Seo, W.J. Analyzing Smart City research trends. J. Korean Soc. Reg. Inf. Chem. 2020, 23, 149–172. [Google Scholar]
  10. Park, K.C.; Lee, C.H. A Study on the Research Trends for Smart City using Topic Modeling. J. Internet Comput. Serv. 2019, 20, 119–128. [Google Scholar]
  11. Jeong, S.H. Policy Direction Setting through Comparative Analysis of Foreign Smart City Policies. J. Korea Acad.-Ind. Coop. Soc. 2020, 21, 151–160. [Google Scholar]
  12. Cho, D.H.; Lee, Y.J. Factors that affect user satisfaction toward continuous usage of AI speakers—Focusing on the mediation effect of emotional attachment. J. Korea Des. Forum 2019, 24, 87–100. [Google Scholar]
  13. Davis, F.D. Perceived usefulness, perceived ease of use, and user acceptance of information technologies. MIS Q. 1989, 13, 319–340. [Google Scholar] [CrossRef]
  14. Venkatesh, V.; Morris, M.G.; Davis, G.B.; Davis, F.D. User acceptance of information technology: Toward a unified view. MIS Q. 2003, 27, 425–478. [Google Scholar]
  15. Venkatesh, V.; Bala, H. TAM 3: Advancing the Technology Acceptance Model with a Focus on Interventions. Decis. Sci. 2008, 39, 273–315. [Google Scholar] [CrossRef]
  16. Anderson, J.C.; Gerbing, D.W. Structural equation modeling in practice: A review and recommended two-step approach. Psychol. Bull. 1988, 103, 411–423. [Google Scholar] [CrossRef]
  17. Yang, J.S.; You, Y.Y. Analysis of Sensible Factors on Service Acceptance Intention of Smart City. J. Korea Inst. Intell. Transp. Syst. 2021, 20, 146–156. [Google Scholar] [CrossRef]
  18. Lee, C.H. A Empirical Study on the Citizens’ Perception Factors to the U-City Service Acceptance. Ph.D. Thesis, Dongeui University, Busan, Republic of Korea, 2012. [Google Scholar]
  19. Kim, J.G.; Ha, M.J. Spreading out the Citizen’s Acceptance on the u-Public Service: A Case of u-Green in Seoul Metropolitan Government. Korean Policy Sci. Rev. 2011, 15, 105–130. [Google Scholar]
  20. Lee, D.G.; Lee, S.J. An Empirical Study on Intentions to Use of Smart TV. J. Digit. Converg. 2012, 10, 107–118. [Google Scholar]
  21. Han, K.H.; Kim, J.S. An Empirical Study on the Influencing Factors of Intention to Adoption of Mobile Government Service. Asia Pac. J. Inf. Syst. 2013, 23, 78–104. [Google Scholar]
  22. Oh, J.C. Factors Influencing Acceptance of E-government Self Service Technology (SST). E-Bus. Stud. 2012, 13, 441–462. [Google Scholar]
  23. Jin, R.; Lee, D.M. An Empirical Study on the Factors Influencing the Acceptance of Mobile Easy Payment Services: A Case of Chinese User. J. Korea Contents Assoc. 2017, 17, 1–13. [Google Scholar]
  24. Darmawan, A.K.; Siahhan, D.; Susanto, T.D.; Uman, B. Identifying success factors in Smart City readiness using a structure equation modelling approach. In Proceedings of the 2019 ICOMITEE, Jember, Indonesia, 16–17 October 2019. [Google Scholar]
  25. Habib, A.; Alsmadi, D.; Prybutok, V.R. Factors that determine residents’ acceptance of smart city technologies. Behav. Inf. Technol. 2020, 39, 610–623. [Google Scholar] [CrossRef]
  26. Sepasgozara, S.M.; Hawken, S.; Sargolzaeic, S.; Foroozanfa, M. Implementing citizen centric technology in developing smart cities: A model for predicting the acceptance of urban technologies. Technol. Forecast. Soc. Chang. 2019, 142, 105–116. [Google Scholar] [CrossRef]
  27. Hong, D.S. Analysis of Social Survey, 3rd ed.; Dasanbooks: Jeonju, Republic of Korea, 2000. [Google Scholar]
  28. Pallant, J. SPSS Survival Manual; Open University Press: Buckingham, PA, USA, 2001. [Google Scholar]
  29. Hair, J.F.; Ronald, L.; Tatham, R.E.A.; William, B. Multivariate Data Analysis; Prentice-Hall International: Hoboken, NJ, USA, 1998. [Google Scholar]
  30. Nunnalyy, J.C. Psychometric Theory; McGraw-Hill: New York, NY, USA, 1978. [Google Scholar]
  31. Bartlett, M.S. A note on the multiplying factors for various chi square approximations. J. R. Stat. Soc. 1954, 16, 296–298. [Google Scholar]
  32. Kaiser, H.F. A second-generation little jiffy. Psychometrika 1970, 35, 401–415. [Google Scholar] [CrossRef]
  33. Aksorn, T.; Hadikusumo, B.H.W. Critical success factors influencing safety program performance in Thai construction projects. Saf. Sci. 2008, 46, 709–727. [Google Scholar] [CrossRef]
  34. Bae, J.K. A Study on the Determinant Factors of Innovation Resistance and Innovation Acceptance on Internet Primary Bank Services: Combining the Theories of Innovation Diffusion and Innovation Resistance. E-Bus. Stud. 2018, 19, 91–104. [Google Scholar] [CrossRef]
  35. DeLone, W.H.; McLean, E.R. Information system success: The Quest for the Dependent Variable. Inf. Syst. Res. 1992, 3, 60–95. [Google Scholar] [CrossRef]
  36. Park, M.H.; Kwon, M.W. Intention to Use Mobile Delivery Application Services, Depending on Personal Innovativeness and Self-Efficacy. J. Korea Contents Assoc. 2017, 17, 440–448. [Google Scholar]
  37. Han, D.K. A Study on Factors Affecting Fintech Acceptance and Revitalization. Ph.D. Thesis, Yonsei University, Seoul, Republic of Korea, 22 December 2015. [Google Scholar]
  38. Baumgartner, H.; Homburg, C. Application of Structural Equation Modeling in Marketing and Consumer Research: A review. Int. J. Res. Mark. 1996, 13, 139–161. [Google Scholar] [CrossRef]
  39. Jiang, J.J.; Klein, G.; Chen, H.G.; Lin, L. Reducing user-related risks during and prior to system development. Int. J. Proj. Manag. 2002, 20, 507–515. [Google Scholar] [CrossRef]
  40. Wang, Y.S.; Liao, Y.W. Assessing e-Government systems success: A validation of the DeLone and McLean model of information systems success. Gov. Inf. Q. 2008, 25, 717–733. [Google Scholar] [CrossRef]
  41. Fornell, C.; Larcker, D.F. Evaluating structural equation models with unobservable variable and measurement error. J. Mark. Res. 1981, 18, 39–50. [Google Scholar] [CrossRef]
  42. Barclay, D.; Thompson, R.; Higgins, C. The Partial Least Squares (PLS) Approach to Causal Modeling: Personal Computer Adoption and Use an Illustration. Technol. Stud. 1995, 2, 285–309. [Google Scholar]
Figure 1. Research model.
Sustainability 15 02695 g001
Figure 2. Results of hypotheses testing.
Sustainability 15 02695 g002
Table 1. Characteristics of the respondents (n = 450).
CategoryFrequency%
GenderMale22048.89
Female23051.11
Age20s8919.78
30s9120.22
40s9521.11
50s9420.89
60s or older8118.00
Residence period1 to 5 years8218.22
5 to 10 years9721.56
10 to 20 years11926.44
20 to 30 years8418.67
over 30 years6815.11
Smart City Service PerceptionNot at all214.67
Do not know well14532.22
Moderate19643.56
Know well8017.78
Know very well81.78
Table 2. Research hypotheses.
HypothesesDefinition
H1aQuality will positively affect Perceived Ease of Use
bQuality will positively affect Perceived Usefulness
H2aUser Characteristics will positively affect Perceived Ease of Use
bUser Characteristics will positively affect Perceived Usefulness
H3aPositive Attitude will positively affect Perceived Ease of Use
bPositive Attitude will positively affect Perceived Usefulness
H4aPerceived Risk will positively affect Perceived Ease of Use
bPerceived Risk will positively affect Perceived Usefulness
H5aSocial Influence will positively affect Perceived Ease of Use
bSocial Influence will positively affect Perceived Usefulness
H6aPerceived Ease of Use will positively affect Perceived Usefulness
bPerceived Ease of Use will positively affect Intention to Accept
H7-Perceived Usefulness will positively affect Intention to Accept
Table 3. The affected factors considered in previous studies.
AuthorsTarget External VariablesInternal Variables
Yang & You [17]Smart City ServicePrior knowledge, trust, personal innovativeness, intimacyPerceived Usefulness, Perceived Ease of Use, Intention to pay
Lee [18]U-City ServiceInnovativeness, intimacy, self-confidence, reliability, interest level, conveniencePerceived Usefulness, Perceived Ease of Use
Han et al. [4]U-City ServicePropensity to Trust, self-efficacy, Information Accuracy, Context Awareness, ubiquitousPerceived Usefulness, Perceived Ease of Use, Trust, Behavioral Intention to Use
Kim & Ha [19]Public Service
using ubiquitous
Information Quality, System Quality, Policy QualityPerceived Usefulness, Perceived Ease of Use, Citizen acceptance
Lee & Lee [20]Smart TVInnovativeness, experience, social impact, cost, interactionEffort expectancy, performance expectancy
Han & Kim [21]Mobile e-government ServiceService Quality, Information Quality, Technology Quality, Relationship Quality, Public Quality, interactionPerceived Usefulness, Perceived Ease of Use, satisfaction
Oh [22]e-government
Self-Service
Attitude, subjective norms, technology readinessPerceived Usefulness, Perceived Ease of Use
Jin & Lee [23]Mobile Easy Payment ServicesPersonal innovativeness, self-efficacy, subjective norms, security, economic efficiency, instant connectivity, suitabilityPerceived Usefulness, Perceived Ease of Use
Darmawan et al. [24]Smart City Tech.Personal innovativeness, self-efficacy, reliability, securityPrice value, effort expectancy
Habib & Prybutok [25]Smart City ServiceService Quality, System Quality, Information QualityPerceived Usefulness, Perceived Ease of Use, satisfaction
Sepasgozara et al. [26]Smart City Tech.Self-efficacy, trust, Service Quality, securityCost reduction, time saving, energy saving, work facilitation, relative advantages, Perceived Usefulness, Perceived Ease of Use
Table 4. Assessment items of external variables.
VariablesAssessment Items
Quality
(Q)
Q1The use of smart city services gets along well with my lifestyle.
Q2I think smart city services will meet the needs of citizens.
Q3I believe that I can receive a response rapidly when I have trouble using smart city services.
Q4I believe that the response from the operation organization will be quick when there is demand for smart city service use.
Q5I think that smart city services will play a role in smooth interactions with citizens.
Q6I will use smart city services if possible with smart devices I own.
Q7I believe when using smart city services, reliable services can be maintained without technical issues (connection errors or interruption, etc.) to use services smoothly.
Q8I believe that accurate information can be provided when using smart city services.
Q9I believe that the most up-to-date information can be provided when using smart city services.
Q10I believe that needed information can be provided when using smart city services.
Q11I believe that sufficient information can be provided when using smart city services.
Q12I believe that information can be provided rapidly when using smart city services.
User
Characteristics
(UC)
UC1I am more comfortable when I use the smart city service than using face-to-face contact with operators.
UC2I have self-confidence in using new smart city services.
UC3I am confident that I will be familiar with the use of new smart city services if I use a similar service before.
UC4I am confident that I will be familiar with the use of new smart city services if somebody teaches me how to use them.
UC5I am used to using smart devices (smartphones, kiosks, etc.).
UC6I am active in the use of smart devices (smartphones, kiosks, etc.).
UC7I tend to try new smart city services first.
Positive
Attitude
(PA)
PA1I am positive about using new smart city services.
PA2I think it would be desirable to extend the supply of smart city services.
PA3I think I will have an advantage when I use smart city services compared to others who do not use smart city services.
PA4I think I like to use more smart city services when broadcast and Internet media advertise smart city services a lot.
PA5I trust governments and public institutions that provide smart city services.
PA6I believe the city I live in has the competence to provide smart city services.
Perceived
Risk
(PR)
PR1I think that technologies used in smart city services are not yet reliable to prevent viruses or external intrusion.
PR2I think strong systems and policies are not in place yet to prevent sensitive information leakage when using smart city services.
PR3I am concerned that smart city services may be interrupted due to viruses or external intrusion.
PR4I am concerned that sensitive information (personal information, use history information, etc.) may be leaked when using smart city services.
Social
Influence
(SI)
SI1I will use new smart city services only if I am requested to use them by people (family or work colleagues, etc.) who influence my thought and behavior.
SI2I will use new smart city services only when the use of smart city services is enforced as a policy.
Table 5. Assessment items of mediation variables.
VariablesAssessment Items
Perceived Ease of Use
(EOU)
EOU1It is easy to learn how to use smart city services.
EOU2It is not difficult for me to interact with smart city services, and I can clearly understand the supplied information.
EOU3I believe the use of public city services would be easier with the supply of smart city services.
EOU4I can use smart city services regardless of time and space constraints.
Perceived Usefulness (U) U1I believe my quality of life will improve if I use smart city services.
U2I believe the cost of city service operations will be reduced if smart city services are used.
U3I believe the use of smart city services will help make sustainable environments (solving air, water, energy, and noise problems).
U4 I believe cities will be safer with smart city services.
Table 6. Assessment items of Intention to Accept.
VariablesAssessment Items
Intention to
Accept
(IA)
IA1I will continuously use the smart city services that I have experienced in the future.
IA2If new smart city services are provided, I will use them.
IA3I will recommend the use of smart city services to surrounding people.
Table 7. Fit indices for research model.
Fit IndicesRecommended Value
[30,39,40]
Measurement ModelStructural Model
x2/df≤3.02.6822.674
RMR≤0.10.0420.043
PGFI≥0.50.6830.687
TLI≥0.90.8590.859
CFI≥0.90.8700.870
RMSEA≤0.10.0610.061
Table 8. Results of the convergent validity test.
Latent
Constructs
Observed
Indicators
Factor
Loading
t-ValueComposite
Reliability
AVE
Quality
(Q)
Q10.717-0.9000.611
Q20.69714.404
Q30.69814.417
Q40.68014.031
Q50.75415.597
Q60.49910.275
Q70.68514.151
Q80.68614.16
Q90.70714.594
Q100.71514.78
Q110.72414.963
Q120.68314.096
User Characteristics
(UC)
UC10.699-0.8550.613
UC20.77315.108
UC30.78115.24
UC40.72814.276
UC50.68613.511
UC60.74314.552
UC70.68313.45
Positive Attitude
(PA)
PA10.697-0.8170.601
PA20.72514.358
PA30.72314.31
PA40.68213.532
PA50.6613.129
PA60.72514.348
Perceived Risk
(PR)
PR10.673-0.7830.633
PR20.76112.82
PR30.72612.451
PR40.73212.515
Social Influence
(SI)
SI10.802-0.7590.690
SI20.87912.542
Perceived Ease of Use
(EOU)
EOU10.503-0.5860.488
EOU20.5728.749
EOU30.7349.985
EOU40.6059.039
Perceived Usefulness
(U)
U10.676-0.7380.598
U20.63312.471
U30.69713.63
U40.74114.395
Intention to Accept
(IA)
IA10.763-0.7980.696
IA20.78417.134
IA30.73215.853
Note. t-value for these parameters were not available because they were fixed for scaling purpose. Q: Quality; UC: User Characteristics; PA: Positive Attitude; PR: Perceived Risk; SI: Social Influence; EOU: Perceived Ease of Use; U: Perceived Usefulness; IA: Intention to Accept.
Table 9. Results of the discriminant validity test.
Observed Indicatorsr2AVEDiscriminant
Validity
QUC0.3540.6110.613O
PA0.5080.601O
PR0.0130.633O
SI0.1240.690O
EOU0.3920.488O
U0.5840.598O
IA0.5540.696O
UCPA0.4360.6130.601O
PR0.0130.633O
SI0.0440.690O
EOU0.2820.488O
U0.3450.598O
IA0.3700.696O
PAPR0.0020.6010.633O
SI0.1890.690O
EOU0.2940.488O
U0.5490.598O
IA0.5540.696O
PRSI0.0010.6330.690O
EOU0.0660.488O
U0.0010.598O
IA0.1300.696O
SIEOU0.0060.6900.488O
U0.0820.598O
IA0.0870.696O
EOUU0.3670.4880.598O
IA0.3890.696O
UIA0.5610.5980.696O
Note. “O” means that the criterion for discriminant validity of the two factors is satisfied.
Table 10. Results of direct, indirect, and total effects.
VariablesTotal EffectDirect EffectIndirect Effect
EOU UIAEOU UIAEOU UIA
Q0.4980.4610.4570.4980.299000.1610.457
UC0.102−0.06−0.0350.102−0.093000.033−0.035
PA0.4210.6720.6220.4210.536000.1370.622
PR0.204−0.051−0.0130.204−0.117000.066−0.013
SI−0.3−0.133−0.155−0.3−0.03600−0.097−0.155
EOU00.3240.41600.3240.145000.271
U000.835000.835000
IA000000000
Disclaimer/Publisher’s Note: The statements, opinions and data contained in all publications are solely those of the individual author(s) and contributor(s) and not of MDPI and/or the editor(s). MDPI and/or the editor(s) disclaim responsibility for any injury to people or property resulting from any ideas, methods, instructions or products referred to in the content.

