

Sustainable-Oriented Development for Urban Interface of Historic Centers

Department of Islamic Architecture, Umm Al-Qura University, Makkah 24381, Saudi Arabia
Sustainability 2023, 15(3), 2792; https://doi.org/10.3390/su15032792
Submission received: 30 December 2022
/
Revised: 30 January 2023
/
Accepted: 1 February 2023
/
Published: 3 February 2023
(This article belongs to the Special Issue To Practice Sustainability in Architecture and Urbanism: Contemporary Approaches)
Abstract
:The Middle East and North Africa (MENA) cities’ historic centers have a unique urban fabric regarding land use, physical characteristics, and environmental performance. Several cities within this region are subject to significant development projects based on demolition and replacement. These projects aim to improve the quality of life and enhance the city’s socioeconomic and sustainability. This paper investigates the physical characteristics of the urban interface between the historical centers and the rest of the cities’ urban expansions to ensure a smooth transition between the historic urban fabric and the rest of the city’s urban fabric. The research objective was fulfilled by developing a framework to classify urban fabric types based on their physical characteristics. Jeddah city was selected as a case study. Six growth phases of the city were identified. Based on this classification, urban fabric samples representing these phases were selected. These urban samples’ physical characteristics were analyzed. Results identified in urban fabric characteristics between the historic center and the other identified urban fabrics within the city, especially the demolished deteriorated surrounding urban areas. Urban features for under-development urban areas were concluded. Design guidelines were suggested for historical centers to achieve homogeneous integrated, sustainable, livable urban areas.
1. Introduction
As part of the government’s efforts to improve the quality of citizens’ lives, several Middle Eastern and North African countries (MENA) started programs to develop urban areas within historic cities. Among other cities, Cairo, Alexandria, Makkah, and Jeddah are adopting demolish and replace policies to deal with deteriorated traditional and historic urban areas [1]. In many previous cases, urban developers target western-style urban fabrics and architectural designs rather than social culture and climate-responsive local ones [2]. These designs would result in an urban not reflecting the local community identity and culture or even responding to climate requirements [3]. Several researchers have revealed a gap in studying both traditional and contemporary urban morphologies within MENA cities and evaluating the impact of fabric geometry on outdoor thermal comfort [4]. For this reason, urban researchers and designers need to investigate the history of existing urban fabrics in the city to understand urban structure and dynamics. The historic urban centers and their surrounding urban areas can educate designers on the successful urban characteristics and treatments that mitigate local areas’ social, cultural, and climatic requirements [1,4].
Jeddah city was selected as a case study because its historical center is witnessing a significant development project. As part of this project, the government confiscated all the historical buildings and started a restoration project for the listed buildings and their surrounding urban spaces. A new adaptive reuse policy, including hotels, bazaars, and restaurants, is undergoing for these buildings. The deteriorated urban areas surrounding the historic center were demolished as part of a demolishment and replacement policy for these areas. A commercial and business center is expected as the primary use for these areas, but the design guidelines are still under development.
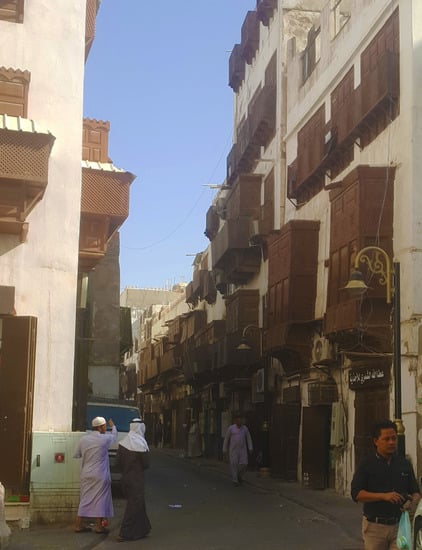
As cited by Mubarak, Nezzar Al Sayyed described historical Islamic cities as “self-contained entities that make up a distinct society and culture radically different from other civilizations” [5]. As a historic Islamic urban center, Jeddah was built as a solid mass with engraved narrow shaded, irregular walkways. The historic fabric was directed inward, where all urban components are contained, from its gated city walls to the residential sectors. The compact urban mass comprises small buildings with one to three floors with protected openings to mitigate environmentally and socially required privacy [1,6]. The main feature of the primary land use is based on the distinct separation of commercial activities from residential uses. All commercial activities were distributed along the main streets [5,7]. Public open spaces were reduced to the main commercial paths and the slight enlargement at their intersections. In contrast, quiet, calm, smaller alleys serving as residential quarters were semi-public spaces where the pass-through is prevented by the dead-end network of alleys [3,8].
1.1. Research Significance
This research fills the gap in studying MENA cities’ historical and contemporary urban fabric. The timing of results and conclusions of this research assists the decision-makers and developers in ending up with a sustainable, livable, and vibrant urban development.
1.2. Research Objectives
- Investigating the physical characteristics of urban areas, especially surrounding historical centers.
- Highlighting the urban morphology indices.
- Developing a framework that relates indices of urban morphology to sustainability aspects.
- Analyzing main urban features to identify physical characteristics that fulfill the socioeconomic and environmental requirements.
- Developing a set of design guides for the urban areas surrounding the historical centers within the MENA region.
1.3. Research Methodology
An analytical approach was followed to achieve the study objectives. The history of the city’s expansion stages was investigated. Six phases were identified, and samples were selected to represent these phases. A framework to examine the physical aspects of these samples was developed and utilized to explore the physical properties of the different types of these morphologies. The best features that provide a smooth transition between the historic center and the rest of the city’s contemporary urban areas were identified. The research methodology is summarized in Figure 1.
1.4. Sustainable Urban Fabric
Prosperous urban areas should be smart, livable, resilient, and sustainable [9]. Designers should benefit from the analysis of successful urban areas. Bai X et al. defined the research priorities in the field of observing and analyzing urban changes, understanding climate interactions, supporting the transformation of urban areas, and recognizing the global sustainability context [10]. Investigation and analysis of different urban morphologies are needed to understand and predict the impacts of urban form on urban characteristics. Outdoor spaces are essential elements of urban areas to local citizens’ quality of social and economic life. Thermal comfort has a dominant impact on outdoor activities and open urban areas setup [9]. It can help improve the quality of life and residents’ health [11]. Urban planners should consider the thermal aspects of microclimate as one of the main factors in achieving comfortable urban outdoor spaces [12]. At the same time, global warming negatively impacted thermal conditions within urban open spaces. Relatively, this impacts residents’ activities.
Moreover, the UN’ adopted Urban Agenda and Sustainable Development Goals require urban developers to embed environmental studies in urban management and upgrade processes [13]. Various urban patterns perform differently in terms of urban climatology. Investigation and analysis of different urban morphologies are needed to understand and predict the impacts of urban form on urban characteristics [10].
1.5. Urban Morphology Classification
The urban fabric is widely considered one of the most characteristic parameters of any urban area. The urban fabric was considered a representation of the urban character in all research through the last decade [14]. Many indicators have been suggested to classify urban morphology based on its accessibility, building physical characteristics, shape, or space structure [15]. Several theories have been developed to classify the urban fabric.
Newman et al. suggested a classification system based on mobility where three different types were identified; walkable areas, public transport, and automobile areas were proposed. They suggest that these three types overlap and interact in any city. They also indicated that the percentage of each one of these types differs from one city to another. Moreover, they concluded that cities with a more significant portion of walking urban fabric are more successful, sustainable, and livable [16].
Bastien Lefebvre et al. suggested a three-dimensional model to classify the urban fabric. This model is based on social activities, spatial distribution, morphology, and chronological sequence of functions [14]. XIN LI et al. defined five urban characteristics that can be used to classify urban fabric. These characteristics are based on fabric morphology; they include building densities and compactness where buildings and urban spaces are scaled to human scale and urban variation in proximity, similarity, continuation, closure, symmetry, and parallelism [17]. They also suggested that homogeneity and fragmentation of the groups of buildings within the urban block can be indicators [17].
Ravari argued that urban morphology is defined by its plots, buildings, paths, and other open spaces. In more detail, different authors described several indexes for these four indicators. Joan Perez et al. stated that a significant amount of research on urban spaces and building classifications uses quantitative indicators. Clustering is acquired by computing building parameters such as footprints, height, FAR, FAI, MAR, built-up area, and usage [15]. Arsiya et al. suggested that urban form can be classified by the number of paths per block, urban mass permeability as a void percentage, average width, length of paths, geographic orientation of paths, slope of paths, and distribution [18]. Researchers utilized urban morphology characteristics such as void percent, building density, Plot Ratio (PR), SVF, and FAI to study urban structure [19]. Chen et al. suggested urban morphology indicators, such as void percent, urban mass permeability, urban canyon ratios, plot ratio (PR), SVF, FAI, etc., to be used for urban classification [20]. Figure 2 summarizes the urban morphology indicators and their indexes. Detail of these indexes’ definitions and calculation equations are discussed later in the material and methods section.
1.6. Impact of Urban Morphology on Urban Sustainability
Prosperous urban areas are the base for flourishing sustainable communities [21,22]. Creating a built environment that provides services, praises a sense of pride and belonging, and conserves local cultural heritage assets.
Urban physical characteristics define microclimate character and outdoor comfort. Thermal comfort conditions affect people’s health and well-being in urban spaces [23]. In outdoor spaces, pedestrians are exposed to different solar radiations and wind speeds over time and space [12]. Users’ perception of the urban area is affected by its microclimate [23]. Dasaraden argues that using trees and reflective and porous materials can significantly improve the microclimate characteristics of any given urban space, reduce the urban heat island effect, and improve wind infiltration [24,25]. Features of urban morphology, street canyon, and urban canopy impact the urban microclimate and directly affect cities’ sustainable development plans aiming for the resilience, health, and comfort of city residents [26,27].
In their research, Lai et al. reviewed the seven indirect influencing categories: environmental, cultural, social, economic, behavioral, historical, and aesthetic categories [28]. Many other researchers suggested that various outdoor areas have different thermal comfort levels because of the differences in their physical aspects, such as SVF, canyon ratios, vegetation, landscape elements’ variation, and albedo [29,30,31,32]. Specifically, thermal comfort differences resulted from wind speed and radiant temperature differences among outdoor spaces [28,33]. However, other researchers argued that microclimate differences between different urban areas could not fully explain differences in thermal sensation. Outdoor spaces of Jeddah’s historic center and its surrounding demolished urban areas are well known for being pedestrian friendly. Irregular narrow urban paths of these urban areas protected pedestrians from the hot, humid weather during summer [1].
1.6.1. Relation between Urban Morphology Indicators and Environmental Aspects
Many studies investigated the complex relationship between these urban indicators and the thermal environmental aspects [34]. Thermal environmental factors, namely temperature, wind speed, average radiation temperature, etc., are usually calculated and utilized to represent thermal comfort within outdoor spaces [19]. The results of these studies showed that more than one urban morphology index is required to evaluate the direct impact of urban morphology on the thermal environment aspects [19,35]. Yuxin Yang c et al. concluded that building density could positively impact land surface temperature, while SVF has a slightly negative influence [19].
Concerning plots’ indicators, researchers confirmed the relation between the less dense urban fabric and wind acceleration [36]. Johansson concluded from his study of the Morrocan city Fez’s urban fabric that ventilation increases as the site coverage ratio decreases. He also relates the ventilation effect to building porosity at the pedestrians’ level [37]. As for buildings, Berardi and Wang found that the building’s porosity, and scale, impact wind speed [28,38]. Buildings’ obstruction to wind can be estimated by the FAI (λf), which represents the ratio between vertical surfaces facing the wind direction to the building area. Chatzidimitriou, Berardi, and Wang found that wind speed accelerates at the building corners [38,39,40]. Chen et al. concluded that street canyons with less than 30 degrees to the wind direction in high-density urban areas help achieve good ventilation [40].
Moving onto the paths’ indicators, results of some studies indicated that East-West oriented urban canyons provide better environmental conditions in hot zones because they create permanently shaded areas [9,41]. Ali and Mayer found that intermediate orientations such as NEW and NW-SE with the same SVF and H/W ratios were always partially shaded, thus offering an alternative to pedestrians during hot and cold seasons [42]. Compact urban spaces with a low SVF or high H/W ratio positively impact environmental conditions. Many studies confirmed a smaller SV decreases solar radiation penetration [43]. Finally, in discussing urban permeability indicators’ relations, previous research shows that air temperature, solar radiation, and wind speed levels in the dense urban fabric are mostly less than those in the lower dense urban fabric in hot climates. This eliminates radiation and reduces air temperature, which increases thermal comfort conditions [9]. Many studies suggested dense urban areas with deep canyons have cooler climates than less lush urban areas with shallow canyons [37]. Hung-Chu Chen et al. generally concluded that building height, plot area, and normalized difference vegetation index are the essential indicators for energy demand which is critical to relate the green economy and energy consumption to the urban physical character [44].
1.6.2. Relationship between Urban Morphology Indicators and Socioeconomic Aspects
A deeper focus on sustainable socioeconomic aspects is required to address the urban morphology indicators. Socially, responding to people’s social needs, promoting local values, creating a stronger community, and building safe feelings and a sense of belonging. Economically, achieving a green, prosperous, sustainable local economy, increasing property values, and creating more work opportunities while facilitating the growth of small innovative businesses [3].
The percentage of open spaces and space hierarchy is a product of the community’s sense of privacy and social interaction. Plot size and ratios represent the family’s social status within the community, enhancing the sense of belonging. Safety is negatively affected by inactive narrow alleys defined by long fences. Similarly, a larger plot size indicates higher property value and specific community aspects. It also impacts energy consumption. The smaller the plot size, the better the proximity and accessibility, leading to less energy consumption. Setbacks reflect social tolerance toward privacy. Buildings’ heights impact the sense of community for residents. Building size represents family status within the community, small buildings are for simple families, and building heights reflect the economic category. Multi-use buildings facilitate a striving economy for the local community, resulting in active outdoor spaces. Property values are directly related to the quality of structure and finishing materials. Building density impact local economic activities. Tall buildings increase the area of the outer shell exposed to the outside weather, increasing energy consumption.
The path’s width impacts the sense of intimacy. Activities distribution enhances the urban proximity. The street layout has a prominent role in the crime rates and feeling of safety within urban spaces. Reflecting the social structure of the local community is paths hierarchy. Degradation and segregation of paths affect the sense of belonging, intimacy, and community feelings.
Additionally, they are highly linked to property value. Paths percentage and coverage define urban accessibility, which contributes positively to energy consumption, while urban permeability facilitates easier accessibility. Open spaces allow for more social activities and interaction. In comparison, unprotected spaces increase thermal stress and eventually reduce outdoor activities throughout the summer seasons, especially during the day. Long obstructing buildings affect wind penetration and the thermal comfort of outdoor space users.
1.7. Framework for Assessing Urban physical Indicators on Aspects of Sustainable Urban
Table 1 presents a framework to assess the impact of urban morphology indexes on these quality aspects of the urban fabric. The shaded cells represent the proposed relationship between urban morphology indexes and urban sustainability features; The darker the shade, the stronger the impact.
2. Materials and Methods
The indicators of the four urban physical indexes, their definitions, and calculation equations are detailed in Table 2; these four indicators of the physical characteristics of urban areas are plots, buildings, paths, and urban mass permeability [45,46]. Based on this, selected plot indexes for characterizing the urban fabrics were total plot numbers per site area, average plot area, and width-to-depth ratios. Jeddah city has hot, humid weather for several months of the year; this was the reason for adopting the allowed construction area ratio and the frontal area indexes for this study. The significant difference between the historical and contemporary urban areas is that the new urban areas resulted from adopting different building regulations [47]. The following buildings’ indexes were considered to investigate the differences between urban fabrics: the floor area ratio, average height, buildings built-up area, footprint, and mean aspect ratio of the building envelope to its footprint [48]. Historical vernacular fabric responded to social, economic, and environmental needs [45,48].
Moreover, good ventilation and less penetrating solar radiation in outdoor spaces were the motives to include the following indexes of paths: number of routes within the site, average length, urban canyon ratios, path percentage of the total site area, main paths orientation, and slope. MENA historic centers have a unique character: condensed urban mass with narrow paths [5]. Permeability indexes can be used to discern the degree to which factors exist between different fabrics, especially between the historic area and other types of urban fabrics. The void percentage of the urban mass, paths’ average width, the Absolute Rugosity (AR), and the SVF directly impact solar radiation penetration within urban spaces are the permeability factors [40,45,49].
2.1. Case Study
2.1.1. Jeddah Overview
Jeddah is the second-highest populated city in the Kingdom, with 4.3 million [50]. Jeddah city is doubled in size several times over the last century. The city is under a significant development project, where the UNESCO-nominated historical center of the city is under a restoration and reuse project. The surrounding deteriorated old urban areas were demolished and subject to an urban replacement development policy. Figure 3 shows the historical site and the demolished deteriorated area. New designs have not been concluded yet. The local authorities and the strategic 2030 Kingdome vision require a sustainable design approach for this development. The timing of this study gives its results extra attention from local academics and professionals.
The city is located on Saudi Arabia’s west coast of the Red Sea at latitude 21.4858° N, 39.1925° E. It is considered within the hot-humid region [50]. Figure 4 illustrates the critical climate data extracted from the king Abdul-Aziz airport weather station. Figure 4a shows the wind directions. It usually blows over the city from the Northwestern and western directions due to its coastal location on the shore of the Red Sea. As shown in Figure 4b, the average temperature ranges between 18 and 39 °C; in rare periods, it goes below 16 °C or above 46 °C. The sky is clear most of the time, with a 2 to 18% cloud cover. Figure 4c illustrates that the air is mainly humid, with a relative humidity range between 30 and 89%. High seawater temperatures during summer make it the Humid season. Solar angle is 40° between 10:30 and 13:30 throughout the year, with direct radiation ranging from 800 W/m2 to 1000 W/m2 in the summer [51].
Jeddah’s contemporary urban morphology shows a consistent pattern and spatial organization. Masoud et al. noted that Jeddah’s urban fabric is mostly a gridiron, with the historic urban center and the sprawls being about 5%. The rest of the urban areas are oriented as follows: 15% of the city’s urban area is oriented Northwest–Southeast, 60% to North–South, and 20% Northeast–southwest [51]. In their analysis of Jeddah’s development, several researchers illustrated the city’s development starting from 1850 up to this day [3,51,52,53,54]. Abdulaal identified six sequential phases of the city shown in Figure 5 [53], while Masoud presented only four stages with different time sequences [51]. Analyzing the morphology of the urban expansion characteristics, Masoud et al. identified fabric typologies from the seventies era that have similar gridiron with different urban attributes in terms of building heights and density. Based on the given phasing of the city’s growth, this study attempts to compare the urban characteristics of urban samples representing the six phases suggested by Abdulaal [53]. Each one of the urban expansions of Jeddah city reflects the socioeconomic condition of the city in its related era. Its urban came as a reflection of dictating socioeconomic factors. The historic city was founded as the main port of the red seashore. The first recognized expansion of the historic city started during the sixties after demolishing the city walls, directly after the formation of the Saudi Kingdom [1,3,53]. Later during the seventies, the first oil price boom led to a significant socioeconomic change reflected by the need for new urban areas that better accommodate modern western-style services [6]. During the eighties, the newly implemented compact city urban policy changed the existing urban areas, increasing the densities and once again reducing the quality of the existing districts. New urban areas with less dense areas were constructed to meet the socio-cultural needs of residents [7,21]. The same pattern with repeated during the nineties. At the end of this millennium, a new oil boom resulted in the need for another phase of districts with fewer building densities, more services, and larger open spaces [55].
Two oil prices are booming [2], reflected differently in the resulting urban physical character. During the seventies boom, there was a need for housing units for expatriates. At the beginning of this millennium, the trend was set to low-height buildings and fewer dense neighborhoods with large green areas and facilities [2,53,54].
Based on analyzing Jeddah’s urban growth and fabric characteristics, six urban samples were identified to represent the different urban fabrics of the city. Figure 6a illustrates the selected six sites and their relation to the city’s growth phases. Figure 6b shows the historic city center and the UNESCO-listed buildings that will be the control sample.
2.1.2. Study Sites
Study cases were selected to fulfill the following criteria: belonging to one of the six identified city urban expansions, residential land use, multi-housing units, a defined site with clear borders, and a total area of about 500 × 500 m.
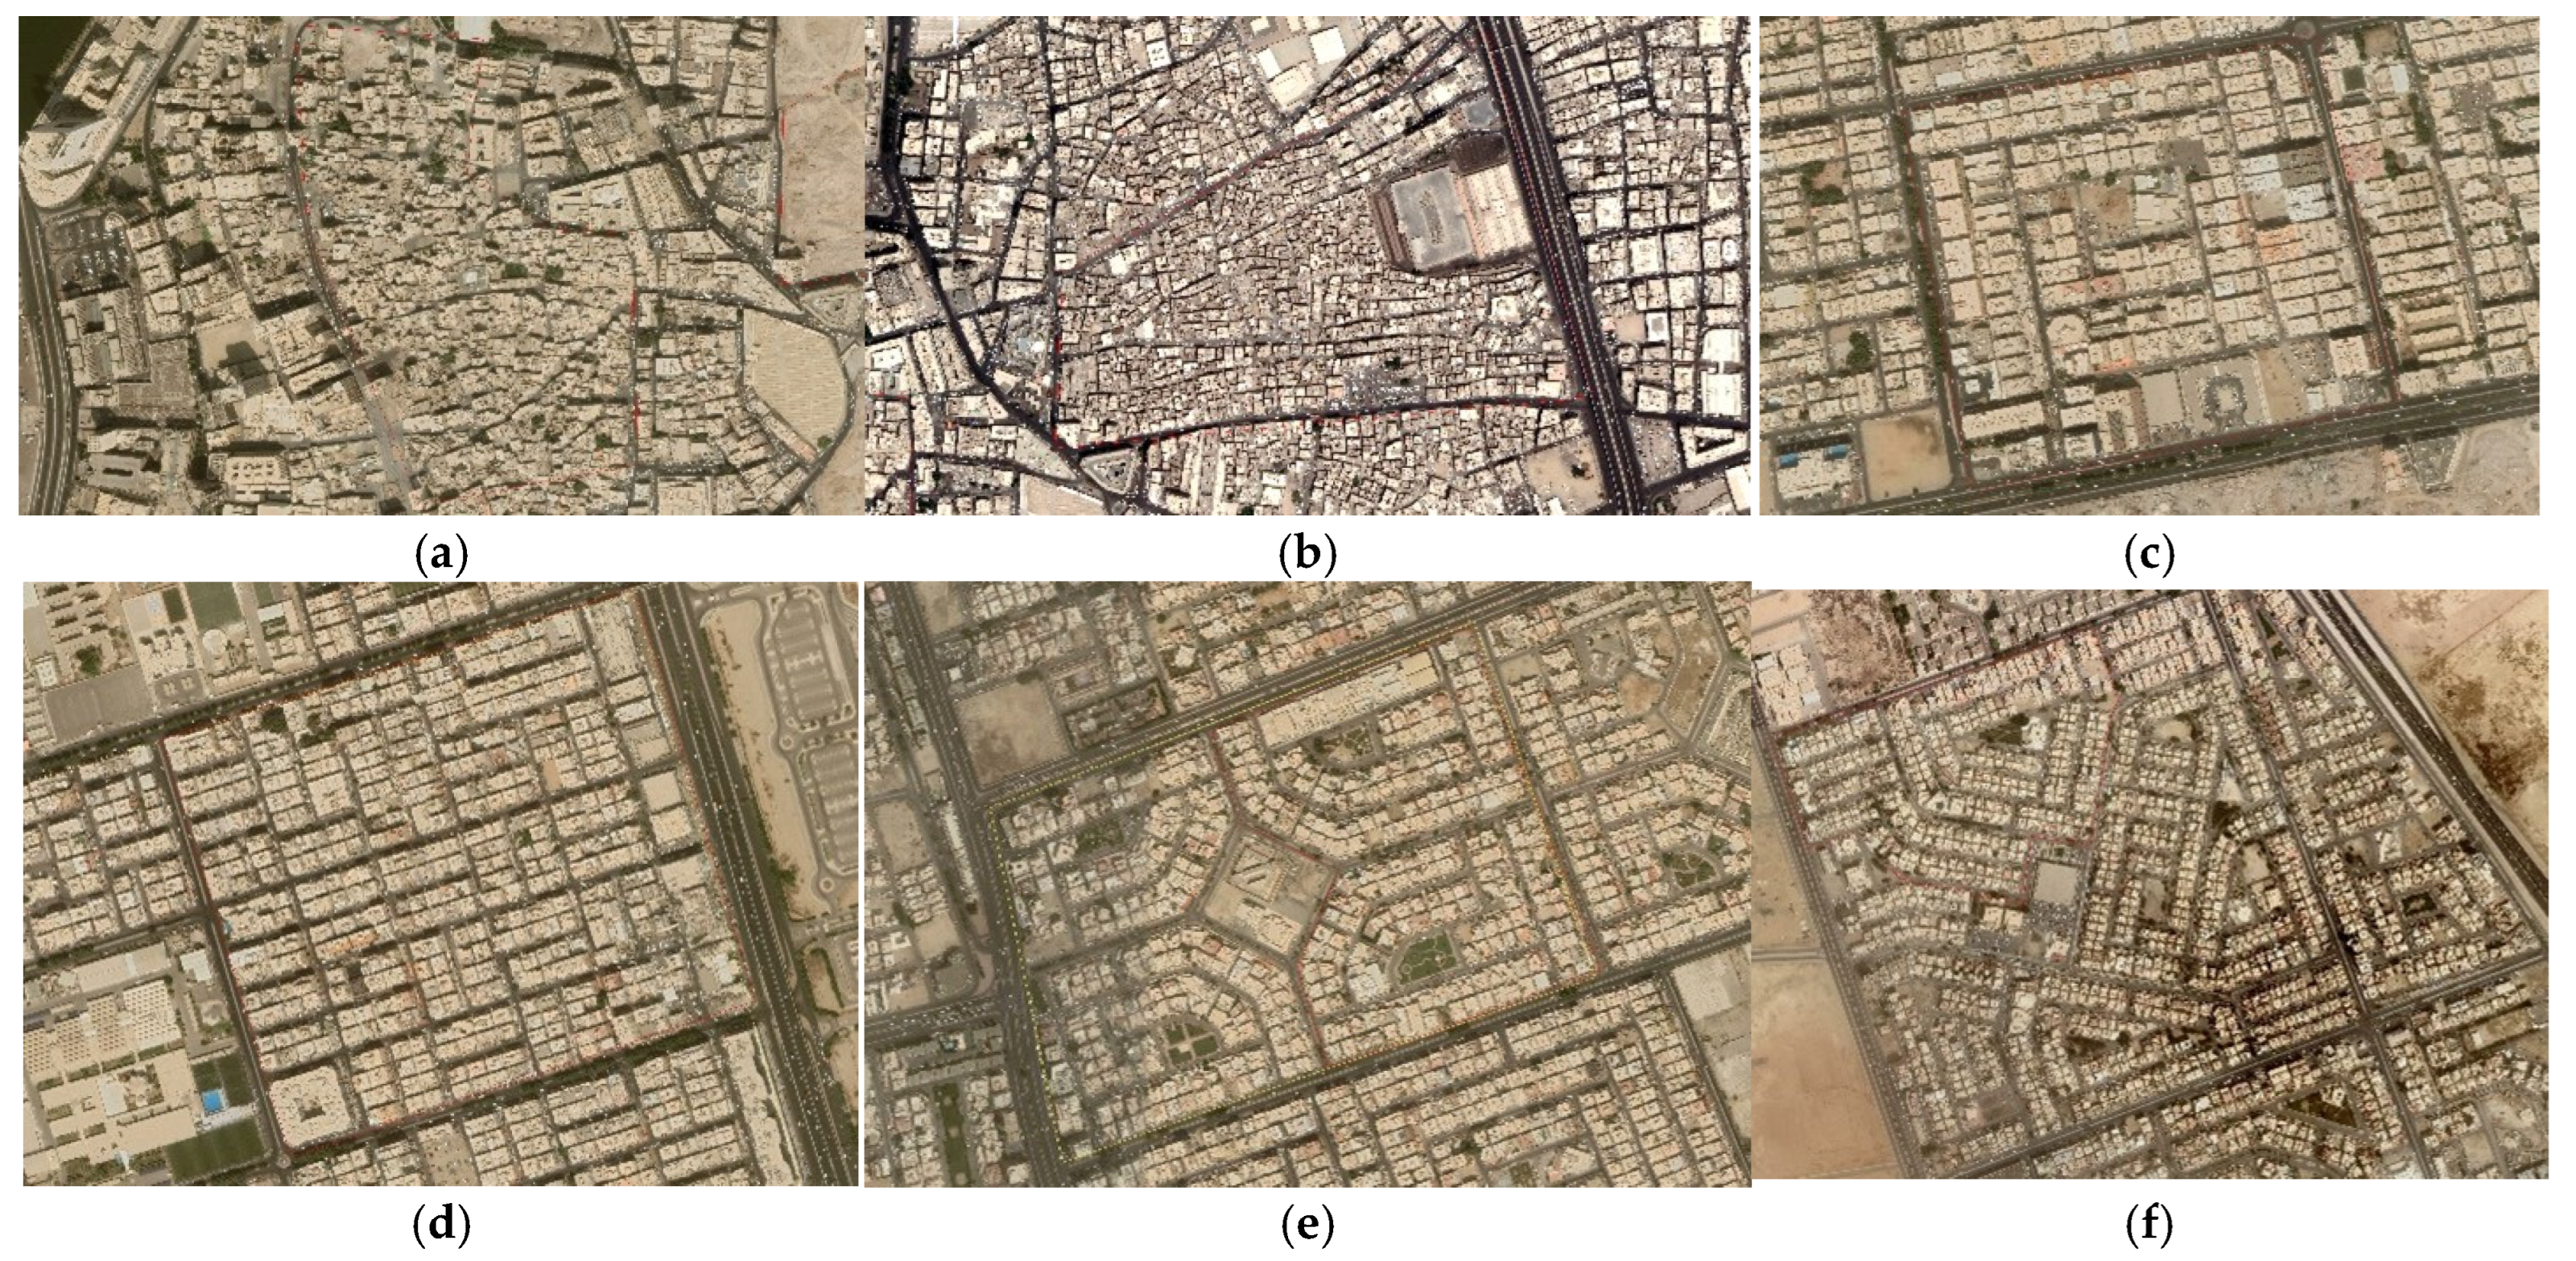
Figure 7a–f illustrates the urban fabric of the selected six sites. Figure 7a: The first site, the Al-Balad site, is the historical area once bounded by the city walls. It is mostly housing units with commercial activities along the main alleys of the site. Figure 7b: the second site, the Al-Nazala Al-Sharqiah, is part of the vernacular urban expansion outside the historic city’s walls. Figure 7c: The third site, the Musharaf district, represents the urban extension that belonged to the seventies that was impacted by the oil boom and its accompanied socioeconomic changes. Urban of this era had high densities, the tallest residential buildings, and the largest plot areas. Figure 7d: the fourth site is the Al-Fiasalia site which represents the eighties with its sizeable economic gross and the need for high-density housing to fulfill the requirement of the housing market to accommodate expatriates and their families that came to the city for work. Figure 7e: The fifth site is the Al-Neem which is part of a city neighborhood where city residents moved from the old city to less congested housing areas. The area has wider streets, small plot areas, low building heights, and more facilities and services. Figure 7f: The last site is the Al-Mohamdia area, one of the newest areas with low-density housing and more facilities and services, including large outdoor spaces and central green areas. Al-Naeem and Al-Mohamadia sites were symmetrical and had the same characteristics in the plot area, building height, and built-up area, so a portion of the site that matched the other site areas was defined for analysis.
The base map was obtained as CAD files from Jeddah Municipality for educational use. The author collected the historic center of Jeddah city data through physical surveys between 2015 and 2020 that were updated in 2021 as course materials for GIS postgraduate courses in Effat and Umm Al-Qura Universities. The author surveyed all physical data of other sites in 2022. Factors of the four main physical urban characteristics’ plots, buildings, paths, and urban mass were selected as urban indexes, and their equations were modeled. ArcGIS 10.5 was used to calculate the detailed indexes, a geodatabase of the six sites was built, and the six areas information was collected and entered. Calculations were modeled and run, and the generated indicators shown in Table 3 were extracted from the 2D and 3D models and the GIS database. A significant difference was identified in the historical area between the protected listed buildings and the rest of the historic center in plot areas and building heights due to the applied regulations for these areas. For this reason, a decision was made to stick to the UNESCO-listed site rather than the historic center. Building heights of the demolished Al-Nazlah urban area were collected from the historical maps of Google Earth.
Urban fabric classification was defined through several steps: Firstly, a 2D drawing of each of the six urban samples of Jeddah city expansions was extracted from the Geographic Information Systems developed by the author. Secondly, a 3D model of buildings was built for each site using Rhino 7.5 and Grasshopper 1.0.000.7 for SVF calculations. Thirdly, geodatabases for the case studies were developed using Esri ArcGIS 10.5. Finally, urban indicators were modeled, and variables for each case study were generated from the collected urban datasets.
3. Results and Discussion
Results in Table 3 show similarities in urban fabric indicators between the Al-Balad and the Al-Nazala area. Plot indicators’ values show similarity in plot areas, number of plots, and plot ratio, while the FAI for the historic center is higher than in the Al-Nazlah area. Both sites have the same value as the floor area ratios (FAR) (and “one” value for the building indicators). A very similar footprint, building heights, built-up area, and mean aspect ratio. Paths indicators showed a similarity in orientation, slope, urban canyon ratios, and road area percent. For mass permeability, identical void percent and path width can be noticed. At the same time, the historic center indicators have better values in the SVF and the Absolute Regrosity (Ra) indicators. Indicators of the two new urban expansions, the Al-Naeem and the Al-Mohamadia sites, show similarities. The indicators reflect a low-density urban fabric with large (SVF) and exposed outdoor urban spaces. These indicators’ values are very different from the historic area indicators.
The indicators of Musharafa and Al-Faisalia areas are moderately built-up areas with the tallest buildings. A low FAI allows the wind to move freely through the urban fabric of the gridiron from north to south and does not help the western wind to ventilate the sites. Urban canyon indicators show that outdoor spaces are moderately protected from radiation.
Based on the framework suggested by this study for relating the urban morphology indicators to sustainability aspects of urban, the following section highlights the results and their implications on the characteristics of each of the six case studies.
Al-Balad plot indicators showed that the site has the smallest average plot area with an average of 148 m2 and the second-highest number of plots with a total of 785 parcels. At the same time, buildings are built on 100% of the plot area with the highest construction ratio. Plot areas constitute 69% of the historical center; at the same time, homes have private outdoor spaces such as inward open spaces, “courtyards,” and visually protected traces of “Kharajah,” allowing for family outdoor activities while maintaining family privacy. Three- to four-floor buildings with an average of 10.88 m, the smallest mean aspect ratio (1.93), and the highest FAI 0.88 reflect a dense urban mass with minimum public spaces. Such urban mass provides maximum protection from sun radiation and wind obstruction. The second narrowest urban canyons among the studied sites, with a 7.2 m average width and the smallest SVF equal to 0.37, provide maximum protection to outdoor public space users from direct sun radiation [56].
Moreover, irregular paths with main paths going from east to west create permanent shaded outdoor areas. Notably, the 244.9 m main paths’ average length is almost the same as the average of the rest of the sites, which provides a walkable urban block with good accessibility. The urban volume represented by the Absolute Rugosity ratio of 0.7 is the smallest compared to the other sites, which positively impacts energy consumption [44].
The Al-Nazlah Al-Sharqiah site has plot indicators similar to the Al-Balad site with slight differences where the average plot area is about 194 m2 and the floor area ratio of 1, and a condensed urban mass with a 29% void ratio. This reflects an urban area with a solid mass that can be considered an expansion for the Al-Balad area, has the same open space structure and percentages, and fulfills all the environmental and socioeconomic requirements. Despite that, the 0.60 FAI is smaller than Al-Balad; it is still far smaller than the average of the six sites. The frontal Area Index, along with the 9.67 m average building height and the 1.0 construction ratio, provides the same thermal protection for outdoor users from weather conditions [34,51]. The paths are irregular, with the smallest average width of 5.2 m, and the main paths oriented from east to west allow for protection from wind penetration and full-time shaded outdoor spaces. At the same time, main paths allow sea breath from the west to move through the urban mass. The Al-Nazlah and Al-Balad areas have minimal path coverage compared to the other sites, reflecting good walkability and accessibility and better outdoor spaces for socioeconomic activities. It is worth mentioning that both areas do not easily accommodate vehicle movement within most of the site blocks.
The Mushrafa site, with its 840 m2 plot area, has the largest plot area among the other sites, the tallest average building height of 14.27 m, a Floor Area Ratio of 0.80, and the largest Mean Aspect Ratio of 3.37. These indicators make this site the most populated site. With 37% of the site area dedicated to streets with an average width of 15 m and total outdoor spaces of 51%, including setbacks, the area is considered the densest site among the six samples. The urban fabric is composed of a gridiron pattern. The main paths are directed from north to south with a moderate SVF of 0.42; this implies that outdoor spaces are partially protected from solar radiation, while the urban mass does not provide enough protection from unpreferred wind penetration.
Al-Faisalia plot indicators showed that the site has a moderate plot area compared to the other sites, with an average of 506 m2, similar to the number of plots with a total of 416 parcels. Construction ratio shows that buildings are built on 0.8 of the plot area with a Floor Area Ratio of 0.76. Plot areas constitute 63% of the site. Buildings have an average of 13.48 m, a Mean Aspect Ratio of 2.84, and a moderate FAI of 0.32, reflecting a permeable urban mass with a 49% void ratio. Such urban mass provides minimum protection from sun radiation and wind obstruction. An average urban canyon’s width among the selected sites, with a 16 m average width and SVF equal to 0.45, provides the least protection to outdoor users from solar radiation [40,49]. As for the urban fabric, the gridiron pattern with main paths going from north to south with 16 m width does not provide the needed shade for outdoor users. Notably, 249 m main paths’ average length is almost the same as the average of the rest of the sites, allowing for accommodating vehicle movement with good accessibility. Unlike the Al-Balad area, the lack of extended shade and solar radiation does not support socioeconomic activities during the day within the outdoor spaces. The urban volume represented by the Absolute Rugosity ratio of 1.94 is the highest compared to the other sites, negatively impacting energy consumption [44].
Al-Neem has the largest average plot area of 675 m2, a comparatively small Floor Area Ratio of 0.64, and the smallest Construction Ratio of 0.6, which means that the urban mass is segmented and segregated. Plot areas are only 55% of the total site area, reflecting a permeable urban mass with the largest void ratio of 53% of the entire site. These indicators show that both the buildings and the outdoor spaces are exposed to solar radiation causing, exposing the users to thermal stress. At the same time, Buildings have the shortest height with an average of 8.35 m, the second smallest Mean Aspect Ratio of 2.448, and the smallest FAI of 0.15. These characteristics provide the least sustainable urban in terms of providing a suitable environment to accommodate outdoor users’ activities.
Moreover, the site has the second most expansive urban canyons among the selected sites, with a 22 m average width and SVF equal to 0.60, providing the least protection to pedestrians from solar radiation [12,51]. As for the urban fabric, the angled pattern with central space contains the neighborhood services, including the garden. This centrality does not well serve the community in terms of walkability and privacy. The paths going from north to south with 16 m width do not provide the needed shade for outdoor users. Notably, 249 m main paths’ average length is almost the same as the average of the rest of the sites, allowing for accommodating vehicle movement with good accessibility. Unlike the Al-Balad area, being exposed to high temperature and humidity does not support either walkability or other socioeconomic activities during the day within the outdoor spaces for several months of the year. The urban volume represented by the Absolute Rugosity ratio of 1.93 is the second highest compared to the other sites, negatively impacting energy consumption [44].
Mohamdia is the newest built site of the six selected sites. Plot indicators showed that the site has a moderate plot area compared to the other sites, with an average of 504 m2. With the lowest Construction Ratio at 0.6 and the lowest Floor Area Ratio at 0.57, outdoor spaces of about 40%, and total void within the urban mass equal to 48%, this site is badly exposed to the climate conditions of the hot, humid weather. Four-floor buildings with an average height of 11.43 m, the highest Mean Aspect Ratio of 3.69, and a moderate FAI of 0.27 characterizes a permeable urban mass with a 48% void ratio. In urban environments with these indexes, surfaces are exposed to solar radiation. The highest street width at 24 m and SVF equal to 0.64 represents the least protection for outdoor users from solar radiation and thermal heat among the rest of the six study areas [40,49]. This site shows the urban form of a western-style neighborhood where spaces are designed for vehicle movement with structured central spaces. The Urban area presents a fabric that accommodates services with wide streets from the Northeast to the southwest. Such spaces do not provide the needed shade for pedestrians or socioeconomic activities. Unlike the Al-Balad area, this fabric does not support sustainable activities for several months of the year. Moreover, the urban volume represented by the Absolute Rugosity ratio of 1.93 is the second highest compared to the other sites, negatively impacting energy consumption [44].
Based on the analysis of the six case studies, it was proved that the historic area, with its small SVF and condensed urban mass, protects outdoor users from solar radiation penetration. At the same time, three to four-floor building heights and the east-west main paths allow the sea breeze to pass through open spaces, helping to reduce the humidity within these spaces. In her study, Masoud et al. also reached a similar conclusion regarding the impact of the dense urban mass of the Al-Balad area on reducing solar radiation penetration and providing better pedestrian thermal comfort [51]. The outdoor spaces’ structure allows for social and economic activities to flourish while maintaining privacy and other social requirements. The narrow paths do not support vehicle movement, creating a problem in providing services for the area residents. In line with this, David et al. noted that the area suffers from traffic, parking, and waste disposal issues [22].
According to their analysis of local socio-cultural aspects and weather conditions, Fatani et al. argued that 200 to 300 m is an adequate walking distance for Saudis [21]. The results of this study proved that, except for Muhamadia, the main paths’ lengths of all the sites are walkable. In addition, Fekry et al. presented that 82% of their survey participants feel safe walking on the Jeddah streets when there is a clear separation between pedestrians and vehicles and shaded walkways [47]. Al-Balad and Al-Nazlah Al-Sharqia sites have shaded alleys that cannot accommodate vehicle traffic, so pedestrians feel safe walking there. Hassan investigated the results of implementing compacting policies on the urban configuration of districts developed during the seventies and eighties. He concluded that the resulting densification policy implemented by the Municipality led to population densities increasing drastically in the affected districts. As a result, the overloaded infrastructures caused many social and physical problems, such as frequent power cuts, water pipes explosions, and lack of privacy due to the compactness and rising densities [55].
Musharafa and Al-Fisalia case studies belong to the same era and suffer from similar issues. The results of this study show that due to implementing such policies, both areas indicate severe urban problems regarding their Mean Aspect Ratio, building heights, and Absolute Regrosity, showing less sustainable urban fabric in terms of environmental and socioeconomic aspects.
In a study based on an expert survey, Fatani et al. revealed that linking the neighborhood to adjacent ones will increase social interaction and economic base. Moreover, she concluded that commercial facilities in the neighborhood would benefit both areas’ residents and adjacent ones. This conclusion goes with this research proposal to design the demolished urban areas surrounding the historic center of the Al-Balad area. Preserving the spatial characteristics of the historical urban environment and the social dimension grants sustainable development [57].
4. Conclusions and Recommendations
The study demonstrated that urban fabric could be presented comprehensively by analyzing the relationship between physical indicators and the distribution pattern of their impact on urban sustainability. This paper uses quantitative indicators to examine the classification of urban fabric based on its physical characteristics utilizing nineteen indexes. The main indicators were plots, buildings, paths, and urban mass permeability. Moreover, the study introduced a framework to relate the urban morphology indexes to urban sustainability, highlighting environmental and socioeconomic aspects. Six sites representing Jeddah expansion phases were selected for investigation. Jeddah’s historical center urban fabric was used as a control sample to be compared with other urban fabrics representing city expansions through the past century.
Results indicated historic center (Al-Balad) and the demolished neighboring vernacular urban area (Al-Nazala Al-Sharqia) have similar physical characteristics. Both fabrics fulfilled the environmental and social requirements. They provide a good environment to accommodate active outdoor economic and social activities. The two urban sites from the seventies (Musharafa) and eighties (Al-Faisalia) were subject to compact urban policies, negatively impacting the urban indexes and qualities. The resulting urban mass has high-density buildings with comparatively fewer services being provided due to the compactness of the urban. This is compared to the older versions of these areas. Moving on to the nineties (Al-Neem) and the 2000s (Mohamdia), these sites exhibited a more western-style urban design with urban physical indexes that showcase a negative response to the environmental aspects. It was found that the high percentage of open spaces does not support social interactions or economic activities.
As it is possible to rely on urban heritage as an economic development resource for the neighboring urban areas, that is, taking into consideration all factors to guarantee the sustainable development of such areas [58]. Although it is challenging to copy the historical urban fabric to neighboring urban developments considering socioeconomic and environmental factors, the surrounding area has to make a smooth transition in the urban character in terms of plots, buildings, paths, and urban mass permeability. Policymakers have to consider the following strategies in their development plans for the urban areas surrounding historical centers to achieve a smooth transition between the historic fabric and the rest of the contemporary city urban areas:
- Plot divisions and building setback regulations that ensure permeable urban mass, allowing for free wind movement.
- Building regulations should maintain a gradual increase in building heights, starting at a low point next to the historic center to achieve a homogeneous skyline.
- New developments in surrounding areas’ open spaces need to be structured similarly to the outdoor spaces of the historic area, providing narrow shaded pedestrian dedicated paths to encourage vigorous outdoor social and economic activities.
- Matching and linking existing urban paths to the new development paths.
- While developing the area surrounding the historic center, consideration should be made to include services that serve the historic area and the new developments.
- Land use should benefit from the historic center as a commercial asset and complement the existing activities within the historic center.
In conclusion, one of the principal contributions of this study is that it presents a structured, modular set of quantitative urban indexes to analyze urban morphology. Moreover, the suggested framework links these indexes to the urban sustainability aspects. At the same time, the developed dataset allows easy and fast comparative analysis for the urban fabrics of Jeddah city, which provide the base for improvement to the city’s urban characterization. The suggested design guidelines are designed to be applied to other regional cities.
The main limitation of this type of study is the data accuracy, especially historical satellite images, on which the analysis is based. Care was taken to ensure that the used data were accurate and up to date to produce reliable results. Another limitation was the difficulty in utilizing an equal sample size to make it possible to compare. Analysis based on ratio indicators helps achieve comparable results.
Moreover, there is a research gap in utilizing interdisciplinary work during the design phases [32]. Further analysis of the urban thermal performance of different fabrics of urban areas, especially the historical and vernacular fabrics within the MENA region, is required since it is the most crucial factor affecting pedestrian activities in terms of their type, time, and necessity [3]. Another field for future study is the potential of utilizing local socio-culture aspects as an economic asset for sustainable development and their impact on the business models of any adaptive reuse of the historical centers and their surrounding urban areas.
Funding
The authors would like to thank the Deanship of Scientific Research at Umm Al-Qura University for supporting this work by Grant Code: (22UQU4220159DSR01).
Institutional Review Board Statement
Not applicable.
Informed Consent Statement
Not applicable.
Data Availability Statement
The author collected, verified, and analyzed all data, maps, and 3D models used to develop the results reported in this research.
Conflicts of Interest
The author declares no conflict of interest.
References
- Shehata, A.M. Current Trends in Urban Heritage Conservation: Medieval Historic Arab City Centers. Sustainability 2022, 14, 607. [Google Scholar] [CrossRef]
- Alraouf, A.A. Contemporary gulf cities’ urbanism: The dilemma of unsustainable developments and energy conservation. In The Political Economy of Energy Reform: The Clean Energy Fossil Fuel Balance In The Gulf States; Luciani, G., Ferroukhi, R., Eds.; Gerlach Press: Berlin, Germany, 2014; pp. 183–204, Chapter 7. [Google Scholar]
- Badawy, S.; Shehata, A.M. Sustainable urban heritage conservation strategies—A case study of historic Jeddah districts. In Cities’ Identity through Architecture and Arts; Catalani, A.Z.N., Versaci, A., Hawkes, D., Bougdah, H., Sotoca, A., Ghoneem, M., Trapani, F., Eds.; Taylor & Francis Group: London, UK, 2018; pp. 83–97. [Google Scholar] [CrossRef]
- Shehata, A.M.A.E.-R.; Mostafa, M.M.I. Open Museums as a Tool for Culture Sustainability. Procedia Environ. Sci. 2017, 37, 363–373. [Google Scholar] [CrossRef]
- Moubarak, L.M. The Egyptian city centers in the Islamic era: Image analysis, evaluation and contemporary reflection. J. Eng. Sci. Assiut Univ. 2020, 48, 538–553. [Google Scholar]
- Saad, T.R. Investigating the cultural landscape identity of Jeddah, KSA. WIT Trans. Built Environ. 2018, 177, 51–62. [Google Scholar]
- Fatani, K.A.; Mohamed, M.; Al-Khateeb, S. Survey Based Sustainable Socio-Cultural Guidelines for Neighborhood Design in Jeddah. IOP Conf. Ser. Earth Environ. Sci. 2019, 385, 012050. [Google Scholar] [CrossRef]
- Mandeli, K.N. The transformation of public spaces in Saudi cities a case study of Jeddah. In Proceedings of the Saudi International Conference, Coventry, UK, 26 June 2019. [Google Scholar] [CrossRef]
- Lai, D.; Liu, W.; Gan, T.; Liu, K.; Chen, Q. A review of mitigating strategies to improve the thermal environment and thermal comfort in urban outdoor spaces. Sci. Total. Environ. 2019, 661, 337–353. [Google Scholar] [CrossRef]
- Bai, X. Six research priorities for. Springer Nat. 2018, 555, 22–24. [Google Scholar]
- Boumans, R.J.; Phillips, D.L.; Victery, W.; Fontaine, T.D. Developing a model for effects of climate change on human health and health–environment interactions: Heat stress in Austin, Texas. Urban Clim. 2014, 8, 78–99. [Google Scholar] [CrossRef]
- Nikolopoulou, M.; Baker, N.; Steemers, K. Thermal comfort in outdoor urban spaces: Understanding the human parameter. Sol. Energy 2001, 70, 227–235. [Google Scholar] [CrossRef]
- United Nations Framework Convention on Climate Change. Yearbook of Global Climate Action 2021; United Nations Framework Convention on Climate Change: Bonn, Germany, 2021. [Google Scholar]
- Lefebvre, B.; Rodier, X.; Saligny, L. Understanding urban fabric with the oh_fet model based on social use, space and time. Archeol. Calc. 2008, 19, 195–214. [Google Scholar]
- Joan, P.; Giovanni, F.; Alessandro, A.; Fuse, A. Building typologies for urban fabric classification: Osaka and Marseille case studies. In Proceedings of the International Conference on Spatial Analysis and Modeling, Paris, UK, 17–18 May 2024. [Google Scholar]
- Newman, P.; Kosonen, L.; Kenworthy, J. Theory of urban fabrics: Planning the walking, transit/public transport and automobile/motor car cities for reduced car dependency. Town Plan. Rev. 2016, 87, 429–458. [Google Scholar] [CrossRef]
- Li, X.; Lv, Z.; Hijazi, I.H.; Jiao, H.; Li, L.; Li, K. Assessment of Urban Fabric for Smart Cities. IEEE Access 2016, 4, 373–382. [Google Scholar] [CrossRef]
- Ravari, A.A.; Mazloomi, M. A framework for urban morphology with respect to the form. Arman. Archit. Urban Dev. 2015, 8, 91–103. [Google Scholar]
- Yang, J.; Yang, Y.; Sun, D.; Jin, C.; Xiao, X. Influence of urban morphological characteristics on thermal environment. Sustain. Cities Soc. 2021, 72, 103045. [Google Scholar] [CrossRef]
- Chen, W.; Wu, A.N.; Biljecki, F. Classification of urban morphology with deep learning: Application on urban vitality. Comput. Environ. Urban Syst. 2021, 90, 101706. [Google Scholar] [CrossRef]
- Fatani, K.; Mohamed, M.; Al-Khateeb, S. Sustainable Socio-cultural Guidelines for Neighborhood Design in Jeddah. Procedia Environ. Sci. 2017, 37, 584–593. [Google Scholar] [CrossRef]
- Throsby, D.; Petetskaya, K. Heritage-led urban rehabilitation: Evaluation methods and an application in Jeddah, Saudi Arabia. City Cult. Soc. 2021, 26, 100397. [Google Scholar] [CrossRef]
- Potchter, O.; Cohen, P.; Lin, T.-P.; Matzarakis, A. Outdoor human thermal perception in various climates: A comprehensive review of approaches, methods and quantification. Sci. Total Environ. 2018, 631–632, 390–406. [Google Scholar] [CrossRef]
- Mauree, D.; Naboni, E.; Coccolo, S.; Perera, A.; Nik, V.M.; Scartezzini, J.-L. A review of assessment methods for the urban environment and its energy sustainability to guarantee climate adaptation of future cities. Renew. Sustain. Energy Rev. 2019, 112, 733–746. [Google Scholar] [CrossRef]
- Perini, K.; Calise, C.; Castellari, P.; Roccotiello, E. Microclimatic and Environmental Improvement in a Mediterranean City through the Regeneration of an Area with Nature-Based Solutions: A Case Study. Sustainability 2022, 14, 5847. [Google Scholar] [CrossRef]
- Luber, G.; McGeehin, M. Climate Change and Extreme Heat Events. Am. J. Prev. Med. 2008, 35, 429–435. [Google Scholar] [CrossRef]
- Li, J.; Mao, Y.; Ouyang, J.; Zheng, S. A Review of Urban Microclimate Research Based on CiteSpace and VOSviewer Analysis. Int. J. Environ. Res. Public Health 2022, 19, 4741. [Google Scholar] [CrossRef] [PubMed]
- Lai, D.; Lian, Z.; Liu, W.; Guo, C.; Liu, W.; Liu, K.; Chen, Q. A comprehensive review of thermal comfort studies in urban open spaces. Sci. Total. Environ. 2020, 742, 140092. [Google Scholar] [CrossRef]
- Lamarca, C.; Qüense, J.; Henríquez, C. Thermal comfort and urban canyons morphology in coastal temperate climate, Concepción, Chile. Urban Clim. 2018, 23, 159–172. [Google Scholar] [CrossRef]
- Canan, F.; Golasi, I.; Ciancio, V.; Coppi, M.; Salata, F. Outdoor thermal comfort conditions during summer in a cold semi-arid climate. A transversal field survey in Central Anatolia (Turkey). Build. Environ. 2018, 148, 212–224. [Google Scholar] [CrossRef]
- Ali, S.B.; Patnaik, S. Thermal comfort in urban open spaces: Objective assessment and subjective perception study in tropical city of Bhopal, India. Urban Clim. 2018, 24, 954–967. [Google Scholar] [CrossRef]
- Xu, X.; Yin, C.; Wang, W.; Xu, N.; Hong, T.; Li, Q. Revealing Urban Morphology and Outdoor Comfort through Genetic Algorithm-Driven Urban Block Design in Dry and Hot Regions of China. Sustainability 2019, 11, 3683. [Google Scholar] [CrossRef]
- Niu, J.; Liu, J.; Lee, T.-C.; Lin, Z.; Mak, C.; Tse, K.-T.; Tang, B.-S.; Kwok, K.C. A new method to assess spatial variations of outdoor thermal comfort: Onsite monitoring results and implications for precinct planning. Build. Environ. 2015, 91, 263–270. [Google Scholar] [CrossRef]
- Raman, V.; Kumar, M.; Sharma, A.; Froehlich, D.; Matzarakis, A. Quantification of thermal stress abatement by trees, its dependence on morphology and wind: A case study at Patna, Bihar, India. Urban For. Urban Green. 2021, 63, 127213. [Google Scholar] [CrossRef]
- Tsoka, S.; Tsikaloudaki, K.; Theodosiou, T. Urban space’s morphology and microclimatic analysis: A study for a typical urban district in the Mediterranean city of Thessaloniki, Greece. Energy Build. 2017, 156, 96–108. [Google Scholar] [CrossRef]
- Nasrollahi, N.; Hatami, Z.; Taleghani, M. Development of outdoor thermal comfort model for tourists in urban historical areas; A case study in Isfahan. Build. Environ. 2017, 125, 356–372. [Google Scholar] [CrossRef]
- Johansson, E.; Emmanuel, R. The influence of urban design on outdoor thermal comfort in the hot, humid city of Colombo, Sri Lanka. Int. J. Biometeorol. 2006, 51, 119–133. [Google Scholar] [CrossRef]
- Berardi, U.; Wang, Y. The Effect of a Denser City over the Urban Microclimate: The Case of Toronto. Sustainability 2016, 8, 822. [Google Scholar] [CrossRef]
- Chatzidimitriou, A.; Yannas, S. Microclimate design for open spaces: Ranking urban design effects on pedestrian thermal comfort in summer. Sustain. Cities Soc. 2016, 26, 27–47. [Google Scholar] [CrossRef]
- Chen, L.; Ng, E.; An, X.; Ren, C.; Lee, M.; Wang, U.; He, Z. Sky view factor analysis of street canyons and its implications for daytime intra-urban air temperature differentials in high-rise, high-density urban areas of Hong Kong: A GIS-based simulation approach. Int. J. Clim. 2010, 32, 121–136. [Google Scholar] [CrossRef]
- Coutts, A.M.; Beringer, J.; Tapper, N.J. Investigating the climatic impact of urban planning strategies through the use of regional climate modelling: A case study for Melbourne, Australia. Int. J. Clim. 2008, 28, 1943–1957. [Google Scholar] [CrossRef]
- Ali-Toudert, F.; Djenane, M.; Bensalem, R.; Mayer, H. Outdoor thermal comfort in the old desert city of Beni-Isguen, Algeria. Clim. Res. 2005, 28, 243–256. [Google Scholar] [CrossRef]
- Shih, W.-M.; Lin, T.-P.; Tan, N.-X.; Liu, M.-H. Long-term perceptions of outdoor thermal environments in an elementary school in a hot-humid climate. Int. J. Biometeorol. 2017, 61, 1657–1666. [Google Scholar] [CrossRef]
- Chen, H.-C.; Han, Q.; de Vries, B. Urban morphology indicator analyzes for urban energy modeling. Sustain. Cities Soc. 2020, 52, 101863. [Google Scholar] [CrossRef]
- Cai, C.; Guo, Z.; Zhang, B.; Wang, X.; Li, B.; Tang, P. Urban Morphological Feature Extraction and Multi-Dimensional Similarity Analysis Based on Deep Learning Approaches. Sustainability 2021, 13, 6859. [Google Scholar] [CrossRef]
- Aina, Y.A.; Al-Naser, A.; Garb, S.B. Towards an integrative theory approach to sustainable urban design in Saudi Arabia: The value of geodesign. In Advances in Landscape Architecture; IntechOpen: London, UK, 2013; Chapter 20. [Google Scholar]
- Mohamed, F.M.; Khateeb, S.E. An analytical study of the impact of streetscape in Jeddah on social behavior of the users. In Proceedings of the International Conference on Agricultural, Civil and Environmental Engineering (ACEE-16), Istanbul, Turkey, 18–19 April 2016; pp. 26–31. [Google Scholar] [CrossRef]
- Biljecki, F.; Chow, Y.S. Global Building Morphology Indicators. Comput. Environ. Urban Syst. 2022, 95, 101809. [Google Scholar] [CrossRef]
- Lee, K.; Levermore, G. The variation of sky factor from urban geometry. In Proceedings of the 9th International Conference on Urban Climate jointly with 12th Symposium on the Urban Environment, Toulouse, France, 20–24 July 2015. [Google Scholar]
- Jeddah Annual Report 2016–2017; Jeddah Champer: Jeddah, Saudi Arabia, 2018.
- Masoud, B.; Coch, H.; Beckers, B. The correlation between urban morphology parameters and incident solar radiation performance to enhance pedestrian comfort, case study Jeddah, Saudi Arabia. In Sustainability in Energy and Buildings; Springer Nature Singapore Pte Ltd.: Singapore, 2020; pp. 543–554, Chapter 46. [Google Scholar]
- Affairs, M.O.M. Jeddah City Profile; United Nations Human Settlements Program (UN-Habitat): Jeddah, Arabia, 2019. [Google Scholar]
- Abdulaal, W.A. Large urban developments as the new driver for land development in Jeddah. Habitat Int. 2012, 36, 36–46. [Google Scholar] [CrossRef]
- Abdulgani, K. Jeddah. Cities 1993, 10, 50–59. [Google Scholar] [CrossRef]
- Shawly, H. Evaluating Compact City Model Implementation as a Sustainable Urban Development Tool to Control Urban Sprawl in the City of Jeddah. Sustainability 2022, 14, 13218. [Google Scholar] [CrossRef]
- Vasilikou, C.; Nikolopoulou, M. Outdoor thermal comfort for pedestrians in movement: Thermal walks in complex urban morphology. Int. J. Biometeorol. 2020, 64, 277–291. [Google Scholar] [CrossRef]
- Lisaia, D.; Zhang, C. Morphological and physical characteristics of the historic urban fabric and traditional streets of Xiguan in Guangzhou. J. Urban Des. 2022, 27, 441–458. [Google Scholar] [CrossRef]
- Bagader, M.A. The sustainable investment in urban heritage sites: Local, regional and international models. J. Umm Al-Qura Univ. Eng. Archit. 2021, 12, 1–7. [Google Scholar]
Figure 1.
Flowchart of the research methodology.
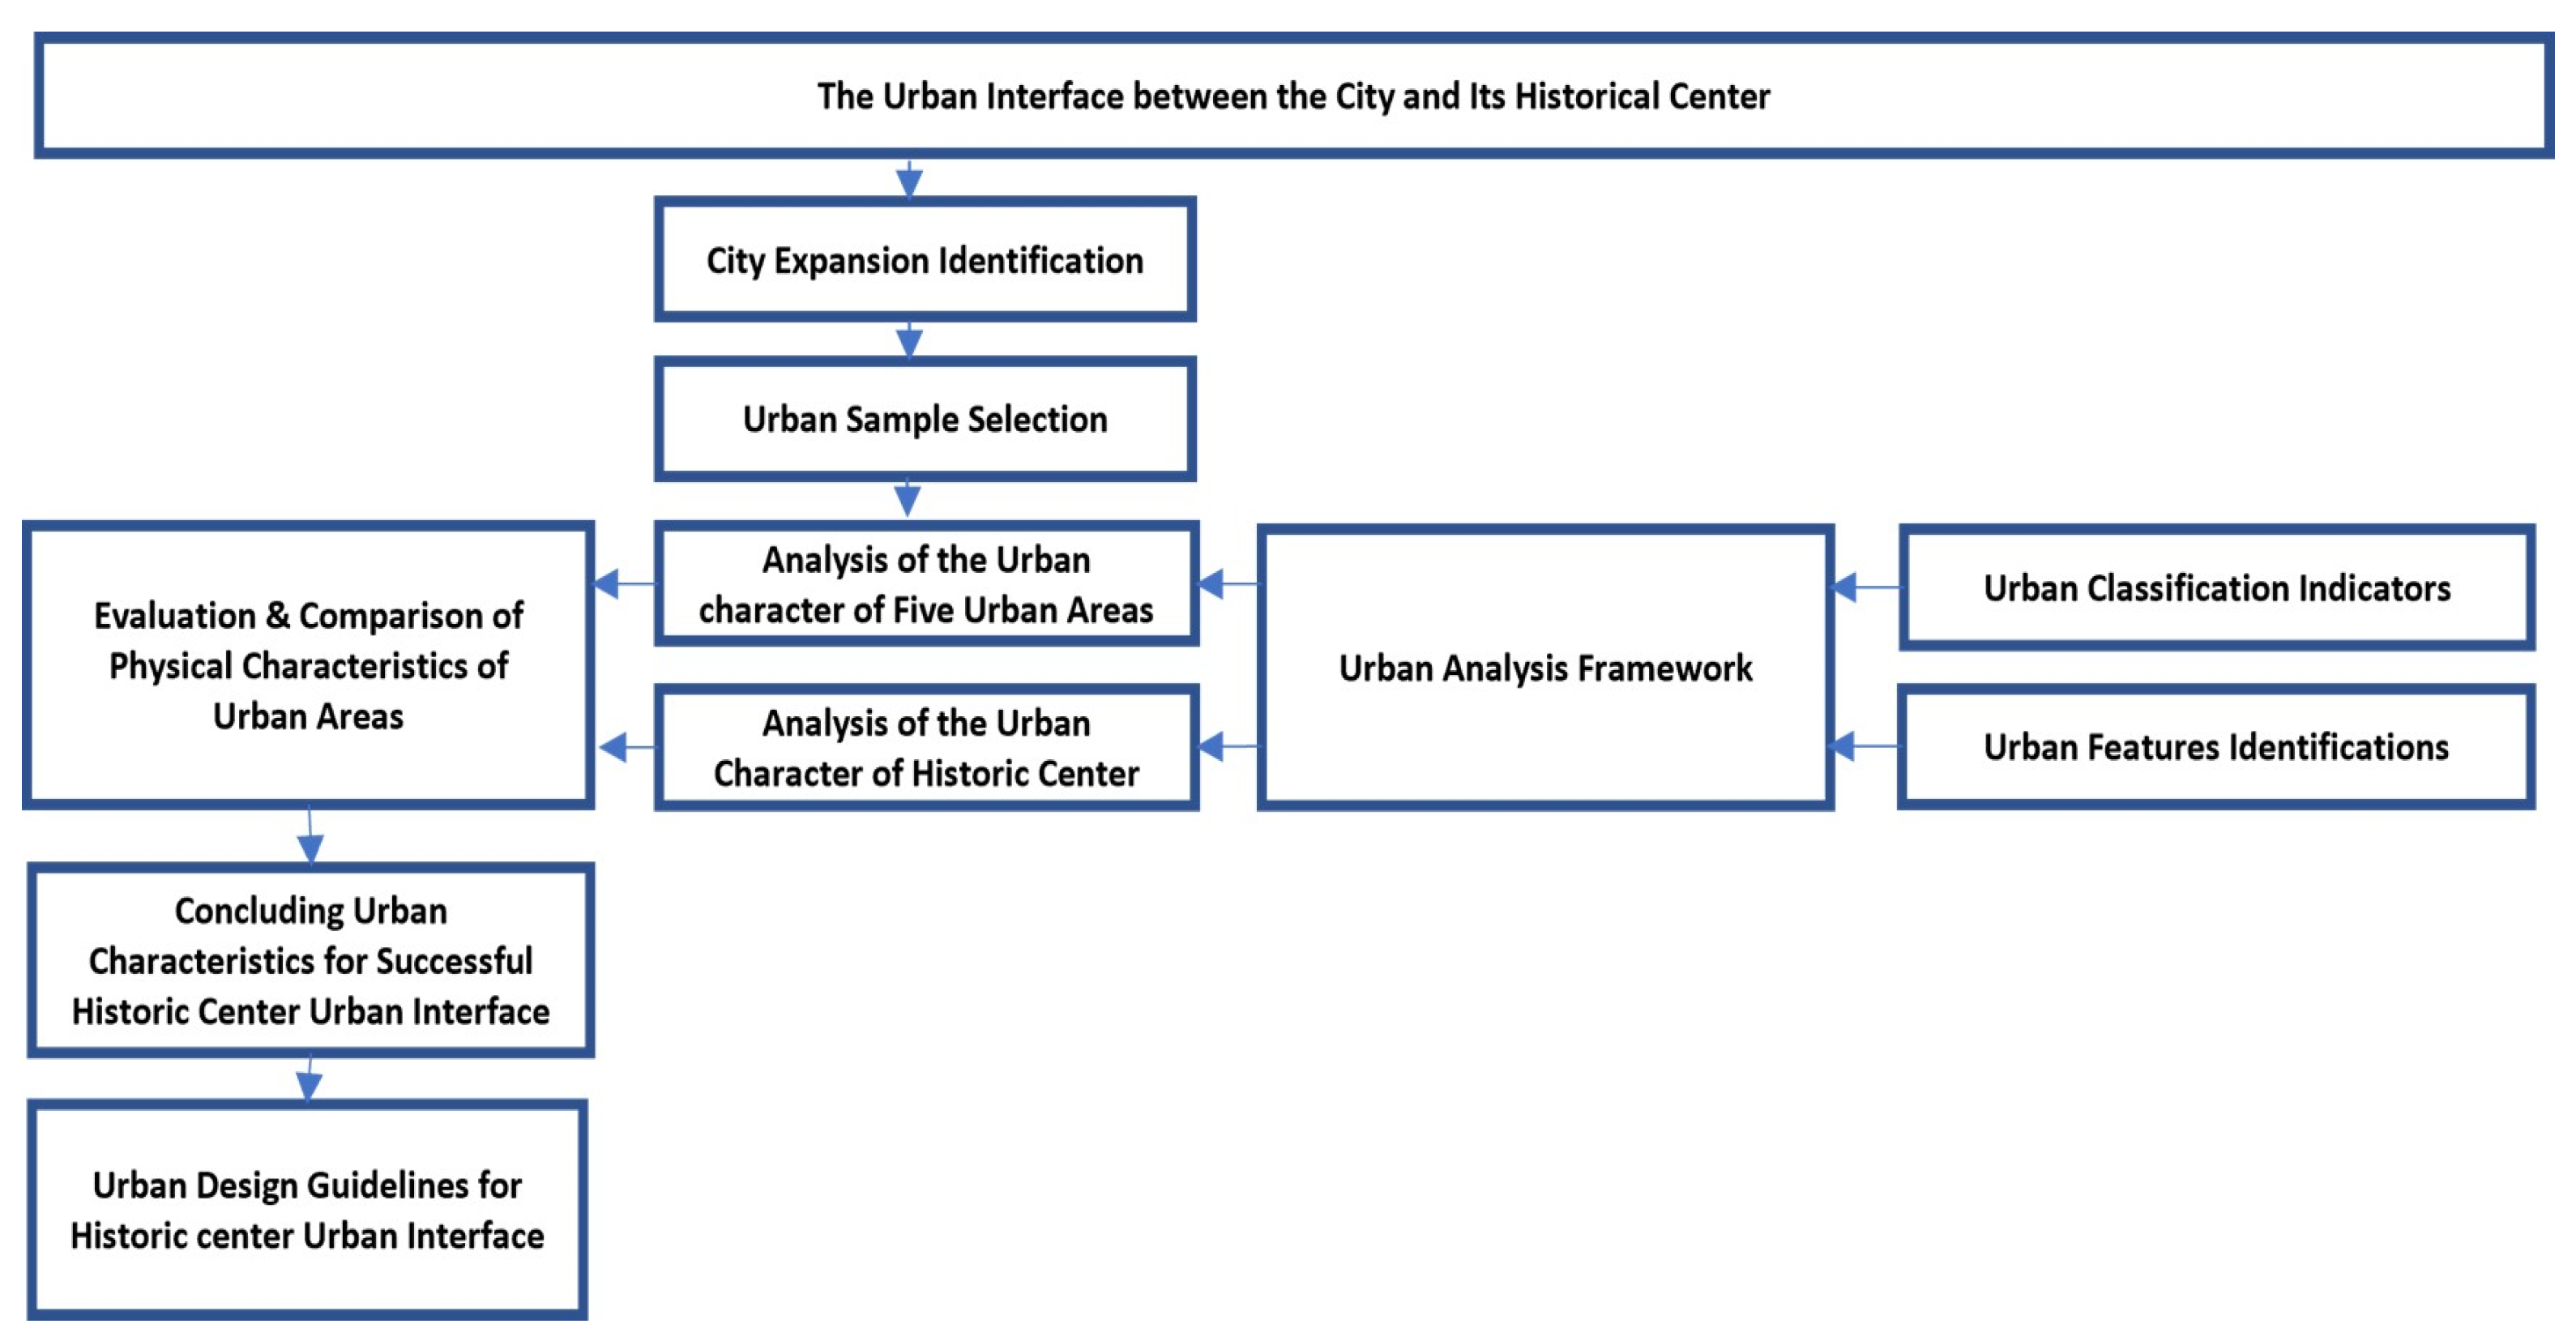
Figure 2.
Urban morphology indicators.
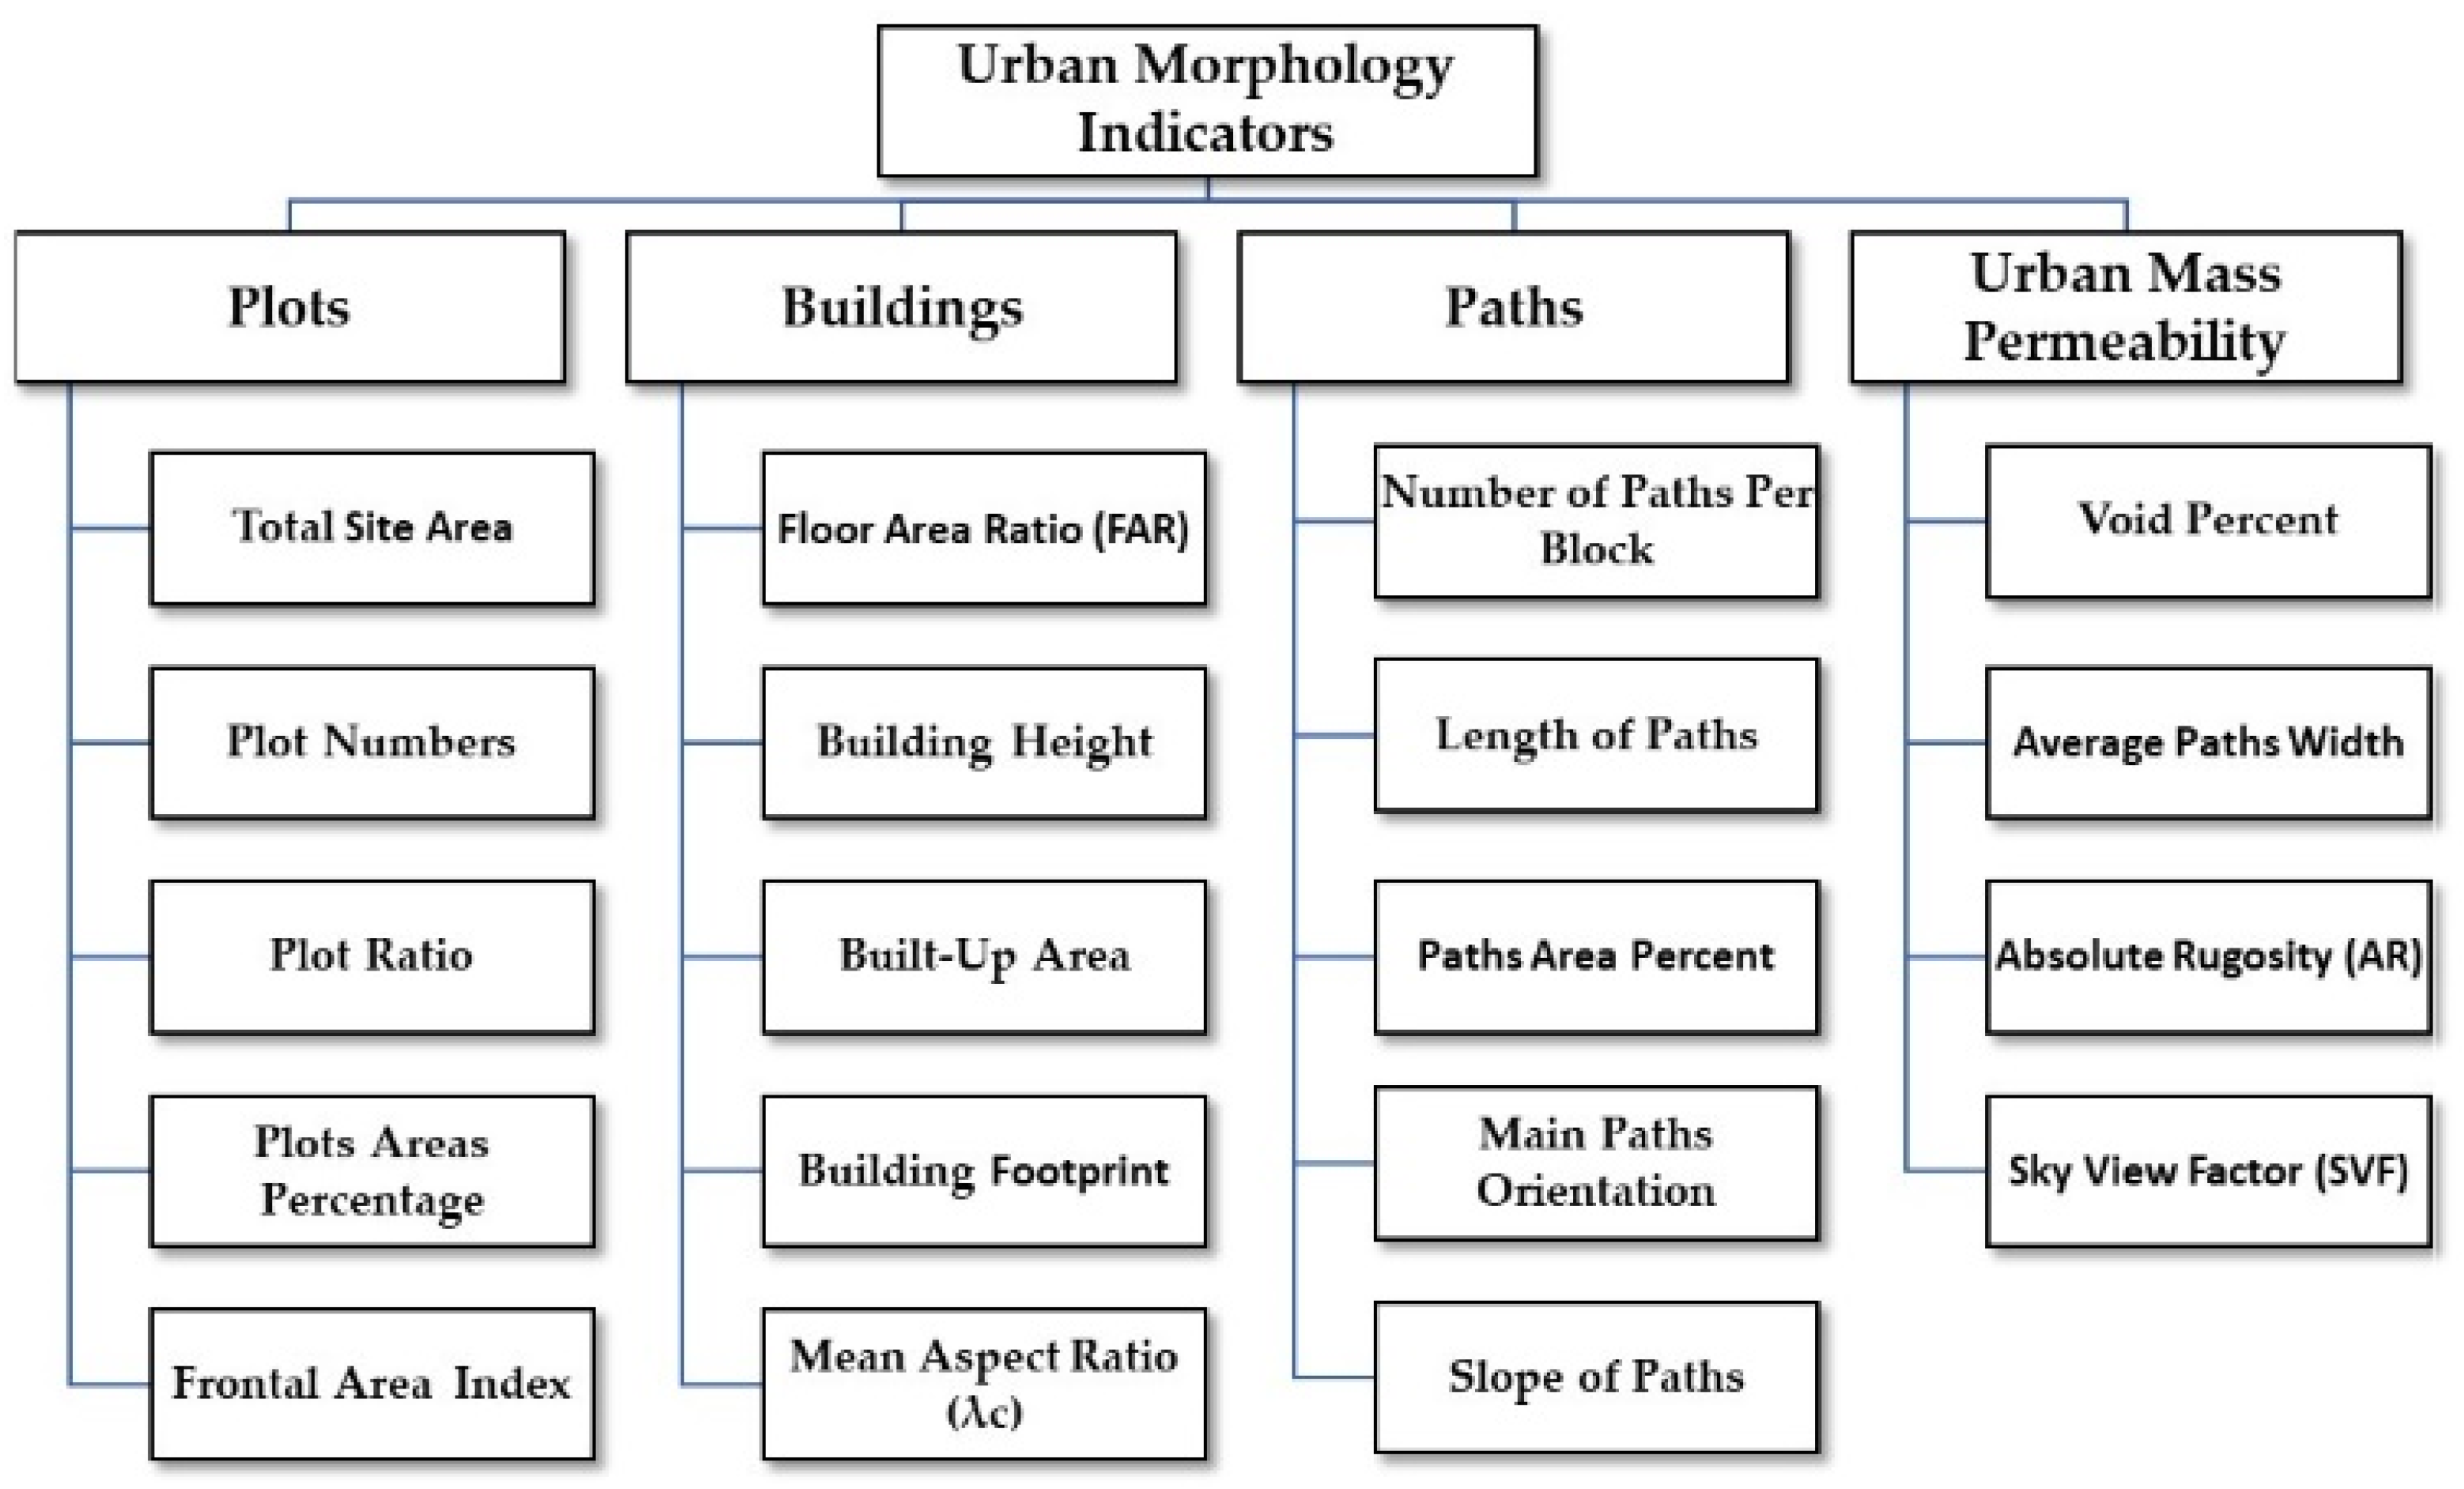
Figure 3.
Historical urban centers and the development of neighboring urban areas.
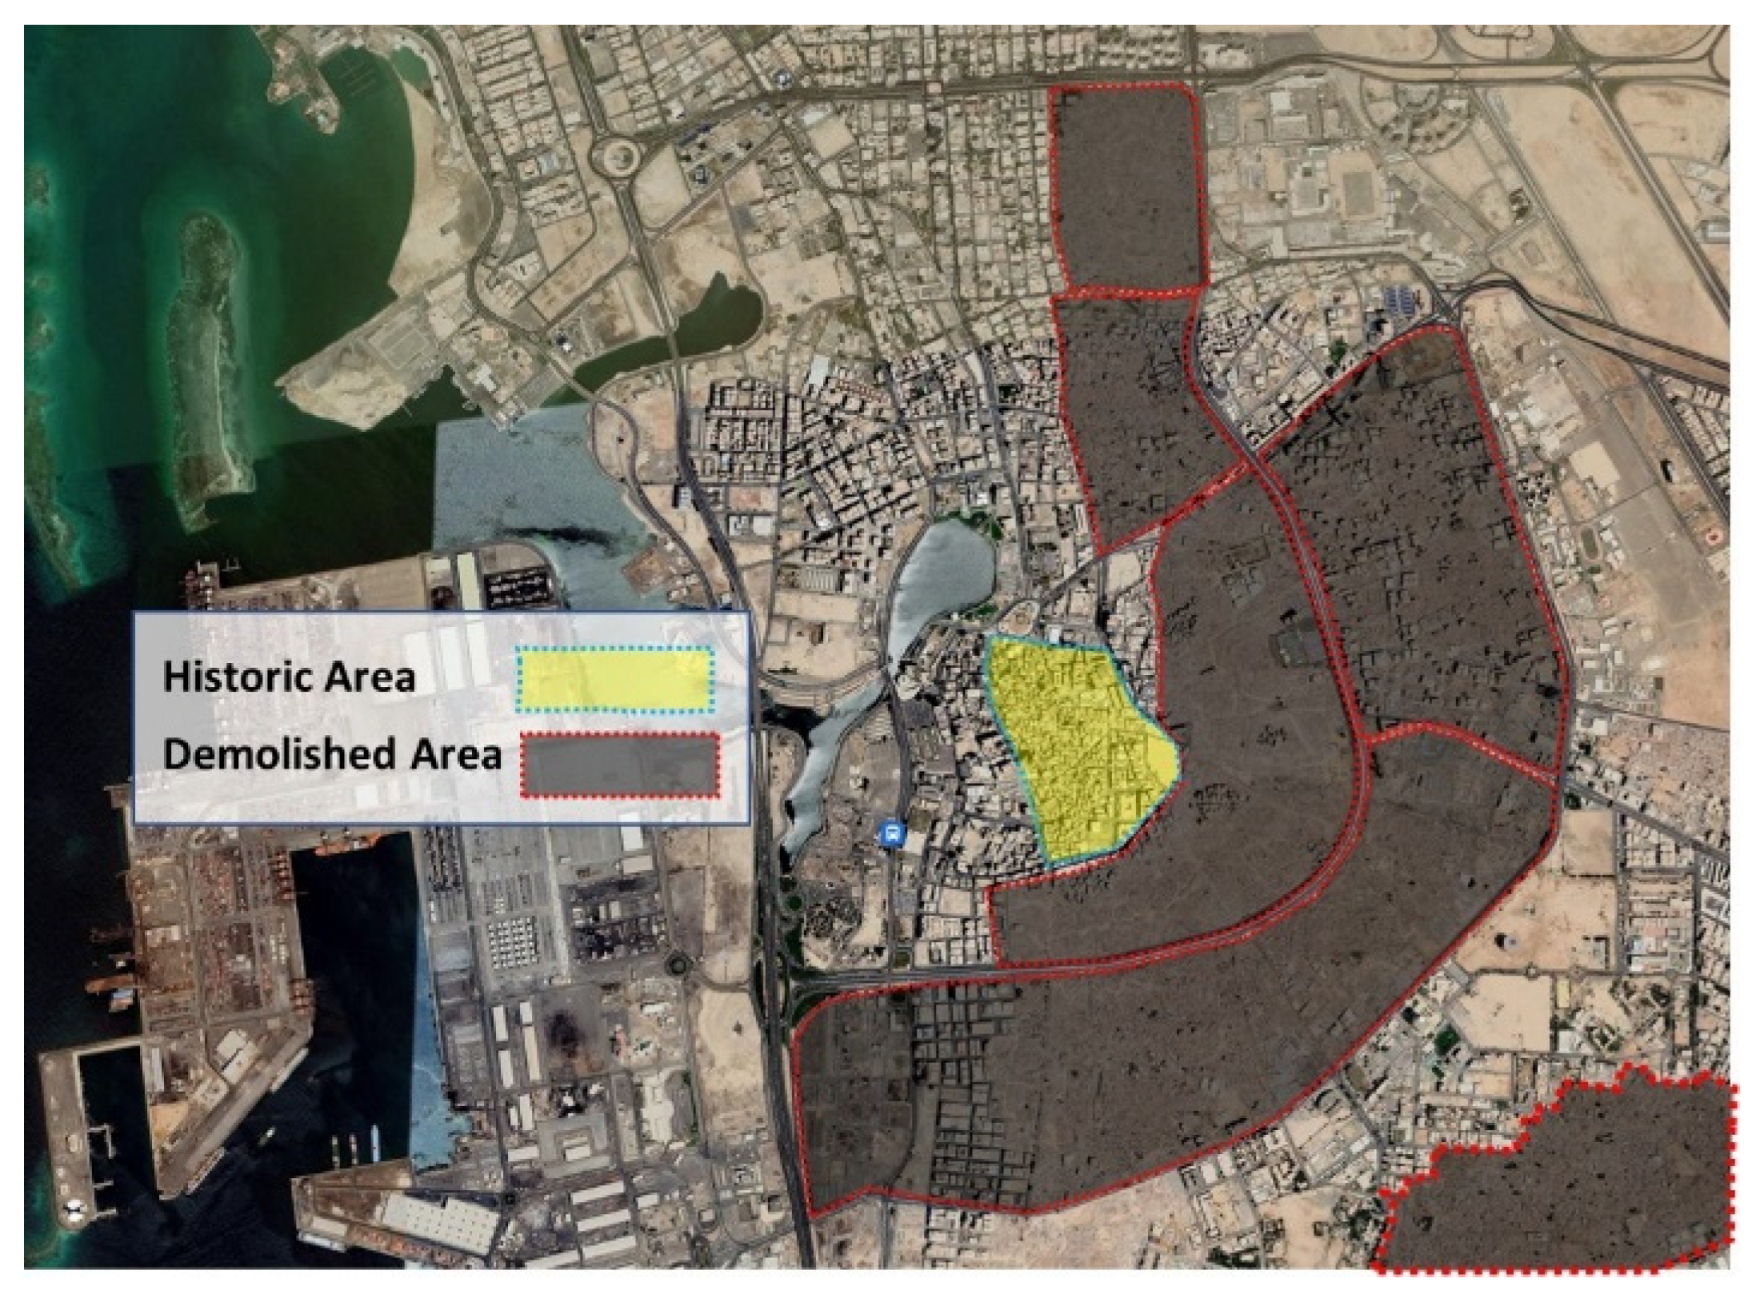
Figure 4.
Jeddah primary climatic data (a) Wind rose; (b) Relative humidity; (c) Dry bulb temperature.
Figure 4.
Jeddah primary climatic data (a) Wind rose; (b) Relative humidity; (c) Dry bulb temperature.
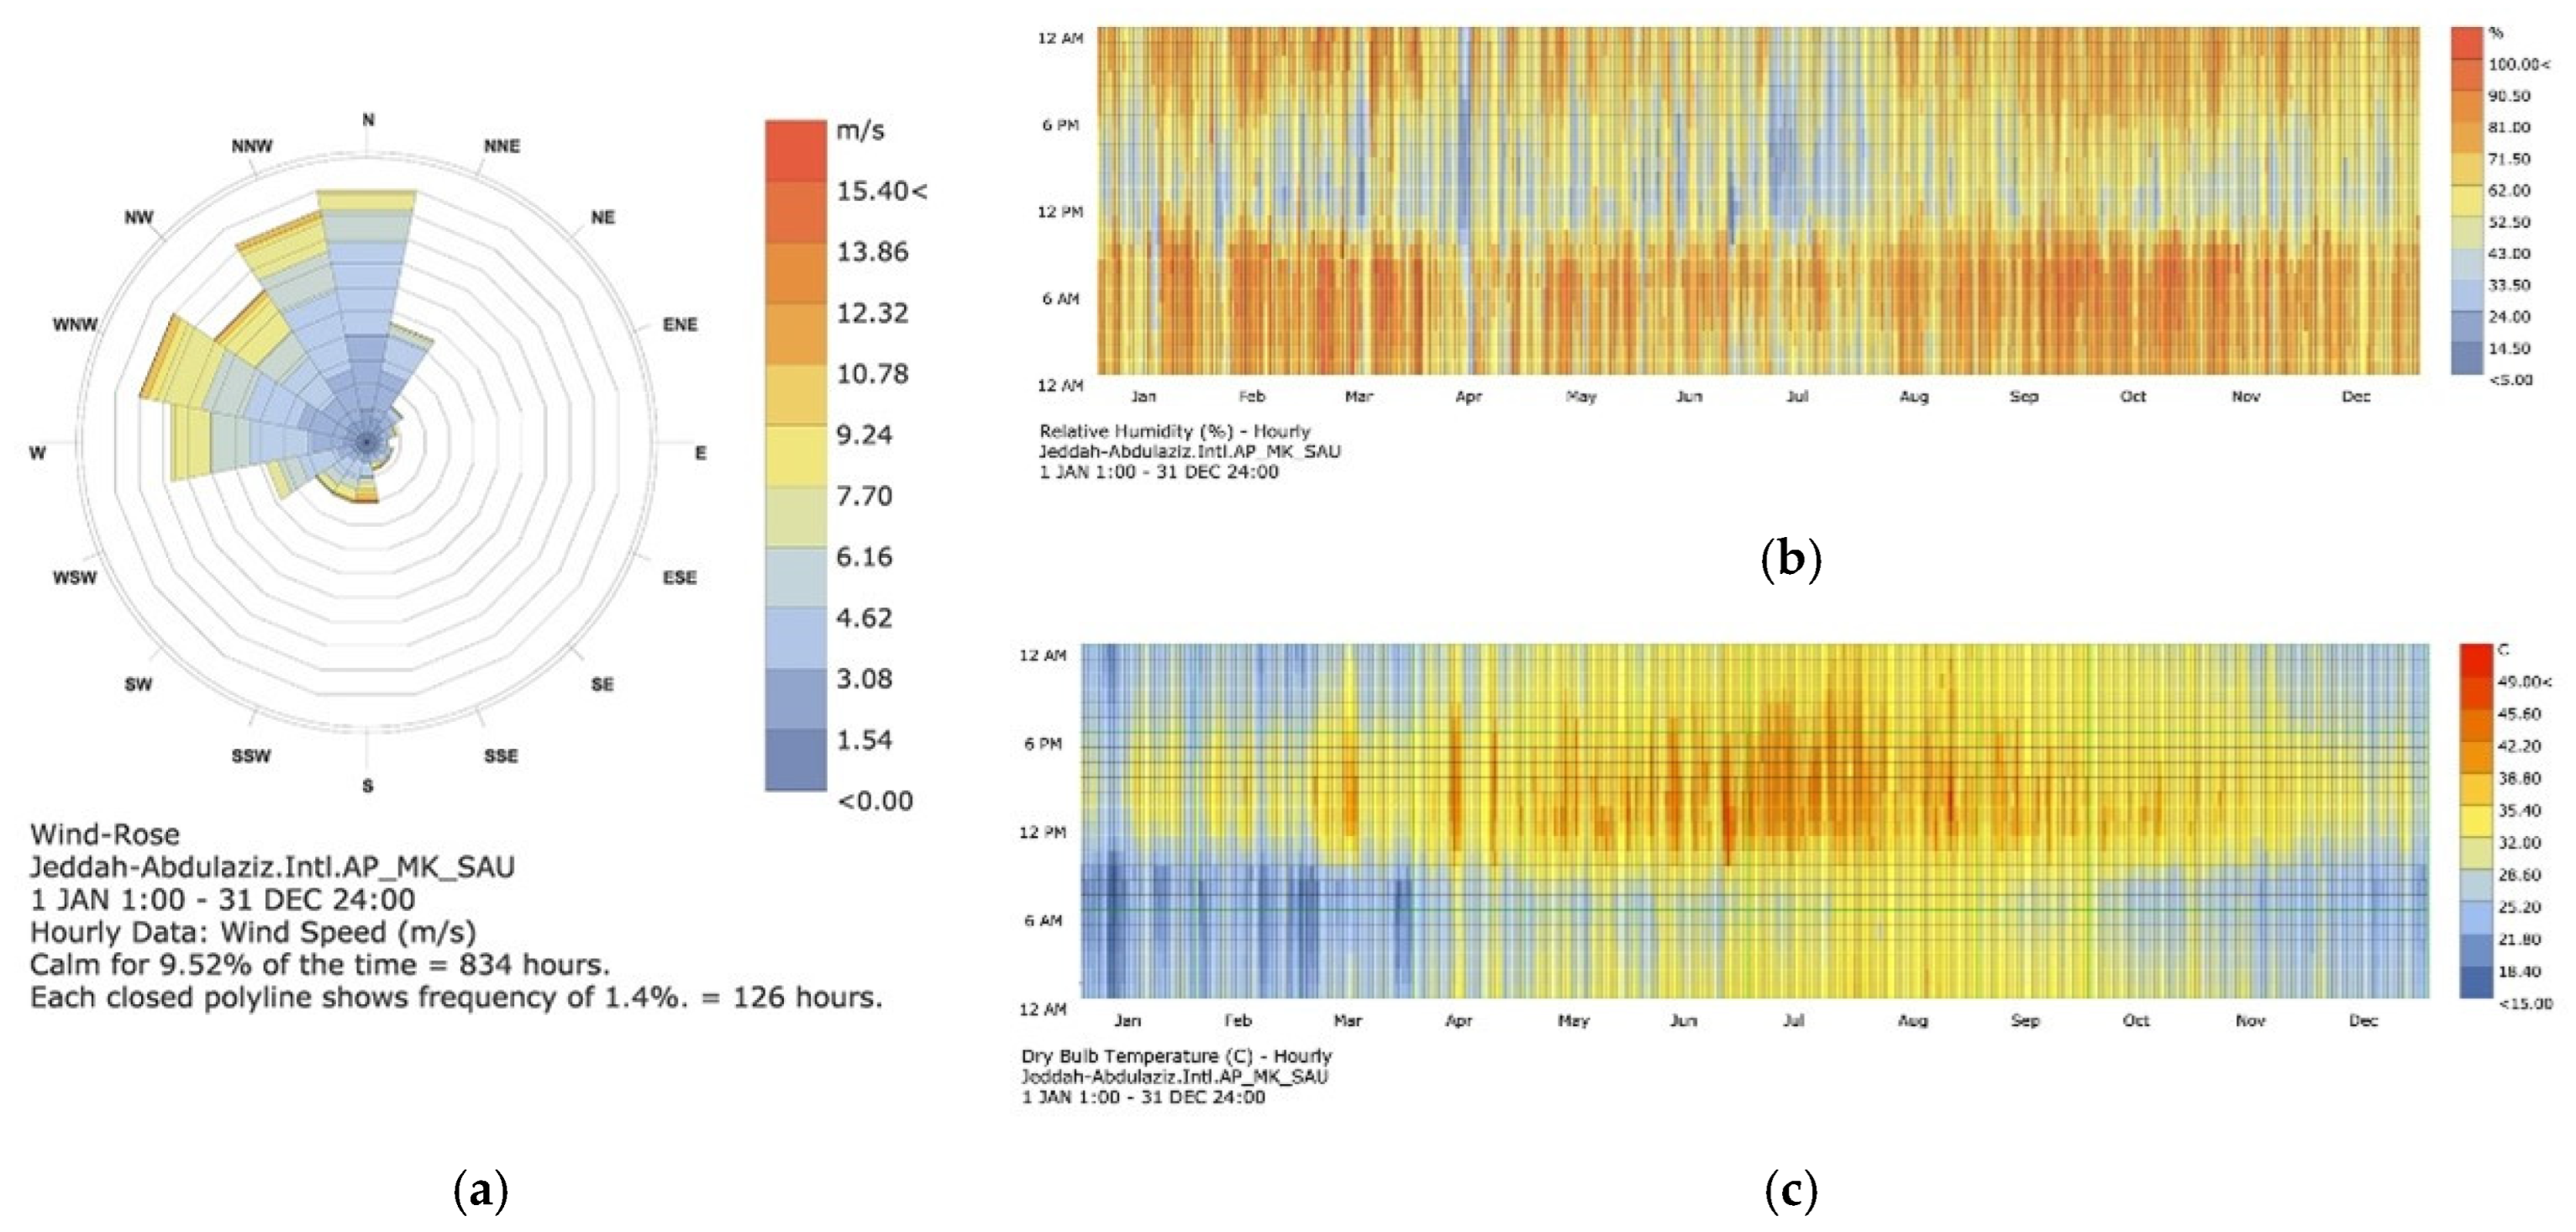
Figure 5.
Jeddah’s urban growth over the last century (Black areas presents the extension of urban area).
Figure 5.
Jeddah’s urban growth over the last century (Black areas presents the extension of urban area).
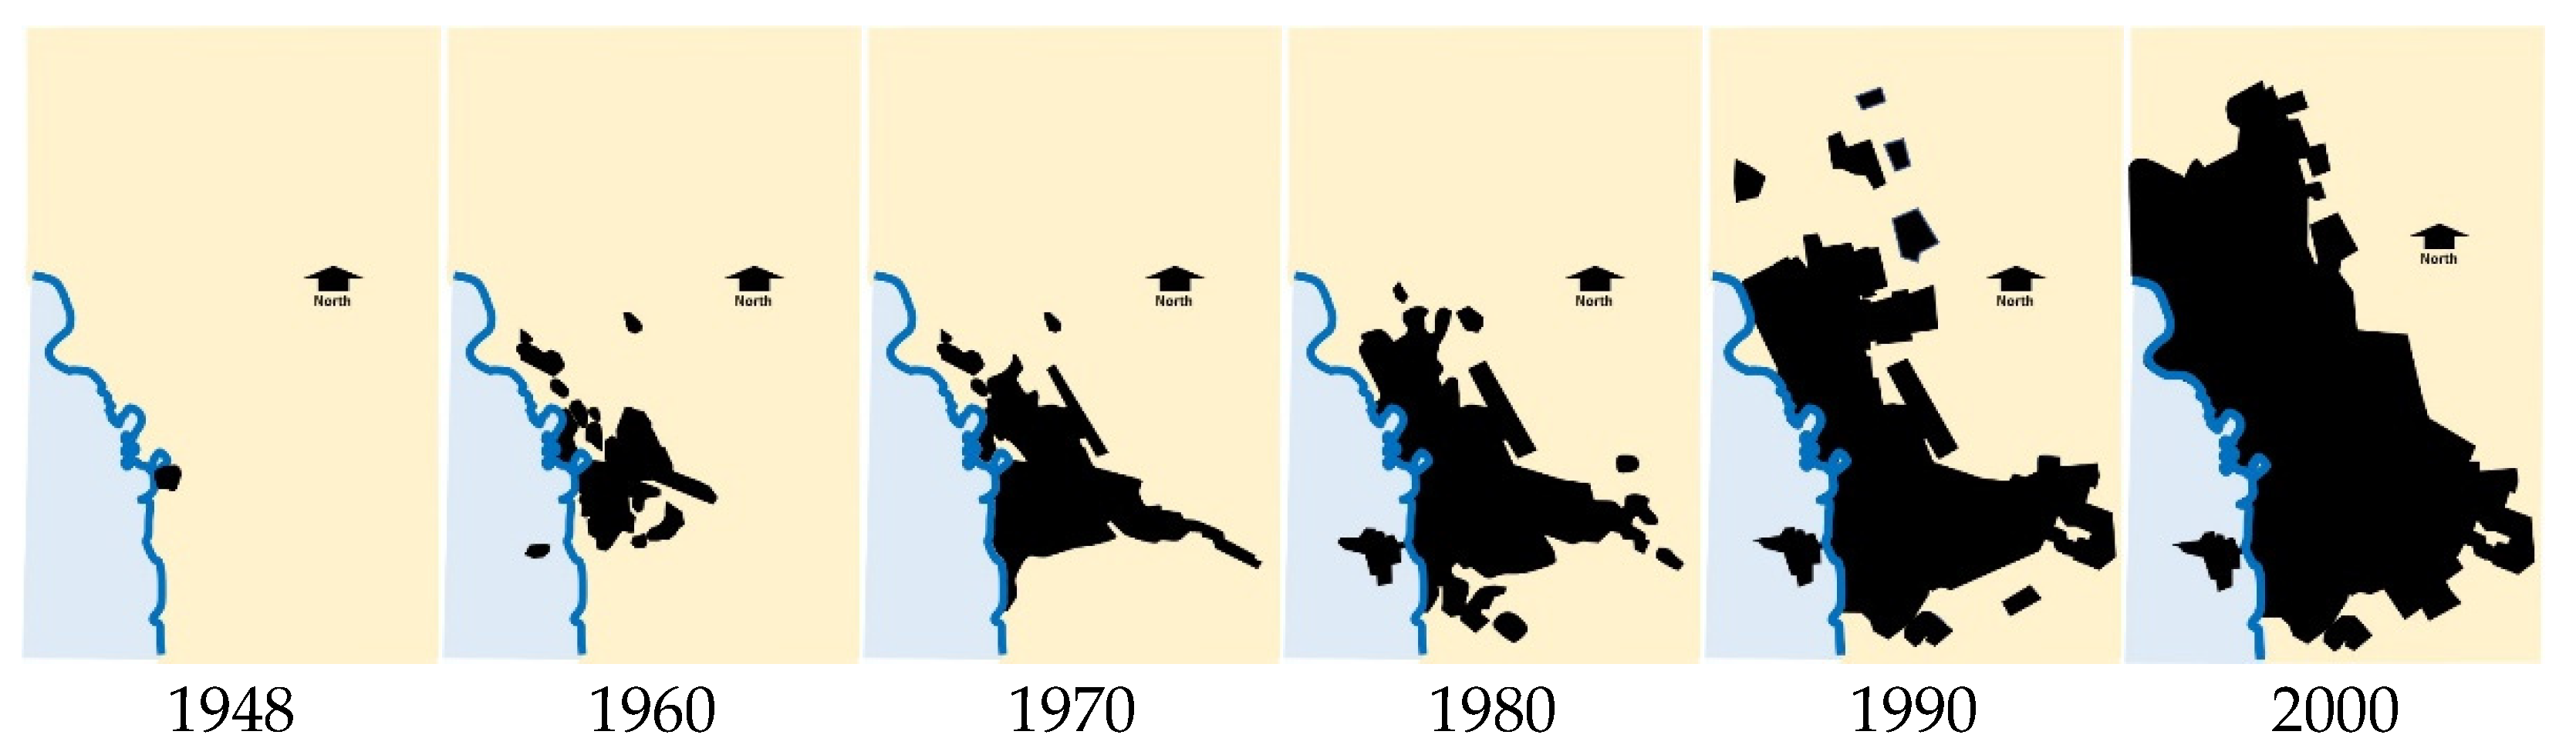
Figure 6.
(a) Jeddah city identified six urban expansions over the last century and the selected urban case studies; (b) Limits of Jeddah historical center with listed buildings in dark color.
Figure 6.
(a) Jeddah city identified six urban expansions over the last century and the selected urban case studies; (b) Limits of Jeddah historical center with listed buildings in dark color.
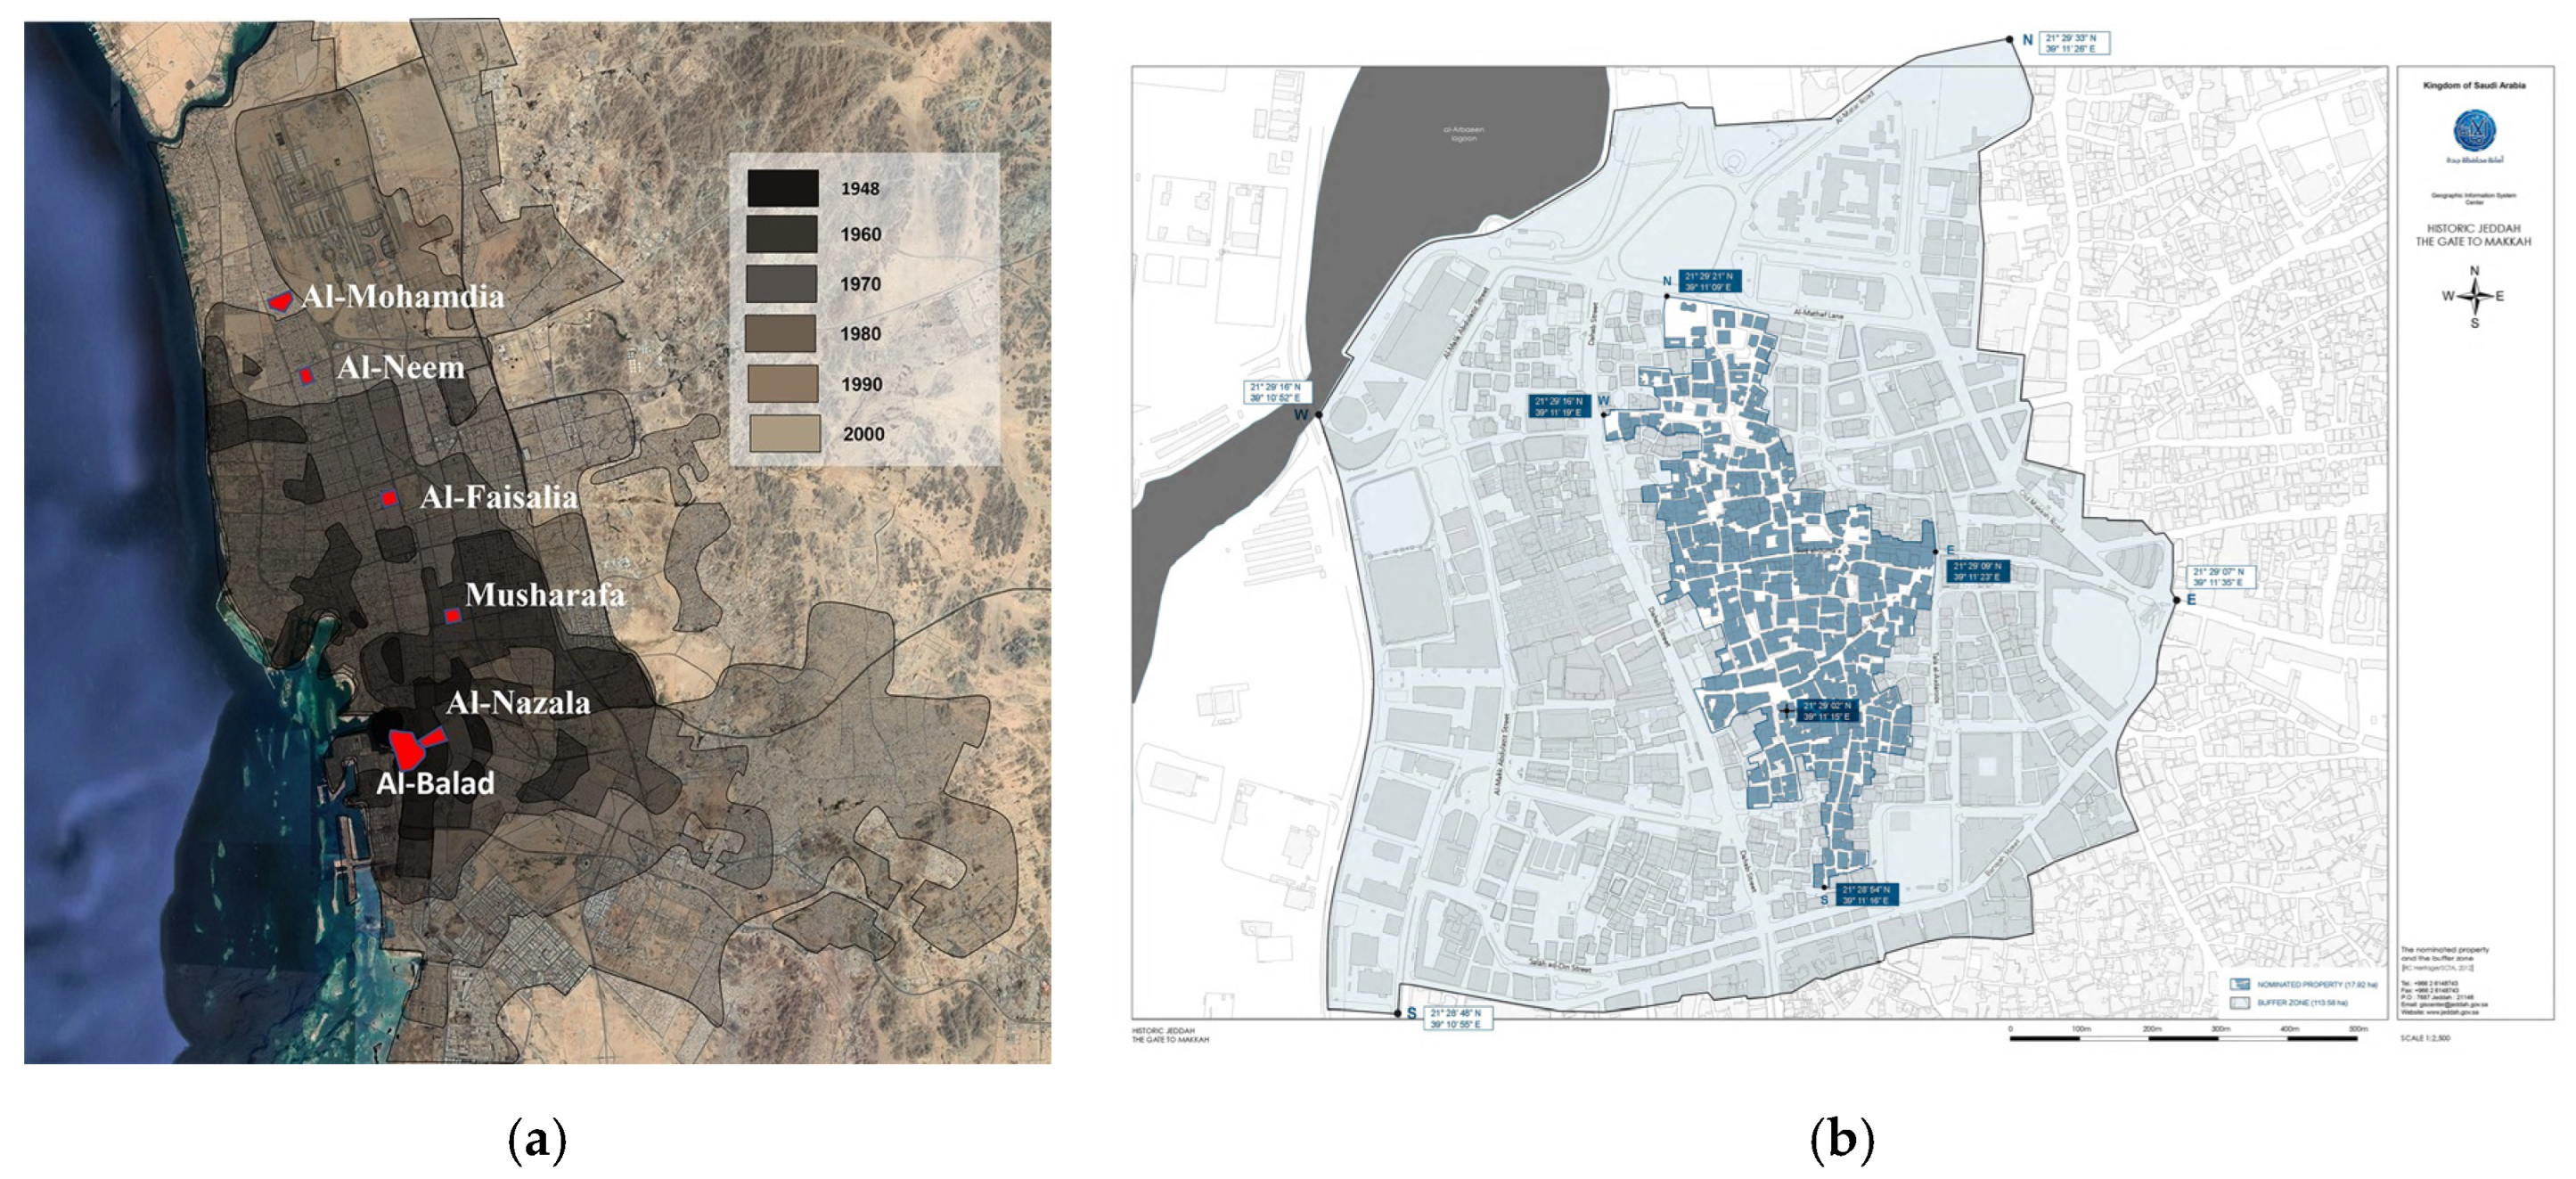
Figure 7.
Selected six sites representing the six growing phases of Jeddah city. (a) Al-Balad—Before 1948; (b) Al-Nazalah—1960; (c) Musharafa—1970; (d) Al-Faisalia—1980; (e) Al-Neem—1990; (f) Al-Mohamdia—2000.
Figure 7.
Selected six sites representing the six growing phases of Jeddah city. (a) Al-Balad—Before 1948; (b) Al-Nazalah—1960; (c) Musharafa—1970; (d) Al-Faisalia—1980; (e) Al-Neem—1990; (f) Al-Mohamdia—2000.

Table 1.
The Framework of urban morphology indexes impact assessment on environmental, socio-culture, and economic aspects.
Table 1.
The Framework of urban morphology indexes impact assessment on environmental, socio-culture, and economic aspects.
| Environment Aspects | Socioeconomic Aspects | ||||||||||
|---|---|---|---|---|---|---|---|---|---|---|---|
| Air Temperature | Wind | Humidity | Privacy | Proximity | Safety/Security | Community/Sense of Belonging | Prosperity Values | Green Economy | Energy Consumption | ||
| Plots | Plot Area | ||||||||||
| Plot Ratio (PR) | |||||||||||
| Plots Areas Percentage | |||||||||||
| Construction Ratio (CR) | |||||||||||
| Buildings | Frontal Area Index (FAI) | ||||||||||
| Floor Area Ratio (FAR) | |||||||||||
| Building Height | |||||||||||
| Mean Aspect Ratio (λc) | |||||||||||
| Paths | Path coverage area | ||||||||||
| Path Average Length | |||||||||||
| Paths Area Percent | |||||||||||
| Main Paths Orientation | |||||||||||
| Urban Mass Permeability | Void Percentage | ||||||||||
| Average Path Width | |||||||||||
| Absolute Rugosity (Ra) | |||||||||||
| Sky View Factor | |||||||||||
| Weak Impact | Moderate Impact | Strong Impact | |||||||||
Table 2.
Urban morphology indicators.
| Indicator | Index | Description | Equation | |
|---|---|---|---|---|
| Plots | Average Plot Area | The average area of plots. | Pa | |
| Plot Ratios (PR) | The ratio between the depth and width of the plot. | PR | ||
| Construction Ratio (CR) | The allowed construction area to the plot area. | (1) | ||
| where Aij is the built area of the ij building, and S is the total plot area. | ||||
| Plots Areas Percentage (Pa) | The ratio between total plot areas and site area. | (2) | ||
| where Pa is the plot area, Pn is the number of plots, and Sa is the site area. | ||||
| Buildings | Frontal Area Index ey(λf) | The total areas of the building’s vertical surfaces facing the wind direction are divided by the building area. | λf = Afacets/Aplane | (3) |
| where λf is the frontal area index, Afacets is the total areas of building vertical surfaces facing the wind direction, and Aplane is the building area. | ||||
| Floor Area Ratio (FAR): | It represents the building density. It can be calculated through the following formula: the ratio of the built-up area to the overall plot area. [19,32] | (4) | ||
| where Ai is the total building floor area, and S is the plot area. | ||||
| Building Height | Average building heights. | (5) | ||
| where W is the average plot width, H is the average building height, and Np is the number of plots. | ||||
| Mean Aspect Ratio (λc): | The ratio between the building envelope area and the footprint area. | (6) | ||
| where (Ei) is the building envelope area of the ith building, and S is the total plot area. | ||||
| Paths | Path Coverage Area | The total site area is divided by the number of paths. | Pc = Sa/Pn | (7) |
| Road Average Length | Average main paths length. | RL | ||
| Paths Area Percent | Total roads area percent of the site area. | (8) | ||
| where Bh is the total road area, and Sa is the site area. | ||||
| Main Paths Orientation | The direction of the main paths in angles. | OR | ||
| Urban Mass Permeability | Void Percentage | Percentage of unbuilt areas of the test site. | (9) | |
| where FP is the average building footprint, Pn is the Building Numbers, and Sa is the site area. | ||||
| Average Width | The average width of paths. | Pw | ||
| Absolute Rugosity (AR): | The average height of obstacles that resist the wind over the urban area. | (10) | ||
| where Ni is the average building’s floor number, and ΔH is the average building height. | ||||
| Sky View Factor: | The ratio of the received radiation on the ground surface to the total received radiation by the entire hemisphere [19]. | (11) | ||
| where n = 360/α | ||||
Table 3.
The results of the selected six study sites represent Jeddah City Growth Phases.
| Al-Balad | Al-Nazala | Mushrafa | Al-Faisalia | Al-Neem | Mohamdia | ||
|---|---|---|---|---|---|---|---|
| 1948 | 1960 | 1970 | 1980 | 1990 | 2000 | ||
| Plot | Total Site area | 169,010 | 249,799 | 251,992 | 334,745 | 235,053 | 278,352 |
| Plot Numbers | 785 | 925 | 189 | 416 | 191 | 330 | |
| Plot Area | 148.2 | 194 | 840 | 506 | 675 | 504 | |
| Plot Ratio (PR) | 1 | 1 | 0.93 | 0.96 | 0.93 | 0.88 | |
| Plots Areas Percentage | 69% | 72% | 63% | 63% | 55% | 60% | |
| Construction Ratio (CR) | 1 | 1 | 0.8 | 0.8 | 0.6 | 0.6 | |
| Buildings | Frontal Area Index (FAI) | 0.88 | 0.6 | 0.2 | 0.32 | 0.15 | 0.27 |
| Floor Area Ratio (FAR) | 1 | 1 | 0.8 | 0.76 | 0.64 | 0.57 | |
| Building Height | 10.88 | 9.67 | 14.27 | 13.48 | 8.35 | 11.43 | |
| Mean Aspect Ratio (λc) | 1.93 | 3.05 | 3.37 | 2.84 | 2.48 | 3.69 | |
| Paths | Path coverage area | 4829 | 3785 | 22,908 | 15,940 | 47,011 | 39,765 |
| Path Average Length | 244.9 | 225 | 204 | 249 | 210 | 413 | |
| Paths Area Percent | 35% | 31% | 12% | 31% | 18% | 15% | |
| Main Paths Orientation | irregular east to west | Irregular East/West | North | North | North--West | North--West | |
| Urban Mass Permeability | Void Percentage | 31% | 29% | 51% | 49% | 53% | 48% |
| Average Path Width | 7.2 | 5.2 | 15 | 16 | 22 | 24 | |
| Absolute Rugosity (Ra) | 0.7 | 1.74 | 1.61 | 1.94 | 1.69 | 1.93 | |
| Sky View Factor | 0.37 | 0.46 | 0.42 | 0.45 | 0.6 | 0.64 | |
Disclaimer/Publisher’s Note: The statements, opinions and data contained in all publications are solely those of the individual author(s) and contributor(s) and not of MDPI and/or the editor(s). MDPI and/or the editor(s) disclaim responsibility for any injury to people or property resulting from any ideas, methods, instructions or products referred to in the content. |
© 2023 by the author. Licensee MDPI, Basel, Switzerland. This article is an open access article distributed under the terms and conditions of the Creative Commons Attribution (CC BY) license (https://creativecommons.org/licenses/by/4.0/).
Share and Cite
MDPI and ACS Style
Shehata, A.M. Sustainable-Oriented Development for Urban Interface of Historic Centers. Sustainability 2023, 15, 2792. https://doi.org/10.3390/su15032792
AMA Style
Shehata AM. Sustainable-Oriented Development for Urban Interface of Historic Centers. Sustainability. 2023; 15(3):2792. https://doi.org/10.3390/su15032792
Chicago/Turabian StyleShehata, Ahmed Mohamed. 2023. "Sustainable-Oriented Development for Urban Interface of Historic Centers" Sustainability 15, no. 3: 2792. https://doi.org/10.3390/su15032792
Note that from the first issue of 2016, this journal uses article numbers instead of page numbers. See further details here.