Abstract
Effective forest conservation and management needs to consider ecological factors and the susceptibility of different tree species to anthropogenic activity. Dry deciduous forests in the tropics have been undervalued because of their low timber production compared to temperate and boreal forests. In order to quantify the current significance of Pakistan’s tropical dry deciduous forests in relation to ecological variables and anthropogenic threats, a broad phytosociological survey was conducted. In the study area, a total of 140 species of woody plants belonging to 52 families were identified. The cluster analysis depicts the distribution of nine plant communities in five clusters, in which Dodonaea viscosa-Acacia modesta-Dulbergia sissoo community was the most dominant community, showing cosmopolitan distribution in the study area. The results are further authenticated by DCA and CCA analyses, which indicate that altitude, precipitation, and temperature are the most important factors influencing the distribution and composition of tropical dry deciduous forests along the Himalayan foothills. In the study area, an annual fuelwood consumption of 270.38 tons was recorded. It was discovered that high-altitude forests were subject to extensive tree harvesting, overgrazing, browsing, and high fuelwood consumption. In addition, these forests have a low regeneration rate from 4.5 to 4.8 seedlings/quadrat, due to extensive human activities. Remarkable differences in the anthropogenic pressure and disturbances were found in the protected and unprotected forests. Based on our findings, we recommend that: (i) Immediate management intervention and an in-situ conservation strategy must be implemented in areas exposed to high levels of anthropogenic threats. (ii) Unsustainable grazing and fuelwood collection must be managed, and high-threat areas must be immediately prohibited. (iii) The local populace must be made aware of the grave consequences of anthropogenic disturbances, and a collaborative management strategy must be implemented.
1. Introduction
In numerous ways, forest resources, products, and services are indispensable to human welfare [1,2]. Forest ecosystems are, for instance, essential for food, fodder, wood, medicine, wildlife habitat, hydrological cycle and temperature regulation [3,4,5], flood and soil erosion control, CO2 consumption, and O2 production, and they have substantial socioeconomic and cultural associations for humans [6,7,8]. More than one-third of the Earth’s surface is covered by forests, which support roughly 60% of the planet’s biodiversity [9]. The planet’s forests are distributed among the tropical zone (47%), subtropical zone (9%), temperate zone (11%), and boreal forest zone (33%) [10]. Diverse regions of the world are losing their forests at an alarming rate due to a variety of factors [9]. Sub-Himalayan forests are threatened mainly by anthropogenic disturbances, and several authors have documented the degeneration of these forests [11,12,13,14,15,16,17].
The tropical dry deciduous forests of Pakistan have rich floral diversity and are located in a narrow belt along the Himalayan and sub-Himalayan foothills, extending to the Hindukush Mountains. These forests consist of mostly deciduous trees, with a smaller number of evergreen trees [18] that are scattered and area associated close to Himalayan forests [19]. Pakistan’s tropical dry deciduous forests are primarily found in the Margallah Hills and extend eastward and westward [18]. A remarkable and distinctive Buddhist civilization known as the “Gandhara Civilization” existed in the early centuries of the Christian era (from 50 to 250 AD) in the tropical dry deciduous forest zone [20]. Due to their immense importance, tropical dry forests benefit a substantial portion of the human population and are, therefore, subject to intense human pressure [21]. In addition to being used as space for the expanding human population, tropical dry forests are ruthlessly exploited as a source of fuelwood and charcoal. Free-roaming animals are permitted [22], and as a result, tropical dry forest zones are shrinking [23], posing grave threats to the existing flora and fauna [24].
The advancement of phytosociology has produced extremely useful tools for assessing, mapping, managing, and preserving plant diversity [25,26]. By using phytosociological field methods, forest ecologists can learn more about a vegetation community’s composition and species diversity, which is important for making conservation decisions and identifying indicators of habitat type [27,28]. In addition, importance value indexes (IVIs) can be obtained by interpreting such data, which serve to identify the rare and endangered species and habitats that need protection and conservation [29,30]. The development of computer programs and statistical models assists conservationists in determining the severity of threats with greater precision. TWINSPAN [31,32], PC-ORD [33], and CANOCO [34] are capable of interpreting the relationship between vegetation structure and ordination, ecological variables, and anthropogenic disturbances [35]. Using multivariate statistical analyses, the current study evaluated vegetation structure and diversity in relation to ecological variables such as temperature, altitude, and precipitation; anthropogenic threats such as grazing pressure and deforestation; and the resultant regeneration pattern in the study area.
2. Materials and Methods
2.1. Study Area
This study was carried out in the sub-Himalayan foothills of northern Pakistan (Figure 1). This region has unique geographical and altitudinal variations, with thorn vegetation on one side and temperate evergreen forests on the other, resulting in a remarkable and unique floral diversity and a variety of vegetation types in these ecosystems [36].
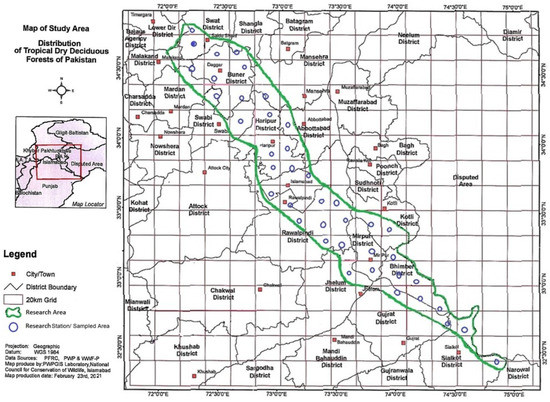
Figure 1.
Map of the study area.
2.2. Data Collection and Analysis
In 2019–2020, surveys were conducted at 41 distinct tropical dry deciduous forest sites. Data were collected in accordance with specific area methods [37]. The study area was divided into 20 km grids (Figure 1), and the simple quadrate technique was used to record data within each grid. In tropical dry deciduous forests, 20 × 20 m quadrates/plots [4] were used to analyze woody vegetation for indicator species. The regeneration rate in the same quadrates was determined by counting the number of seedlings in each quadrate. Specimens of plants were collected, dried, presumed, and mounted on standard herbarium sheets before being identified using existing literature [38]. Each site’s coordinates, including altitude, longitude, and latitude, were recorded using a global positioning system (GPS). In each quadrate, sprout seedlings were counted. Likewise, the intensity of grazing and browsing per quadrate was estimated visually based on the proportion of grazed foliage in each. Cover, frequency, and density, as well as their relative values, were calculated to determine IVI values [37,39]. Based on phytosociological data, cluster analysis, and indicator species analysis (ISA) were performed using PCORD version 5.10 [33]. PCORD obtained species-area curves for each of the 41 studied sites by combining species abundance data with Sørensen data [33,40]. Analysis of vegetation and ecological gradients was predicted by CCA and DCA using the program CANOCO version 4.55 [34].
A weight overview strategy was utilized to estimate fuelwood consumption [41]. By weighing the wood in three distinct seasons—summer, monsoon, and winter—the total amount of wood used during the year was calculated [42]. Information on annual household wood consumption was provided by 123 families. Communities were asked to only use fuelwood from a designated portion, with weight being the primary metric used to determine 24 h consumption rates. For each selected family, fuelwood consumption was calculated in kilogram/capita/day. Seedlings were counted in each quadrate to determine the regeneration rate. To estimate browsing and grazing pressure, three browsing classes were recorded through visual estimations: (i) class X, unbrowsed or without visible browsing impacts; (ii) class Y, moderately browsed or with noticeable browsing impacts; and (iii) class Z, over-browsed or with intense browsing impacts and vegetation disturbances. Based on the browsing class, each study site was ranked as a single category, i.e., X, Y, or Z.
3. Results
In the present investigation, 140 woody plants belonging to 52 families were collected from 41 distinct sub-Himalayan tropical dry deciduous forest sites.
3.1. Two-Way Indicator Species Analysis (ISA)
Indicator species analysis (ISA) distinguishes indicator species and the key variables that determine the composition of various plant communities (Figure 2). This study revealed that precipitation, temperature, and grazing pressure were the most influential variables among those examined. It also shows how environmental factors and anthropogenic disturbances influence the structure and distribution of tropical dry deciduous forests. Two-way cluster analysis simultaneously ranks tree species along a dominant gradient. Cluster analysis shows the distribution of nine different plant communities in the study area. The species with the highest IVI values (in other words, the most dominant species) include Dodonaea viscosa (715.9), Acacia modesta (473.7), Pinus roxburghii (458.1), Dalburgia sisso (343.4), and Mallotus philippensis (273.9) (Table 1). Each species was collected into a unique sample unit (as depicted in Figure 2) based on shared environmental factors such as altitude, precipitation, and temperature. Cluster analysis also indicates that tropical dry deciduous forests of sub-Himalayan foothills are found within an altitudinal range from 243 to 1524 m above sea level (asl), where annual precipitation ranges from 900 to 1500 mm and mean maximum temperatures range from 30 to 40 °C. Within the altitudinal range from 3000 to 5000 feet (asl), these forests display the greatest species diversity; this diversity decreases with decreasing altitude. Similarly, the lower-altitude regions receive minimal precipitation and high temperatures, resulting in low levels of biodiversity and plant diversity. In contrast to the above-mentioned forest sites, other high-altitude samples exhibit the maximum rainfall and minimum temperature range, as well as a diversity of species and vegetation. Other plant communities were Broussonetia papyrifera - Bauhinia purpurea- Jacaranda mimosifolia community distributed at the center zone of tropical dry deciduous forests of Pakistan. Quercus dilatata -Zanthoxylum armatum- Diospyros lotus, Mallotus philippensis - Solanum erianthum - Buxus wallichiana, Pinus roxburghii- Woodfordia fruticosa- Gymnosporia roylean and Buxus papillosa-Olea europaea- Tecoma stans- communities were present towards west. Lantana camara -Acacia catechu- Cassia fistula, Bombax malabaricum-Acacia nilotica- Bauhinia variegata and Prosopis juliflora- Ficus bengalensis- Phyllanthus emblica communities were found mostly at the central, as well as, eastern parts of the study area.
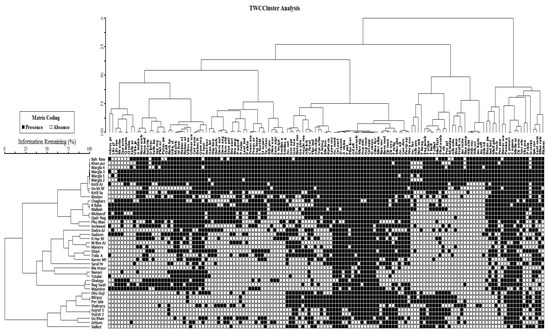
Figure 2.
Two-way cluster analysis of the distribution of species.

Table 1.
Dodonaea viscosa—Acacia modesta—Dalburgia sissoo community.
3.2. Species Area Curve (SAC)
A constant species composition can be determined by integrating statistical information based on the presence/absence and abundance of species. The ascent of curves indicates the stability of indicator vegetation, whereas an increase in distance and a curve that descends to zero indicate instability (Figure 3). The average number of species in the study area ranges from 0 at station 1 to 65 at station 41, covering an average distance of 8.5 km, showing the continuation of the average Sørensen distance.
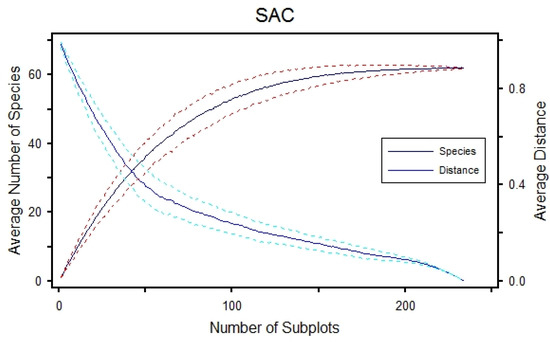
Figure 3.
Species area curve for 140 plant species at 41 stations.
3.3. Ordination Analysis of Vegetation and Ecological Gradients Using CANOCO
Detrended correspondence analysis (DCA) uses vegetation data and does not include ecological variable data. DCA results show a total inertia of 1.404. The sum of all explained variance (eigenvalues) is 0.438, with gradient strength shown in four axes to indicate species distribution. The first and second axes have a longer gradient than the third and fourth axes. Similarly, the cumulative percentage of species data at the third and fourth axes show higher values of 28.5 and 31.2 (Table 2). Species in the center show strong association, while those far away have rare distribution. DCA also highlights the ecological gradients controlling the spatial variations among the plant species. Species on the x-axis of the diagram are the higher-altitude plants with more precipitation, while those on the y-axis are the lower-altitude species where there is low rainfall. Plant communities at the center show more diversity and less anthropogenic pressure (Figure 4). Different forest sites demonstrate close lower altitude association of vegetation communities and environmental variables by clumping at the center. DCA also indicates that plant communities of indicator species are distributed equally at most of the forest sites. A few forest sites that exhibit a small distance on the y-axis represent study stations in northwestern tropical dry deciduous forests of Pakistan; these forest sites are located at low altitudes, receive low rainfall, and possess the lowest species diversity and vegetation richness (Figure 5). Canonical correspondence analysis (CCA) shows how ecological variables and anthropogenic pressure affect vegetation distribution. CCA results show 1.404 total inertia with eigenvalues of 0.198, 0.071, 0.49, and 0.033 on the first, second, third, and fourth axes, respectively. On the first axis are species in relation to environmental variables, and on the fourth axis is a cumulative maximum of 25% for species data (Table 3 and Table 4). CCA bi-plots (Figure 6 and Figure 7) provide a clear picture of 140 species at 41 forest sites and their distribution in relation to environmental variables, such as altitude, temperature, precipitation, browsing intensity, and occurrence of seedlings. They indicate that tropical dry deciduous forests of the Sub-Himalayan foothills are mainly influenced by the intensity of rainfall, temperature, and browsing pressure. Forests with small numbers of seedlings are found at higher altitudes with low temperatures, more precipitation, and a high rate of browsing intensity. The southeastern forest sites are characterized by low annual precipitation rates, high temperatures, and heavy browsing pressure; these forests have a low number of seedlings and a slow rate of regeneration.
Table 2.
Description of the first four axes of the DCA for vegetation data.
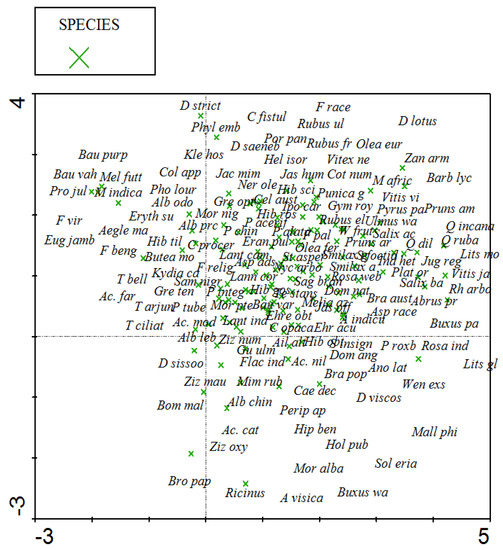
Figure 4.
DCA diagram showing the distribution of species.
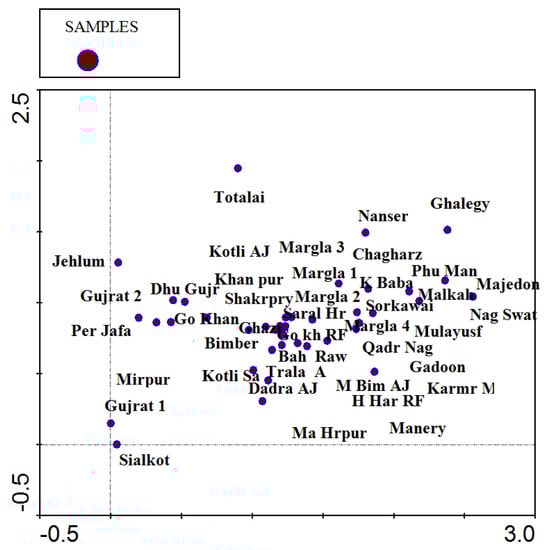
Figure 5.
DCA diagram illustrating the distribution of 41 sampled stations in Pakistan’s tropical dry deciduous forests.
Table 3.
The first four axes of the CCA for vegetation data are summarized.
Table 4.
Summary of Monte Carlo test.
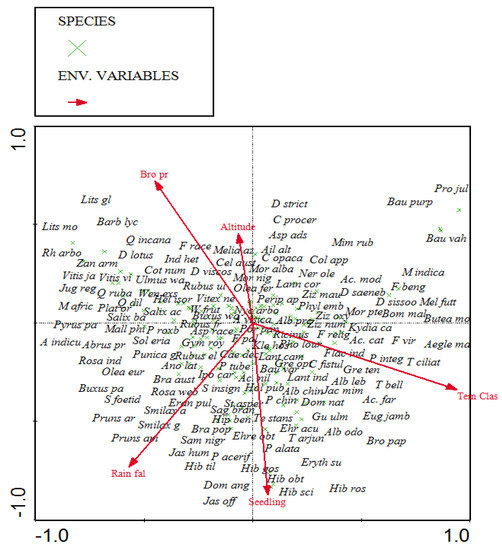
Figure 6.
DCA diagram illustrating the relationship between the distribution of 141 species and environmental variables.
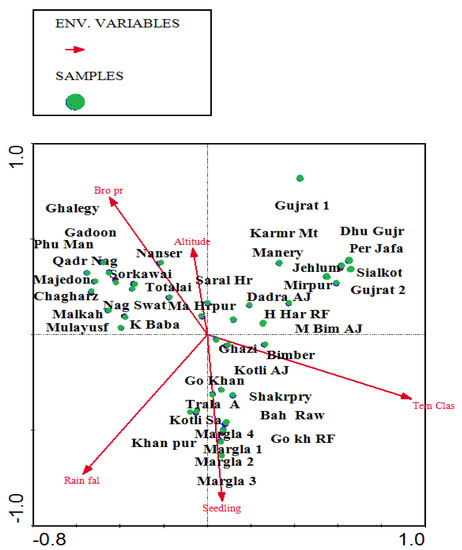
Figure 7.
CCA bi-plots depict the phytoclimatic gradient of sampled stations in relation to environmental variables.
Due to favorable environmental conditions, forest sites in the center exhibit vegetation diversity and species richness, as well as, high number of seedlings and presence of all plant communities due to high rate of annual precipitation, moderate temperature, and low browsing pressure. The overall conclusion of the CCA analysis is that precipitation, temperature, and browsing intensity are the most influential factors in the distribution of vegetation in sub-Himalayan tropical dry deciduous forests.
3.4. Anthropogenic Pressure and Regeneration Rate
In cluster analysis, five major clusters of the sampled area were identified based on the characteristics of species diversity in relation to human activities (Figure 8). These clusters, A, B, C, D, and E, exhibit disparities in annual fuelwood collection, livestock browsing, and grazing pressure. In the study area, an annual fuelwood consumption of 270.38 tons was recorded. In cluster A, the minimum rate of average wood consumption was 2.88 tons per year (Figure 8). Due to the relatively small family size and the use of both fuelwood and LPG as a source of energy, the ratio of fuelwood consumption was significantly lower here than in other tropical deciduous forest sites. Cluster B had the highest fuelwood consumption (Figure 9) at 12,985 metric tons per year due to the locals’ total dependence on forest resources for energy needs, their large family size, and cold winters, which compel them to heat their homes.
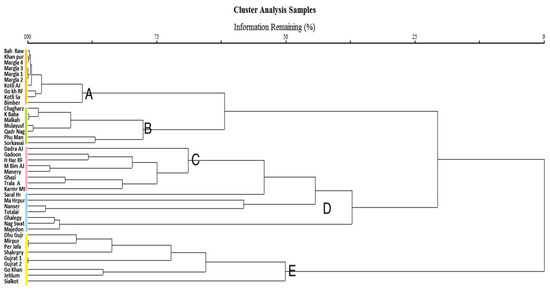
Figure 8.
Canonical correspondence analysis (CCA) bi-plots illustrate the phytoclimatic gradient of 41 study sites in tropical dry deciduous forests of Pakistan, revealing five major clusters: A, B, C, D, and E.
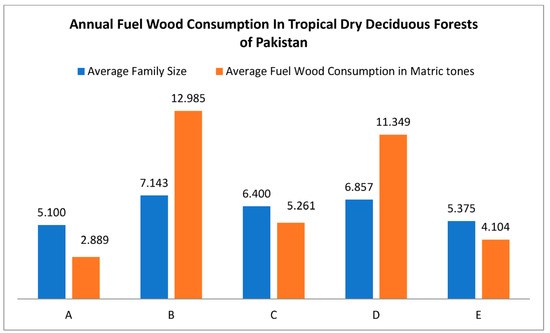
Figure 9.
Annual fuelwood consumption (average values) in five distinct clusters of tropical dry deciduous forests in Pakistan, where ABCDE along the x-axis represents five cluster classes of sampled stations, and the y-axis represents the average family size and annual fuelwood consumption in metric tons.
Cluster A had relatively low or no browsing pressure, as indicated by its 1.9 flock size per family and 14.6 average seedlings per quadrate (Figure 10). The sample sites in clusters B and D were subject to extensive grazing pressure, large flock sizes, and a low regeneration rate. In both instances, the average flock size was five, and the average number of seeds planted per quadrate was 4.8 and 4.5, respectively. Clusters C and E recorded moderate browsing and grazing pressure on average.
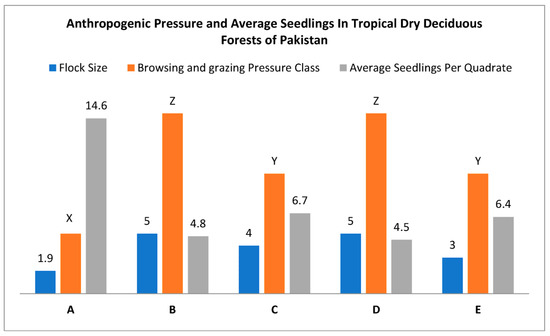
Figure 10.
Anthropogenic pressure and average seedling number in tropical dry deciduous forests of Pakistan, where ABCDE along the x-axis represents five cluster classes of sampled stations, and the y-axis represents flock size per family, browsing pressure class XYZ, and average seedlings per quadrate.
4. Discussion
Ecological variables and human activities profoundly influence vegetation dynamics, such as forest distribution, vegetation structure, composition, and species richness [43]. Because of their impact, vegetation dynamics, such as forest distribution, are highly variable. As a result of these influences, sub-Himalayan tropical dry deciduous forests exhibit variation over time and space [44]. Plant physiognomy, structure, useful species characteristics, species composition, and climatic and soil conditions can be used to classify vegetation [45].
In the present study, a total of 140 woody plants belonging to 52 families were identified in the tropical dry deciduous forests of Pakistan using well-established methods [14,19,46,47,48,49]. Cluster analysis investigations classified 41 distinct sites into five groups. These clusters are based on environmentally variable characteristics and vegetation dynamics. Sub-Himalayan tropical dry deciduous forests occur between 243 and 1524 m, receive from 900 to 1500 mm of annual precipitation, and reach 40 C in June and July and 0 C in December and January [18,19].
Our findings from the cluster analysis on the distribution of plant communities and the highest IVI values of dominant species have been reported by researchers in neighboring areas of Rawalpindi, Islamabad [18], and Swabi [19]. Dominant species community identified included Acacia modesta with (473.7) IVI value, Adhatoda visica (276.4), Ailanthus altissima (184.7), Celtis australis (264.2), Dalbergia sissoo (343.4), Dodonaea viscosa (715.9), Olea ferruginea (327.9) and Ziziphus nummularia has scored (286.5) IVI value.
Vegetation communities undergo shifts over time, which has long been observed by ecologists [50]. Ecological succession is known to occur in plant communities, altering the structure and distribution of plant communities [51]. These shifts can be attributed to both environmental factors and human actions [14,52]. Periodically investigating the structure and composition of a community is essential for implementing conservation and management measures [53]. Using a two-way cluster analysis, indicator species and the key variables that define these groups were distinguished. In addition, the analysis suggested that precipitation, temperature, and grazing pressure are the most substantial variables. Each species was placed in its corresponding sample unit, demonstrating the influence of different ecological variables on the distribution and composition of vegetation communities [54,55,56].
Distribution of vegetation illustrates nine plant communities in their corresponding sampled units: (1) The Dodonia viscosa–Acacia modesta–Dalburgia sissoo community, which is the most prevalent vegetation community in the study area, shown to be widespread and continuous throughout the sub-Himalayan tropical dry deciduous forest zone [18]. (2) The Broussonetia papyrifera–Bauhinia purpurea–Jacaranda mimosifolia community, with a preference for maximum precipitation, moderate temperature, and altitudes confined to the center of the region. The (3) Quercus dilatata–Zanthoxylum armatum–Diospyros lotus, (4) Mallotus philippensis–Solanum erianthum–Buxus wallichiana, (5) Pinus roxburghii–Woodfordia fruticosa–Gymnosporia royleana, and (6) Buxus papillosa–Olea europaea–Tecoma stans communities reflect a higher altitudinal range with maximum precipitation, relatively low temperatures, and a high rate of anthropogenic impacts. These forests are found within a maximum altitudinal range of 1524 m (asl), and above this range are evergreen pine forests. Although altitude is the essential factor in the distribution of plant communities within a given range, microclimatic factors such as temperature and precipitation also play a role in the distribution of plant species [57,58]. (7) The Lantana camara–Acacia catechu–Cassia fistula, (8) Bombax malabaricum–Acacia nilotica–Bauhinia variegata, and (9) Prosopis juliflora–Ficus bengalensis–Phyllanthus emblica communities reflect lower altitudes, less precipitation, and higher temperature. Below these plain regions, at a minimum altitudinal range of 800 feet (asl), are tropical thorn forests [19]. Topography is the most influential factor in determining the distribution of tropical dry deciduous forests in Pakistan, as indicated by their close association with one another in plot results [59,60]. The forests at lower altitudes experience high temperatures, high levels of browsing pressure, and low annual precipitation; as a result, these forests have few seedlings and regenerate slowly [61].
Cluster analysis results strongly support the detailed correspondence analysis (DCA) ordination results, as the revealed assemblies can be quickly applied to the two-dimensional DCA ordination pattern. The two fundamental methods, the grouping of cluster analysis and ordination of DCA analysis, are complementary even though their applications are distinct [28].
CCA multivariate analyses reveal the pattern of species composition and distribution in response to various environmental variables and anthropogenic pressure [62]. In addition to altitude, CCA analyses reveal that precipitation, temperature, browsing intensity, and grazing pressure influence the distribution of sub-Himalayan tropical dry deciduous forests. According to previous research, slope, and altitude are the primary topographic variables that determine species distribution and composition in hilly ranges [63], which determine microclimatic conditions and influence both vegetation composition and spatial distribution [64,65,66,67,68].
Unlike protected forests, which have better species diversity and vegetation richness, the study area’s unprotected stations face unsustainable fuelwood collection pressure [69,70]. The same is true for grazing pressure, and as a result, forest sites under heavy grazing pressure from domestic and nomadic animals have low regeneration rates [71]. Study stations with a small family size and low availability of LPG have an average fuelwood consumption rate of 2.889 metric tons per year, compared to study stations with a large family size and total dependency on forest fuelwood, where the average recorded fuelwood consumption rate is 12.985 metric tons per year [72].
5. Conclusions
The sub-Himalayan tropical dry deciduous woods are a resource severely threatened by anthropogenic pressure. According to our findings, nine plant communities with 52 families of tropical dry deciduous plants are distributed over an 820 km2 along the foothills of the Himalayas. Fuel wood collection and grazing and browsing by domestic animals were found to be the greater threats to forested areas near human settlements. Forests are renewing at a slower rate and are demonstrating more severe impacts in terms of regeneration loss. Long-term management plans should be implemented to safeguard these forests and educate the local community on sustainable grazing practices. Due to the vast disparity between the rates of disturbance in protected versus unprotected forests, unprotected forests must be continually restored to their natural state.
Author Contributions
Conceptualization, N.A. and M.Z.; methodology, Z.U.; software, S.M.K.; validation, H.S., B.A. and K.S.; formal analysis, M.A.; investigation, N.A.; resources, A.A.; data curation, S.M.K.; writing—original draft preparation, N.A.; writing—review and editing, M.F.R., B.A. and E.B.; visualization, and supervision, M.Z.; project administration, M.A.; funding acquisition, M.Z. All authors have read and agreed to the published version of the manuscript.
Funding
Indigenous Ph.D. Fellowship for 5000 Scholars, revised ECNEC PIN: 106-1852-BM6-087 (50016247). Deanship of Scientific Research at Umm Al-Qura University, Grant Code: 22UQU4430043DSR91.
Institutional Review Board Statement
Not applicable.
Informed Consent Statement
Not applicable.
Data Availability Statement
Data are available on request.
Acknowledgments
We are grateful to the Higher Education Commission (HEC) of Pakistan for providing the funding for this research under the Indigenous Ph.D. Fellowship for 5000 Scholars, revised ECNEC PIN: 106-1852-BM6-087 (50016247). The authors would also like to thank the Deanship of Scientific Research at Umm Al-Qura 838 University for supporting this work by Grant Code: 22UQU4430043DSR91.
Conflicts of Interest
The authors declare no conflict of interest.
References
- Kayanja, F.; Byarugaba, D. Disappearing forests of Uganda: The way forward. Curr. Sci. 2001, 81, 936–947. [Google Scholar]
- Taye, F.A.; Folkersen, M.V.; Fleming, C.M.; Buckwell, A.; Mackey, B.; Diwakar, K.; Le, D.; Hasan, S.; Saint Ange, C. The economic values of global forest ecosystem services: A meta-analysis. Ecol. Econ. 2021, 189, 107145. [Google Scholar] [CrossRef]
- Isbell, F.; Calcagno, V.; Hector, A.; Connolly, J.; Harpole, W.S.; Reich, P.B.; Scherer-Lorenzen, M.; Schmid, B.; Tilman, D.; Van Ruijven, J. High plant diversity is needed to maintain ecosystem services. Nature 2011, 477, 199–202. [Google Scholar] [CrossRef]
- Ahmad, B.; Wang, Y.; Hao, J.; Liu, Y.; Bohnett, E.; Zhang, K. Optimizing stand structure for trade-offs between overstory timber production and understory plant diversity: A case-study of a larch plantation in northwest China. Land Degrad. Dev. 2018, 29, 2998–3008. [Google Scholar] [CrossRef]
- Ahmad, B.; Wang, Y.; Hao, J.; Liu, Y.; Bohnett, E.; Zhang, K. Optimizing stand structure for tradeoffs between overstory and understory vegetation biomass in a larch plantation of Liupan Mountains, Northwest China. For. Ecol. Manag. 2019, 443, 43–50. [Google Scholar] [CrossRef]
- Haines-Young, R.; Potschin, M. The links between biodiversity, ecosystem services and human well-being. Ecosyst. Ecol. A New Synth. 2010, 1, 110–139. [Google Scholar]
- Ahmad, B.; Wang, Y.; Hao, J.; Liu, Y.; Bohnett, E.; Zhang, K. Variation of carbon density components with overstory structure of larch plantations in northwest China and its implication for optimal forest management. For. Ecol. Manag. 2021, 496, 119399. [Google Scholar] [CrossRef]
- Ahmad, B.; Ali, A.; Rabbi, F.; Alam, N.; Siraj, M.; Mehmood, K.; Muhammad, M.W.; Ullah, S. Estimation of Wood Volume, Carbon Stock and Rotation Age in Subtropical Pine Forests of Malakand, Khyber Pakhtunkhwa. Pak. J. Bot. 2022, 54, 1821–1826. [Google Scholar] [CrossRef]
- FAO. Global forest resources assessment 2010: Main report. In FAO Forestry Paper 163; Food and Agriculture Organization of the United Nations: Rome, Italy, 2010. [Google Scholar]
- Bélanger, J.; Pilling, D. The State of the World’s Biodiversity for Food and Agriculture; Food and Agriculture Organization of the United Nations (FAO): Rome, Italy, 2019. [Google Scholar]
- Mallik, B. Saving the Forests: Ecology in Sarvodaya. In Legends in Gandhian Social Activism: Mira Behn and Sarala Behn; Springer Nature: Cham, Switzerland, 2022; pp. 301–392. [Google Scholar]
- Cronin, R.P.; Pandya, A. Exploiting Natural Resources: Growth, Instability, and Conflict in the Middle East and Asia; Henry, L., Ed.; Stimson Center: Washington, DC, USA, 2009. [Google Scholar]
- Joshi, P.; Singh, S.; Agarwal, S.; Roy, P. Forest cover assessment in western Himalayas, Himachal Pradesh using IRS 1C/1D WiFS data. Curr. Sci. 2001, 80, 941–947. [Google Scholar]
- Khan, S.M.; Sue, P.; Habib, A.; Hamayun, S.; Mushtaq, A.; Harper, D. Phyto-climatic gradient of vegetation and habitat specificity in the high elevation western Himalayas. Pak. J. Bot. 2013, 45, 223–230. [Google Scholar]
- Khan, S.M.; Page, S.E.; Ahmad, H.; Harper, D.M. Sustainable utilization and conservation of plant biodiversity in montane ecosystems: The western Himalayas as a case study. Ann. Bot. 2013, 112, 479–501. [Google Scholar] [CrossRef] [PubMed]
- Prabhakar, R.; Somanathan, E.; Mehta, B.S. How degraded are Himalayan forests? Curr. Sci. 2006, 91, 61–67. [Google Scholar]
- Shaheen, H.; Ullah, Z.; Khan, S.M.; Harper, D.M. Species composition and community structure of western Himalayan moist temperate forests in Kashmir. For. Ecol. Manag. 2012, 278, 138–145. [Google Scholar] [CrossRef]
- Champion, S.H.; Seth, S.K.; Khattak, G. Forest types of Pakistan. In Forest Types of Pakistan; Pakistan Forest Institute: Peshawar, Pakistan, 1965. [Google Scholar]
- Anjum, F.; Ahmad, M.; Shinwari, Z.K.; Zafar, M.; Sultana, S.; Majeed, S.; Usman, A.; Mir, A. Diversity of Invasive Alien Plants Species of Lesser Himalayas-Pakistan. Pak. J. Bot 2022, 54, 2391–2403. [Google Scholar] [CrossRef]
- Rajput, S.A. Beauty and Mystery of Gandhara Art. Res. A Res. J. Cult. Soc. 2018, 3, 1–12. [Google Scholar] [CrossRef]
- Sanchez-Azofeifa, A.; Powers, J.S.; Fernandes, G.W.; Quesada, M. Tropical Dry Forests in the Americas: Ecology, Conservation, and Management; CRC Press: Boca Raton, CA, USA, 2013. [Google Scholar]
- Brandeis, T.J.; Delaney, M.; Parresol, B.R.; Royer, L. Development of equations for predicting Puerto Rican subtropical dry forest biomass and volume. For. Ecol. Manag. 2006, 233, 133–142. [Google Scholar] [CrossRef]
- Ghimire, K.B.; Barraclough, S.L. Agricultural Expansion and Tropical Deforestation: Poverty, International Trade and Land Use; Routledge: Oxfordshire, UK, 2013. [Google Scholar]
- Barbier, E.B. Explaining agricultural land expansion and deforestation in developing countries. Am. J. Agric. Econ. 2004, 86, 1347–1353. [Google Scholar]
- Biondi, E. Phytosociology today: Methodological and conceptual evolution. Plant Biosyst.-Int. J. Deal. All Asp. Plant Biol. 2011, 145, 19–29. [Google Scholar] [CrossRef]
- Ewald, J. A critique for phytosociology. J. Veg. Sci. 2003, 14, 291–296. [Google Scholar] [CrossRef]
- Whittaker, R.J.; Willis, K.J.; Field, R. Scale and species richness: Towards a general, hierarchical theory of species diversity. J. Biogeogr. 2001, 28, 453–470. [Google Scholar]
- van der Maarel, E. Vegetation ecology—An overview. Veg. Ecol. 2005, 3, 1–51. [Google Scholar]
- Zedan, H. IUCN Red List of Threatened Species: A Global Species Assessment; Iucn: Gland, Switzerland, 2004. [Google Scholar]
- Zou, D.; He, Y.; Lin, Q.; Cui, G. Evaluation of the level of threat and protective classification of the vegetation of Makehe Forest in Sanjiangyuan Nature Reserve, west China. Front. For. China 2007, 2, 179–184. [Google Scholar] [CrossRef]
- Song, N.; Zhang, J. Multivariate analysis of the endangered medicinal species cercidiphyllum japonicum communities in the Shennongjia Reserve, central China. Cerne 2018, 24, 180–189. [Google Scholar] [CrossRef]
- Chahouki, M.A.Z. Classification and ordination methods as a tool for analyzing of plant communities. Multivar. Anal. Manag. Eng. Sci. 2013, 221. [Google Scholar] [CrossRef]
- Grandin, U. PC-ORD version 5: A user-friendly toolbox for ecologists. J. Veg. Sci. 2006, 17, 843–844. [Google Scholar] [CrossRef]
- Ter Braak, C.J.; Smilauer, P. CANOCO Reference Manual and Canodraw for Windows User’s Guide: Software for Canonical Community Ordination (Version 4.5); www.canoco.com: Ithaca, NY, USA, 2002. [Google Scholar]
- Gilliam, F.S.; Saunders, N.E. Making more sense of the order: A review of Canoco for Windows 4.5, PC-ORD version 4 and SYN-TAX 2000. J. Veg. Sci. 2003, 14, 297–304. [Google Scholar]
- Alam, N.; Shinwari, Z.; Ilyas, M.; Ullah, Z. Indigenous knowledge of medicinal plants of Chagharzai valley, District Buner, Pakistan. Pak. J. Bot. 2011, 43, 773–780. [Google Scholar]
- Brower, J.E.; Zar, J.H.; Von Ende, C.N. Field and Laboratory Methods for General Ecology; WCB McGraw-Hill: Boston, MA, USA, 1998; Volume 4. [Google Scholar]
- Garden, M.B. Flora of Pakistan. 2011. Available online: http://www.tropicos.org/Project/Pakistan (accessed on 1 December 2022).
- Nath, T.K.; Jashimuddin, M.; Kamruzzaman, M.; Mazumder, V.; Hasan, M.K.; Das, S.; Dhali, P.K. Phytosociological characteristics and diversity of trees in a comanaged protected area of Bangladesh: Implications for conservation. J. Sustain. For. 2016, 35, 562–577. [Google Scholar] [CrossRef]
- Lomolino, M.V. The species-area relationship: New challenges for an old pattern. Prog. Phys. Geogr. 2001, 25, 1–21. [Google Scholar]
- Benjaminsen, T.A. Fuelwood and desertification: Sahel orthodoxies discussed on the basis of field data from the Gourma region in Mali. Geoforum 1993, 24, 397–409. [Google Scholar] [CrossRef]
- Fox, J. Firewood consumption in a Nepali village. Environ. Manag. 1984, 8, 243–249. [Google Scholar]
- Sanjay, G. Forest vegetation patterns along an altitudinal gradient in sub-alpine zone of west Himalaya, India. Afr. J. Plant Sci. 2008, 2, 42–48. [Google Scholar]
- Timilsina, N.; Ross, M.S.; Heinen, J.T. A community analysis of sal (Shorea robusta) forests in the western Terai of Nepal. For. Ecol. Manag. 2007, 241, 223–234. [Google Scholar] [CrossRef]
- De Cáceres, M.; Wiser, S.K. Towards consistency in vegetation classification. J. Veg. Sci. 2012, 23, 387–393. [Google Scholar] [CrossRef]
- Marimon, B.; Felfili, J.; Lima, E. Floristics and phytosociology of the gallery forest of the Bacaba Stream, Nova Xavantina, Mato Grosso, Brazil. Edinb. J. Bot. 2002, 59, 303–318. [Google Scholar] [CrossRef]
- Sagar, R.; Singh, J. Structure, diversity, and regeneration of tropical dry deciduous forest of northern India. Biodivers. Conserv. 2005, 14, 935–959. [Google Scholar] [CrossRef]
- Kumar, M.; Bhatt, V. Plant biodiversity and conservation of forests in foot hills of Garhwal Himalaya. J. Ecol. Appl. 2006, 11, 43–59. [Google Scholar]
- Parejiya, N.; Detroja, S.; Panchal, N. Vegetation analysis at Bandiyabedi Forest in Surendranagar district of Gujarat state of India. Int. J. Life Sci. Biotechnol. Pharm. Res. 2013, 2, 241–247. [Google Scholar]
- Luken, J.O. Directing Ecological Succession; Springer Science & Business Media: Berlin, Germany, 1990. [Google Scholar]
- Barbour, M.G.; Burk, J.H.; Pitts, W.D. Terrestrial Plant Ecology; Benjamin/Cummings: San Francisco, CA, USA, 1980. [Google Scholar]
- Beg, A.; Bakhsh, I. Vegetation on the scree slope of Chitral Gol. Pak. J. For. 1974, 24, 393–402. [Google Scholar]
- Khan, S.M.; Page, S.; Ahmad, H.; Harper, D. Ethno-ecological importance of plant biodiversity in mountain ecosystems with special emphasis on indicator species of a Himalayan Valley in the northern Pakistan. Ecol. Indic. 2014, 37, 175–185. [Google Scholar] [CrossRef]
- Khan, S.M.; Harper, D.; Page, S.; Ahmad, H. Species and community diversity of vascular flora along environmental gradient in Naran Valley: A multivariate approach through indicator species analysis. Pak. J. Bot. 2011, 43, 2337–2346. [Google Scholar]
- Chawla, A.; Rajkumar, S.; Singh, K.; Lal, B.; Singh, R.; Thukral, A. Plant species diversity along an altitudinal gradient of Bhabha Valley in western Himalaya. J. Mt. Sci. 2008, 5, 157–177. [Google Scholar] [CrossRef]
- Sanhueza, D.; Miranda, M.; Gómez, M.; Bonacic, C. Species richness, diversity and human activities in an elevation gradient of a high-ecosystem in Lagunas Huascoaltinas, Atacama Region, Chile. Cienc. E Investig. Agrar. Rev. Latinoam. Cienc. Agric. 2009, 36, 411–424. [Google Scholar] [CrossRef]
- Jennings, M.D.; Faber-Langendoen, D.; Loucks, O.L.; Peet, R.K.; Roberts, D. Standards for associations and alliances of the US National Vegetation Classification. Ecol. Monogr. 2009, 79, 173–199. [Google Scholar] [CrossRef]
- Sharma, C.; Baduni, N. Effect of aspect on the structure of some natural stands of Abies pindrow in Himalayan moist temperate forest. Environmentalist 2000, 20, 309–317. [Google Scholar]
- Dawes, W.R.; Short, D. The significance of topology for modeling the surface hydrology of fluvial landscapes. Water Resour. Res. 1994, 30, 1045–1055. [Google Scholar]
- Khan, N.; Shaukat, S.S.; Ahmed, M.; Siddiqui, M.F. Vegetation-environment relationships in the forests of Chitral district Hindukush range of Pakistan. J. For. Res. 2013, 24, 205–216. [Google Scholar] [CrossRef]
- Song, C.-Y.; Liu, G.-H.; Liu, Q.-S. Spatial and environmental effects on plant communities in the Yellow River Delta, Eastern China. J. For. Res. 2009, 20, 117–122. [Google Scholar] [CrossRef]
- Khafagi, A.; Sharaf, A.; Hatab, E.; Moursy, M. Vegetation composition and ecological gradients in Saint Katherine Mountain, South Sinai, Egypt. Am.-Eur. J. Agric. Environ. Sci. 2013, 13, 402–414. [Google Scholar]
- Titshall, L.; O’Connor, T.; Morris, C. Effect of long-term exclusion of fire and herbivory on the soils and vegetation of sour grassland. Afr. J. Range Forage Sci. 2000, 17, 70–80. [Google Scholar] [CrossRef]
- Day, F.P.; Monk, C.D. Vegetation patterns on a southern Appalachian watershed. Ecology 1974, 55, 1064–1074. [Google Scholar]
- Wang, X.; Zhang, B.; Zhang, K.; Zhou, J.; Ahmad, B. The spatial pattern and interactions of woody plants on the temperate savanna of Inner Mongolia, China: The effects of alternating seasonal grazing-mowing regimes. PLoS ONE 2015, 10, e0133277. [Google Scholar] [CrossRef]
- Liu, X.; Zhang, K.; Ahmad, B. Influence of fencing time on vegetation community structure and species diversity in sandy grassland of Ningxia in China. Nat. Environ. Pollut. Technol. 2015, 14, 703. [Google Scholar]
- Johnson, J.B. Stand structure and vegetation dynamics of a subalpine wooded fen in Rocky Mountain National Park, Colorado. J. Veg. Sci. 1997, 8, 337–342. [Google Scholar] [CrossRef]
- Busing, R.; White, P.; MacKenzie, M. Gradient analysis of old spruce—Fir forests of the Great Smoky Mountains circa 1935. Can. J. Bot. 1993, 71, 951–958. [Google Scholar]
- Bhatt, B.; Negi, A.; Todaria, N. Fuelwood consumption pattern at different altitudes in Garhwal Himalaya. Energy 1994, 19, 465–468. [Google Scholar]
- Sharma, A.; Uniyal, S.K.; Batish, D.R.; Singh, H.P. Utilization of fuelwood species by the Bhangalis community of western Himalaya, India. Environ. Dev. Sustain. 2022, 1–23. [Google Scholar] [CrossRef]
- Ahmad, Z.; Ali, Z.; Ghani, F.; Khalid, S. Regeneration of Natural Forests in the Hindu Kush Range: A Case Study of Quercus baloot Plants in Sheshikoh Oak Forests, District Chitral, Pakistan. Int. J. For. Res. 2022, 2022. [Google Scholar] [CrossRef]
- Shaheen, H.; Mushtaq, A.; Khan, R.W.A.; Azad, B. Fuelwood consumption pattern and its impact on forest structure in Kashmir Himalayas. Bosque 2016, 37, 419–424. [Google Scholar] [CrossRef]


Disclaimer/Publisher’s Note: The statements, opinions and data contained in all publications are solely those of the individual author(s) and contributor(s) and not of MDPI and/or the editor(s). MDPI and/or the editor(s) disclaim responsibility for any injury to people or property resulting from any ideas, methods, instructions or products referred to in the content. |
© 2023 by the authors. Licensee MDPI, Basel, Switzerland. This article is an open access article distributed under the terms and conditions of the Creative Commons Attribution (CC BY) license (https://creativecommons.org/licenses/by/4.0/).