Article

Comprehensive Low Voltage Microgrid Planning Methodology for Rural Electrification

1
Department of Electrical and Energy Engineering, Faculty of Electrical Engineering, Institute of Technology of Cambodia, Russian Federation Blvd., P.O. Box 86, Phnom Penh 120404, Cambodia
2
Univ. Grenoble Alpes, CNRS, Grenoble INP, G2Elab, 38 000 Grenoble, France
3
Energy Technology and Management Unit, Research and Innovation Center, Institute of Technology of Cambodia, Russian Federation Blvd., P.O. Box 86, Phnom Penh 120404, Cambodia
*
Author to whom correspondence should be addressed.
Sustainability 2023, 15(3), 2841; https://doi.org/10.3390/su15032841
Submission received: 30 November 2022 / Revised: 14 January 2023 / Accepted: 29 January 2023 / Published: 3 February 2023
(This article belongs to the Special Issue Sustainable, Resilient Evolving Microgrids)

Abstract

:
Recently, DC-powered devices such as loads (USB plugs, chargers, LED lighting) and distributed energy resources (solar photovoltaic and battery energy storage) have been increasingly used. Therefore, their connection to the grid requires AC/DC converters, which raises the question of operating part of the grid in DC in order to connect DC loads to DC producers and storage. In Cambodia, the electrification rate is only about 82% of the population in 2021 in rural areas. The objective of this work is to propose a low voltage microgrid comprehensive planning tool for electrification of developing countries. From the data collected on consumption needs, the objective is to find the optimal electrification scheme, i.e., AC or AC/DC distribution, optimal topology and distributed energy resources allocation and operation for both grid-connected and off-grid mode. A set of technical, economic, and environmental key performance indicators allows for comparison of solutions. The interest and efficiency of such a tool are illustrated on a real case study, an island area. Moreover, uncertainties on load consumption are also considered to assess the sensitivity and robustness of the proposed algorithm. The results show that, although the overall cost of the hybrid AC/DC microgrid is slightly higher than that of the AC microgrid, it allows a gradual electrification avoiding large initial investments.

1. Introduction

In developing and underdeveloped countries, it is estimated that about 760 million people still lack a connection to electricity [1], while, according to World Bank data, in 2020, about 18% of the world’s rural population cannot access electricity [2]. In Cambodia, the electrification situation is known as one of the countries with the lowest electrification rate in the region. According to the Electricity Authority of Cambodia, in 2022 [3], only about 88.41% of the total number of households could access grid electricity, leaving about half a million households unelectrified in the same year. This electrification rate tends to be lower in rural areas than in the urban areas (about 82% [2]). Most unelectrified households are located predominantly in rural, island, and flooded areas that are not connected to the national grid. Extending the grid to meet their energy needs is generally not viable due to high investment costs, insufficient energy service, reduced grid reliability, and construction challenges in connecting these remote areas.
Moreover, Cambodia is rich in renewable energy resources such as solar, hydro, and biomass energies. In particular, solar home systems (SHSs) contribute significantly to the development of electrification of remote and rural areas that do not have access to electricity grids.
It is important to note that there has been a recent increase in distributed energy sources that operate in DC form, such as photovoltaic (PV) and battery energy storage (BES) [4]. Furthermore, today’s electrical appliances are DC loads such as LED lights, TVs, chargers, and computers. For these reasons, it is now credible to consider AC/DC grids or to evolve the traditional AC distribution grid into a hybrid AC/DC distribution grid. Thus, the grid remains to supply both AC and DC loads with less AC/DC conversion stages, which are one of the main motivations for having hybrid AC/DC distribution networks.
To provide electricity access opportunities in these areas in Cambodia, the extension, new construction, and SHS integration into low voltage (AC) networks are investigated. The authors in [5] have studied an optimal AC low voltage topology with the integration of photovoltaic (PV); the shortest distance and possible pole balancing with the traditional method of the shortest path and first fit bin packing are implemented. This paper also took battery energy storage (BES) into account for the under-voltage problem. Later on, the previous authors [6] also implemented the same method for conductor distance minimization but in a grid extension perspective for a single-phase rural network in which a load density is low; an optimal sitting and sizing of PVs and BES to comply with voltage specifications is also provided by using Genetic Algorithm (GA). In the same context of rural electrification followed by [7], a radial grid topology is given by the shortest path and the mixed-integer quadratic programming for the minimum distance and pole balancing, respectively. Next, the shortest distance, pole balancing plus optimal sitting, and sizing of PV-BES are tested and compared with various test systems [8]; the authors have implemented the shortest path and GA for the given purpose. However, these proposed methods could not guarantee an optimal solution for full AC networks and it has to be improved due to the revolutions of technologies and load types.
DC loads, renewable energy sources, and storage devices are attractive for DC distribution network technology applications [9]. The integration of PV into the DC distribution networks is proposed in [10]; this work aims to locate and size the PV using a mixed-integer nonlinear programming (MINLP) model considering the annual operating cost under the planning period. This MINLP model is implemented for the optimal simultaneous sitting and sizing of renewable energy sources and BES in the DC distribution networks [11]. The DC distribution networks with optimal operation of PV integration are investigated in [12]; three different objectives which are operating cost, daily energy losses, and CO2 emission are provided using the Salp swarm algorithm (SSA). The minimum operation cost of PV integration into the DC grid is continuously studied in [13]; the authors have applied a discrete-continuous version of the Crow search algorithm (DCCSA) to solve the given problem. To validate these proposed methods, the 21-bus, IEEE 33-bus, and IEEE 69-bus networks are modified and tested. Additionally, the optimal operation of BES and power losses minimization of off-grid PV DC nano-grids are proposed by the authors in [14,15]; the optimal charge/discharge of BES and power exchanged between consumers are considered. However, the optimal architecture of DC distribution networks is not considered by the above authors.
Furthermore, many works investigated rural electrification by means of stand-alone, hybrid energy, and grid-connected systems considering techno-economic and environmental aspects in remote areas. The authors in [16] proposed a hybrid PV/biomass/diesel system for supplying energy to a remote rural village. This work focused on the optimization of hybrid configuration-based system architectures considering the cost of energy (COE) using the Hybrid Optimization Model for Electric Renewables (HOMER) tool. With HOMER and a control strategy algorithm, the optimal hybrid configuration of the PV/wind/BES system based on the minimum net present cost (NPC) and COE is found [17]. The optimal configuration of a hybrid PV/diesel/BES system is proposed in [18], where the authors implemented the Coyote optimization algorithm for the emission and cost of the system. The same objective but for a different hybrid configuration of PV/wind/diesel/BES is studied in [19] thanks to hybrid Harmony Search and Ring Theory algorithms. The possible hybrid PV/wind/diesel/BES is also investigated in [20] to find which optimal configuration provides a minimum COE using HOMER. The techno-economic analysis for optimizing a hybrid PV/hydro/diesel/wind/BES system using HOMER is studied in [21]. This system provides a minimum NPC and COE classified as the optimal configuration. HOMER is also implemented for hybrid energy systems but possibly grid-connected mode [22,23,24,25,26]; the authors focused on optimal configuration with the lowest NPC, COE, and CO2 emissions. However, these works above mostly focused on stand-alone, hybrid energy systems, and grid-connection systems but were inflexible for users and do not take account of the entire LV grid architecture powering all consumers.
This paper aims to develop a comprehensive low voltage (low voltage is defined as less than 1 kV AC and 1.5 kV DC according to the IEC 60038) (LV) microgrid planning tool consisting of a two-step algorithm for rural electrification in developing countries. (1) Propose a new architecture of a distribution system. (2) Find the optimal sizing and location of distributed energy resources (PV and BES). Subsequently, the uncertainties on the load profile will be presented to assess the sensitivity of the solution found. Then, some key performance indicators (KPIs) of the microgrid will be evaluated during the planning period for the “grid-connected” and “off-grid” modes. They consist of economic indicators such as total expenditure (TOTEX) and levelized cost of energy (LCOE), technical indicators such as autonomous time and energy, and an environmental indicator represented by the quantity of CO2 emissions.
The main contributions of this paper are as follows:
  • An integration of LV distribution system design and operation optimization in the microgrid planning process;
  • A novel algorithm for PVs and BES sizing and sitting as well as BES operation, especially in an AC/DC structure;
  • A gradual electrification option to avoid initial prohibitive capital expenditures (CAPEX) that would limit the progress of electrification, especially in remote and rural areas;
  • A comprehensive microgrid methodology that not only finds distributed energy resources as usual software do, but also adds the choice of distribution type (AC/DC) and topology.
The rest of this paper is organized as follows: Section 2 presents the traditional microgrid topologies encountered in the literature (AC, DC, and hybrid AC/DC) as well as the advantages and drawbacks of these low voltage distribution systems. Section 3 presents the proposed microgrid planning methodology. Then, the algorithm of the proposed methodology is described in Section 4. In Section 5, a real test case will be investigated for the validation of our proposed algorithm and a sensitivity analysis on the uncertainty on the load profile is also discussed. Finally, the conclusion and perspectives are drawn in Section 6.

2. Traditional Microgrid Topologies

Today, in the LV distribution system, there is an open discussion on the use of AC, DC, or hybrid AC/DC electrical systems for both rural and urban distribution. This depends on some criteria such as stability, connectivity, total capacity, available source, and available infrastructure [27].
Currently, inspired by traditional electric power systems, the AC distribution system is the most popular and commonly used structure for microgrid studies and implementations. The AC microgrid has several advantages: it is capable of integration with the conventional utility grid and compatible with AC equipment such as AC-based loads, there is no inverter requirement for AC loads, and the power protection systems are cost-effective [28]. However, its drawbacks are lower efficiency and expensive converters when supplying DC loads [28]. It is also difficult to control frequency and voltage.
Low voltage direct current (LVDC) distribution grids mostly use a bidirectional AC/DC converter located in the main substation [29]. It can interconnect several distributed energy resources: different types of loads (DC and AC through a power electronic converter), renewable energy resources, and storage devices [30]. Using DC systems has several advantages [31]: (1) suitable renewable energy generators, such as PV, fuel cells, and energy storage systems, are DC-based; (2) DC loads are currently increasing in the building and houses; (3) the future integration of the electric vehicle (EV) in the power systems will increase the consumption of DC devices in the buildings; (4) DC distribution systems are intrinsically more efficient than their AC counterparts because in DC there are no reactive power or skin effects; (5) there is no need for DC/AC and AC/DC converters to distribute the energy between DC agents (sources, loads, storage) through a DC power system. However, LVDC distribution systems still face some challenges and barriers such as the lack of standards and codes, protection issues, and the lack of industries and products for DC distribution systems. Thus, the cost of DC technologies is higher and for the time being the cost effectiveness is limited. Because of the advantages of DC over AC microgrids, many LVDC projects were implemented in developing countries, especially in rural or remote areas. For example, in Cambodia, Okra company has implemented a LVDC mini-grid in Steung Chrov village [32], where 81 households were connected with Okra mesh-grid systems with an average energy consumption of 520 Wh/day per household. The total installed PVs in this project is about 32.16 kWp with a total battery capacity of 201 kWh. Moreover, in Madagascar, Nanoé company has implemented solar LVDC nanogrids in Ambanja [33]. A nanogrid consists of four to six houses (total installed power of the nanogrid lower than 1 kW), one PV (between 100 and 300 W), and one battery (between 90 and 260 Ah). The first systems were deployed in mid-2017 and more than 2000 households now have access to Nanoé’s electrical services.
The typical structure of a hybrid AC/DC microgrid is shown in Figure 1. It consists of several devices such as AC and DC loads, converters, storage units, AC distributed generation (e.g., diesel generator), DC distributed generation (e.g., PV), etc.
In [34], researchers identified two main groups of hybrid AC/DC microgrids: coupled AC and decoupled AC configurations. In the coupled AC topology, the AC network of the microgrid is directly connected to the power grid through a transformer and an AC/DC converter is used for the DC network. On the other hand, decoupled AC configurations consist of at least one AC/DC and DC/AC stage. There is no direct connection between the power grid and the AC grid of the microgrid. In the coupled AC configuration, there are two arrangements of conversion stages: fully isolated and partially isolated. In our work, the most interesting topology is a coupled AC, fully isolated hybrid microgrid as shown in Figure 2. A transformer is located at the point of connection with the MV grid when available. This provides isolation to the entire microgrid.
A hybrid AC/DC microgrid architecture can benefit the customers and also the grid owner in numerous ways, including simple integration with AC or DC devices, no need for synchronization for generation and storage units, and economic feasibility [29]. However, a hybrid AC/DC microgrid presents various drawbacks such as protection issues and control complexity among the units [34]. Other authors focused on hybrid AC/DC microgrids because of their advantages, but they have mainly studied the optimal energy management systems within these microgrids and power exchange between them [35,36,37,38,39,40].

3. Problem Formulation

3.1. LV Microgrid Comprehensive Planning Tool

The objective of the microgrid planning tool is to electrify a given area from the electrical topology design to the distributed energy resources allocation while minimizing the global cost and the environmental impact (assessed using the CO2 emissions) and maximizing the autonomous time and energy. It can be noted that the previously listed criteria can sometimes be contradictory, since, for example, low carbon options often increase costs. The objective function of this planning problem can be expressed with Equation (1) subject to the constraints of Equations (2) and (3) [41].   C T o t a l , C C O 2 , C a u t o   t i m e , and C a u t o   e n e r g y defined below are normalized relative to target values defined by the user.
min x ω 1 × C T o t a l + ω 2 × C C O 2 + max x ω 3 × C a u t o   t i m e + ω 4 × C a u t o   e n e r g y
Subject to:
0.9 V n 1.06 ,   1 n N
I l I l m a x ,   1 l M
where:
  • ω 1 to ω 4 : weights allocated to objectives
  • C T o t a l : total cost of the microgrid (defined in Section 4.4)
  • C C O 2 : amount of CO2 emissions generated (defined in Section 4.4)
  • C a u t o   t i m e : percentage of time the microgrid is autonomous from the MV grid (in case of grid-connected mode) or in operation (in case of off-grid mode) (defined in Section 4.4)
  • C a u t o   e n e r g y : percentage of energy produced by the microgrid (in grid-connected mode) (defined in Section 4.4)
  • x : decision variables which consist of the electrical topology (location, type, and size of lines) and DERs (distributed energy resources) sitting and sizing (PV, storage, transformer, diesel generator)
  • V n : voltage at node n of the microgrid composed of N nodes
  • I l : current in line l of the microgrids consisted of M lines
  • I l m a x : maximal admissible current in line l
This problem belongs to NP-hard problems since both the objective function and constraints are nonlinear, which indicates that only decoupling of problems and/or using heuristics can allow one to reach good solutions in a reasonable time.

3.2. Four-Stage Proposed Algorithm Description

To reach the objective, a four-stage algorithm is proposed and illustrated using the SADT (Structured Analysis and Design Technique) [42] approach as depicted in Figure 3. Block A01 builds the optimal topology according to the studied area and the desired distribution (either AC or AC/DC). The algorithm of A02 performs the distributed energy resources allocation among the LV network, i.e., the optimal number and location of PV panels and the optimal power and capacity of the decentralized batteries (deBES). Then, A03 computes the remaining energy purchased either from the MV grid in the case of “grid-connected” mode or from the genset-centralized battery (ceBES) located at a future interconnection node with the MV system in the case of “off-grid” mode. In the latter case, the power and capacity of the ceBES are calculated as well as the size and energy of the genset. Finally, the KPIs (TOTEX, LCOE, autonomous time and energy, and CO2 emissions) of the microgrid are computed. Blocks A01 to A04 are described in the next section.
The volume of required inputs to the algorithm listed below will depend on the size of the village (proportional to the number of households). These inputs can be obtained using data base, survey, or measurements and can be described in text or Excel format.
  • Loads description: coordinates (latitude and longitude), estimation of one or several daily power profiles (either from real measurements or from data bases if available) and yearly peak power consumed.
  • Grid elements description: coordinates and connection of poles, coordinates of the interconnection point, LV conductor data base (technology, section, resistance, reactance, maximal admissible current, cost), transformers database (installed power, cost).
  • Grid architecture: choice of distribution (AC, DC, or AC/DC), type of topology (tree or cluster structure), management mode (grid-connected or off-grid).
  • PV and BES technologies available in the market (installed powers, life durations, and capacities for BES).
  • Economic data: lifetime of the project, discount ratio, cost of the electricity in the considered country.

4. Algorithms Description

4.1. A01: Topology Optimization

4.1.1. Proposed Topologies

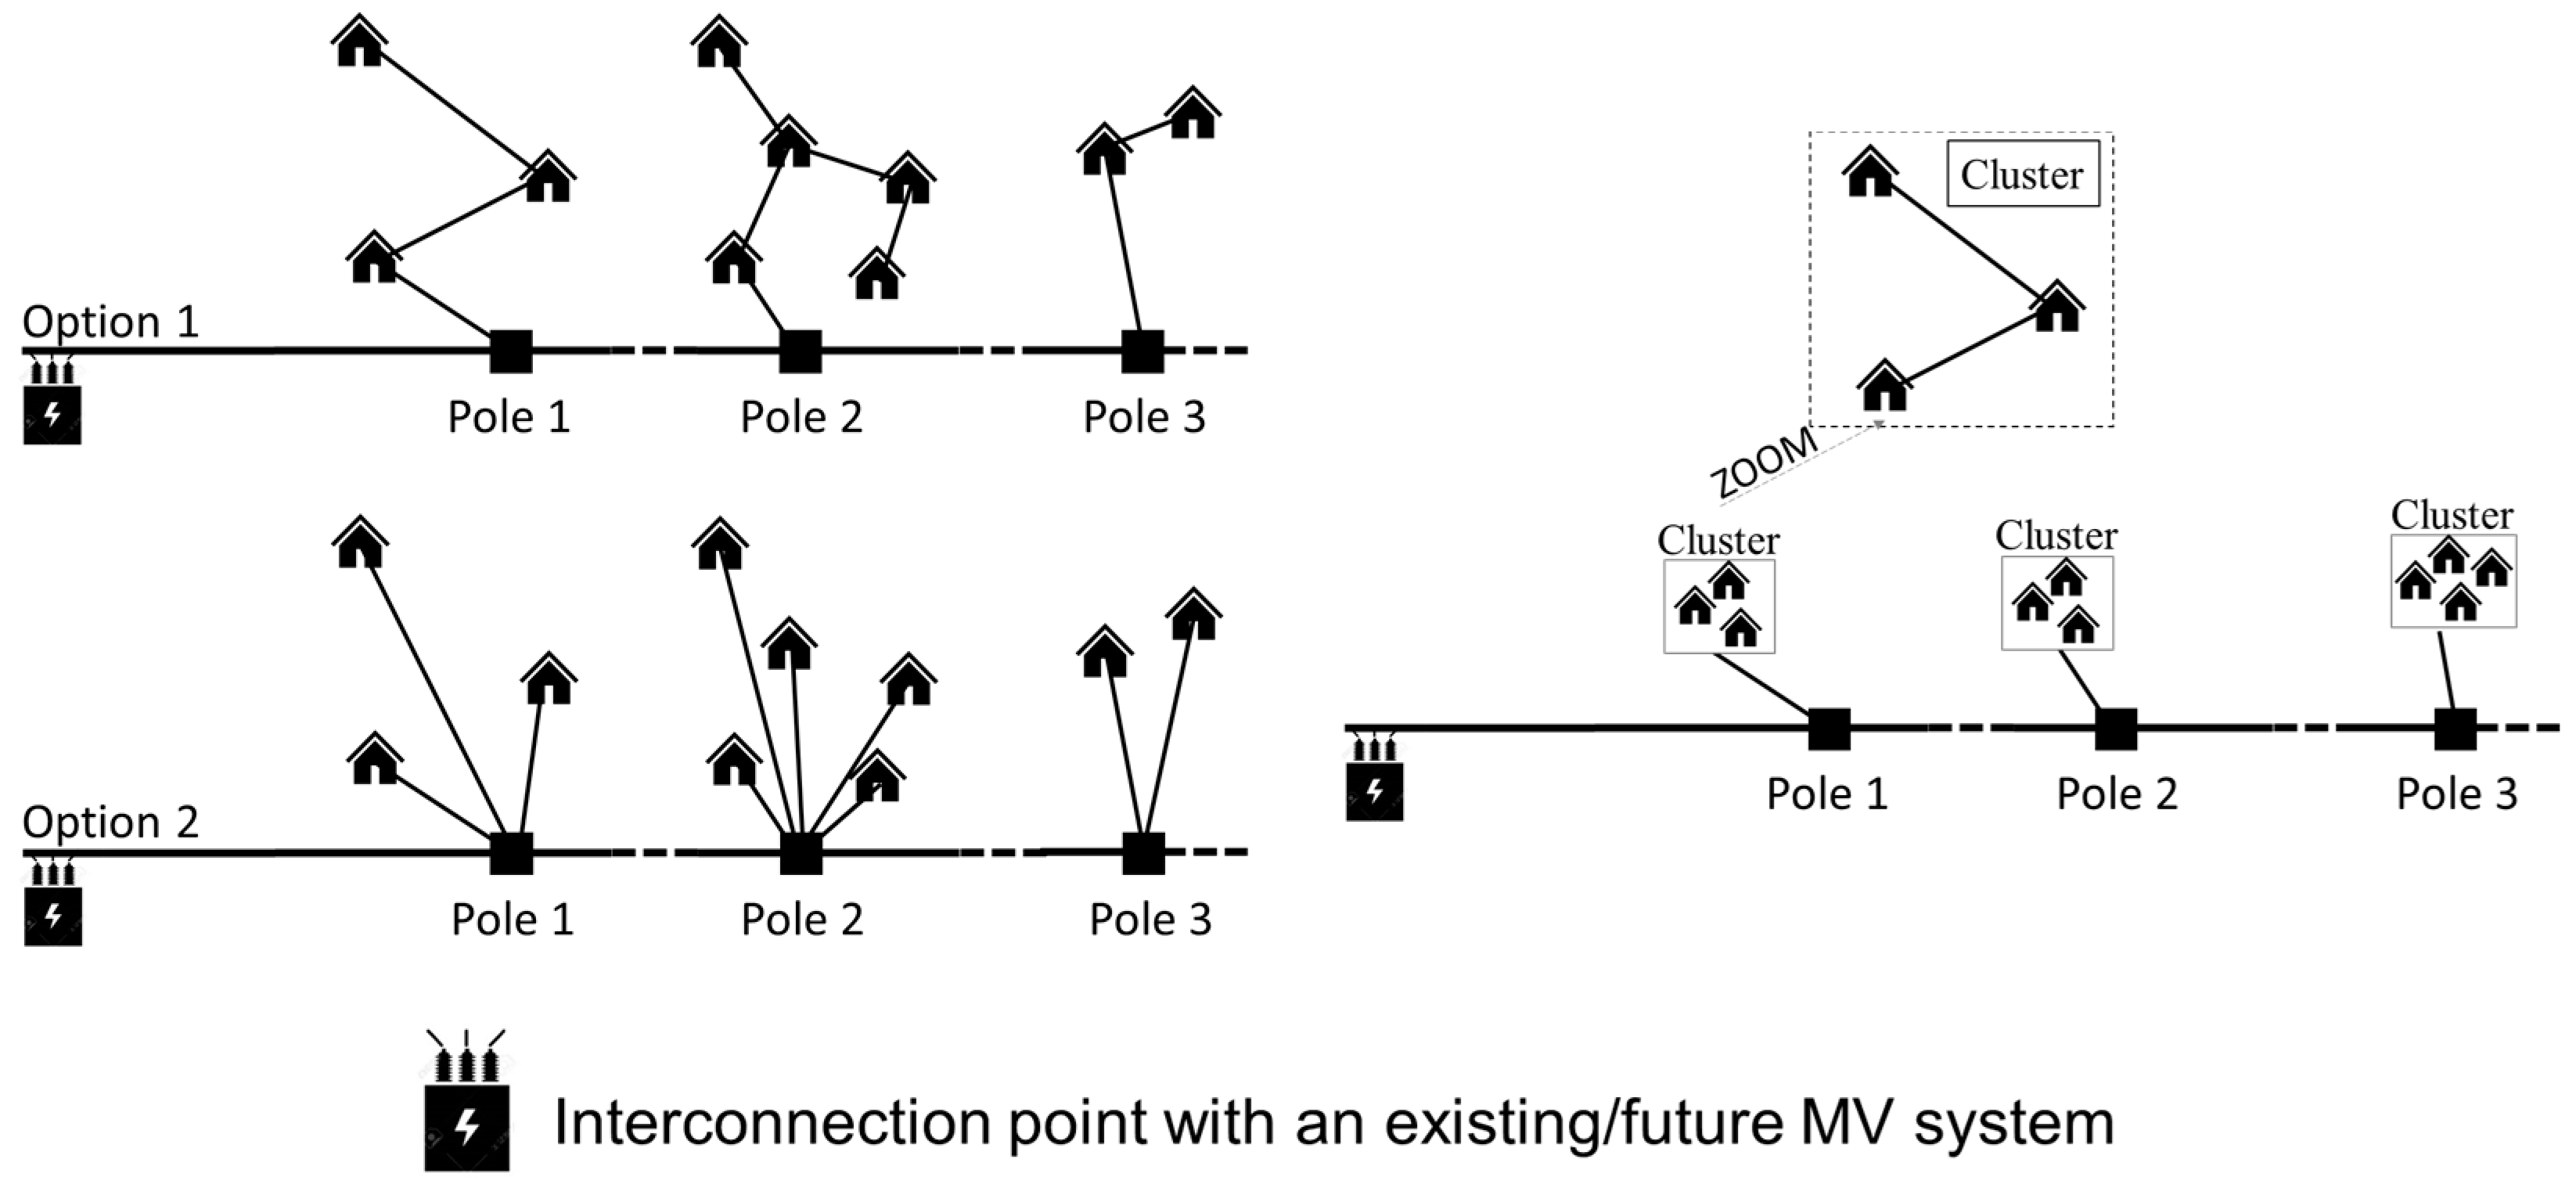
The objective is to find the best topology, which minimizes the global cost of the system (which also minimizes the total length of the system). For this purpose, the first topology selected is the tree structure, as shown in Figure 4 (left image) with two options, either minimizing the total length of the system (minimum spanning trees) or minimizing the direct connection of each load to one pole. In the second option, although the total length of the system is increased, the voltage drop will be reduced, so the sizing of conductors and the total cost may be more optimal. Finally, the LV system consists of three minimum spanning trees (one tree per phase) connecting the poles of the system. The phase of the households is selected so as to balance the LV grid. The drawback of this topology is that households will have access to electricity only when the entire grid will be built, unless they have solar home systems, for example, which require a high initial capital investment. To solve this issue, a second topology, the cluster structure, is investigated and shown in Figure 4 (right image). The LV system also consists of three minimum spanning trees (one tree per phase). The difference is that clusters of households are connected so as to balance the system. These clusters can be either in AC or DC and, in the DER allocation phase (step A02), they can be sized to be autonomous, thus enabling a gradual electrification. Indeed, when several clusters are built, they can be connected to an AC main line connected to an “interconnection point” where an MV/LV transformer is already installed or planned to be installed. In the latter case, the consumption/production balancing is ensured by a diesel generator and a centralized battery located at this interconnection point.

4.1.2. Algorithms Developed

Figure 5 shows the algorithm for the tree and the cluster structures. For both algorithms, the required input data are coordinates and peak powers of households, poles location and connection, coordinates of the interconnection point, LV conductors data base (technology, section, resistance, reactance, maximal admissible current, cost), transformers database (installed power, cost), choice of distribution (AC, DC or AC/DC), and type of topology (tree or cluster structure).
For the tree structure algorithm, two options are possible for power phase balancing:
  • each load is first allocated to a phase using a mixed integer linear programming (MILP [43]) formulation in order to balance power consumption between phases (see Equations (4)–(9)) and then three trees are built (one per phase) using the minimum spanning tree algorithm.
  • first all loads and poles are connected together with MST, then the poles (with the loads connected to them) are allocated to phases.
As shown in Figure 5, two options are possible for the tree structure: minimum spanning tree using Kruskal’s algorithm [44] or shortest path [45]. Load flows (AC unbalanced or DC) are used to select the optimal cross-section of lines so that voltage and current constraints are respected.
The algorithm of the cluster structure consists of four main steps.
  • Clustering: loads are packed into a given number of clusters using the K-means method [46] to minimize the total length of conductors inside each cluster. The optimal number of clusters is selected using the elbow method [47]. Loads inside each cluster are connected together with a minimum spanning tree (Kruskal’s algorithm).
  • Connection of clusters to poles: for each cluster, the shortest path algorithm finds the shortest length from each load to poles. Then, we select among the poles the one with the shortest distance to the considered cluster. Loadflows (AC unbalanced or DC) enable sizing the cross-sections of lines to respect the voltage and current constraints. Finally, the chosen connection is the one which minimizes power losses.
  • Power balancing: clusters are allocated to a phase (same MILP formulation as for the tree structure).
  • Sizing of the main feeder: Loadflows (AC unbalanced or DC) make it possible to select the optimal cross-section of the main lines in order to respect voltage and current constraints.

4.1.3. Phase Power Balancing

The MILP formulation of the load, pole, and cluster balancing problem is defined by Equations (4)–(9). The objective function (4) is the sum of the difference variables ε + p h (positive difference power of phase ph) and ε p h (negative difference power of phase ph) whose definition is given by Equation (5). This constraint limits the total power of each phase to the average power per phase. Equation (6) guarantees that only one load (pole or cluster) can be assigned to only one phase through the variable x n t , p h whose value is 1 if the load (pole or cluster) belongs to phase ph and 0 otherwise. Equations (8) and (9) give the boundaries of ε p h and ε + p h .
min x p h = 1 3 ε + p h + ε p h
n t = 1 N t P n t × x n t , p h ε p h + ε + p h P t o t 3 , p h = 1 : 3
p h = 1 3 x n t , p h = 1 , n t = 1 : N t
0 x n t , p h 1 , p h = 1 : 3 , n t = 1 : N t
0 ε p h + , p h = 1 : 3
0 ε + p h + , p h = 1 : 3
where p h : index of phase, n t : index of loads, poles, or clusters, N t : total number of loads, poles or clusters, Ptot: total power consumed in the studied area.

4.2. A02: Distribution Energy Resources Allocation

After having obtained the optimal topology of microgrids (A01), at this stage, the different sitting and sizing algorithms for the distributed energy resources (PV and deBES) of the microgrid are described.

4.2.1. Tree-Structure

In this structure, it was decided to associate each PV with a deBES so as to optimize self-consumption and to minimize the use of the grid. All the PV-deBES systems are supposed to have the same installed power and capacity. The operating rule of the deBES is simple: it is charged in case of excess of PV production and discharged in case of lack of PV production. The objective is then to find the optimal number, location, and installed powers of PV-deBES as well as the capacity of the deBES in order to minimize both the energy provided at the interconnection node (either by the MV grid or by a ceBES coupled to a diesel generator noted ceBES-genset) and global power losses. The full formulation of this multi-objective function subject to voltage and current constraints is detailed in [8] and solved using a genetic algorithm.

4.2.2. Cluster Structure

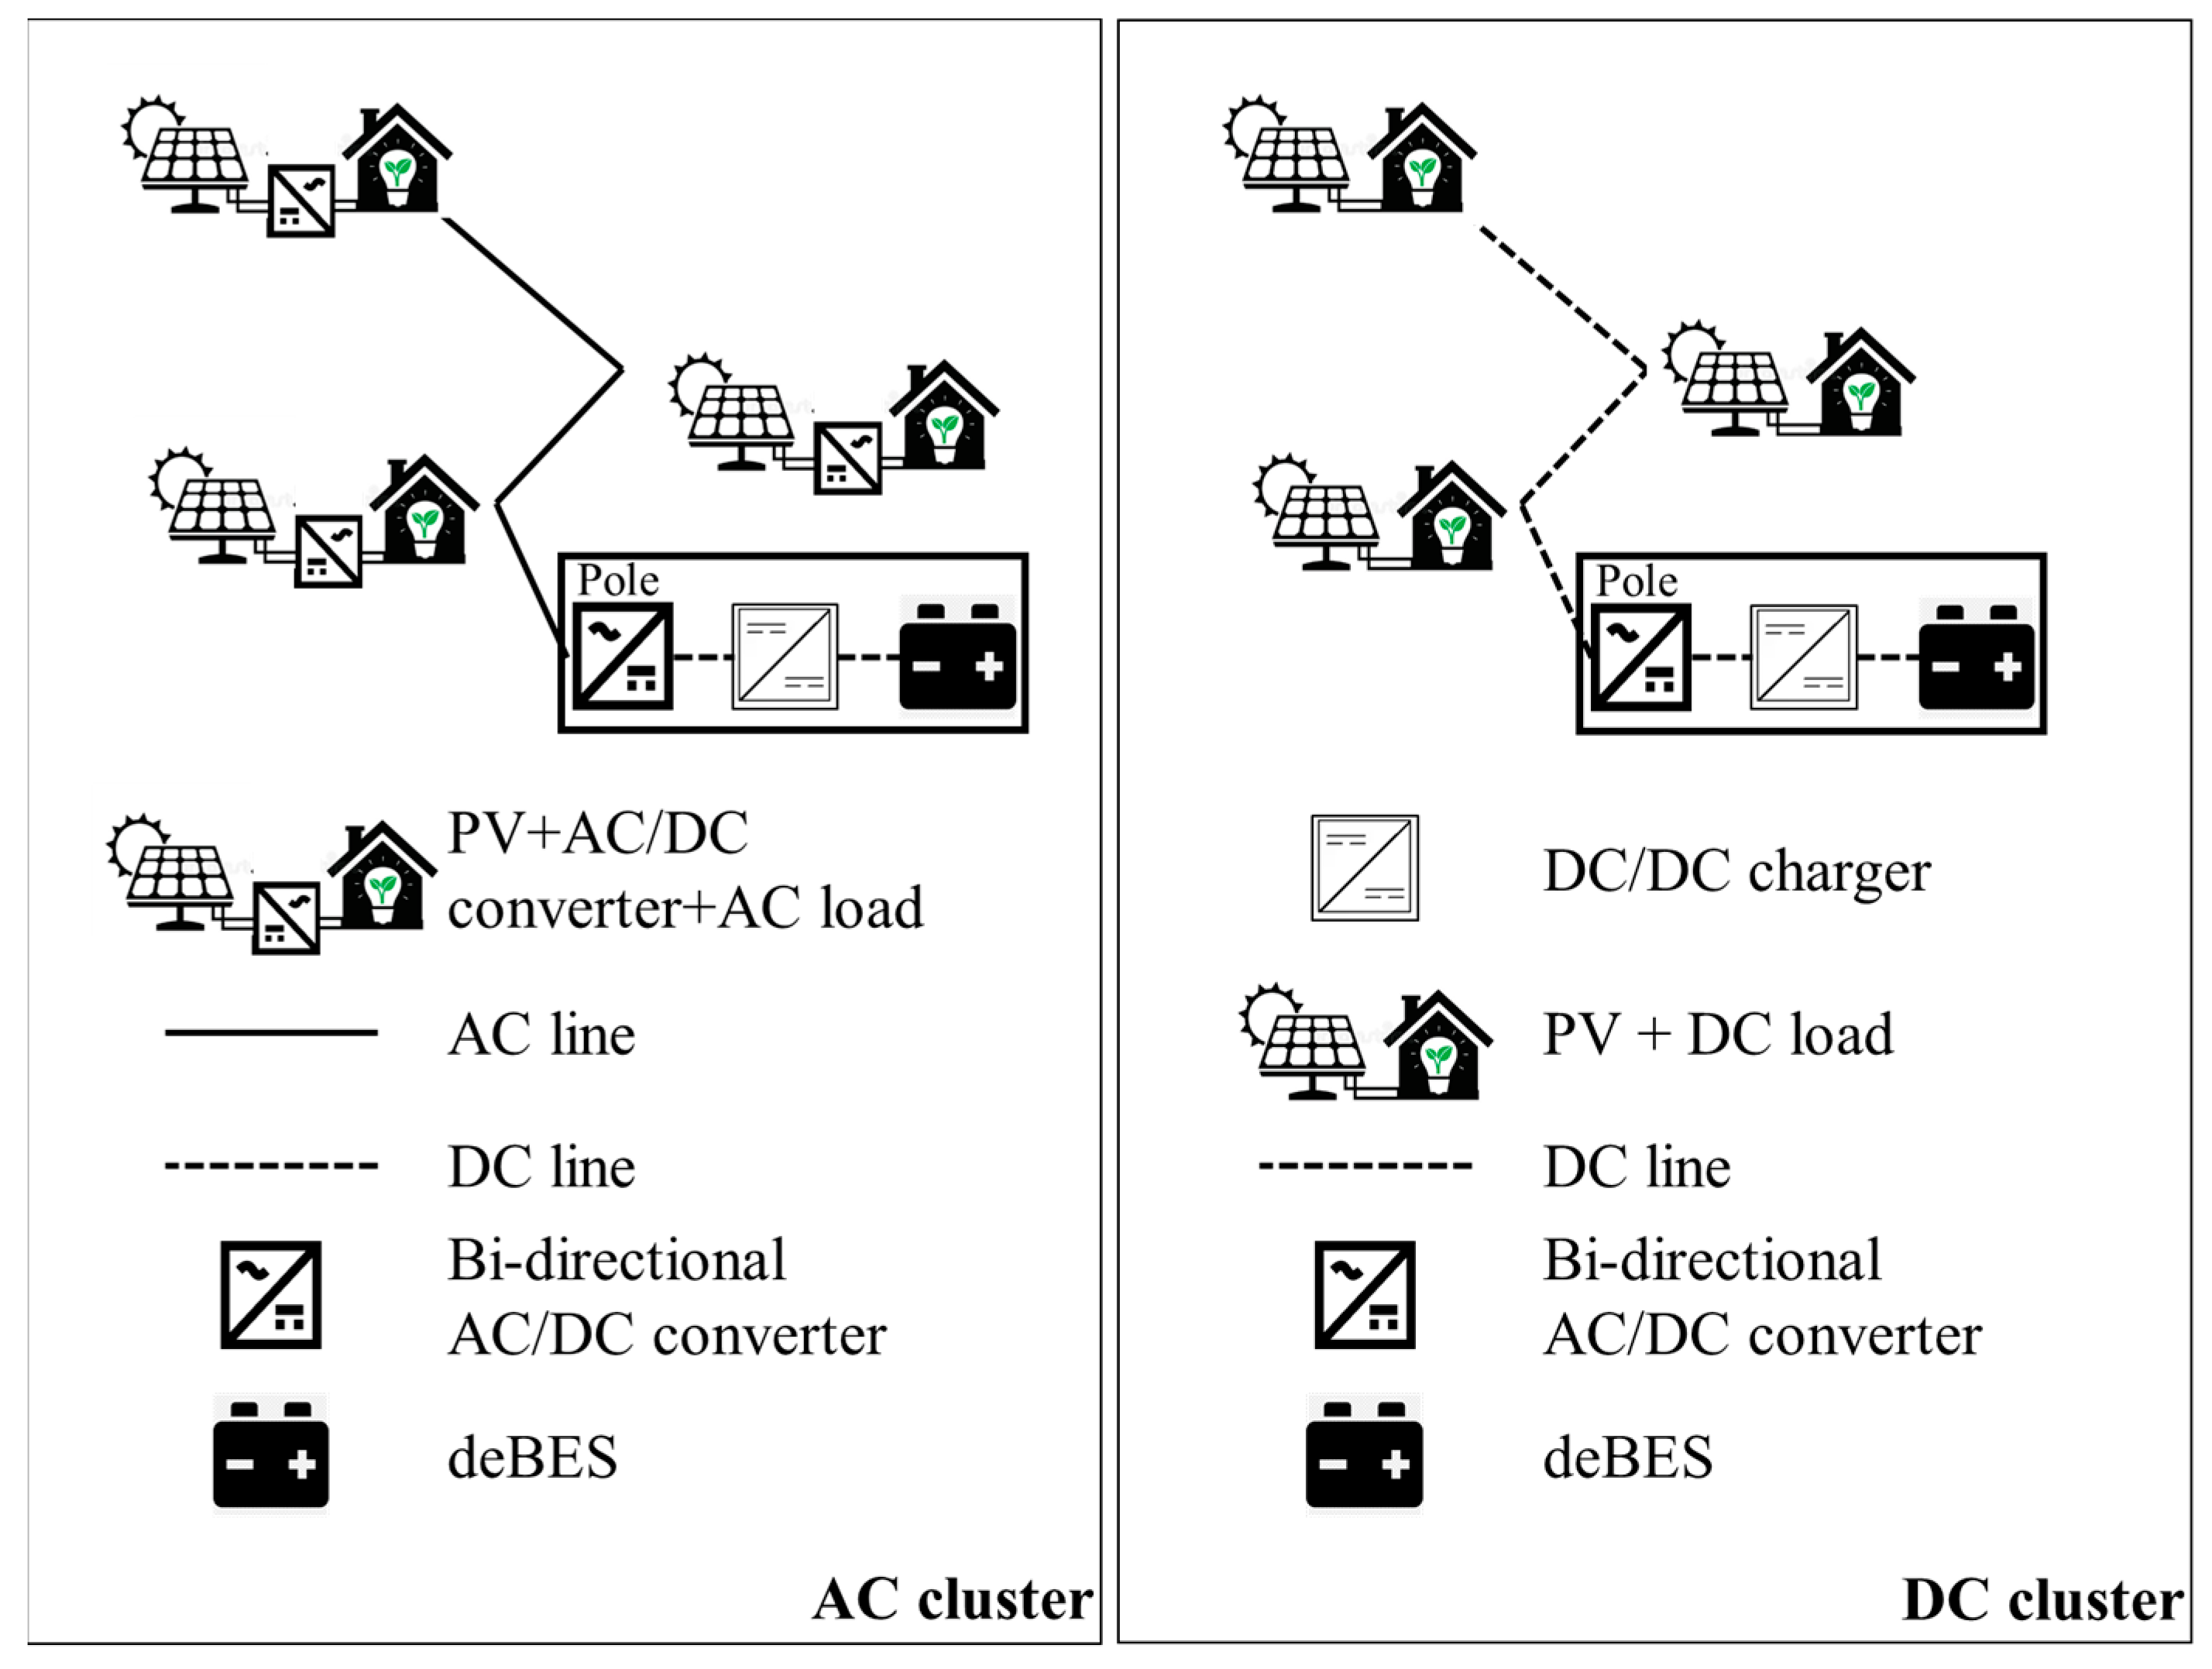
The cluster structure aims to allow for a gradual electrification. For this purpose, just enough PVs are located in the clusters to cover the energy consumption. A deBES is associated with each cluster and located on the pole where the cluster is connected. Figure 6 shows the structure of a cluster in the AC and DC cases.

PV Allocation

For PV sizing, we suppose that each household can have only one PV panel. Its minimum installed power, P P V m i n , is equal to P t o t a l N where P t o t a l is the total power of the LV loads and N the total number of loads. Based on the P P V m i n found, we select a normalized value, P P V which is just over P P V m i n among standard values for commercial PV panels. PVs are located step by step from the farthest load to the load closest to the pole they belong to, using Dijkstra’s algorithm [48].
Once we have obtained the number and location of the PVs, the energy produced by PVs in all clusters over a day is computed and could be greater than the energy needed from the loads of the system since the load and PVs power curves do not have the same shape. We have chosen to avoid reverse power flows, i.e., excess energy sent from the secondary feeders to the main feeder. Indeed, these reverse power flows may need to change the protection scheme and perhaps to reinforce the MV grid if they are too weak (in case of “grid-connected” mode). In case this objective is not satisfied, PVs having the smallest distances to their pole will be removed one by one until the objective is reached in order to maximize local consumption and minimize power losses. To perform these calculations, a normalized one-year PV curve is obtained from HOMER (HOMER obtains PV production curves from the NASA Prediction of Worldwide Energy Resource (POWER) database. They are based on the solar irradiation where the village is located) while the normalized annual load curve is constructed by repeating a normalized daily load curve measured in a rural home (with the day-to-day load curve being almost constant). Figure 7 summarizes the PV removal procedure.
  • With:
  • k: index of clusters,
  • j: index of loads in clusters,
  • h: index of hours
  • d: index of day
  • P e q _ k is the difference of the instantaneous power of loads ( L o a d c u r v e ) and PVs ( P V c u r v e )
  • P k : total power of cluster k (kW)
  • P P V : normalized installed power of one PV unit (kW)
  • N k : number of loads in cluster k
  • K : number of clusters
  • E c l u s t e r _ k : energy of the cluster k over the year
  • P c l u s t e r _ k h : power of cluster k with PV (including DC losses) at time h (kW)

deBESs Sizing

There is one deBES per cluster connected directly to the poles. Their sizing consists of three main steps: the computation of their yearly power curve, their installed power, and their capacity. The yearly power curve of the battery of each cluster is the opposite of the early power curve of each cluster. The required yearly energy of the batteries is modified so as to respect the constraint that the batteries must be fully discharged every midnight of the year. Finally, we calculate the capacity of deBESs over a year by using the minimum state of charge of the battery ( S O C m i n   , see Equation (14)). Since the PV curve varies enough through a year (rainy and dry season), we compute the needed capacity for each day. Then, we can obtain up to 365 different sizes of the capacity of each deBES. Finally, we select the highest value of deBES size so that it can avoid the undersizing of deBES over a year. In this case, we did not consider an extra safety margin. Efficiencies of the DC/DC charger (deBES connection if DC clusters), bidirectional AC/DC inverters (in case of AC and DC clusters), and AC/DC inverters (PV connections in case of AC clusters) must be considered in the computation of the power of clusters.

4.3. A03: Microgrid Balancing

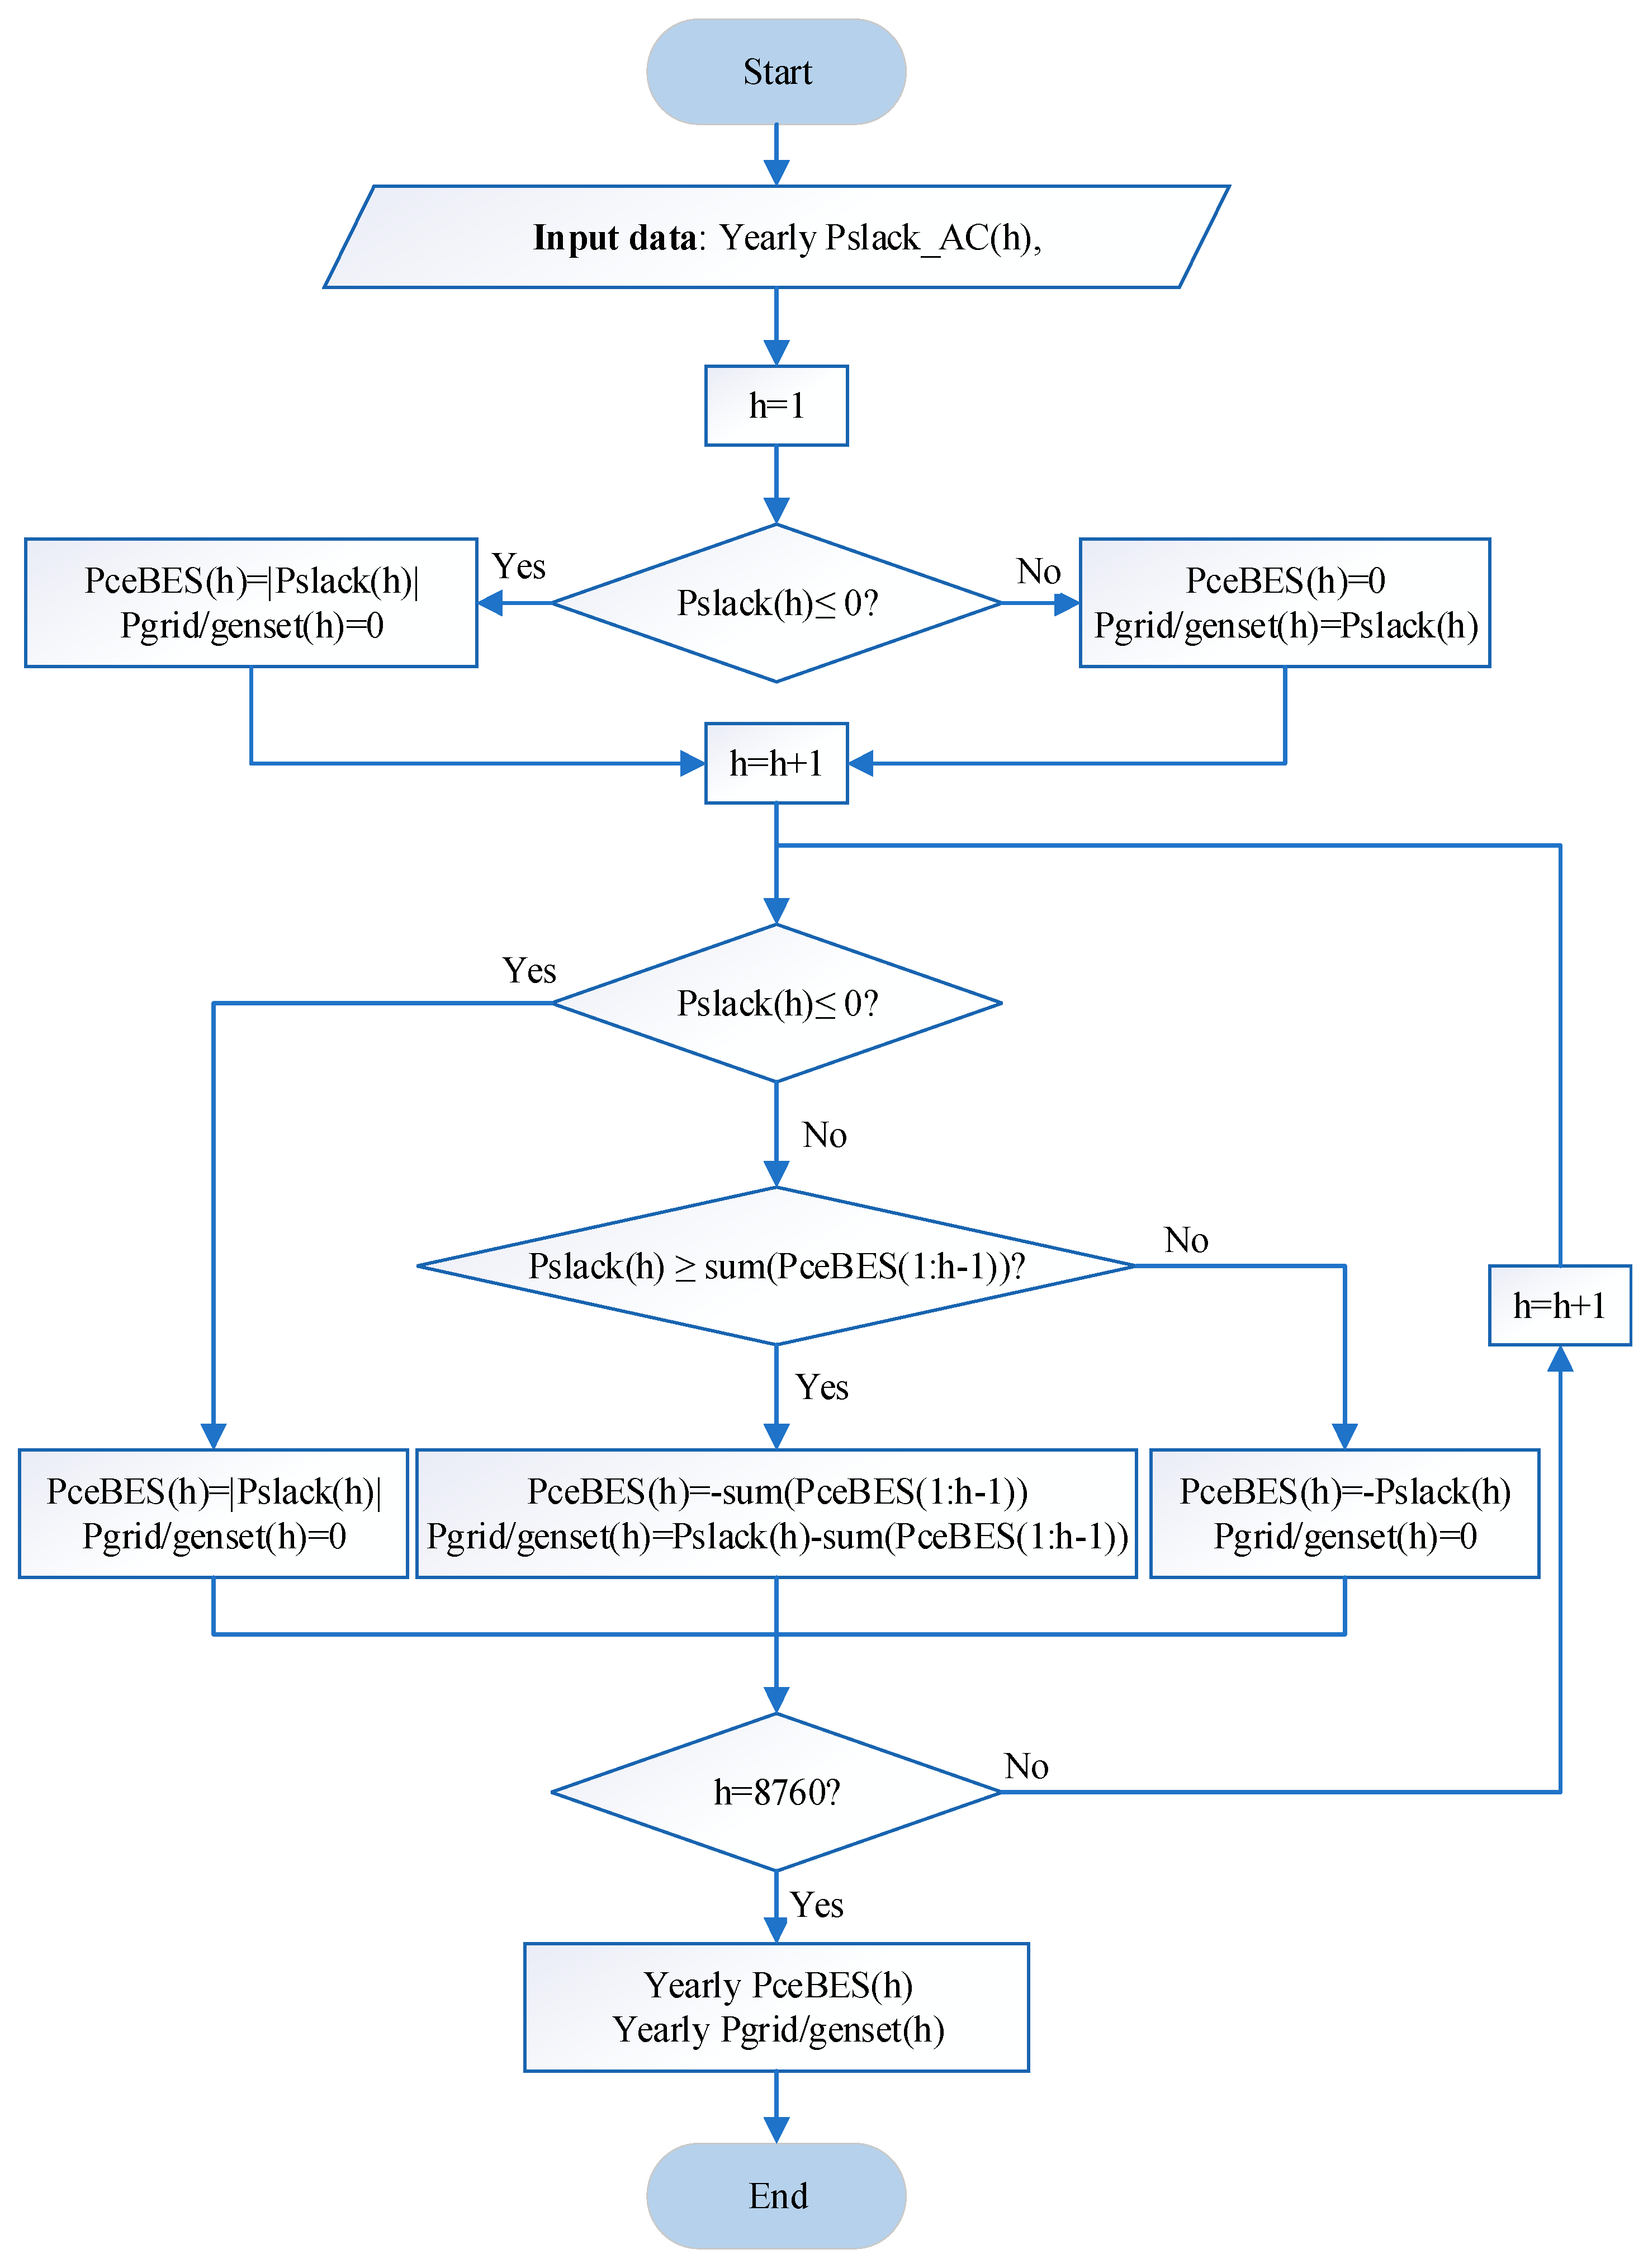
In the previous section, the DERs sizing and location were described (A02). An unbalanced AC load flow [49] of the full system using PVs and loads time series enables us to find the cross-sections of the main feeders (to meet voltages and currents constraints) and to estimate the remaining power the interconnection node has to provide. This remaining power is generated by a genset-ceBES (“off-grid” mode) or by the MV grid if available through the MV/LV transformer (“grid-connected” mode). Figure 8 shows the algorithm to find the yearly power of the ceBES in order to avoid reverse power flows. A minimum installed power of genset will ensure the complete balance of the system. Then, we can calculate the energy of the ceBES versus time, C c e B E S h and find the installed capacity of the ceBES, C c e B E S . The installed power of either the genset or the MV/LV transformer is the maximal value of P g r i d / g e n s e t h .
  • P s l a c k   A C h : required power at the interconnection node et time h,
  • P c e B E S h : ceBES power at time h,
  • P g r i d / g e n s e t h : power provided by the grid or the diesel generator at time h,
  • N.B. it is also possible to consider PV-deBES system and to apply the allocation method of the tree-structure.

4.4. A04: KPIs Computaions

4.4.1. TOTEX

The total expenditure (TOTEX) is the total investment cost of all elements and the operation and maintenance (O&M) cost of the microgrid. The TOTEX is given by the following equation:
TOTEX = CAPEX + OPEX
where the capital expenditure (CAPEX) is the cost of investment at the initial year and the replacement or addition of some elements of the AC/DC microgrid during its lifetime. Let us consider the cost of AC and DC cables C c a b l e , PV ( C P V ) , BES ( C B E S ), DC/DC charger ( C D C / D C ), bi-directional AC/DC converter ( C A C / D C ), bi-directional inverter ( C i n v e r t e r ), genset or transformer ( C g e n s e t / t r a n s f o ) , and r is the discount rate over the planning period T. The CAPEX is given by Equation (11) with the hypotheses that PVs, lines, genset, and MV/LV transformer have a lifetime equal to or greater than T (30 years), and that batteries have to be replaced every 5 years and converters every 15 years.
C A P E X = C c a b l e + C P V + C g e n s e t / t r a n s f o + C D C / D C + C A C / D C + C i n v e r t e r + C B E S + C D C / D C + C A C / D C + C i n v e r t e r 1 + r 15 + i = 1 5 C B E S 1 + r 5 × i
The operational expenditure (OPEX) is the cost of operating the system and consists of the cost of the energy purchased from the MV grid or from the genset ( E g r i d / g e n s e t ) which includes power losses of the system and O&M costs. The O&M cost ( C m a i n t ) includes the PV, BES, DC/DC charger, bi-AC/DC, and genset. There is no maintenance cost for the MV/LV transformer. Thus, the OPEX is given by the following equation:
O P E X = t = 0 T E g r i d / g e n s e t × C e l e c t / g e n s e t + C m a i n t 1 + r t

4.4.2. LCOE, Autonomous Time and Energy, and CO2 Emissions

The levelized cost of energy (LCOE) is the average cost per kWh of the useful electrical energy produced by the system. The LCOE is the ratio of all discounted costs (the capital cost, fuel cost, and operations and maintenance cost) divided by a discounted sum of the energy amounts delivered to loads, E s e r v e d t . The LCOE is expressed by the following equation [50]:
L C O E = t = 1 T C A P E X t + O P E X t 1 + r t t = 1 T E s e r v e d t 1 + r t
where
E s e r v e d t = h = 1 8760 P l o a d h , t
P l o a d h , t : total power of the load at time h of year t
The autonomy of the microgrids is defined regarding two criteria: (1) the time during which the microgrids can operate without the MV grid if it exists or the genset (autonomous time expressed as a percentage of the year, see Equation (15)); (2) the amount of energy produced locally by the PVs and not provided by the MV grid if it exists (autonomous energy expressed as a percentage of the total energy required by the MV grid, see Equation (16)).
A u t o n o m o u s   t i m e   % = d u r a t i o n   w i t h o u t   p o w e r   f r o m   t h e   g r i d 8760 × 100 %
A u t o n o m o u s   e n e r g y   % = T o t a l   l o c a l   e n e r g y   o v e r   a   y e a r T o t a l   e n e r g y   n e e d e d   o v e r   a   y e a r × 100 %
Finally, the total CO2 emissions of the energy used in the microgrid is provided by Equation (17).
C O 2   e m i s s i o n s   k g / y e a r = i s o u r c e = 1 N s o u r c e s L C C O 2 i r e s o u r c e × E i r e s s o u r c e
where
  • i s o u r c e : index of production type (in this paper 1 for PV, 2 for lithium-ion batteries, 3 for genset et 4 for grid),
  • N s o u r c e is the number of production types (4 in this paper),
  • L C C O 2 i r e s o u r c e is the life-cycle CO2 emissions in kg/kWh for source i s o u r c e [10,11]
  • E i r e s s o u r c e is the total energy produced by source i s o u r c e over one year.

5. Case study

5.1. Description

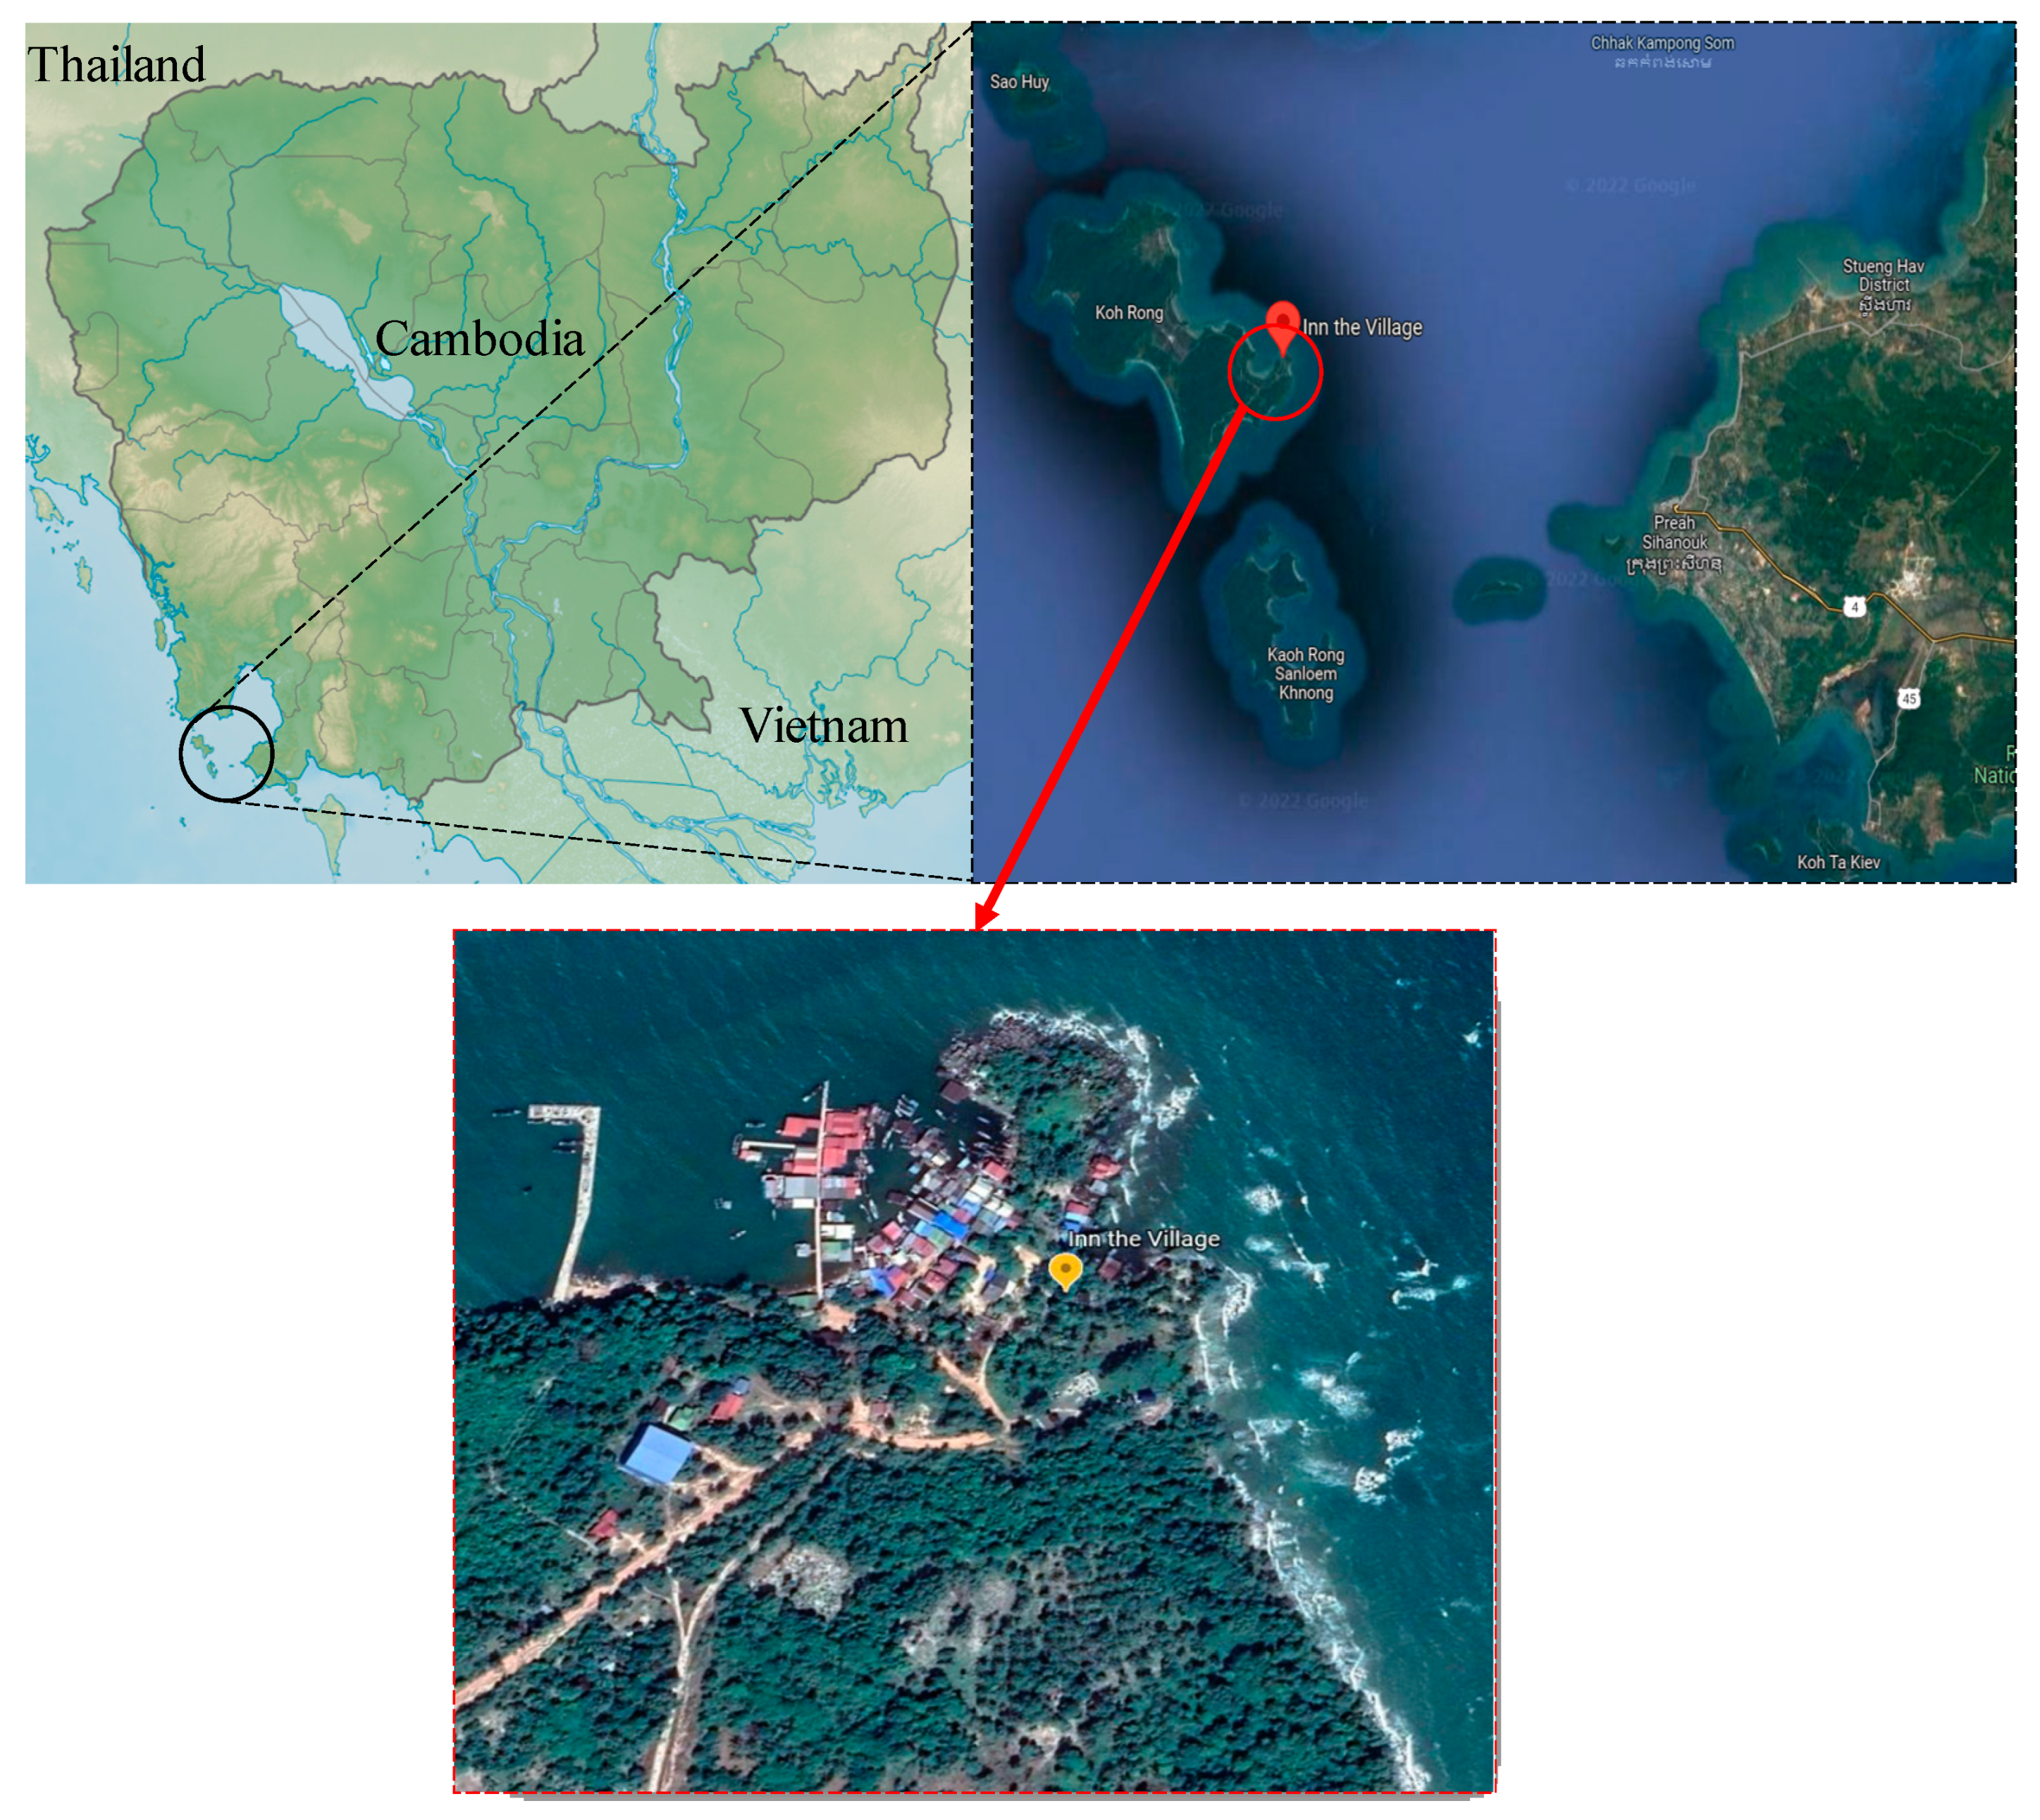
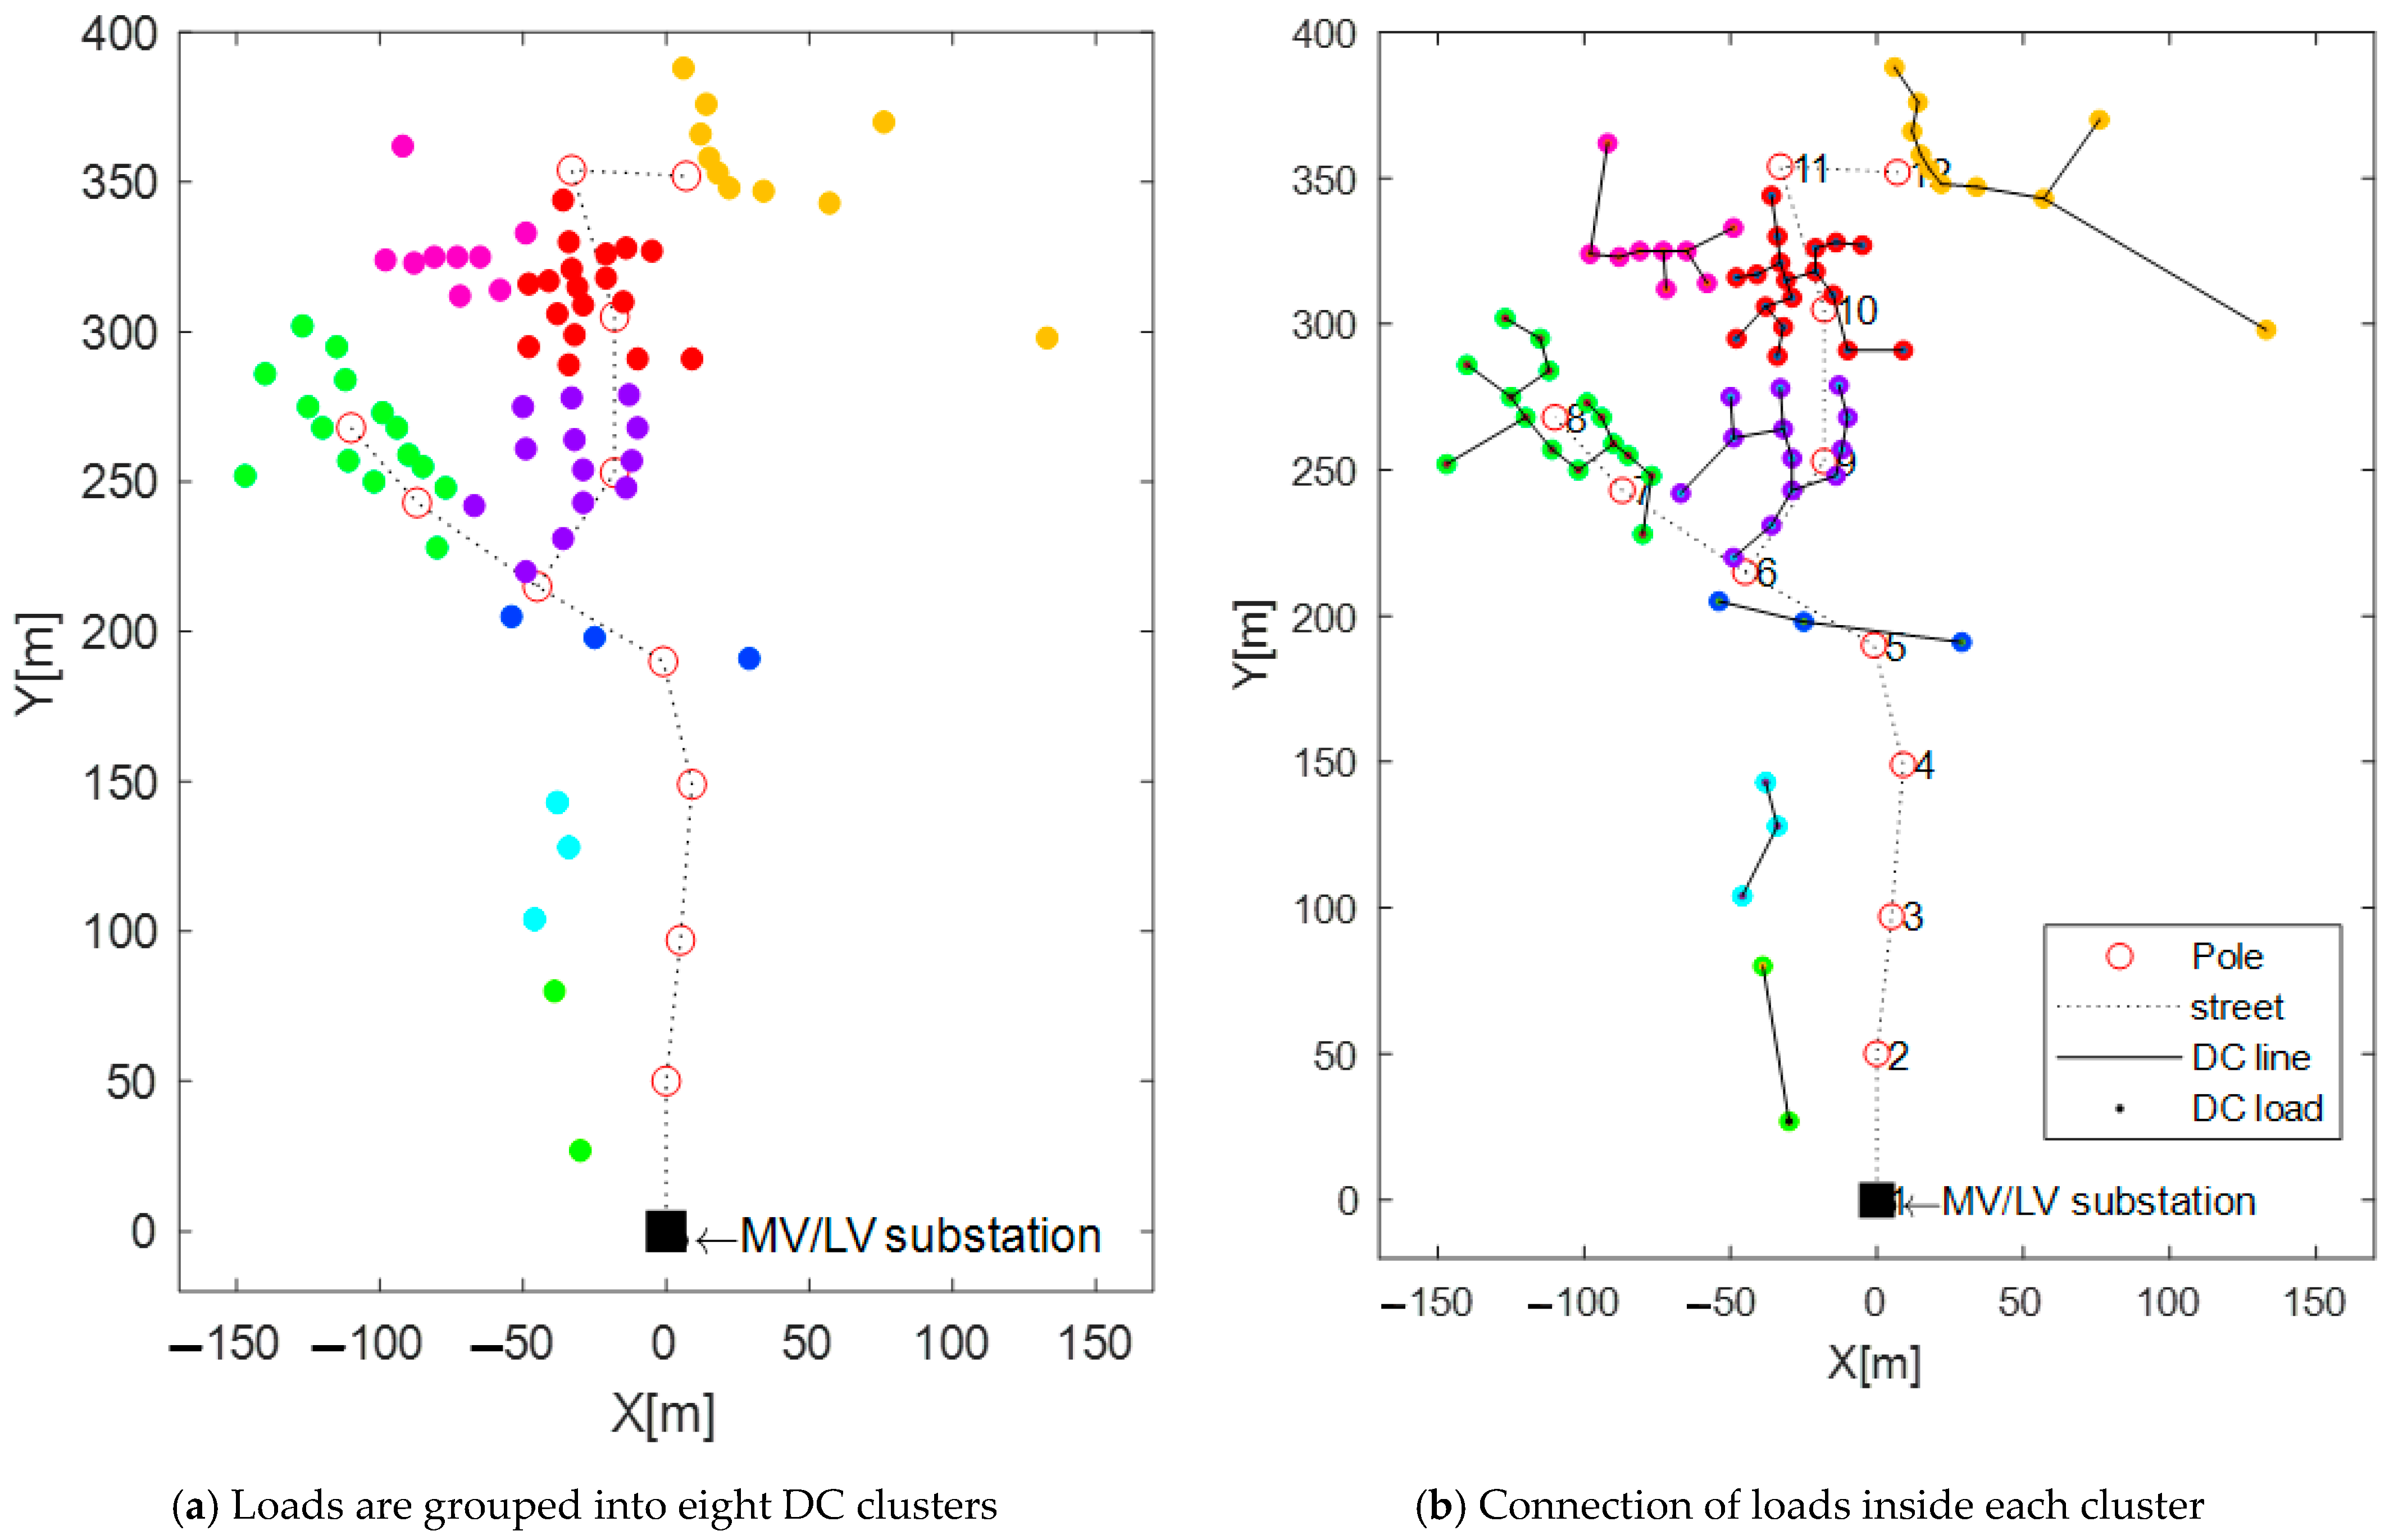
The Inn village located in Sangkat village, Koh Rong island, Preah Sihanouk province, Cambodia shown in Figure 9 was selected as a test case. It is a small fishing village on the southwestern side of the island and is located 20 km from the mainland of Preah Sihanouk city. Some villagers are currently using the diesel generator as a source of electricity and some individually use the solar home system with battery storage. This un-electrified village has 73 households/loads with a total power of 29.52 kW and 12 electrical poles. Figure 10 shows the location of loads and poles located along the road as well as the interconnection point. Detailed information on loads and poles (peak power and coordinates) is provided in Appendix A and Appendix B. The comprehensive planning tool described in the previous section was applied on this test case in order to compare the interest of DC in the LV distribution. The objective is to compare the interest of an AC/DC topology with a full AC structure, with the same cluster structure but optimizing the location and size of PV-deBES systems.

5.2. AC versus AC/DC Microgrids

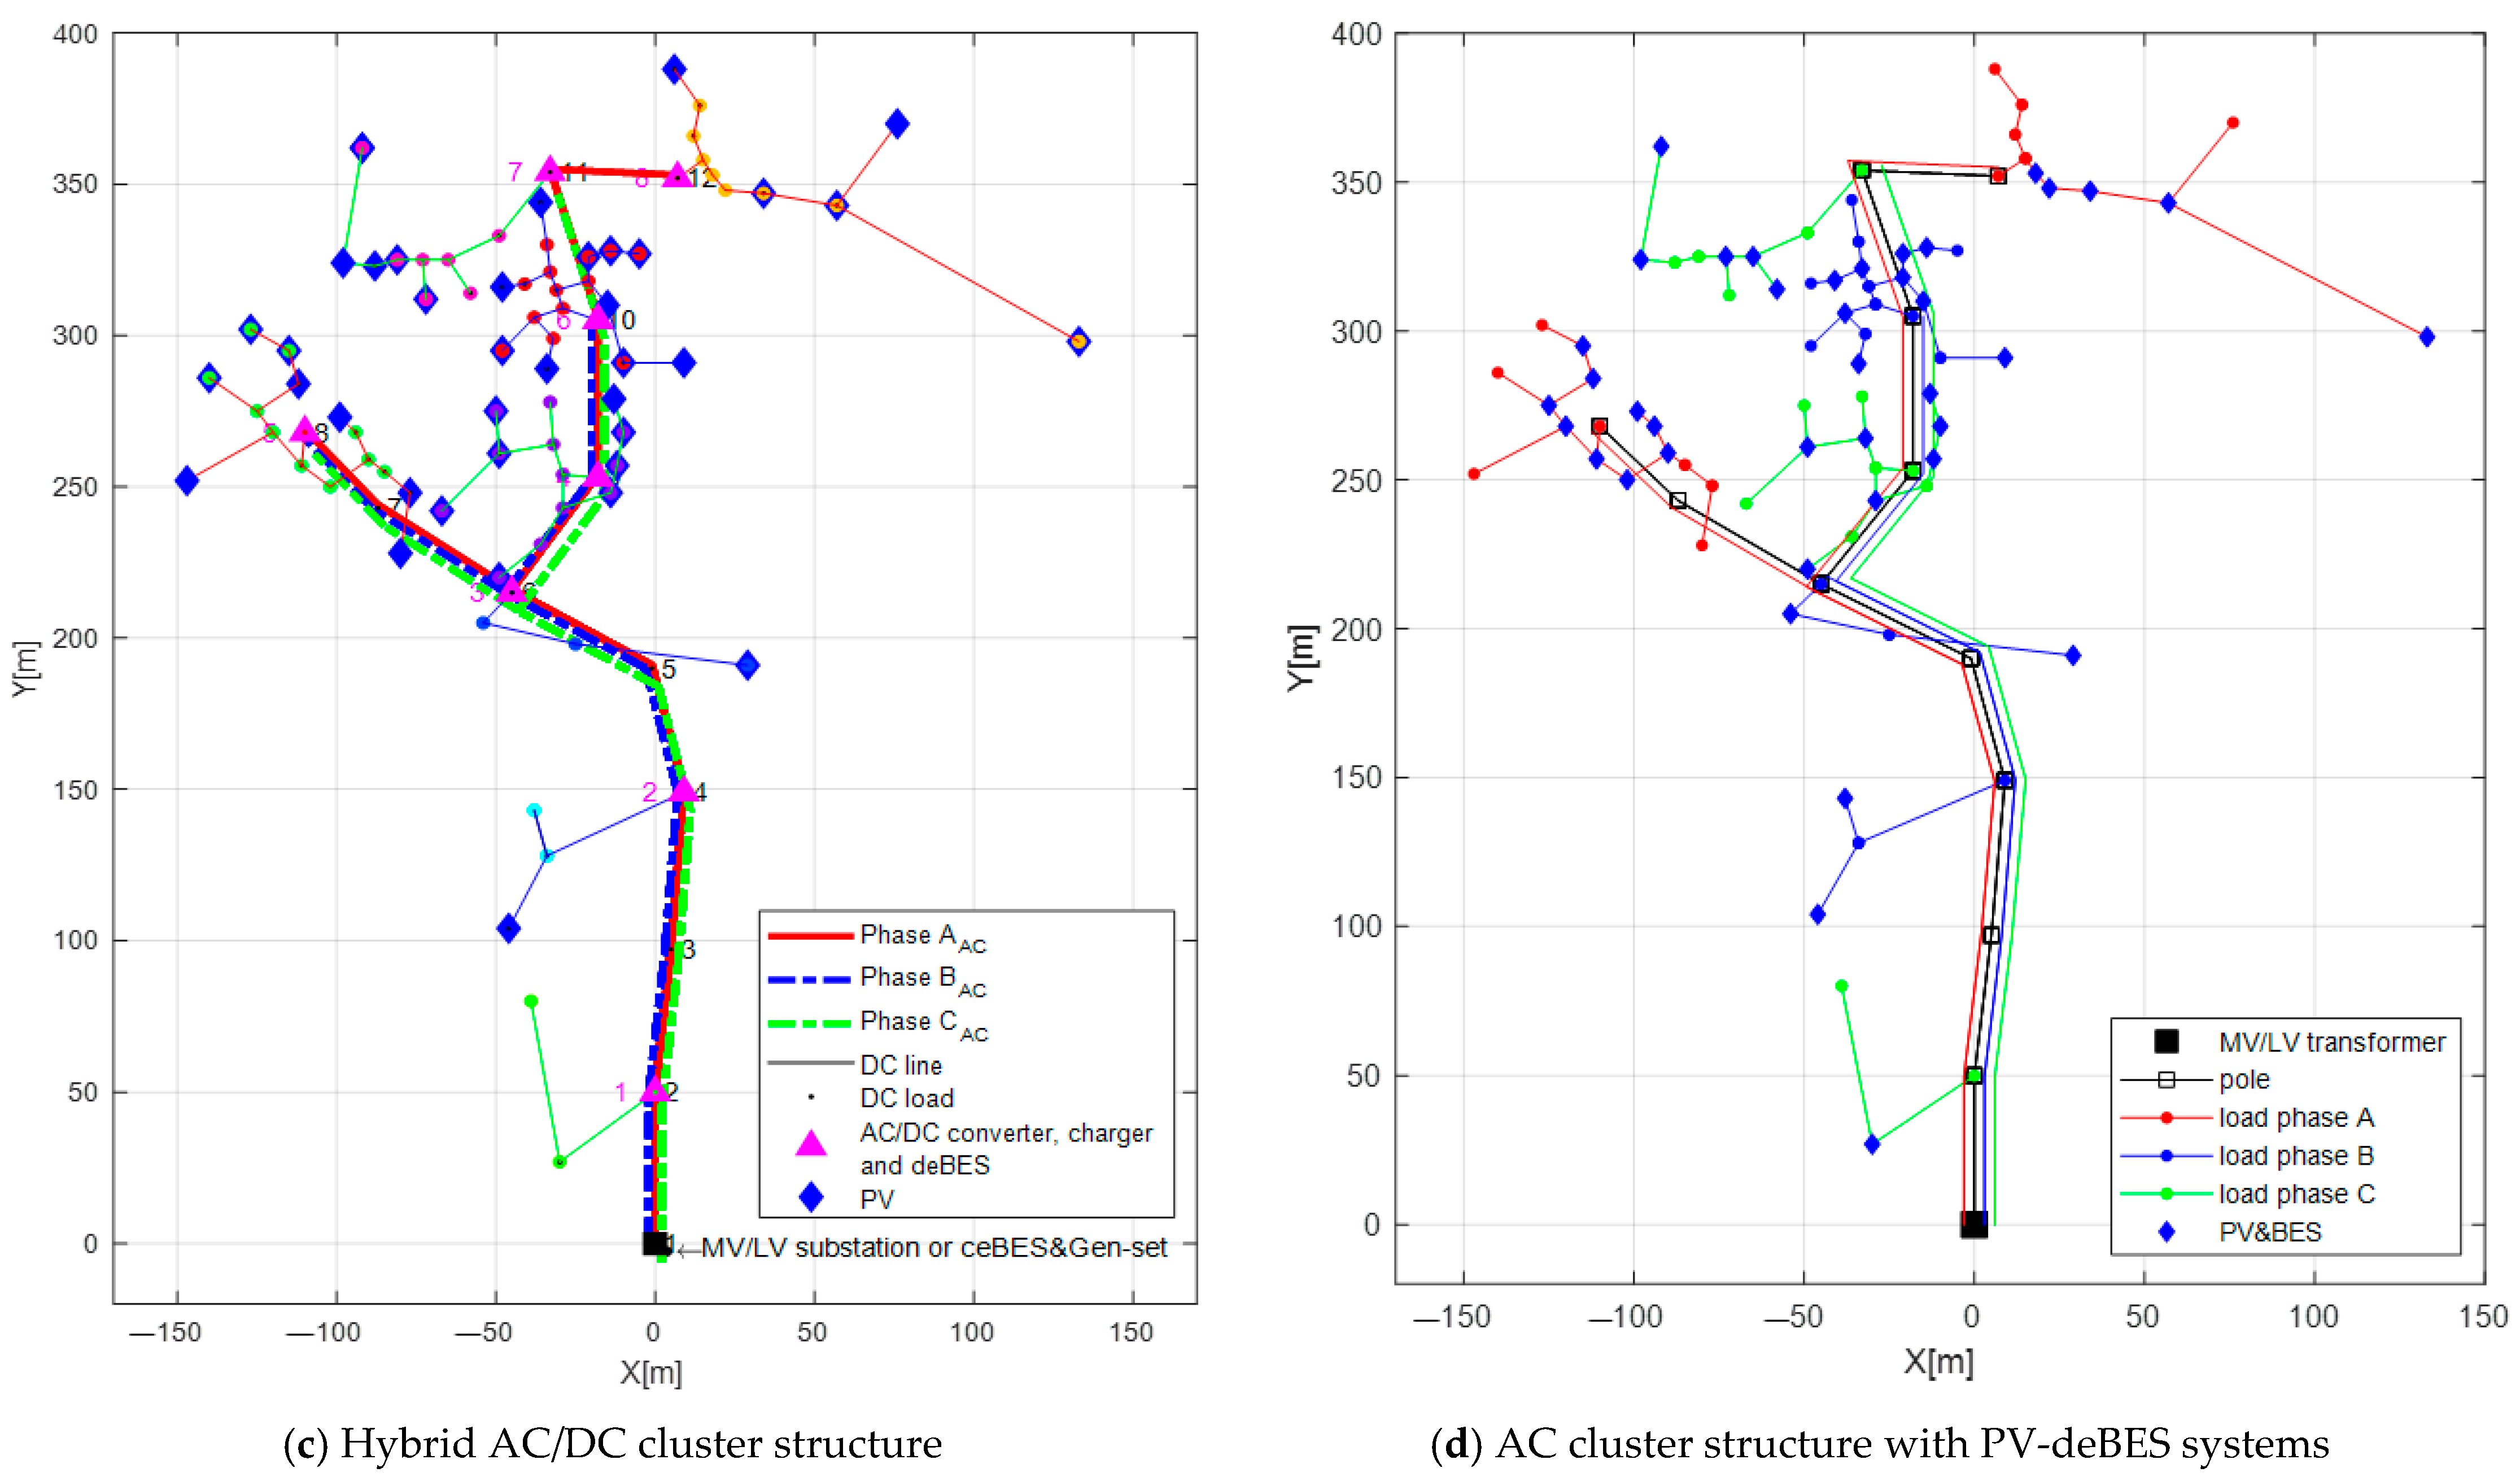
Some steps of the topology optimization are illustrated in Figure 11. Figure 11a shows the eight DC clusters obtained and Figure 11b the connection of DC loads inside each cluster. Figure 11c shows the cluster structure (eight clusters obtained) with the main feeder in AC and secondary feeders (clusters) in DC. The loads belonging to the same cluster are represented by the same color (one color per cluster). In this section, it will be called the hybrid AC/DC microgrid. Figure 11d shows the same topology but all in AC and with single PV-deBES systems. In this section, it will be called the AC microgrid. In both LV networks, the three phases are quite balanced (10.19 kW on phase A, 9.86 kW on phase B and 10.04 kW on phase C).
Table 1 shows the comparison between the AC microgrid and the hybrid AC/DC microgrid for both off-grid and grid-connected modes. For 73 households, the numbers of PVs installed in both cases are quite close (about 50% of houses) with similar installed power per unit. For the hybrid AC/DC microgrid, 7 deBESs and DC/DC chargers were installed among eight clusters. Indeed, one cluster has no PVs because there are only two houses with a total power of 0.65 kW.
Regardless of the mode, for the AC and hybrid AC/DC microgrid, we can notice that, in the full AC, the total power of PVs is about 40% greater than the hybrid AC/DC. This is because, in the AC/DC mode, the objective of the capacity of PVs is based on the energy (the total energy of clusters is less than the total energy of loads). Thus, there is a limitation of PVs while in the full AC microgrid; it depends on the objective that maximizes the local consumption and minimizes the power losses of the system (see PV allocation in Section 4.2.2). The more PV is installed, the more the capacity of deBES is increased (the capacity of deBES of the AC is 126.48 kWh which is greater than the 91.08 kWh of the AC/DC). In this case, there is a need for a ceBES only in the AC microgrid to store the reversed power flow (excess of PVs) which would be injected in the MV grid otherwise. The peak power from the grid/genset is about 0.77 kW (20 times smaller than the one of the AC/DC) due to the large amount of PV installed. Consequently, the energy needed from the grid/genset is reduced. However, the total energy losses are twice because in the AC microgrid, the cross-section of conductor from poles to loads is smaller and there are also more DC/DC chargers.
Regarding the economic aspect, grid connected mode is always the cheapest solution on the condition that the grid is available. For example, in this test case, the island is isolated from the main grid. Considering a mean cost of 100 k$/km to build LV lines, the MV additional CAPEX is about USD 2 million dollars, making this solution impossible.
In general, for both grid-connected and off-grid microgrids, the TOTEX of the AC structure is less expensive because we try to optimize local consumption without any constraints on the location of deBES. Consequently, as there are more deBES in the AC structure, the CAPEX is about 12% higher but the OPEX is almost divided by three compared to the AC/DC structure. Indeed, in the latter structure, this is mostly due to the energy that has to be purchased every year for the use of the genset or the MV grid. Nevertheless, the AC structure does not allow for a gradual electrification without deploying additional solar home systems to supply temporary customers. On the contrary, the AC/DC topology enables us to supply clusters step by step (with a mean CAPEX of 20 k$/cluster) before connecting them all together.
In grid-connected mode, the autonomous energy and time of the AC structure are greater than that of the AC/DC due to the greater capacity of installed PV-deBES. In both cases (AC and AC/DC), the grid-connected mode is more environmentally friendly (CO2 emissions are half the off-grid mode). Indeed, in Cambodia, the energy mix consists of 44% of hydropower, 41% of coal, 8% of fuel oil, 6.36% of solar power, and 0.64% of biomass power [50], and the mean CO2 emissions from electricity are 424 g/kWh [51], while the CO2 emissions generated by a diesel generator are twice that (about 930 g/kWh [52]). The AC structure is also more environmentally friendly compared to the AC/DC one (ratio 10 between off-grid and grid-connected) since the genset is more used in the AC/DC structure.
Figure 12 shows a spider diagram with relevant features and KPIs of the AC and AC/DC microgrids in off-grid mode. It helps to highlight the performances of the AC microgrids for this case study and also the necessary high initial CAPEX required.

5.3. Sensitivity Analysis of the Load Curve

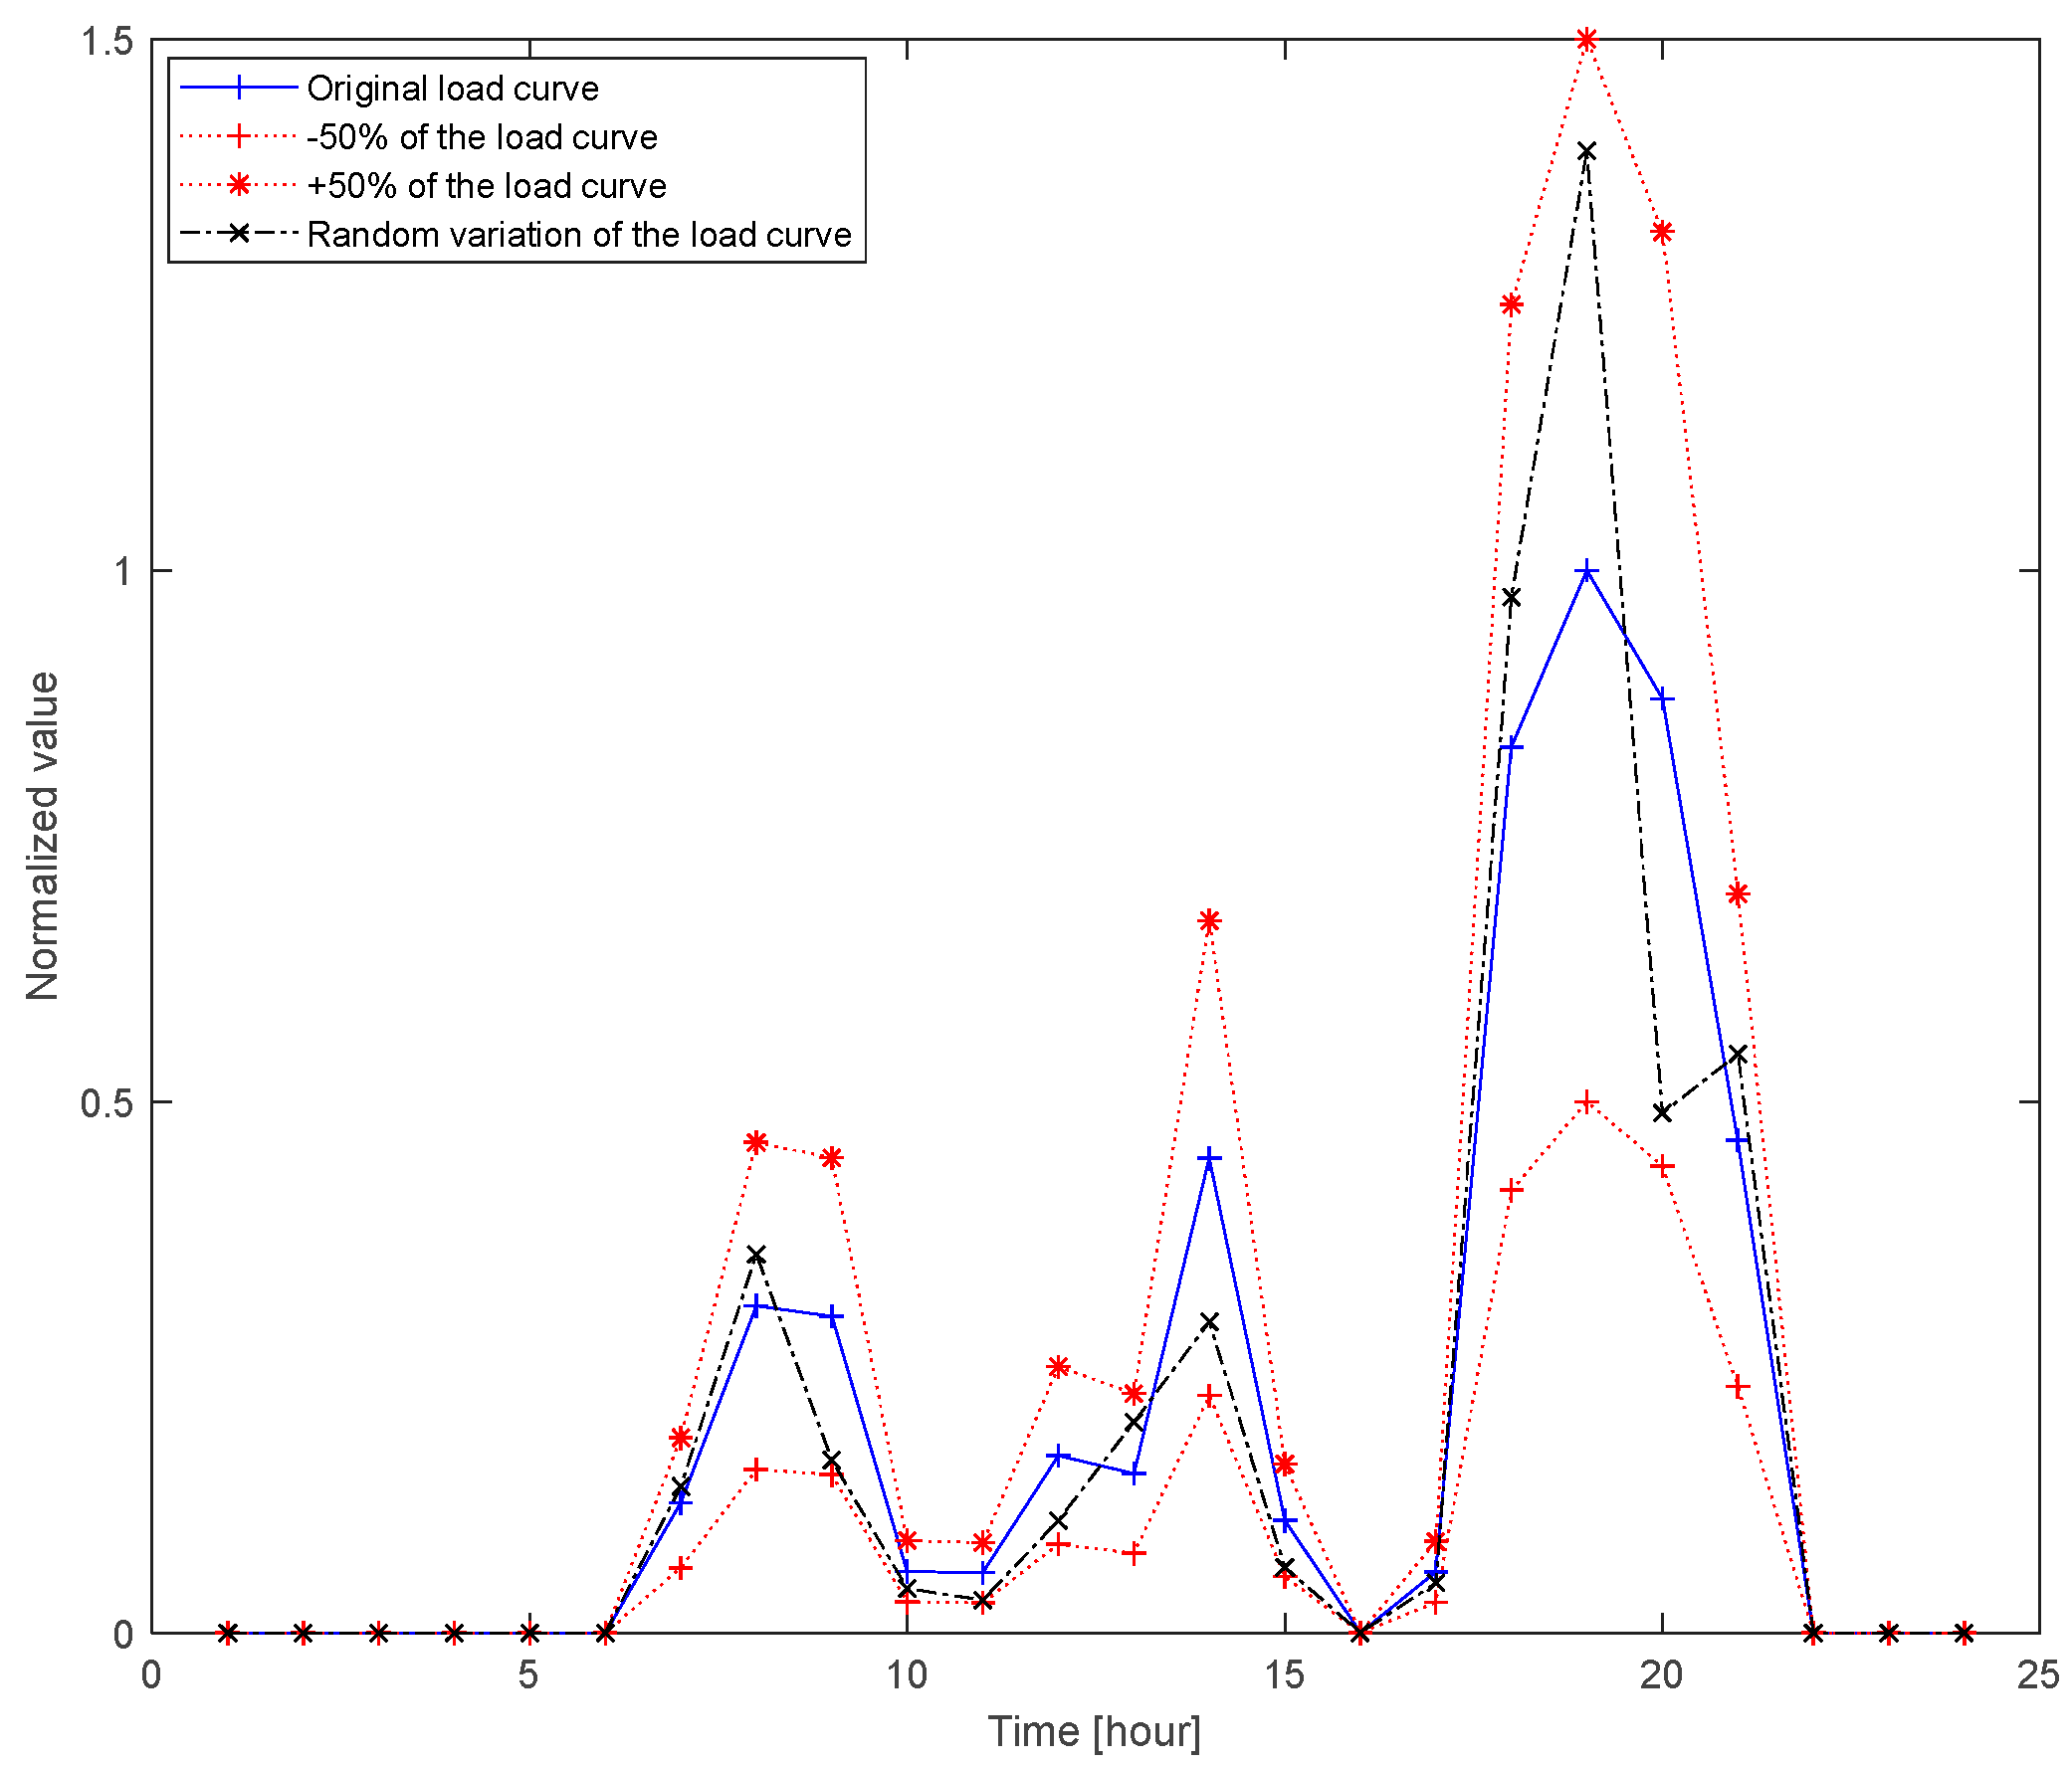
To validate the previous results, a sensitivity study on the load curve was performed to consider the uncertainties related to consumption and to assess how the main features and KPIs depend on the load curve. For this purpose, for each load, 1000 random draws between −50% and +50% of the initial load curve based on Monte-Carlo simulation [53] were made considering that the number and location of PVs and BESs remain the same, as well as the cross-sections of the AC and DC lines. Figure 13 shows the minimum and maximum envelope within which the random hourly load curve is generated for each household and an example of random curve. The values of the power in the interval of [1 h, 6 h] and [22 h, 24 h] are always 0 because no offset was applied when the initial load is equal to zero.
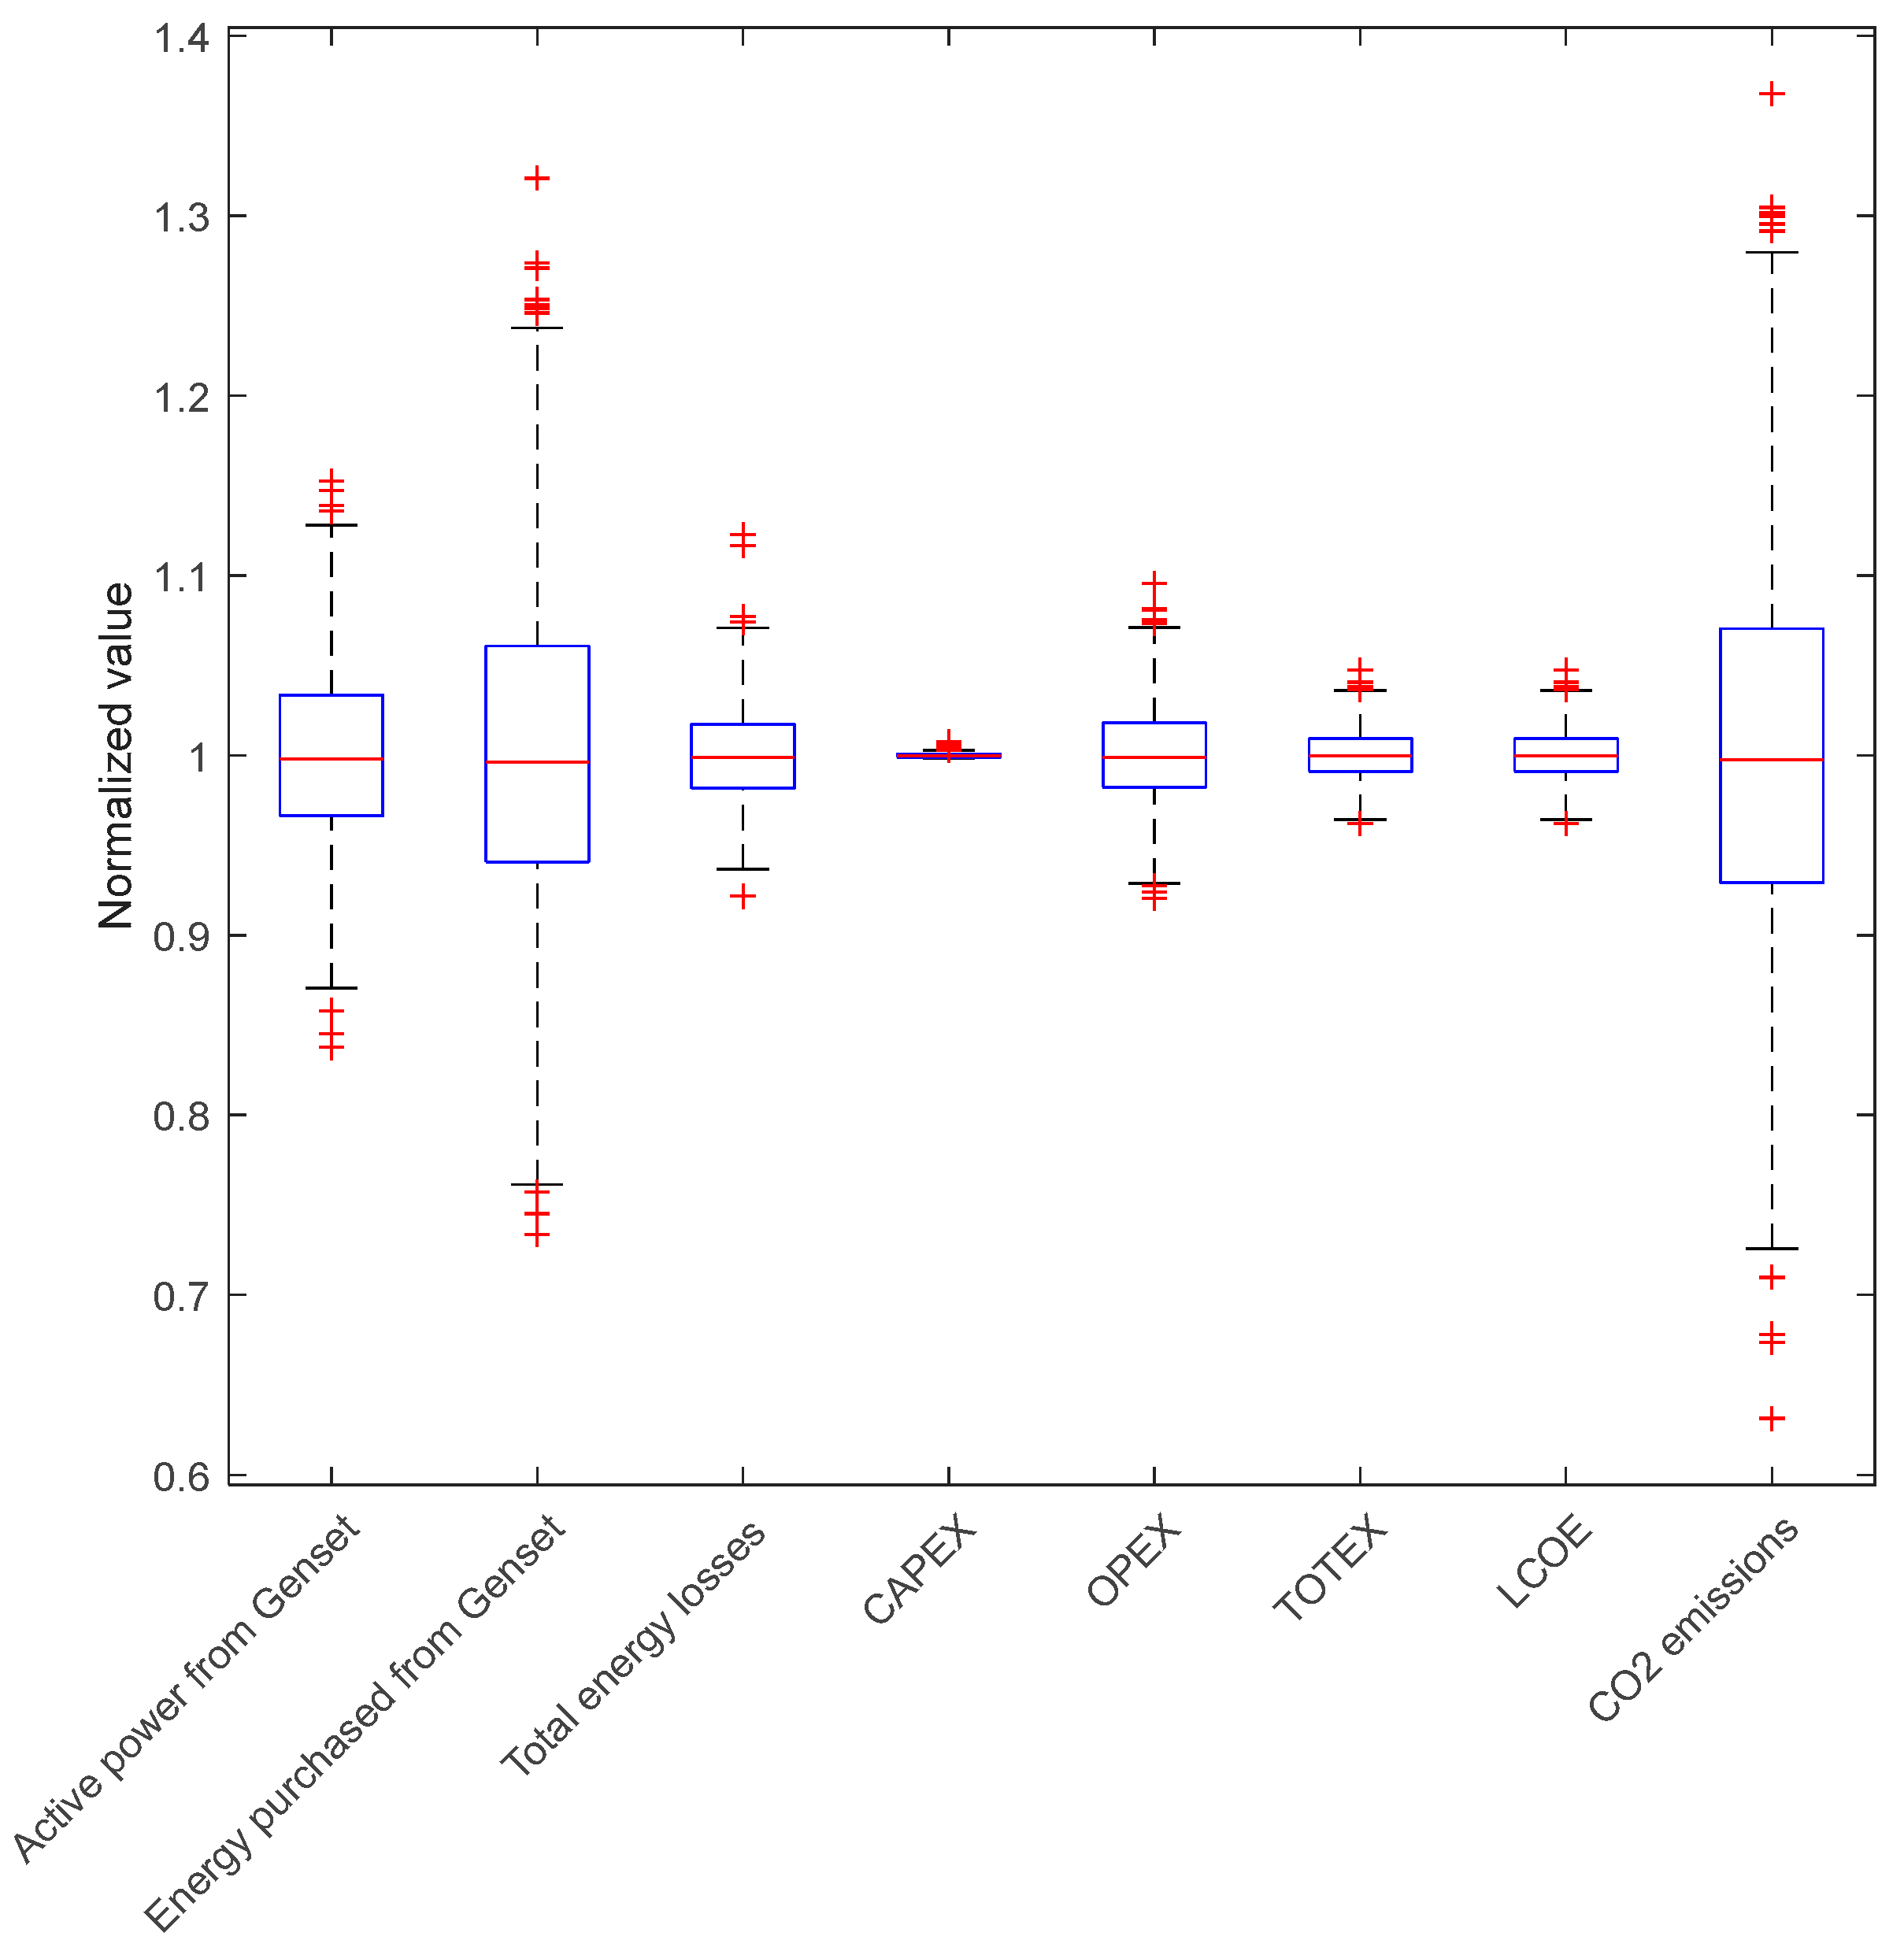
For the sensitivity analysis, we focus only on the hybrid AC/DC microgrid integrated with PV and BES for the “off-grid” mode. As both AC and AC/DC microgrids consist of the same components (batteries, PV, converters, lines, genset), only one test case was considered, namely the AC/DC microgrid. Figure 14 shows the boxplot of each KPI normalized by its mean value among the 1000 draws. The central red mark is the median, and the bottom and top edge of the box indicate the 25th (lower quartile) and 75th percentiles (upper quartile), respectively, while the outliers are represented by the red ‘’+’’ (greater or less than one and a half of the interquartile value (75th–25th)). It can be seen than CAPEX, OPEX, TOTEX, LCOE, and losses are not very sensitive to load variation, whereas the active power and energy purchased from the genset as well as the CO2 emissions are quite sensitive to the load variation.

5.4. Discussion

This section provides an example of application of the proposed microgrid planning tool. Two microgrid structures are compared on a real test case in Cambodia: a cluster structure in AC optimizing the location of PV-deBES systems and a cluster structure in AC/DC with a concept of gradual electrification. The technical and economic comparison between these two structures shows that the grid-connected mode is more economic and environmentally friendly than the off-grid mode considering the energy mix in Cambodia. Nevertheless, as the test case study is an island without MV network and located 20 km from the mainland, the cost of the grid-connection option is prohibitive. The AC microgrid has more economic and eco-friendly benefits than the hybrid AC/DC microgrid since the objective is to maximize local consumption and minimize the power losses of the system. Nevertheless, the TOTEX of AC structure is only 10% lower than that of the AC/DC structure but requires a huge initial CAPEX, which is a real barrier to the electrification process. On the contrary, hybrid AC/DC structure enables a gradual electrification where one could imagine that clusters are built when possible and interconnected in a final stage. In this bottom-up approach, the average CAPEX required would be about 20 k$/cluster.
Other simulations were made to compare the interest of having DC clusters instead of AC clusters considering the same topology of Figure 11c to enable the gradual electrification (same sitting and sizing of PV and BES) but in full AC. In the case of AC clusters, the TOTEX is 10% higher for two main reasons: losses are twice as high (AC lines are in 4 mm2 under 230 V and DC lines are between 16 and 50 mm2 under 50 V) and the four wires-three phases main feeders of the AC are longer. Consequently, the C02 emissions are also worse (50% more) in AC due to the energy losses.

6. Conclusions and Perspectives

This paper proposed a comprehensive LV microgrid planning tool based on four stages: the optimal design of the LV grid, the DERs allocation, the final balancing depending on the connection mode, i.e., grid-connected or off-grid and the evaluation of technical, economic, and environmental KPIs. In order to illustrate the interest of such a model, a case study of an electrified village in an island in Cambodia was selected. The objective was to study the interest of the cluster structure in full AC, optimizing the sitting and sizing of PV-deBES and the AC/DC microgrids. The main conclusions drawn are that the grid-connected option in Cambodia is the best one in terms of costs and CO2 emissions. If possible, i.e., the MV connection costs are low, this solution has to be preferred. Considering optimally located and sized PV-deBES systems leads to the best performances but requires a high initial CAPEX. If the latter is not available, a top-down approach has to be preferred. The hybrid AC/DC microgrid is a good compromise since DC clusters can be gradually built at a reasonable cost and then be interconnected. These conclusions are not general and depend on many parameters such as the energy mix of the country, the load density, the renewable resources among others, which justifies the interest of having such kind of tool for electrification projects. This article helps fill the gap around AC/DC microgrid planning, integrating both grid design and resource siting and sizing. The future work will incorporate reliability indicators such as SAIDI (System Average Interruption Duration Index) and SAIFI (System Average Interruption Frequency Index). Additionally, it could be interesting to study the integration of other renewable energies such as small-scale biomass and pico-hydropower plants.

Author Contributions

Conceptualization and methodology, K.K., M.-C.A.-H. and B.R.; Software, K.K. and C.C.; Validation, K.K., B.R., M.-C.A.-H. and V.V.; Investigation, L.B.; Writing—original draft preparation, K.K.; writing—review and editing, M.-C.A.-H., B.R., V.V. and K.K.; Supervision, B.R., M.-C.A.-H., V.V. and L.B.; Project administration, L.B. and B.R. All authors have read and agreed to the published version of the manuscript.

Funding

This research was co-funded by the Bourses du Gouvernement Français (BGF) and the Ministry of Education, Youth and Sport (MoEYS) of Cambodia. Additionally, thanks to the financial support under the Higher Education Improvement Project—HEIP (Credit No.6221-KH) at the Institute of Technology of Cambodia (ITC).

Institutional Review Board Statement

Not applicable.

Informed Consent Statement

Not applicable.

Data Availability Statement

Not applicable.

Acknowledgments

The authors would like to thank the Ambassade de France au Cambodge and Campus France for coordinating the travel and stay in Grenoble, France.

Conflicts of Interest

The authors declare no conflict of interest.

Appendix A

Table A1. Load specification of the case study.
No.CoordinateP (kW)No.CoordinateP (kW)No.CoordinateP (kW)No.CoordinateP (kW)
Xn (m)Yn (m)Xn (m)Yn (m)Xn (m)Yn (m)Xn (m)Yn (m)
1−30270.29620−1122840.37439−483160.42258−153100.361
2−39800.36021−992730.39740−413170.46459−213180.382
3−461040.42022−942680.31741−313150.41160−213260.332
4−341280.36523−902590.43342−333210.43461−53270.347
5−381430.37624−852550.43143−723120.43762−143280.454
6291910.37225−772480.38944−983240.2926392910.451
7−251980.39926−672420.49945−883230.3696463880.469
8−542050.39827−292430.45346−813250.44565143760.372
9−492200.44328−292540.42047−733250.44666123660.389
10−362310.48929−492610.40548−653250.38167153580.494
11−802280.42130−322640.45949−493330.33368183530.357
12−1022500.39031−502750.38950−343300.37169223480.426
13−1112570.45532−332780.43451−363440.43570343470.359
14−1202680.43433−342890.42852−923620.41471573430.439
15−1472520.38534−482950.44453−142480.42372763700.358
16−1252750.41535−322990.40854−122570.332731332980.410
17−1402860.41736−383060.44455−102680.477
18−1273020.36137−293090.42356−132790.412
19−1152950.35538−583140.39357−102910.336

Appendix B

Table A2. Coordinates of electrical poles of the case study.
No.CoordinateNo.Coordinate
Xn (m)Yn (m)Xn (m)Yn (m)
1007−87243
20508−110268
35979−18253
4914910−18305
5−119011−33354
6−45215127352

References

  1. Ourworldindata. Access to Energy. 2022. Available online: https://ourworldindata.org/energy-access#access-to-electricity (accessed on 22 August 2022).
  2. WorldBank. Access to Electricity for Rural Areas. 2022. Available online: https://data.worldbank.org/indicator/eg.elc.accs.ru.zs (accessed on 22 August 2022).
  3. Electricity Authority of Cambodia. Salient Features of Power Development in the Kingdom of Cambodia. 2022. Available online: https://www.eac.gov.kh/site/index?lang=en (accessed on 31 December 2022).
  4. Mackay, L. Steps Towards the Universal Direct Current Distribution System. Ph.D. Thesis, Delft University of Technology, Delft, The Netherlands, 2018. [Google Scholar]
  5. Vai, V.; Alvarez-Herault, M.-C.; Raison, B.; Bun, L. Optimal low-voltage distribution topology with integration of PV and storage for rural electrification in developing countries: A case study of Cambodia. J. Mod. Power Syst. Clean Energy 2020, 8, 531–539. [Google Scholar] [CrossRef]
  6. Vai, V.; Bun, L.; Khon, K.; Alvarez-Herault, M.C.; Raison, B. Integrated PV and Battery Energy Storage in LVAC for a Rural Village: A Case Study of Cambodia. In Proceedings of the IECON 2020 The 46th Annual Conference of the IEEE Industrial Electronics Society, Singapore, 18–21 October 2020; pp. 1602–1607. [Google Scholar] [CrossRef]
  7. Vai, V.; Eng, S. Study of Grid-Connected PV System for a Low Voltage Distribution System: A Case Study of Cambodia. Energies 2022, 15, 5003. [Google Scholar] [CrossRef]
  8. Chhlonh, C.; Alvarez-Herault, M.C.; Vai, V.; Raison, B. Comparative Planning of LVAC for Microgrid Topologies With PV-Storage in Rural Areas—Cases Study in Cambodia. In Proceedings of the 2022 IEEE PES Innovative Smart Grid Technologies Conference Europe, Novi Sad, Serbia, 10–12 October 2022; pp. 1–5. [Google Scholar] [CrossRef]
  9. Nandini, K.K.; Jayalakshmi, N.S.; Jadoun, V.K. An overview of DC Microgrid with DC distribution system for DC loads. Mater. Today Proc. 2021, 51, 635–639. [Google Scholar] [CrossRef]
  10. Montoya, O.D.; Gil-González, W.; Grisales-Noreña, L.F. Solar Photovoltaic Integration in Monopolar DC Networks via the GNDO Algorithm. Algorithms 2022, 15, 277. [Google Scholar] [CrossRef]
  11. Basto-Gil, J.D.; Maldonado-Cardenas, A.D.; Montoya, O.D. Optimal Selection and Integration of Batteries and Renewable Generators in DC Distribution Systems through a Mixed-Integer Convex Formulation. Electronics 2022, 11, 3139. [Google Scholar] [CrossRef]
  12. Grisales-Noreña, L.F.; Ocampo-Toro, J.A.; Rosales-Muñoz, A.A.; Cortes-Caicedo, B.; Montoya, O.D. An Energy Management System for PV Sources in Standalone and Connected DC Networks Considering Economic, Technical, and Environmental Indices. Sustainability 2022, 14, 16429. [Google Scholar] [CrossRef]
  13. Grisales-noreña, L.F.; Cortés-caicedo, B.; Alcalá, G.; Montoya, O.D. Applying the Crow Search Algorithm for the Optimal Integration of PV Generation Units in DC Networks. Mathematics 2023, 11, 387. [Google Scholar] [CrossRef]
  14. Samende, C.; Bhagavathy, S.M.; McCulloch, M. Power Loss Minimization of Off-Grid Solar DC Nano-Grids—Part I: Centralized Control Algorithm. IEEE Trans. Smart Grid 2021, 12, 4715–4725. [Google Scholar] [CrossRef]
  15. Samende, C.; Bhagavathy, S.M.; McCulloch, M. Power Loss Minimisation of Off-Grid Solar DC Nano-Grids—Part II: A Quasi-Consensus-Based Distributed Control Algorithm. IEEE Trans. Smart Grid 2022, 13, 38–46. [Google Scholar] [CrossRef]
  16. Kumar, P.; Pal, N.; Sharma, H. Optimization and techno-economic analysis of a solar photo-voltaic/biomass/diesel/battery hybrid off-grid power generation system for rural remote electrification in eastern India. Energy 2022, 247, 123560. [Google Scholar] [CrossRef]
  17. Krishan, O.; Suhag, S. Techno-economic analysis of a hybrid renewable energy system for an energy poor rural community. J. Energy Storage 2019, 23, 305–319. [Google Scholar] [CrossRef]
  18. Sari, A.; Majdi, A.; Opulencia, M.J.C.; Timoshin, A.; Huy, D.T.N.; Trung, N.D.; Alsaikhan, F.; Hammid, A.T.; Akhmedov, A. New optimized configuration for a hybrid PV/diesel/battery system based on coyote optimization algorithm: A case study for Hotan county. Energy Rep. 2022, 8, 15480–15492. [Google Scholar] [CrossRef]
  19. Khanahmadi, A.; Ghaffarpour, R. A cost-effective and emission-Aware hybrid system considering uncertainty: A case study in a remote area. Renew. Energy 2022, 201, 977–992. [Google Scholar] [CrossRef]
  20. Rehman, S.; Natrajan, N.; Mohandes, M.; Alhems, L.M.; Himri, Y.; Allouhi, A. Feasibility Study of Hybrid Power Systems for Remote Dwellings in Tamil Nadu, India. IEEE Access 2020, 8, 143881–143890. [Google Scholar] [CrossRef]
  21. Oladigbolu, J.O.; Ramli, M.A.M.; Al-Turki, Y.A. Feasibility study and comparative analysis of hybrid renewable power system for off-grid rural electrification in a typical remote village located in Nigeria. IEEE Access 2020, 8, 171643–171663. [Google Scholar] [CrossRef]
  22. Tsai, C.T.; Ocampo, E.M.; Beza, T.M.; Kuo, C.C. Techno-economic and sizing analysis of battery energy storage system for behind-the-meter application. IEEE Access 2020, 8, 203734–203746. [Google Scholar] [CrossRef]
  23. Iqbal, S.; Jan, M.U.; Rehman, A.U.; Rehman, A.U.; Shafique, A.; Rehman, H.U.; Aurangzeb, M. Feasibility Study and Deployment of Solar Photovoltaic System to Enhance Energy Economics of King Abdullah Campus, University of Azad Jammu and Kashmir Muzaffarabad, AJK Pakistan. IEEE Access 2022, 10, 5440–5455. [Google Scholar] [CrossRef]
  24. Das, B.K.; Alotaibi, M.A.; Das, P.; Islam, M.S.; Das, S.K.; Hossain, M.A. Feasibility and techno-economic analysis of stand-alone and grid-connected PV/Wind/Diesel/Batt hybrid energy system: A case study. Energy Strateg. Rev. 2021, 37, 100673. [Google Scholar] [CrossRef]
  25. Amupolo, A.; Nambundunga, S.; Chowdhury, D.S.P.; Grün, G. Techno-Economic Feasibility of Off-Grid Renewable Energy Electrification Schemes: A Case Study of an Informal Settlement in Namibia. Energies 2022, 15, 4235. [Google Scholar] [CrossRef]
  26. Odou, O.D.T.; Bhandari, R.; Adamou, R. Hybrid off-grid renewable power system for sustainable rural electrification in Benin. Renew. Energy 2020, 145, 1266–1279. [Google Scholar] [CrossRef]
  27. Shrivastwa, R.R.; Hably, A.; Melizi, K.; Bacha, S. Understanding microgrids and their future trends. In Proceedings of the 2019 IEEE International Conference on Industrial Technology (ICIT), Melbourne, Australia, 13–15 February 2019; pp. 1723–1728. [Google Scholar] [CrossRef]
  28. Justo, J.J.; Mwasilu, F.; Lee, J.; Jung, J.W. AC-microgrids versus DC-microgrids with distributed energy resources: A review. Renew. Sustain. Energy Rev. 2013, 24, 387–405. [Google Scholar] [CrossRef]
  29. Garces, A. Uniqueness of the power flow solutions in low voltage direct current grids. Electr. Power Syst. Res. 2017, 151, 149–153. [Google Scholar] [CrossRef]
  30. Montoya, O.D.; Grisales-Noreña, L.F.; González-Montoya, D.; Ramos-Paja, C.A.; Garces, A. Linear power flow formulation for low-voltage DC power grids. Electr. Power Syst. Res. 2018, 163, 375–381. [Google Scholar] [CrossRef]
  31. Rodriguez-Diaz, E.; Savaghebi, M.; Vasquez, J.C.; Guerrero, J.M. An overview of low voltage DC distribution systems for residential applications. In Proceedings of the 2015 IEEE International Conference on Consumer Electronics—Berlin, Berlin, Germany, 6–9 September 2015; pp. 318–322. [Google Scholar] [CrossRef]
  32. Okra. Okra Mini-Grid. Available online: https://okrasolar.com/project/steung-chrov/ (accessed on 31 August 2022).
  33. Richard, L.; Boudinet, C.; Ranaivoson, S.A.; Rabarivao, J.O.; Befeno, A.E.; Frey, D.; Alvarez-Hérault, M.-C.; Raison, B.; Saincy, N. Development of a DC Microgrid with Decentralized Production and Storage: From the Lab to Field Deployment in Rural Africa. Energies 2022, 15, 6727. [Google Scholar] [CrossRef]
  34. Unamuno, E.; Barrena, J.A. Hybrid ac/dc microgrids—Part I: Review and classification of topologies. Renew. Sustain. Energy Rev. 2015, 52, 1251–1259. [Google Scholar] [CrossRef]
  35. Radwan, A.A.A.; Mohamed, Y.A.R.I. Networked control and power management of AC/DC hybrid microgrids. IEEE Syst. J. 2017, 11, 1662–1673. [Google Scholar] [CrossRef]
  36. Rajkumar, A. A Novel Solar PV Equipped Flexible AC/DC Microgrid Based Energy Management for Effective Residential Power Distribution Une nouvelle gestion del’énergie basée sur un micro-réseau flexible CA/CC équipé de panneaux solaires photovoltaïques pour une d. IEEE Can. J. Electr. Comput. Eng. 2022, 45, 328–338. [Google Scholar] [CrossRef]
  37. Xu, Q.; Zhao, T.; Xu, Y.; Xu, Z.; Wang, P.; Blaabjerg, F. A Distributed and Robust Energy Management System for Networked Hybrid AC/DC Microgrids. IEEE Trans. Smart Grid 2020, 11, 3496–3508. [Google Scholar] [CrossRef]
  38. Yang, P.; Yu, M.; Wu, Q.; Wang, P.; Xia, Y.; Wei, W. Decentralized Economic Operation Control for Hybrid AC/DC Microgrid. IEEE Trans. Sustain. Energy 2020, 11, 1898–1910. [Google Scholar] [CrossRef]
  39. Lin, P.; Jin, C.; Xiao, J.; Li, X.; Shi, D.; Tang, Y.; Wang, P. A distributed control architecture for global system economic operation in autonomous hybrid AC/DC microgrids. IEEE Trans. Smart Grid 2019, 10, 2603–2617. [Google Scholar] [CrossRef]
  40. Xia, Y.; Wei, W.; Yu, M.; Wang, X.; Peng, Y. Power Management for a Hybrid AC/DC Microgrid with Multiple Subgrids. IEEE Trans. Power Electron. 2018, 33, 3520–3533. [Google Scholar] [CrossRef]
  41. Vai, V. Planning of Low Voltage Distribution System with Integration of PV Sources and Storage Means—Case of Power System of Cambodia. Ph.D. Thesis, University Grenoble Alpes, Grenoble, France, 2017. [Google Scholar]
  42. Ross, D.T.; Schoman, K.E. Structured Analysis for Requirements Definition. IEEE Trans. Softw. Eng. 1977, 3, 6–15. [Google Scholar] [CrossRef]
  43. Khon, K.; Vai, V.; Alvarez-Herault, M.-C.; Bun, L.; Bertrand, R. Planning of low voltage AC/DC microgrid for un-electrified areas. In Proceedings of the CIRED 2021, the 26th International Conference and Exhibition on Electricity Distribution, Geneva, Switzerland, 20–23 September 2021; pp. 1–5. [Google Scholar] [CrossRef]
  44. Kruskal, J.B. On the Shortest Spanning Subtree of a Graph and the Traveling Salesman Problem. Source Proc. Am. Math. Soc. 1956, 7, 48–50. [Google Scholar] [CrossRef]
  45. Vai, V.; Alvarez-Hérault, M.C.; Bun, L.; Raison, B. Design of LVAC distribution system with PV and centralized battery energy storage integration-a case study of Cambodia. ASEAN Eng. J. 2019, 9, 1–16. [Google Scholar] [CrossRef]
  46. Rajabi, A.; Eskandari, M.; Ghadi, M.J.; Li, L.; Zhang, J.; Siano, P. A comparative study of clustering techniques for electrical load pattern segmentation. Renew. Sustain. Energy Rev. 2019, 120, 109628. [Google Scholar] [CrossRef]
  47. Delgado, H.; Anguera, X.; Fredouille, C.; Serrano, J. Novel Clustering Selection Criterion for Fast Binary Key Speaker Diarization. In Proceedings of the Interspeech 2015, the 16th Annual Conference of the International Speech Communication Association, Dresden, Germany, 6–10 September 2015; pp. 3091–3095. [Google Scholar] [CrossRef]
  48. Dijkstra, E.-W. A note on two problems in connexion with graphs. Numer. Math. 1959, 1, 269–271. [Google Scholar] [CrossRef]
  49. Ciric, R.M.; Feltrin, A.P.; Ochoa, L.F. Power Flow in Four-Wire Distribution Networks—General Approach. IEEE Trans. Power Syst. 2003, 18, 1283–1290. [Google Scholar] [CrossRef]
  50. Habib, H.U.R.; Waqar, A.; Junejo, A.K.; Elmorshedy, M.F.; Wang, S.; Buker, M.S.; Akindeji, K.T.; Kang, J.; Kim, Y.-S. Optimal planning and EMS design of PV based standalone rural microgrids. IEEE Access 2021, 9, 32908–32930. [Google Scholar] [CrossRef]
  51. Our World in Data. CO2 Intensity of Electricity 2021. 2022. Available online: https://ourworldindata.org/grapher/carbon-intensity-electricity (accessed on 8 June 2022).
  52. Jufri, F.H.; Aryani, D.R.; Garniwa, I.; Sudiarto, B. Optimal battery energy storage dispatch strategy for small-scale isolated hybrid renewable energy system with different load profile patterns. Energies 2021, 14, 3139. [Google Scholar] [CrossRef]
  53. Harrison, R.L. Introduction to Monte Carlo simulation. In Proceedings of the 2008 Winter Simulation Conference, Miami, FL, USA, 7–10 December 2008; pp. 91–100. [Google Scholar] [CrossRef] [Green Version]
Figure 1. Typical AC/DC microgrid structure inspired by [34].
Sustainability 15 02841 g001
Figure 2. Completely isolated hybrid AC/DC microgrid configuration inspired by [34].
Sustainability 15 02841 g002
Figure 3. Microgrid planning tool description using SADT approach.
Sustainability 15 02841 g003
Figure 4. Tree topology (left figure) and cluster topology (right figure).
Sustainability 15 02841 g004
Figure 5. Global planning algorithm based on tree structure (left) and cluster structure (right).
Sustainability 15 02841 g005
Figure 6. Cluster structures case of AC distribution (left figure) and AC/DC distribution (right figure).
Sustainability 15 02841 g006
Figure 7. PV removal procedure.
Sustainability 15 02841 g007
Figure 8. Yearly ceBES schedule algorithm.
Sustainability 15 02841 g008
Figure 9. Inn the village, Koh Rong Island, Preah Sihanouk, Cambodia (10°42′43.1″ N 103°18′36.7″ E).
Sustainability 15 02841 g009
Figure 10. Input data: electrical poles and loads of the test case.
Sustainability 15 02841 g010
Figure 11. Radial topology of microgrids integrated with PV and deBES.
Sustainability 15 02841 g011aSustainability 15 02841 g011b
Figure 12. Comparison between an AC and hybrid AC/DC microgrids for “off-grid” mode.
Sustainability 15 02841 g012
Figure 13. Variation of a load curve with an interval (−50%, +50%) of the initial load curve.
Sustainability 15 02841 g013
Figure 14. Sensitivity analysis of the KPIs using the boxplot for the hybrid AC/DC microgrid integrated with PV and BES for the “off-grid” mode.
Sustainability 15 02841 g014
Table 1. Comparison between a full AC and hybrid AC/DC microgrids for both modes.
ACHybrid AC/DC
Parameters“Grid-Connected”“Off-Grid”“Grid-Connected”“Off-Grid”
Total load peak power (kW)29.5229.52
Number of PVs4038
Number of deBESs407
Number of DC/DC chargers417
Number of bi-directional AC/DC converters18
P P V m a x (kW)/unit0.570.43
Total P d e B E S of the system (kW)40.230.09
Total C d e B E S of the system (kWh)126.4891.84
Total P D C / D C charger of the system (kW)40.230.09
Total P A C / D C of the system (kW)40.215.52
C c e B E S (kWh)0.0750
P i n v e r t e r _ C e B E S (kW)1.350
Active peak power from the grid/genset (kW)0.7714.80
Energy purchased from the grid/genset (MWh/year)1.0510.25
Total energy losses (MWh/year)9.634.15
CAPEX (k$)179.03181.53152.64161.14
OPEX (k$)20.6823.868.45191.08
TOTEX (k$)199.71205.34221.09352.22
LCOE ($/kWh) 0.25510.26080.28090.4475
Autonomous time (%/year)54.1610037.50100
Autonomous energy (%/year)98.2110080.90100
CO2 emissions (kg/year)44597643449529
Disclaimer/Publisher’s Note: The statements, opinions and data contained in all publications are solely those of the individual author(s) and contributor(s) and not of MDPI and/or the editor(s). MDPI and/or the editor(s) disclaim responsibility for any injury to people or property resulting from any ideas, methods, instructions or products referred to in the content.