Article

Research on the Dynamic Coupling and Coordination of Science and Technology Innovation and Sustainable Development in Anhui Province

School of Economics and Management, Anhui University of Science and Technology, Huainan 232001, China
*
Authors to whom correspondence should be addressed.
Sustainability 2023, 15(4), 2874; https://doi.org/10.3390/su15042874
Submission received: 22 January 2023 / Revised: 29 January 2023 / Accepted: 2 February 2023 / Published: 5 February 2023
(This article belongs to the Special Issue Urban Innovation and Sustainability)

Abstract

:
The coupling of and coordination between science and technology innovation (STI) and sustainable development (SD) is a basic requirement for Anhui Province’s economic high-quality development. According to panel data of 16 prefecture-level cities in Anhui Province from 2010 to 2021, the entropy method was applied to quantify the comprehensive development level of the two systems. The models of coupling coordination degree, grey GM (1, 1), and ARIMA prediction were constructed to analyze the spatiotemporal dynamic evolution features of the two systems’ coupling coordination. In the time series, the two systems’ comprehensive development showed a steady increase, a high level of coupling, and an increasing overall trend of coupling coordination. Moreover, the two systems’ coupling and coordination levels show the gradient spatial differentiation characteristics of “central > east > west.” The prediction shows that the two systems’ coupling coordination degree exhibits a monotonic increasing trend and reaches the optimal coupling coordination state around 2030. This study provides a decision-making reference for the implementation of the innovation-driven development strategy of Anhui Province.

1. Introduction

Climate change and development are two major challenges facing the world [1]. sustainable development (SD) was first introduced in the 1980s. In the report “Our Common Future,” the World Commission on Environment and Development defined SD as “a development that addresses the demands of the present without endangering the demands of future generations” [2]. With the launch of “2030 Agenda for Sustainable Development,” SD has become the future development goal of all countries. China’s economy has reached a new normal, changing from a phase of high rapid growth to a phase of high qualitative development [3]. As a major global greenhouse gas emitter, achieving SD in China is an important issue [4]. As early as 1994, the Chinese government incorporated an SD strategy into a long-range plan for China’s economic and social development. In 2016, they released the “National Innovation-driven Development Strategy Outline,” which clearly proposed the shift from a factor-driven to an innovation-driven economy and the implementation of an innovation-driven development strategy. The relationship between science and technology innovation (STI) and SD has become an important element of theoretical SD systems.
Anhui Province plays an important role in the Yangtze River Delta, which is a new region of growth for both internal and external markets but shows a trade-off relationship between basic needs and SD goals [5]. In the past decades, urbanization and urban expansion in Anhui Province has been promoted, leading to problems such as environmental pollution and resource shortages [6], which seriously hinder SD. Over the past few years, Anhui has placed great value on the construction of STI, encouraging local initiatives in innovation development, actively cultivating innovative cities, and introducing working guidelines. An STI-biased economic development environment will continuously derive new SD needs. However, the derived SD needs will further guide STI direction, making SD a new undertone of STI activities [7]. Whether the driving force of STI to SD is insufficient or the guidance of SD for STI is weak, blockage of either pathway will stall the coordinated development of both.
Existing studies on the coordinated development of systems yielded some results. Sun et al. evaluated the coupled coordination level between digital inclusive finance and STI in China [8]. Yin et al. analyzed the degree of coupled coordination of the triple system of environmental regulation-STI-green development in Shandong province [9]. Wang et al. studied the coupled and coordinated development of marine STI systems and ecological economic systems [10]. Shang and Liu explored the space-time patterns of coupled and coordinated urbanization and green development in Chinese coastal cities [11]. However, no scholars have yet conducted a dynamic coupled coordination study on STI and SD in Anhui Province. What is the coupling and coordination degree between STI and SD in Anhui Province? How can we achieve a higher level of integrating and promoting the two systems? This information is of strategic importance in promoting the coordination and SD of the Anhui Province’s regional economy. Therefore, it is especially important to scientifically evaluate the degree of coupling and coordination between STI and SD and predict future coupling trends in Anhui Province.
Worldwide, the intrinsic link between STI and SD has been studied from different research perspectives, which are mainly based on two main lines. On one hand, the implications of STI on SD have been studied. Pandey et al. found that cooperation and innovation in technology can help developing countries achieve SD goals [12]. Su et al. used BRICS countries as an example and found that information technology has an active impact on environmental quality and can reduce carbon dioxide emissions, thus achieving SD [13]. Mousavi et al. argued that innovation is an important tool for firms to achieve SD and that their organizational and managerial capabilities play an important role in the sustainable innovation process [14]. Arico explored the contribution of STI to SD from the empirical perspective of UNESCO [15]. Liao et al. picked data from Chinese-listed A-share companies and confirmed the significant contribution of green technology innovation to the sustainability capability of enterprises [16]. Yang argued that active eco-technological innovation is beneficial for improving the competitiveness of SMEs and achieving SD [17]. Jaeger-Erben et al. combined real-life cases to determine the significant influence of innovation on SD [18]. Scholars have generally confirmed the important impact of STI on the economic development of a society and the transformation of production methods [19].
However, STI is a double-edged sword. Although it promotes technological progress, it may also trigger major environmental pollution problems and hinder SD [20]. The goal of profit maximization can trigger firms to focus more on saving labor and capital factors in technological innovation, thus neglecting the damage to the ecological environment and natural resources. For example, to increase agricultural output, chemical fertilizers and pesticides are used extensively, which directly leads to the destruction of water resources and eutrophication of rivers and lakes [21]. In addition, STI can lead to energy rebound effects, resulting in the increased consumption of overall energy and the increased emission of pollutants. The rapid expansion of the total output is accompanied by an increase in pollutant emissions, which, to some extent, counteracts the reduction in emissions per unit of output accomplished with STI and increases total pollution [22]. Most of the literature suggests that an innovation-centered approach is effective in addressing SD issues [23]. SD models are likely to replace traditional models, and innovation is often key to transformation success [24]. It is evident that STI needs the right leadership to achieve the goal of SD.
On the other hand, the SD model can influence innovation. SD goals can attract national, regional, and firm-independent innovations based on demand [25,26,27,28]. Yuan and Zhang demonstrated a significant positive relationship between industrial SD and STI using the sys-GMM method [29]. Mai et al. empirically found a significant reversed “U-shaped” relationship between corporate SD and innovation [30]. Ashford and Hall argued that SD can stimulate revolutionary STI through the environment, safety, health, labor market, and other related factors [31]. SD goals drive the STI process.
In general, there are still some gaps in the study on the relationship between STI and SD. Most studies focus on the national macro level and the micro level of industry enterprises but rarely involve the provincial level. Most studies pay attention to basic theories and the one-way influence between them but lack the holistic system thinking about STI and SD, and there is limited mention of the two systems’ coupling and coordination. There is also limited mention of coordinated research on the two systems. In view of this, the entropy method was used in this study to measure the combined development level of STI and SD in 16 provincial municipalities in Anhui from 2010 to 2021 based on the theory of coordinated development. Furthermore, we constructed the models of coupled coordination degree, grey GM (1, 1), and ARIMA prediction to explore the time trend and spatial characteristics of the two systems’ coupled and coordinated development. This will provide a theoretical basis and policy reference for actively promoting sustainable regional development and accelerating the economic structure transformation and upgrading of Anhui Province.

2. Materials and Methods

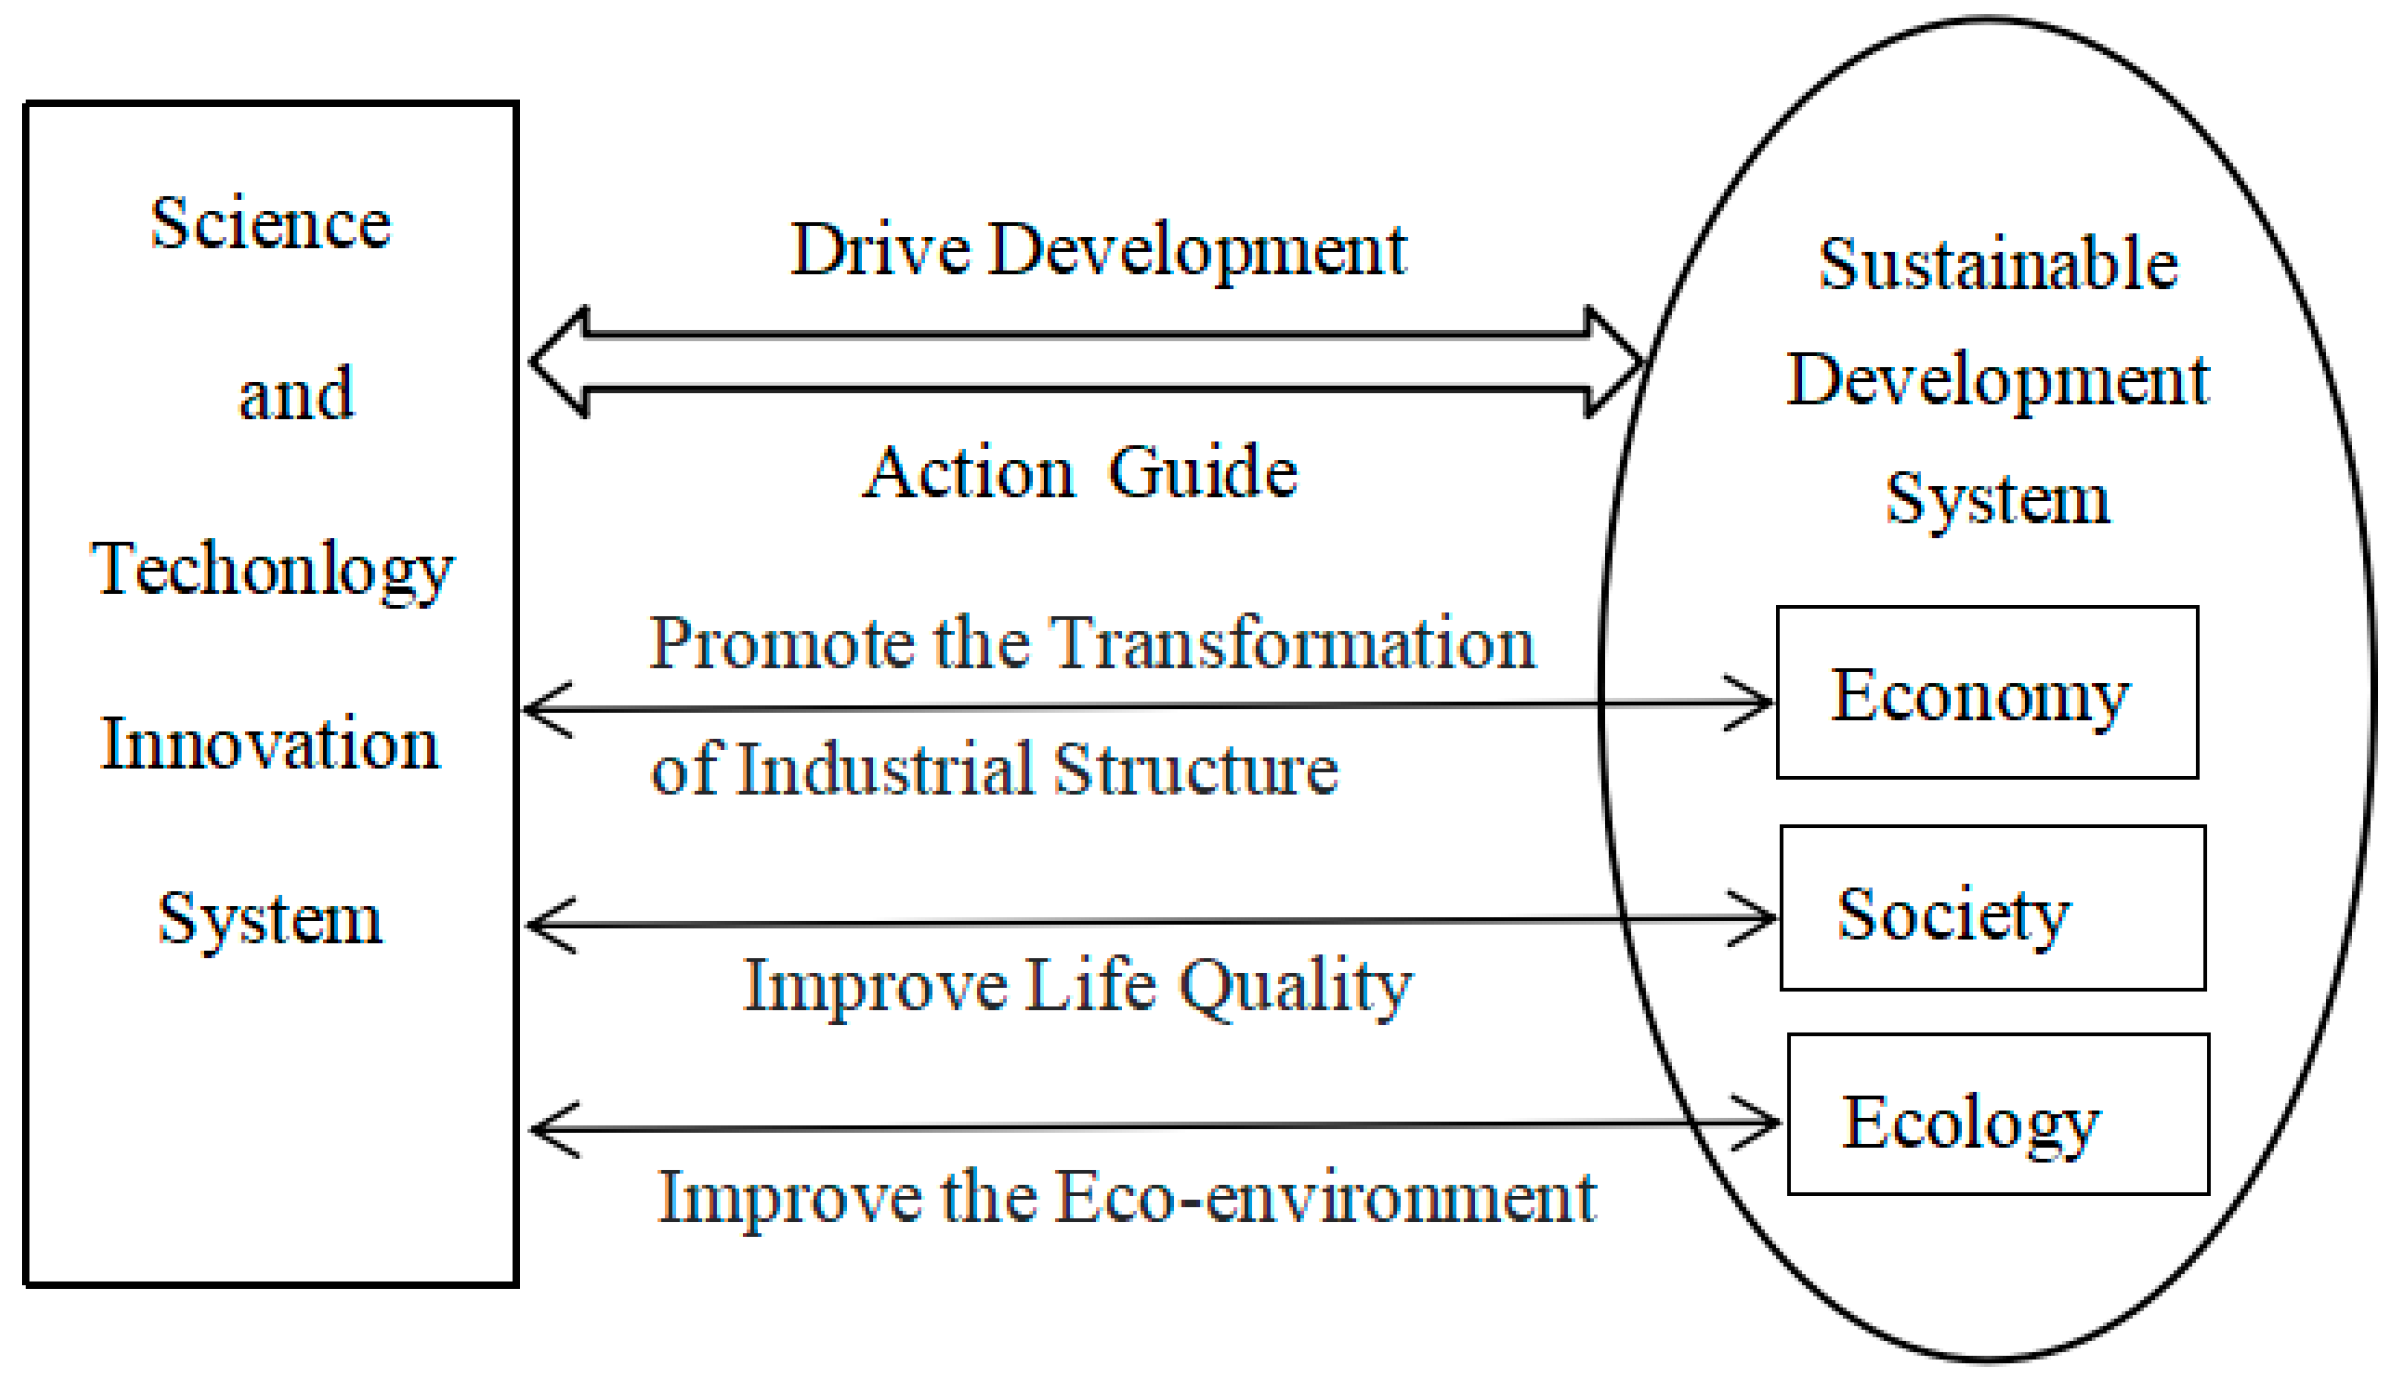
2.1. The Coupling Mechanism of STI and SD

As shown in Figure 1, STI and SD have a natural interactive coupling relationship, and they are mutually dependent and promote each other. STI is the key engine of SD, and SD can lead to STI. Both are derived from human needs and practices and are centered on development and innovation to achieve synergy in mutual interaction.
The achievement of SD goals requires the participation of the government, economy, society, culture, environment, education, and S&T. STI is a crucial and core driver of SD. The regional SD system covers three dimensions: the economy, society, and ecology [32]. The achievement of SD goals in any dimension cannot be achieved without STI support. In the economic dimension, STI is the fundamental impetus for the regional economics to achieve high-quality development, and it plays a significant role in the transformation of territorial economic growth patterns. In the face of traditional natural resource difficulties such as depletion and non-renewability, STI can effectively improve industrial production efficiency, reduce resource waste, and even replace traditional resource elements, transforming and upgrading regional industrial structures. In the social dimension, STI in transportation, education, medicine, and other fields promotes the quality of life of people and the sustainable development of society. In the ecological dimension, the environment directly affects people’s surroundings. To prevent environmental pollution and restore the ecological environment, STI is indispensable.
Moreover, the history of human development shows that STI is a double-edged sword that has caused ecological damage and environmental pollution while enhancing social development. Therefore, STI requires grounding in SD theory. The purpose of SD is not only to solve the environmental problems created by social progress, but more importantly, to shape the scientific concept of development and regulate and constrain the direction and mission of STI. Accordingly, SD will become an action guide for STI. All aspects of STI activities require SD to provide guarantees. Sustainable economic development provides R&D funds for STI, while sustainable social and environmental development provides intellectual support, good institutional environment, and a market for the application of STI results.

2.2. Constructing the Index System

STI and SD have multi-dimensional and multi-hierarchical complex coordination relationships. Therefore, to comprehensively reveal the degree of the two systems’ coupling and coordination, a comprehensive evaluation of two systems’ index system was established according to the principles of science and feasibility (as shown in Table 1). First, STI is an important foundation for achieving SD, and it has central role in the city’s development by adjusting inputs and outputs to achieve optimal resource allocation [33]. Drawing on previous research [34,35,36,37], this study selected seven indicators to measure the degree of STI development: the number of invention patents owned by 10,000 people, proportion of R&D expenditure to GDP, turnover of technology contracts, value added of high technology industries as a percentage of GDP, full-time equivalent of R&D personnel, number of S&T papers published by industrial enterprises, and proportion of education expenditure to GDP. Second, referring to related research by Zhu et al. and considering the holistic and systematic nature of cities, this study established a comprehensive and diversified SD assessment system with three dimensions: economic development, social harmony, and environmental resources [32,38,39]. At present, China’s economy is in a pivotal period, shifting from a phase of high growth to a phase of high-quality development [40]. SD must comply with economic laws, build on the strengths of each region, promote the circulation in the market, and achieve coordinated regional development. In this study, four indicators, including GDP per capita, local fiscal revenue per capita, fixed asset investment per capita, and the urban registered unemployment rate, were selected to measure the economic development of 16 cities in Anhui Province in SD. Furthermore, social harmony is a key factor affecting SD, which provides solid human capital, a good institutional environment, and a market for the transformation of achievements in sustainable urban development and STI, thus continuously improving well-being. In this study, four indicators were selected for assessment: number of health personnel per 10,000 people, number of criminal cases per 10,000 people, illiteracy rate, and number of years of education per capita. Finally, balancing resource utilization and environmental protection is the goal of SD, and high-quality development in Anhui Province should adhere to ecological priorities and green development. In the context of “grasping big protection and not big exploitation,” ecological protection is an important policy for implementing SD in the region, and it is especially important to clarify the relationship between urban environment and SD. In this study, four indicators were selected for evaluation: sulfur dioxide emissions per billion GDP, the comprehensive utilization rate of general industrial solid waste, the number of days with air quality better than Grade 2, and green space per capita.

2.3. Research Methodology

2.3.1. Entropy Method

Determining the indicator weights using modern mathematical evaluation systems is the key to research. The scientific nature and rationality of the indicator weights affect the accuracy and reliability of the results. Compared with subjective assignment methods, such as expert scoring and hierarchical analysis, the entropy method, first introduced by the American mathematician C.E. Shannon, is an objective assignment method that only depends on the discreteness of the data [41,42]. It measures information uncertainty according to the magnitude of information entropy. To make the results more objective and accurate, the entropy method was used to assign objective weights to each index as follows:
  • Data normalization
To solve the problem of different units of measurement for each indicator, dimensionless normalization is required. Data shifting of 0.001 is performed to eliminate the effect of zeros.
For positive indicators:
x i j = 0.999 x i j min { x 1 j , x n j } max { x 1 j , x n j } min { x 1 j , x n j } + 0.001 ,
For negative indicators:
x i j = 0.999 max { x 1 j , x n j } x i j max { x 1 j , x n j } min { x 1 j , x n j } + 0.001 ,
where x i j ( i = 1 , 2 , 3 , , n ; j = 1 , 2 , 3 , , m ) indicates the value of the j th index of the i th evaluation object.
  • Calculation of the weight P i j of the i th object to be evaluated on the j th evaluation index:
    P i j = x i j i = 1 n x i j ( j = 1 , 2 , 3 , , m ) ,
  • Calculation of information entropy e i of the j th indicator:
    e j = A i = 1 n p i j ln p i j ,
    where, A = 1 / ln ( n ) , satisfy e > 0 .
  • Calculation of information entropy redundancy:
    r j = 1 e j ,
  • Calculation of the weight of each indicator:
    w i j = r j j = 1 m r ,
  • Calculation the overall development degree of the i th-evaluated object.
    U i = j = 1 m w j x i j .

2.3.2. The Model of Coupling Coordination Degree

The term “coupling” originates from physics and refers to the phenomenon of two or more systems or elements interacting and influencing each other [43], which has been applied in the field of economics. The coupling degree is a measure of the intensity of the association between systems; the larger the coupling degree, the stronger the degree of association and dependence between systems [44]. The coupling coordination degree based on this model can better reflect the synergy between systems [45].
  • The conventional coupling degree model is described as follows [46]:
    C = 2 [ U a U b ( U a + U b ) 2 ] 1 2 ,
    where U a represents the STI system, and U b represents the SD system; α , β are coefficients to be determined based on the interlinkage between the two systems. The two systems are considered equally important and given the same weight, thus α = β = 0.5 . C is the coupling degree of the STI and SD systems and takes the value between [0, 1]. When C = 0 , the two systems are in disorder. When C = 1 , the two systems are in a fully ordered state.
The coupling-degree model can only illustrate the strength of the interaction between the systems; therefore, reflecting the overall synergistic effect of the two systems is challenging. Considering that the U a and SD system U b may yield pseudo-evaluation results if they take small values, the coupling coordination model is built using the principle of deviation based on the coupling degree to accurately evaluate the coupling coordination of the STI and SD systems.
  • The traditional model of coupling coordination is as follows:
    D = C × T   ,
    T = α U a + β U b ,   α + β = 1 ,
    where D is the coupling coordination degree of the STI and SD systems, which takes a value between [0, 1], and T is the overall development level of the two systems.
Owing to the inherent setting problem of the traditional coupling degree formula, which concentrates the C value at one end of 1, the calculated D value depends largely on the T value (development degree of each system), which leads to weakened coordination between the systems and ultimately, the D value may not adequately measure the coupling coordination degree. Therefore, the model has been improved in this study.
  • The improved coupling degree model and the coupling coordination degree model are:
C = [ 1 ( U b U a ) 2 ] × U a U b = [ 1 ( U b U a ) ] × U a U b ,
D = C × T ,
T = α U a + β U b ,   α + β = 1 ,
  • The classification of grade of the coupling and coupling coordination level:
To better analyze the level of coupling and coupling coordination between systems, this study used a quartering method [47]. The criteria are shown in Table 2.

2.3.3. GM (1, 1) Model

The GM (1, 1) model generally weakens the randomness and fluctuation of the original data by sequentially accumulating the original series [48], and its abbreviation GM for Grey Model; (1, 1) denotes an equation of order 1 with one variable. It is suitable for time series forecasting of localized samples and uncertain information and has the advantage that the prediction results are more stable and not limited to the size of the known data. GM (1, 1) modeling is as follows:
Step 1: Determine the original nonnegative variable data series (smooth series).
Z ( 0 ) ( k ) = [ Z ( 0 ) ( 1 ) , Z ( 0 ) ( 2 ) , Z ( 0 ) ( 3 ) , , Z ( 0 ) ( n ) ] ,
Step 2: Make first-order accumulation to generate sequence data:
Z ( 1 ) ( k ) = [ Z ( 1 ) ( 1 ) , Z ( 1 ) ( 2 ) , Z ( 1 ) ( 3 ) , , Z ( 1 ) ( n ) ] ,
where Z ( 1 ) ( k ) = i = 1 k Z ( 0 ) ( i ) , k = 1 , 2 , , n .
If the sequence Z ( 1 ) ( k ) has a quasi-exponential law, then the sequence Z ( 1 ) ( k ) satisfies the following first-order linear differential equation model:
d Z ( 1 ) d t + a Z ( 1 ) = u ,
where a is the developmental grey number, which reflects the trend of the cumulative data series Z ( 1 ) and the original data Z ( 0 ) . u is the endogenous control grey number, which reflects the change in the relationship between the data.
Step 3: Determine the data matrix B , Y n .
B = [ X ( 1 ) ( 2 ) 1 X ( 1 ) ( 3 ) 1 X ( 1 ) ( 4 ) 1 X ( 1 ) ( n ) 1 ] ,
Y n = [ Z ( 0 ) ( 2 ) , Z ( 0 ) ( 3 ) , Z ( 0 ) ( 3 ) , , Z ( 0 ) ( n ) ] T ,
where X ( 1 ) ( k ) is the background value in the matrix B , satisfying:
X ( 1 ) ( k ) = μ Z ( 1 ) ( k ) + ( 1 μ ) Z ( 1 ) ( k 1 ) , k = 2 , 3 , , n ,
where μ is the weighting coefficient, which usually takes a value of 0.5.
Step 4: Estimate parameters based on ordinary least squares:
U = [ a ˙ , u ˙ ] T = ( B T B ) 1 B T Y n   ,
Step 5: Solve the time response sequence:
Z ˙ ( 1 ) ( k ) = [ Z ( 1 ) ( p ) u ˙ a ˙ ] e a ( k p ) + u ˙ a ˙ , k = 1 , 2 , , n , p = 1 , 2 , , n ,
where Z ( 1 ) ( p ) is the original condition of the time response function. In the GM (1, 1) model, it is usually assumed that p = n , i.e., the original condition of the time response function is assumed to be Z ( 1 ) ( p ) = Z ( 1 ) ( n ) .
Step 6: Find the fitted value of the original data series Z ( 0 ) .
Z ˙ ( 0 ) ( k ) = Z ˙ ( 1 ) ( k ) Z ˙ ( 1 ) ( k 1 ) , k = 2 , 3 , , n ,
Note that Z ˙ ( 0 ) ( k ) ( k = 2 , 3 , , n ) is the fitted value of the original data series Z ( 0 ) ( k ) ; Z ˙ ( 0 ) ( k ) ( k > n ) is the predicted value of the original data Z ( 0 ) ( k ) .
If the test results satisfy both the small error probability p > 0.7 and the posteriori ratio C < 0.65, the model fit is good. Otherwise, the residuals need to be modeled and analyzed, and the prediction model needs to be corrected.

2.3.4. ARIMA Model

The autoregressive integrated moving average (ARIMA) model is a popular model for forecasting time-series data and has been widely used [49].
The ARIMA (p, d, q) model involves three parameters: autoregressive term order p, difference order d, and moving average order q. The models have emerged to address the problem of predicting nonstationary time series. First, a d-order difference computing on the non-stationary time series to obtain a stationary series should be preformed, followed by a prediction using an ARIMA model. The specific form of the model is as follows:
y t = β 0 + β 1 y t 1 + + β p y t p + ε t + θ 1 ε t 1 + + θ q ε t q ,
where { y t } is the data series to be predicted, which must satisfy the smoothness requirement; β and θ are parameters to be evaluated; and { ε t } is a white noise series.
For the prediction of the coupled coordination level time-series data, the ARIMA model is constructed as follows:
Step 1: Smoothness check of the time series. The smoothness of the data is checked for non-stationary time-series data to carry out the difference operation and ensure that it meets the smoothness requirements.
Step 2: Determine the three model parameters p, d, q. d is the number of differences in Step 1, which was determined using the autocorrelation function criterion (AFC), partial autocorrelation function (PACF), Akaike information criterion (AIC), and Bayesian information criterion (BIC). Generally, the smaller the AIC and BIC, the better the parametric model effect.
Step 3: Residual test. After determining the model parameters, check whether the residuals of the model fitting results are consistent with the white noise series. If they are, the model is good; if not, repeat the above steps to redefine the parameters.

2.4. Data Sources

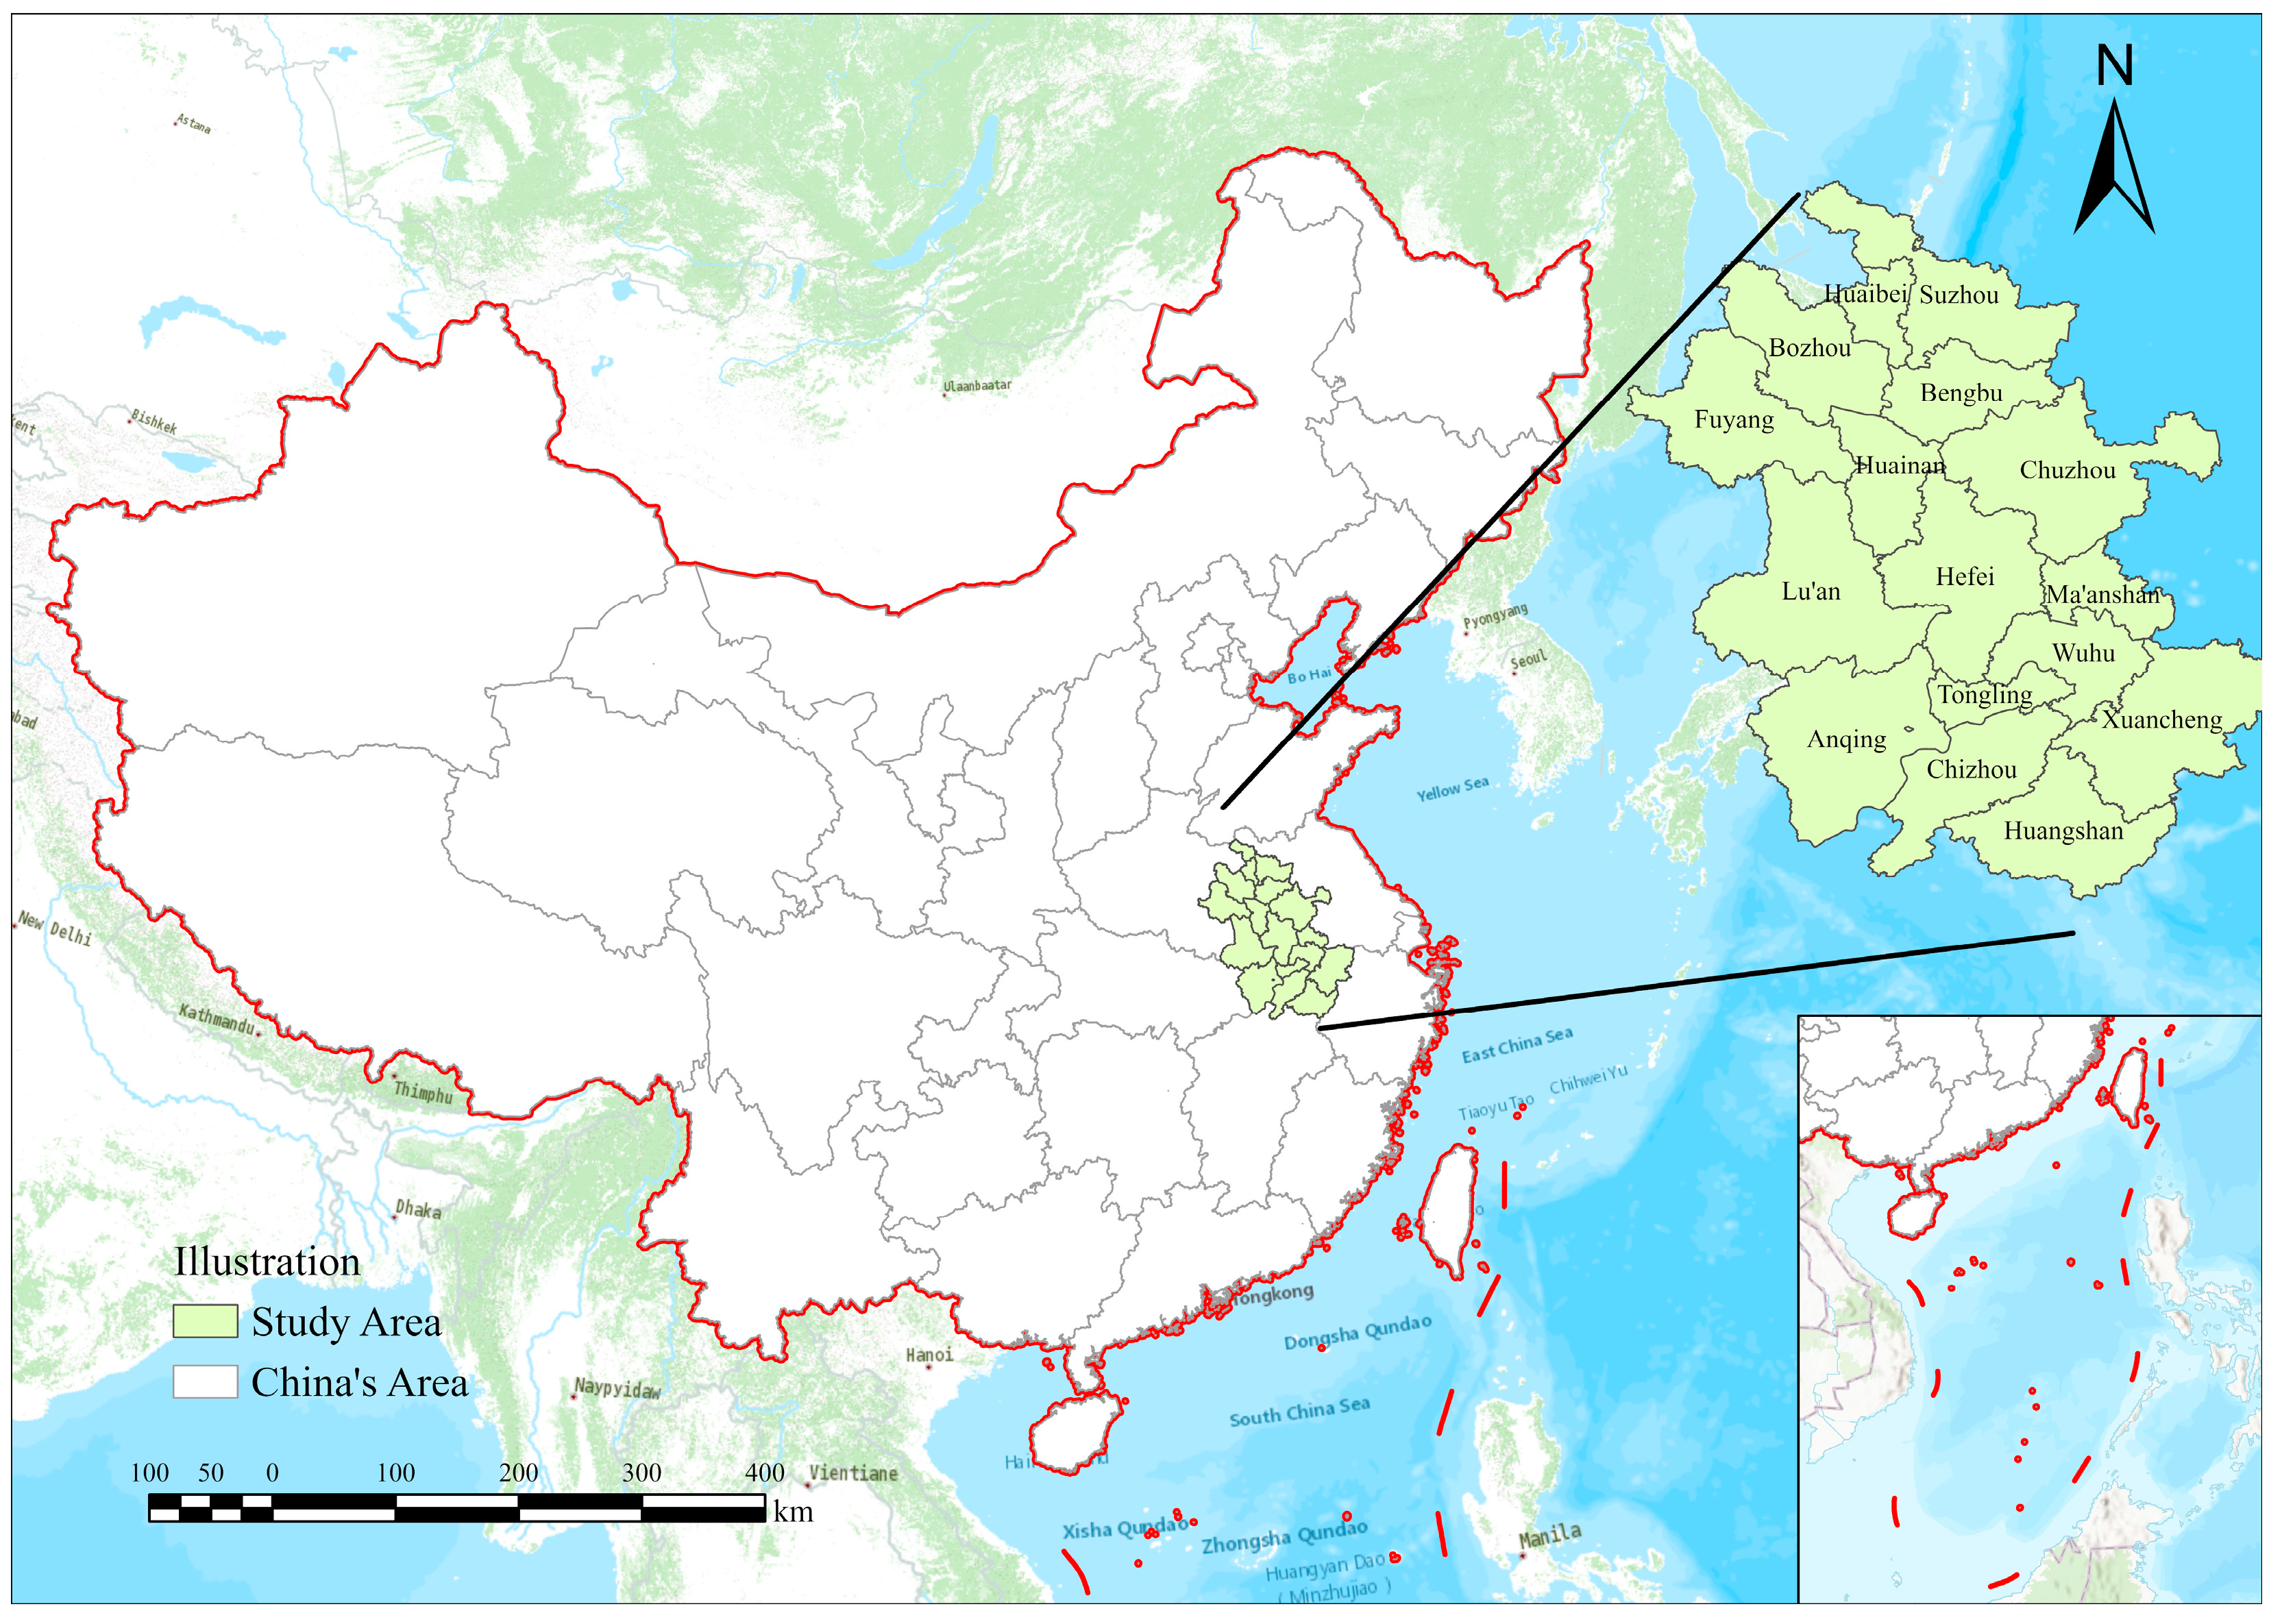
2.4.1. Research Area

Anhui Province (114°5′–119°6′ E, 29°4′–34°6′ N) is situated in the Yangtze River Delta in eastern China, with 140,100 square kilometers and 16 provincial cities under its jurisdiction. Anhui’s population was 61.13 million at the end of 2021, ranking eighth in China, with a regional GDP of CNY 429.592 billion, ranking 11th. With continuous rapid economic growth and serious challenges to the ecological environment, SD has become an inevitable choice for Anhui Province. Anhui’s 16 provincial cities were the object of this study; their geographical locations are shown in Figure 2.

2.4.2. Data Source and Processing

The data in this paper were obtained from the “Statistical Yearbook of Anhui Province”, published by the Anhui Provincial Bureau of Statistics, and the “Statistical Bulletin of Science and Technology of Anhui Province”, published by the Department of Science and Technology of Anhui Province. In 2011, Anhui went through an administrative division adjustment. Chaohu city was transferred to the jurisdiction of Hefei City, so the number of prefecture-level cities in Anhui Province subsequently changed from 17 to 16. The study examined the latest 16 prefecture-level cities in Anhui Province as the subject of study. In order to observe the impact of the administrative division adjustment on Hefei City, the study period was set from 2010 to 2021. When the data were processed, except for Hefei, Bengbu and Wuhu, the data on the number of invention patents owned by 10,000 people in 2013 were missing in the other 13 cities. A linear growth trend was observed for this indicator in the study sample. Therefore, this study used Stata software to make up the data by linear interpolation. To improve the accuracy of the empirical analysis and exclude the influence of price changes on the level of economic development, the GDP and fixed asset investment amounts were treated in constant prices using the gross regional product index and price index, respectively, with 2010 as the base period.

3. Results

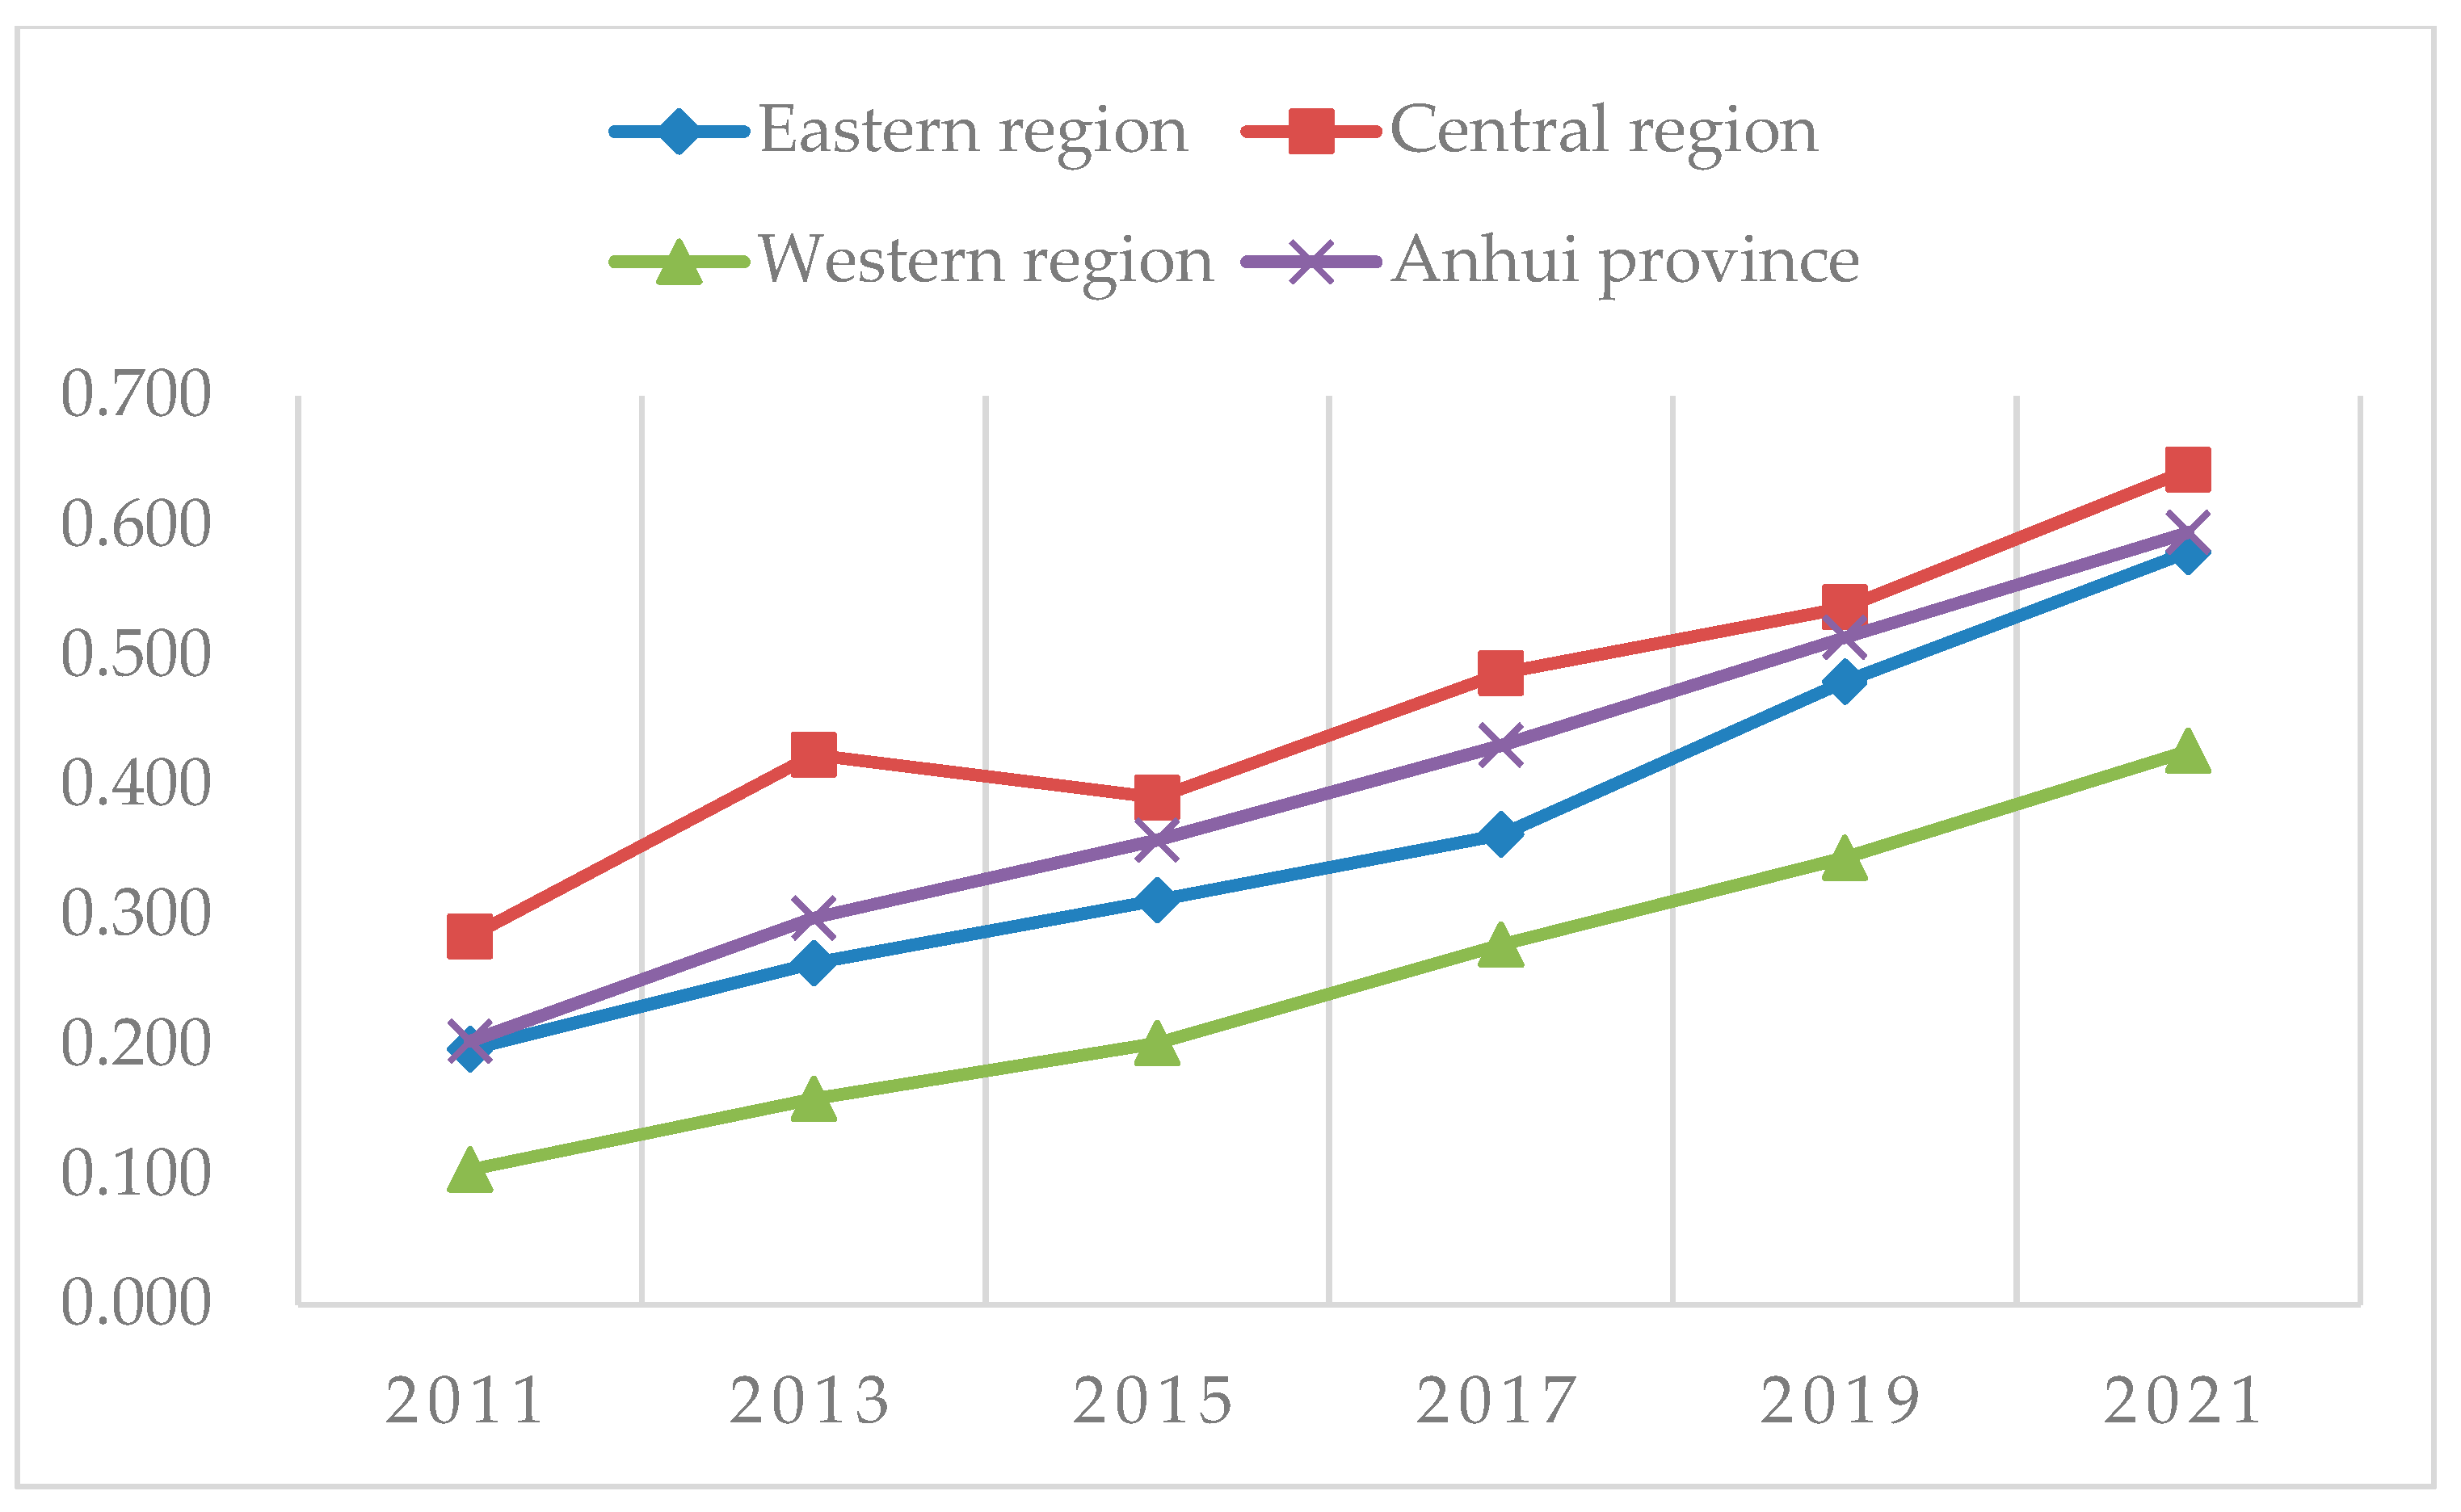
3.1. STI and SD Comprehensive Development Level

The entropy method was used to measure the overall development degree of STI and SD in 16 cities in Anhui from 2010 to 2021. For brevity, only the data of 2011, 2013, 2015, 2017, 2019, and 2021 are included here, and the results are shown in Table 3.
Table 3 and Figure 3 show that the STI levels of 16 cities in Anhui generally showed an increasing trend from 0.183 in 2010 to 0.553 in 2021, with an average annual growth rate of 10.6%. The average value was 0.447, with a 55.3% room for improvement. At the regional dimension, the average values of STI in the east, center, and west of Anhui Province were 0.386, 0.509, and 0.247, respectively, with the central region being higher than the provincial average and the western region being at a lower level, with significant regional differences. After 2019, the growth trend of the STI level in the three regions is clear, which is attributed to the “Several Policies to Support STI” introduced in Anhui Province in 2017, with a significant transformation of STI results. From the perspective of cities, the top three cities are Wuhu, Hefei, and Tongling, and Ma’anshan and Bengbu are also higher than the average. They are the main forces promoting the development of STI. Chuzhou, Xuancheng, Huaibei, Chizhou, and Huangshan were higher than the average value of STI in the western region, and the overall growth rate was faster. For example, the STI development level of Chuzhou City increased from 0.167 in 2010 to 0.537 in 2021, with an average annual growth rate of 13.8%. The average STI in Huainan, Anqing Lan, Fuyang, Bozhou, and Suzhou was lower than 0.13. In the future, it is essential to increase investment in innovation R&D and make full use of relevant supporting policies to attract innovative investment.
In Figure 4, the overall trend of the SD level in Anhui Province increased from 0.204 in 2010 to 0.595 in 2021, with an average annual growth rate of 10.2%. The average value was 0.457, which was higher than the STI level, indicating that the STI drive was insufficient. This was consistent with Wang and Yang’s finding that Anhui was at the bottom of the Yangtze River Delta region in terms of STI efficiency [50]. In the regional dimension, the average SD values in the east, center, and west of Anhui Province were 0.397, 0.519, and 0.257, respectively. The trend to level up was clearer in the east, and there is still more room for improvement in the west. The central region was still higher than the provincial average, but there was a brief decline in 2013–2015, followed by a gradual rebound. This was mainly due to the lower SD level of Huainan City during this period. Coal is the main industry in Huainan; the downward trend of the coal market led to a negative GDP growth in Huainan City in 2014, which was contrary to sustainable economic development. The government promptly changed its development strategy, and the coal industry was transformed to achieve economic growth after 2015. Ma’anshan in the east and Wuhu, Hefei, and Tongling in the center present the top four cities in Anhui Province and are the leaders in SD. Huainan City in the center and Suzhou City in the east have lower SD levels, whereas Lu’an, Bozhou, and Fuyang in the west are at the bottom. The conditions of cities limit their development. In the future, cities that rank low should receive increased policy support, and SD paths in line with their own needs should be explored.

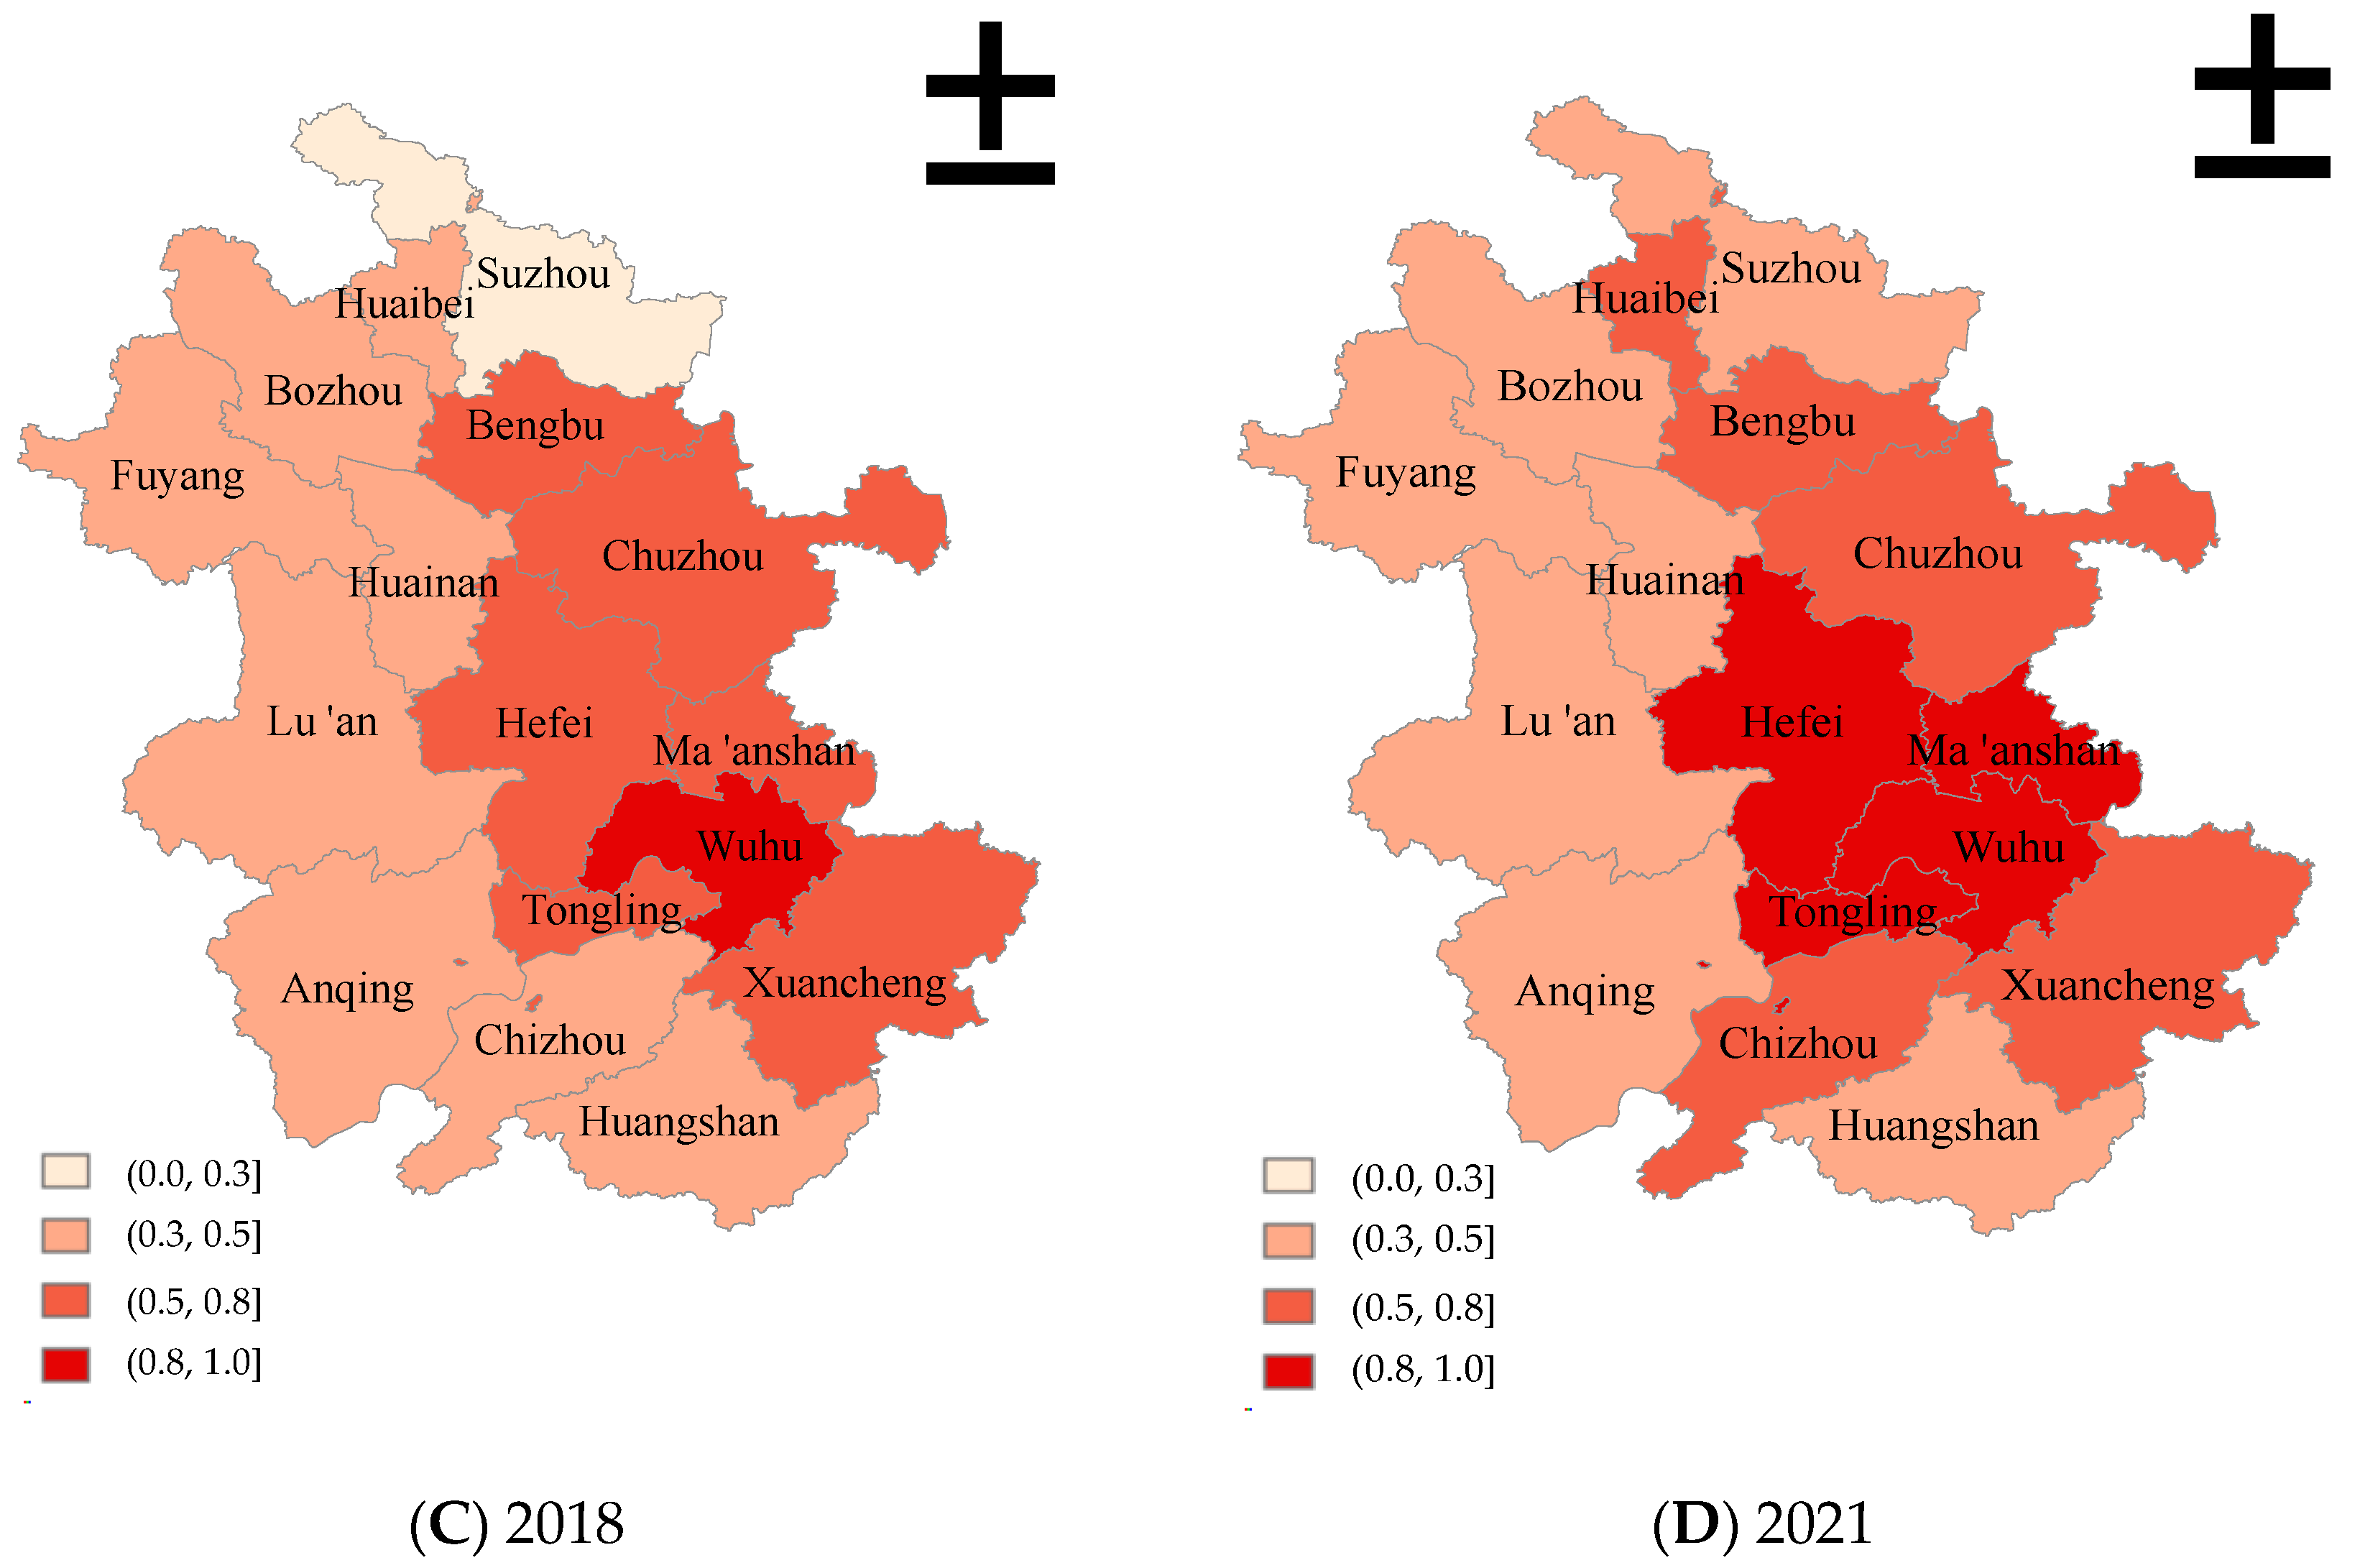
3.2. Spatio-Temporal Characteristics of Coupling Coordination between STI and SD

Based on the above analysis, the results of the regional comparisons and city comparisons of STI and SD are similar. Figure 5 shows that the change trends of the STI and SD levels are generally consistent, and the time-series characteristics of both sides show a clear positive correlation. Therefore, it is essential to consider the coupling relationship between these two. The coupling degree curve of STI and SD always lies above the coupling coordination degree curve, which indicates that the coordination relationship between the two still needs to be further optimized.
For the temporal dimension, as shown in Table 4, the coupling evolution process of the two systems can be classified into two phases: the moderate coupling coordination phase (2010–2014) and the high coupling coordination phase (2015–2021). The roles of the two systems in promoting and coordinating with each other have become increasingly clear, and the coupling coordination degree increased from 0.374 in 2010 to 0.663 in 2021, an increase of 77.1%. However, both the degree of coupling and the coupling coordination had a brief low point in 2011 and 2019, and both showed an accelerated improvement in the following year. The reasons for this are the stagnation of the SD level in 2011 and the stagnation of the STI level in 2019; these directly affect the coupling coordination level. In 2012, the 18th National Congress of the Communist Party of China once again clarified the innovation-driven development strategy, placing STI at the core of the overall development of S&T and prioritizing STI, bringing momentum to SD. In 2020, the level of STI once again reached a new acceleration, and the degree of coupling coordination of the two systems saw accelerated growth, demonstrating the effect of the STI policy implemented in Anhui Province in 2017.
To further analyze the spatial dynamic trends of the two-system coupling and coordination in 16 cities of Anhui, the spatial distribution pattern of the two-system coupling and coordination degree is shown in Figure 6 for 2010, 2014, 2018, and 2021. The coupling and coordination levels show different degrees of improvement and obvious changes. The geographical distribution of the coupling coordination level of the two systems also shows a gradient spatial differentiation of “central > eastern > western,” according to the grade of coupling coordination.
  • Low coupling coordination area
In 2010, the cities with a low degree of coupling coordinated were Bozhou, Fuyang, Lu’an, Anqing, and Chizhou in the west, Huangshan and Suzhou in the east, and Huainan in the center, accounting for 50% of Anhui Province. The coupling coordination degree of the two systems in the west was in the backward position, and the coupling degree was in an antagonistic state; therefore, it is imperative to adjust the development of the system over time. In 2018, the six western cities successively reached moderate coupling coordination, indicating that the implementation of the innovation-driven and SD strategy in Anhui Province had begun to bear fruit, but the levels of STI and SD in these cities were still relatively low. In the future, we need to increase innovation investment, strengthen exchanges and cooperation between the central and western regions, and accomplish the goal of SD through innovation enhancement.
  • Moderate coupling coordination area
In 2010, Bengbu, Chuzhou, Ma’anshan, and Xuancheng in the east and Huaibei in the center were in a moderate coupling coordination area. In 2014, the cities of Chizhou and Huangshan entered moderate coupling coordination. By 2018, Anqing, Lu’an, Fuyang, and Bozhou had gradually moved from the low-coupling coordination area. In contrast, Suzhou City only crossed into the moderate grade area in 2020, and the coupling coordination grade of the two systems was still low in 2021 at only 0.3741. The starting point of the coupling coordination level of these cities is low. For future development, they should study the experience of highly coupled and coordinated areas, carry out cross-regional innovation cooperation, improve their own strength, and better realize the benign coupling of urban STI and SD.
  • High-coupling coordination area
As early as 2010, the cities of Hefei, Wuhu, and Tongling had already reached a high-coupling coordination level, indicating that the STI and SD of the three regions were better linked in the early years. In 2014, Ma’anshan City and Bengbu City joined the level, and in 2018, the scope was further increased with Chuzhou City and Xuancheng City. In 2021, Huaibei City and Chizhou City successfully entered the high-coupled coordination area. The cities with highly coordinated coupling and above in these four years accounted for 18.8%, 31.3%, 43.8%, and 56.3% of Anhui Province, respectively. Over time, the number of cities located in highly coordinated areas gradually increased, and the development status improved. Except for Wuhu, Hefei, Ma’anshan, and Tongling, which had achieved the extremely coordinated coupling area in 2021, the coupling coordination levels of the two systems in the other five cities have much room for improvement.
  • Extreme-coupling coordination area
There was no extreme coupling coordination region in Anhui Province before 2018, and Wuhu City was the first city to enter this rank. After 2018, Hefei City, Ma’anshan City, and Tongling City also gradually stepped into this rank in 2021, and the percentage of extreme-coupling coordination regions in Anhui Province reached 25%. These four cities are situated in the central part of Anhui Province, showing the trend of Wuhu City as the hub radiating to the surrounding areas. As a sub-center city of Anhui Province, Wuhu City has been developing rapidly in recent years. Hefei, Ma’anshan, and Tongling are adjacent to Wuhu, which facilitates the inter-regional radiation drive and allows better cooperation and exchange of technology and factor flow, which drives coupling and coordination levels.

3.3. Level of Coupling Coordination between STI and SD Subsystems

The following section focuses on the coupling coordination status of the STI system with the three subsystems of SD (economy, society, and ecology) to clarify the lag factors. In this study, four time points, 2010, 2014, 2018, and 2021, were selected for the analysis, as shown in Figure 7.
In the coupling and coordination of the STI and economic subsystems, Suzhou City occupied the first place with an increase of 315.7%, while Huangshan’s increase was only 38.9%. Hefei, Ma’anshan, Wuhu, and Tongling entered the extreme coupling and coordination stage, accounting for 25%. Huaibei, Bengbu, Chuzhou, Xuancheng, and Chizhou had high coupling coordination, whereas other cities had moderate coupling coordination levels, with room for development.
In the coupling and coordination of the STI and social subsystems, Hefei and Ma’anshan were in an extremely coupled coordination stage, accounting for 12.5%. Seven cities, namely Bozhou, Suizhou, Fuyang, Huainan, Lu’an, Anqing, and Huangshan, had a high coupling coordination grade. The remaining seven cities were at a moderate grade. Among them, Suzhou had the largest increase of 149.4%, whereas Tongling had the smallest increase.
In the coupling and coordination of the STI and ecological subsystems, there were no cities with extreme coupling coordination levels, and the cities with high coupling coordination were Hefei, Huaibei, Bengbu, Chuzhou, Ma’anshan, Wuhu, Xuancheng, Tongling, and Chizhou, accounting for 56.25%. The remaining cities have moderate coupling coordination levels. The largest increase was in Suzhou, which reached 152%, whereas the increase in Wuhu City was only 7.8%.
In summary, the coupling coordination relationship between STI and the three subsystems, was best for the economic system, followed by the social system, and finally, the ecosystem. This indicates that STI and economic development in Anhui Province have a good positive correlation, high economic growth provides material guarantee for innovation R&D, and STI significantly promotes economic development. However, the coupling and coordination level between STI and the ecosystem is low, and the coupling and coordination development of the STI and ecosystem are lag factors. This result confirmed by the study of Luo et al. that Anhui had the lowest overall ecological quality score and was at the bottom of the Yangtze River Delta region in the study of coupled economic-social-ecological effects [51]. It is necessary to strengthen ecological protection in the future, focus on the driving force of STI, and promote positive interactions between the two systems.

4. Prediction

4.1. GM (1, 1) Prediction

The change in the coupling coordination grade of STI and SD in the future is an important guideline for changing the development model in Anhui Province. In this study, MATLAB software was used to establish grey GM (1, 1) and ARIMA prediction models to take the coupling coordination time series data of the two systems in Anhui Province from 2010–2021 to predict the coupling coordination level from 2022–2033. For brevity, this study only shows the overall forecast value of Anhui Province.
The posterior difference ratio value C was calculated as 0.0283, and the small error probability value p was 1. Compared to the prediction accuracy table, the accuracy grade of the model was good. As shown in Figure 8, the actual values from 2010–2021 are consistent with the fitted values, indicating a good model fit.
According to the predicted values of the GM (1, 1) model (Table 5), the coupling coordination level of the STI and SD in Anhui from 2022–2033 will steadily increase. The 2030 coupling coordination level reaches one, and the two systems reach the optimal coupling coordination grade.

4.2. Prediction of ARIMA

Because the GM (1, 1) model is based on exponential law forecasting, its predicted data can only show increasing or decreasing trends, which, to a certain extent, limits the reverse fluctuation trend due to special circumstances [52]. However, the ARIMA forecasting model can simulate the fluctuations of the data, which partially compensates for the inverse fluctuation trend ignored by the GM (1, 1) forecasting model [53]. Therefore, in this study, the ARIMA model was used to examine the trends of the two systems over the next 12 years.
After passing the smoothness test of the time series, the autoregressive term order p and moving average order q of the ARIMA model were determined using the AIC and BIC criteria. After computing them using MATLAB software programming, the prediction model for the case of minimum AIC and BIC values was ARIMA (0,1,0). The results of the Q statistic test are shown in Table 6. The p value of Q6 is 0.566, which is greater than 0.1, indicating that the first sixth-order autocorrelation coefficients of its residuals satisfy the white noise test. The prediction results are listed in Table 5.
The prediction results of the ARIMA model also show a monotonically increasing trend in the coupling coordination level of the two systems, which is consistent with the prediction results of GM (1, 1). However, its coupling coordination level reaches only 0.978 in 2033, which is three years later than the former prediction result in Figure 9.

5. Discussion and Conclusions

5.1. Discussion

The concept of sustainable development has been proposed for more than 40 years and has received wide attention from scholars. China was the first country in the world to incorporate sustainable development into its national development strategy, which is not only necessary for its development but also reflects its attitude and determination to follow the path of sustainable development. In terms of economic development and innovation capacity, the Yangtze River Delta region is one of the most dynamic regions in China [54]. The Yangtze River Delta’s integration is the future development trend, but Anhui Province still has a gap with the other three provinces and cities (Shanghai, Zhejiang Province, and Jiangsu Province) in terms of high-quality development [55] and STI as a key power engine of SD. In addition, STI as a key power engine of SD, this study also confirmed the lack of STI power in Anhui Province. The spatial level of STI in Anhui province was uneven, with large differences between east and west. The STI levels in central and eastern cities such as Wuhu and Hefei were greater than 0.8, while western cities were below 0.2. In Zhang et al.’s study, there were differences in STI efficiency in different regions of Anhui, which affected the level of regional green development, and this paper also confirmed this result [56]. Due to their geographical advantages, the eastern cities can integrate more quickly into the construction of the Yangtze River Delta economic circle and can make full use of their location advantages to strengthen economic and trade cooperation with the neighboring developed provinces. Resource-based cities such as Huainan in the center and Huaibei in the west had the bottom level of science and technology innovation in the province. Yu et al. concluded in their study that resource-based cities have low efficiency in science and technology innovation, which was consistent with the results of this study [57].
The proliferation of urban population and ecological pollution were the main obstacles on the road to sustainable urban development [58,59]. To facilitate the clarification of the internal constraints of the coupled and coordinated relationship between STI and SD, this study explored the coupled and coordinated status of the STI system and the three subsystems of SD (economy, society, and ecology). The study found that the overall level of coupling and coordination between STI and ecological protection in Anhui Province was low. It was well verified that cities were pursuing the rapid economic development while neglecting ecological protection [60]. The ecological environment is a matter of human survival and development, and a good ecological environment can effectively improve the quality of life and work. In 2021, the State Council issued the “Opinions on Encouraging and Supporting Social Capital to Participate in Ecological Protection and Restoration,” which encouraged social capital to join in ecological restoration build. At the same time, Anhui provincial government should also actively explore a new model of ecological protection, fully integrate social resources, and integrate elements of STI to protect and restore the ecological environment.
The analysis of existing studies related to coupling coordination relationships revealed that few articles have predicted the future state of the level of coupling coordination between systems in Anhui Province [61,62,63]. In this study, the gray GM (1, 1) prediction model, which is currently used more often, was used, but the theoretical system of gray systems is not perfect, which leads to some defects of the GM (1, 1) model. For example, the fitted and predicted data can only show increasing or decreasing trends [64]. For this reason, this study again used the ARIMA model to make predictions for comparison and demonstrated that the future coupling and coordination level of STI and SD in Anhui is monotonically increasing. However, ARIMA and GM (1, 1), which are short-term forecasting models, predict the trend of the coupled coordination level of the two systems for the next decade in this paper and may lose the accuracy of their predicted values. Due to material collection and time constraints, a combination of models GM (1, 1) and ARIMA can be considered for predicting the level of system coupling coordination to find prediction methods with smaller errors, greater span, and more generality in the future [65].

5.2. Conclusions

Based on the panel data of 16 cities in Anhui Province from 2010–2021, this study analyzed the coupling coordination degree of STI and SD and its spatio-temporal dynamic evolution characteristics using the models of entropy method, coupling coordination degree, grey GM (1, 1), and ARIMA prediction. The following conclusions were drawn.
First, the overall levels of STI and SD are on the rise, but the level of STI lags behind the level of SD, and the driving force of STI on SD is insufficient. There was an obvious gap between the level of STI and SD in different regions and cities, showing the pattern “center > east > west.”
Second, the coupling coordination relationship between the STI and SD experienced a moderate coupling and coordination phase (2010–2014) and a high coordination coupling phase (2015–2021). The coupling and coordination degree increased by 77.1%, with a significant growth trend. For the time dimension, cities with low coupling coordination decreased from 8 in 2010 to 0 in 2021; cities with moderate coupling coordination increased from 5 to 7; cities with high coupling coordination increased from 3 to 5; and cities with extreme coupling coordination increased from 0 to 4. For the spatial dimension, the central region had the strongest coupling coordination level between the two systems, followed by the eastern region, while the western region was the weakest. The coupling and coordination degree of the two systems in Wuhu City retained the leading position, creating a radiating effect to the surrounding area. For the coupling coordination of STI and SD subsystem, the pattern of economic system > social system > ecosystem emerged, and the coupling coordination development between STI and the ecological environment was the lag factor.
Finally, looking at future trends, the coupling coordination level of Anhui Province shows a monotonically increasing trend and will reach the optimal coupling coordination state around 2030.

Author Contributions

Conceptualization, L.S.; methodology, L.S.; software, Z.W.; validation, Z.W.; formal analysis, L.S.; investigation, L.Y.; resources, Z.W.; data curation, Z.W.; writing—original draft preparation, Z.W.; writing—review and editing, L.S.; visualization, L.Y.; supervision, L.Y.; project administration, L.Y.; funding acquisition, L.S. and L.Y.; All authors have read and agreed to the published version of the manuscript.

Funding

This research was funded by the major project in Humanities and Social Science Research of Higher Education institutions in Anhui Province (L.S., SK2021ZD0039), the National Natural Science Foundation of China (L.S., 71704002), the Major of National Social Science Foundation of China (L.Y., 20ZDA084), the Science and Technology Innovation Strategy and Soft Science project of Anhui Province (L.S., 202106f01050043), and the Social Science Innovation and Development research project of Anhui Province (L.S., 2021CX508).

Institutional Review Board Statement

Not applicable.

Informed Consent Statement

Not applicable.

Data Availability Statement

The data used to support the findings of this study are available from the corresponding author upon request.

Conflicts of Interest

The authors declare no conflict of interest.

References

  1. Serra, V.; Ledda, A.; Ruiu, M.G.G.; Calia, G.; De Montis, A. Integrating adaptation to climate change into sustainable development policy and planning. Sustainability 2022, 14, 7634. [Google Scholar] [CrossRef]
  2. Guo, M.; Nowakowska-Grunt, J.; Gorbanyov, V.; Egorova, M. Green technology and sustainable development: Assessment and green growth frameworks. Sustainability 2020, 12, 6571. [Google Scholar] [CrossRef]
  3. Chen, L.; Huo, C. The measurement and influencing factors of high-quality economic development in China. Sustainability 2022, 14, 9293. [Google Scholar] [CrossRef]
  4. Wang, J.; Liu, Z.; Shi, L.; Tan, J. The impact of low-carbon pilot city policy on corporate green technology innovation in a sustainable development context-evidence from Chinese listed companies. Sustainability 2022, 14, 10953. [Google Scholar] [CrossRef]
  5. Zhang, J.; Wang, S.; Pradhan, P.; Zhao, W.; Fu, B. Untangling the interactions among the sustainable development goals in China. Sci. Bull. 2022, 67, 977–984. [Google Scholar] [CrossRef] [PubMed]
  6. Zhang, K.; Hou, Y.; Jiang, L.; Xu, Y.; Liu, W. Performance evaluation of urban environmental governance in Anhui Province based on spatial and temporal differentiation analyses. Environ. Sci. Pollut. Res. 2021, 28, 37400–37412. [Google Scholar] [CrossRef]
  7. Anadona, L.D.; Chan, G.; Harley, A.G.; Matus, K.; Moon, S.; Murthy, S.L.; Clark, W.C. Making technological innovation work for sustainable development. Proc. Natl. Acad. Sci. USA 2016, 113, 9682–9690. [Google Scholar] [CrossRef]
  8. Sun, Z.; Cao, C.; He, Z.; Feng, C. Examining the coupling coordination relationship between digital inclusive finance and technological innovation from a spatial spillover perspective: Evidence from China. Emerg. Mark. Finance Trade 2022, 1–13. [Google Scholar] [CrossRef]
  9. Yin, K.; Zhang, R.; Jin, X.; Yu, L. Research and optimization of the coupling and coordination of environmental regulation, technological innovation, and green development. Sustainability 2022, 14, 501. [Google Scholar] [CrossRef]
  10. Wang, Y.; Deng, Q.; Zhang, Y. Research on the coupling and coordinated development of marine technological innovation and marine ecological economic development. J. Coastal Res. 2020, 99, 419–427. [Google Scholar] [CrossRef]
  11. Shang, Y.; Liu, S. Spatial-temporal coupling coordination relationship between urbanization and green development in the coastal cities of China. Sustainability 2021, 13, 5339. [Google Scholar] [CrossRef]
  12. Pandey, N.; de Coninck, H.; Sagar, A.D. Beyond technology transfer: Innovation cooperation to advance sustainable development in developing countries. Wiley Interdiscip. Rev. Energy Environ. 2022, 11, e422. [Google Scholar] [CrossRef]
  13. Su, C.W.; Xie, Y.; Shahab, S.; Faisal, C.M.N.; Hafeez, M.; Qamri, G.M. Towards achieving sustainable development: Role of technology innovation, technology adoption and CO2 emission for BRICS. Int. J. Environ. Res. Public Health 2021, 18, 277. [Google Scholar] [CrossRef] [PubMed]
  14. Mousavi, S.; Bossink, B.A.G. Firms’ capabilities for sustainable innovation: The case of biofuel for aviation. J. Clean. Prod. 2017, 167, 1263–1275. [Google Scholar] [CrossRef]
  15. Aricò, S. The contribution of the sciences, technology and innovation to sustainable development: The application of sustainability science from the perspective of UNESCO’s experience. Sustain. Sci. 2014, 9, 453–462. [Google Scholar] [CrossRef]
  16. Liao, Y.; Qiu, X.; Wu, A.; Sun, Q.; Shen, H.; Li, P. Assessing the impact of green innovation on corporate sustainable development. Front. Energy Res. 2022, 9, 800848. [Google Scholar] [CrossRef]
  17. Yang, X.C. Ecological technology innovation and sustainable development of small and medium-sized enterprises in Guangxi. Guangxi Soc. Sci. 2012, 23–26. [Google Scholar]
  18. Jaeger-Erben, M.; Rüeckert-John, J.; Schäfer, M. Sustainable consumption through social innovation: A Typology of innovations for sustainable consumption practices. J. Clean. Prod. 2015, 108, 784–798. [Google Scholar] [CrossRef]
  19. Xu, K.; Loh, L.; Chen, A.Q. Sustainable innovation governance: An analysis of regional innovation with a super efficiency slack-based measure model. Sustainability 2020, 12, 3008. [Google Scholar] [CrossRef]
  20. Zhou, Q.; Shi, M.; Huang, Q.; Shi, T. Do double-edged swords cut both ways? The role of technology innovation and resource consumption in environmental regulation and economic performance. Int. J. Environ. Res. Public Health 2021, 18, 13152. [Google Scholar] [CrossRef]
  21. Zhang, J.; Chang, Y.; Zhang, L.; Li, D. Do Technological innovations promote urban green development?—A spatial econometric analysis of 105 cities in China. J. Clean. Prod. 2018, 182, 395–403. [Google Scholar] [CrossRef]
  22. Sorrell, S. Energy substitution, technical change and rebound effects. Energies 2014, 7, 2850–2873. [Google Scholar] [CrossRef]
  23. Silvestre, B.S. A hard nut to crack! Implementing supply chain sustainability in an emerging economy. J. Clean. Prod. 2015, 96, 171–181. [Google Scholar] [CrossRef]
  24. Geissdoerfer, M.; Vladimirova, D.; Evans, S. Sustainable business model innovation: A review. J. Clean. Prod. 2018, 198, 401–416. [Google Scholar] [CrossRef]
  25. Krishna, P.V.G.; Lorsuwannarat, T. Fostering innovation performance from a sustainable development perspective: Towards a research agenda. Int. J. Innov. Sustain. Dev. 2018, 12, 469–497. [Google Scholar] [CrossRef]
  26. Zhang, S.; Yang, Y.; Wen, Z.; Peng, M.; Zhou, Y.; Hao, J. Sustainable development trial undertaking: Experience from China’s innovation demonstration zones. J. Environ. Manag. 2022, 318, 115370. [Google Scholar] [CrossRef]
  27. Li, X.; Zhou, X.; Yan, K. Technological progress for sustainable development: An empirical analysis from China. Econ. Anal. Policy 2022, 76, 146–155. [Google Scholar] [CrossRef]
  28. Zhao, J. Dual innovation: The road to sustainable development of enterprises. Int. J. Inov. Sci. 2021, 13, 423–436. [Google Scholar] [CrossRef]
  29. Yuan, B.; Zhang, Y. Flexible environmental policy, technological innovation and sustainable development of China’s industry: The moderating effect of environment regulatory enforcement. J. Clean. Prod. 2020, 243, 118543. [Google Scholar] [CrossRef]
  30. Mai, Y.; Yang, H.; Zhang, G. Does business model innovation enhance the sustainable development of new ventures? Understanding an inverted-U relationship. Sustainability 2021, 13, 262. [Google Scholar] [CrossRef]
  31. Ashford, N.A.; Hall, R.P. The importance of regulation-induced innovation for sustainable development. Sustainability 2011, 3, 270–292. [Google Scholar] [CrossRef] [Green Version]
  32. Wei, J.; Ding, Z.; Meng, Y.; Li, Q. Regional sustainable assessment at city level based on CSDIS (China Sustainable Development Indicator System) concept in the New Era, China. Chin. Geogr. Sci. 2020, 30, 976–992. [Google Scholar] [CrossRef]
  33. Liang, L.; Xu, K. Convergence analysis of regional sustainable innovation efficiency in China. Environ. Dev. Sustain. 2022, 1–19. [Google Scholar] [CrossRef]
  34. Yang, W.; Chen, Q.; Guo, Q.; Huang, X. Towards sustainable development: How digitalization, technological innovation, and green economic development interact with each other. Int. J. Environ. Res. Public Health 2022, 19, 12273. [Google Scholar] [CrossRef]
  35. Ahmad, M.; Ahmed, Z.; Bai, Y.; Qiao, G.; Popp, J.; Oláh, J. Financial inclusion, technological innovations, and environmental quality: Analyzing the role of green openness. Front. Environ. Sci. 2022, 10, 851263. [Google Scholar] [CrossRef]
  36. Yan, Y.; Jiang, L.; He, X.; Hu, Y.; Li, J. Spatio-temporal evolution and influencing factors of scientific and technological innovation level: A multidimensional proximity perspective. Front. Psychol. 2022, 13, 920033. [Google Scholar] [CrossRef]
  37. Wang, Q.; Chen, Y.; Guan, H.; Lyulyov, O.; Pimonenko, T. Technological innovation efficiency in China: Dynamic evaluation and driving factors. Sustainability 2022, 14, 8321. [Google Scholar] [CrossRef]
  38. Zhu, J.; Sun, X.; He, Z.; Zhao, M. Are SDGs suitable for China’s sustainable development assessment? An application and amendment of the SDGs indicators in China. Chin. J. Popul. Resour. 2019, 17, 25–38. [Google Scholar] [CrossRef]
  39. Guan, C.; Weng, Y.; Zhao, J.; Lin, Y.; Zhang, W.; Tu, Q. Examining China’s sustainable development based on genuine progress indicator. Sustain. Prod. Consump. 2021, 28, 1635–1644. [Google Scholar] [CrossRef]
  40. Lin, J.Z.; Kim, H.H. An empirical study on the high-quality development efficiency of the urban economy in China. Int. J. Adv. Appl. Sci. 2022, 9, 119–124. [Google Scholar] [CrossRef]
  41. Ren, Z. Evaluation method of port enterprise product quality based on entropy weight TOPSIS. J. Coastal Res. 2020, 103, 766–769. [Google Scholar] [CrossRef]
  42. Jamin, A.; Humeau-Heurtier, A. (Multiscale) cross-entropy methods: A review. Entropy 2020, 22, 45. [Google Scholar] [CrossRef] [PubMed]
  43. Liao, K.C.; Yue, M.Y.; Sun, S.W.; Xue, H.B.; Liu, W.; Tsai, S.B.; Wang, J.T. An evaluation of coupling coordination between tourism and finance. Sustainability 2018, 10, 2320. [Google Scholar] [CrossRef]
  44. Qi, Y.; Farnoosh, A.; Lin, L.; Liu, H. Coupling coordination analysis of China’s provincial water-energy-food nexus. Environ. Sci. Pollut. R. 2022, 29, 23303–23313. [Google Scholar] [CrossRef] [PubMed]
  45. Zhao, Y.; Hou, P.; Jiang, J.; Zhai, J.; Chen, Y.; Wang, Y.; Bai, J.; Zhang, B.; Xu, H. Coordination study on ecological and economic coupling of the Yellow River Basin. Int. J. Environ. Res. Public Health 2021, 18, 10664. [Google Scholar] [CrossRef] [PubMed]
  46. Li, Y.; Li, Y.; Zhou, Y.; Shi, Y.; Zhu, X. Investigation of a coupling model of coordination between urbanization and the environment. J. Environ. Manag. 2012, 98, 127–133. [Google Scholar] [CrossRef]
  47. Wu, X.X.; Ren, B.P. The coupling and coordination relationship between technological innovation and green development in the Yellow River Basin. China Popul. Resour. Environ. 2022, 32, 20–28. [Google Scholar]
  48. Li, B.; Gao, J. Regional tourism economic forecasting model based on GM grey forecasting method. Math. Probl. Eng. 2022, 2022, 3477246. [Google Scholar] [CrossRef]
  49. Singh, S.; Sundram, B.M.; Rajendran, K.; Law, K.B.; Aris, T.; Ibrahim, H.; Dass, S.C.; Gill, B.S. Forecasting daily confirmed COVID-19 cases in malaysia using ARIMA models. J. Infect. Dev. Countr. 2020, 14, 971–976. [Google Scholar] [CrossRef]
  50. Jianmin, W.; Li, Y. Does factor endowment allocation improve technological innovation performance? An empirical study on the Yangtze river delta region. Sci. Total Environ. 2020, 716, 137107. [Google Scholar] [CrossRef]
  51. Luo, D.A.; Liang, L.; Wang, Z.; Chen, L.; Zhang, F.D. Exploration of coupling effects in the economy-society-environment system in urban areas: Case study of the yangtze river delta urban agglomeration. Ecol. Indic. 2021, 128, 107858. [Google Scholar] [CrossRef]
  52. Dai, D.; Li, K.; Zhao, S.; Zhou, B. Research on prediction and realization path of carbon peak of construction industry based on EGM-BP model. Front. Energy. Res. 2022, 10, 981097. [Google Scholar] [CrossRef]
  53. Li, S.; Li, R. Comparison of forecasting energy consumption in Shandong, China using the ARIMA model, GM model, and ARIMA-GM model. Sustainability 2017, 9, 1181. [Google Scholar] [CrossRef]
  54. Xia, C.; Zheng, H.; Meng, J.; Li, S.; Du, P.; Shan, Y. The evolution of carbon footprint in the Yangtze river delta city cluster during eEconomic transition 2012–2015. Resour. Conserv. Recy. 2022, 181, 106266. [Google Scholar] [CrossRef]
  55. Han, J.; He, M.; Xie, H.; Ding, T. The impact of scientific and technological innovation on high-quality economic development in the Yangtze river delta region. Sustainability 2022, 14, 14346. [Google Scholar] [CrossRef]
  56. Zhang, K.; Jiang, W.; Zhang, S.; Xu, Y.; Liu, W. The impact of differentiated technological innovation efficiencies of industrial enterprises on the local emissions of environmental pollutants in Anhui province, China, from 2012 to 2016. Environ. Sci. Pollut. R. 2019, 26, 27953–27970. [Google Scholar] [CrossRef] [PubMed]
  57. Yu, Y.; Xu, Z.; Shen, P.; Zhang, L.; Ni, T. Efficiency evaluation and influencing factors of green innovation in Chinese resource-based cities: Based on SBM-undesirable and spatial durbin model. Int. J. Env. Res. Pub. He. 2022, 19, 13772. [Google Scholar] [CrossRef]
  58. Bai, Y.; Deng, X.; Jiang, S.; Zhang, Q.; Wang, Z. Exploring the relationship between urbanization and urban eco-efficiency: Evidence from prefecture-level cities in China. J. Clean. Prod. 2018, 195, 1487–1496. [Google Scholar] [CrossRef]
  59. Ni, R.; Wang, F.; Yu, J. Spatiotemporal changes in sustainable development and its driving force in the Yangtze river delta region, China. J. Clean. Prod. 2022, 379, 134751. [Google Scholar] [CrossRef]
  60. Shen, Y.; Yue, S.; Pu, Z.; Lai, X.; Guo, M. Sustainable total-factor ecology efficiency of regions in China. Sci. Total Environ. 2020, 734, 139241. [Google Scholar] [CrossRef]
  61. Liu, F.; Wang, C.; Luo, M.; Zhou, S.; Liu, C. An investigation of the coupling coordination of a regional agricultural economics-ecology-society composite based on a data-driven approach. Ecol. Indic. Ecol. Indic. 2022, 143, 109363. [Google Scholar] [CrossRef]
  62. Qian, L.; Shen, M.; Yi, H. Spatio-temporal pattern of coupling coordination between urban development and ecological environment under the “double carbon” goal: A case study in Anhui, China. Sustainability 2022, 14, 11277. [Google Scholar] [CrossRef]
  63. Xing, Q.; Yang, Z. Assessment of the coordination of low-carbon development and socio-economic development based on a comprehensive model: A case study of Anhui province (China). Front. Public Health 2022, 10, 884342. [Google Scholar] [CrossRef] [PubMed]
  64. Yuan, C.; Liu, S.; Fang, Z. Comparison of China’s primary energy consumption forecasting by using ARIMA (the autoregressive integrated moving average) model and GM (1,1) model. Energy 2016, 100, 384–390. [Google Scholar] [CrossRef]
  65. Li, S.; Yang, X.; Li, R. Forecasting China’s coal power installed capacity: A comparison of MGM, ARIMA, GM-ARIMA, and NMGM models. Sustainability 2018, 10, 506. [Google Scholar] [CrossRef] [Green Version]
Figure 1. Coupling mechanism of science and technology innovation (STI) and sustainable development (SD).
Sustainability 15 02874 g001
Figure 2. Location map of the study area.
Sustainability 15 02874 g002
Figure 3. Comprehensive development level of STI in Anhui Province and regions.
Sustainability 15 02874 g003
Figure 4. Comprehensive Development Level of SD in Anhui Province and Regions.
Sustainability 15 02874 g004
Figure 5. Time series diagram of the comprehensive development of two systems in Anhui.
Sustainability 15 02874 g005
Figure 6. Spatial distribution of the coupling coordination of two systems in Anhui Province.
Sustainability 15 02874 g006aSustainability 15 02874 g006b
Figure 7. Radar diagram of the coupling and coordination of STI and SD subsystems.
Sustainability 15 02874 g007
Figure 8. GM (1, 1) prediction graph.
Sustainability 15 02874 g008
Figure 9. ARIMA forecast graph.
Sustainability 15 02874 g009
Table 1. STI and SD indicator system.
Target
Layer
Indicator LayerIndicator
Direction
STIProportion of R&D expenditure to GDP+
Number of invention patents owned by 10,000 people+
Turnover of technology contracts+
Value added of high technology industries as a percentage of GDP+
Full-time equivalent of R&D personnel+
Number of S&T papers published by industrial enterprises+
Proportion of education expenditure to GDP+
SDEconomyGDP per capita+
Local fiscal revenue per capita+
Investment in fixed assets per capita+
Urban registered unemployment rate-
SocietyNumber of health personnel per 10,000 people+
Number of criminal cases per 10,000 people-
Illiteracy rate-
Number of years of education per capita+
EcologySulfur dioxide emissions per billion GDP-
Comprehensive utilization rate of general industrial solid waste+
Number of days with air quality better than Grade 2+
Green space per capita+
Table 2. Classification of degree of coupling and coupling coordination level.
IndexRangeGrade Classification
Coupling degree C (0.000, 0.300]Low-level coupling
(0.300, 0.500]Antagonistic
(0.500, 0.800]Breaking-in
(0.800, 1.00]High-level coupling
Coupling coordination degree
D
(0.000, 0.300]Low coupling coordination
(0.300, 0.500]Moderate coupling coordination
(0.500, 0.800]High coupling coordination
(0.800, 1.000]Extreme coupling coordination
Table 3. Comprehensive development level of STI and SD in Anhui Province.
Region201120132015201720192021Average
STISDSTISDSTISDSTISDSTISDSTISDSTISD
Suzhou0.0120.0420.0170.1000.0290.1790.0570.1990.070.3110.1430.3560.1780.189
Bengbu0.2510.1510.2880.2480.3550.2970.4120.3550.4410.4810.5420.5230.4420.446
Chuzhou0.2230.2330.2910.2000.3120.2600.3590.3400.3120.4750.5370.5810.4100.416
Ma’anshan0.2210.3610.3060.4840.3350.4880.3920.5460.4770.6600.7470.8410.5750.591
Xuancheng0.1540.2030.1940.2830.2240.3520.2960.4000.3540.4960.4830.6440.4210.433
Huangshan0.0740.1920.1270.2640.1250.2940.1640.3330.1580.4560.1850.5340.2940.307
East0.1560.1970.2040.2630.2300.3120.2800.3620.3030.4800.4400.5800.3860.397
Hefei0.3590.2690.4450.4260.5030.5520.5630.6130.6290.7190.8650.7190.6530.665
Wuhu0.3880.2620.4660.4010.5350.4990.6260.6050.6920.7080.9680.8650.7010.712
Tongling0.3890.4460.4470.6280.3970.3680.3630.4870.5030.4610.6590.6590.4940.505
Huainan0.0810.1580.1720.2400.1380.1440.1170.2400.0970.2590.1520.3290.1880.195
Center0.3040.2840.3820.4240.3930.3910.4170.4870.4800.5370.6610.6430.5090.519
Huaibei0.1310.1300.2140.1620.2180.1960.2110.3270.2180.3740.3040.4650.2970.304
Bozhou0.0390.0750.0550.0810.0770.1080.0980.1950.1020.2600.1450.2960.1770.185
Fuyang0.0240.0970.0410.1940.0620.1950.1110.2610.1150.3070.1710.3110.2010.209
Lu’an0.0330.0670.0900.1090.1070.1260.1350.2430.1390.2900.2470.3640.2150.224
Anqing0.0470.0790.0780.1180.1000.2320.1320.2950.1580.3690.2510.5610.2690.282
Chizhou0.0620.1780.1280.2880.1540.3520.1960.3420.2230.4650.2970.5630.3250.337
West0.0560.1040.1010.1590.1200.2020.1470.2770.1590.3440.2360.4270.2470.257
Average0.2070.2030.2690.2980.3070.3580.3550.4310.3830.5140.5530.5950.4470.457
Table 4. Degree of coupling and coupling coordination of the two systems.
YearCDStage of Coupling DegreeLevel of Coupling Coordination
20100.7990.374Breaking-in stageModerate coupling coordination
20110.7570.378Breaking-in stageModerate coupling coordination
20120.7820.421Breaking-in stageModerate coupling coordination
20130.8060.464High-level coupling stageModerate coupling coordination
20140.8040.486High-level coupling stageModerate coupling coordination
20150.8180.509High-level coupling stageHighly coupled coordination
20160.8200.529High-level coupling stageHighly coupled coordination
20170.8060.556High-level coupling stageHighly coupled coordination
20180.8110.580High-level coupling stageHighly coupled coordination
20190.7530.576Breaking-in stageHighly coupled coordination
20200.7960.616Breaking-in stageHighly coupled coordination
20210.7880.663Breaking-in stageHighly coupled coordination
Table 5. Predicted results of coupling and coordination of two systems in Anhui Province.
YearGM (1, 1)ARIMA
20220.6910.689
20230.7240.715
20240.7590.741
20250.7960.768
20260.8350.794
20270.8760.820
20280.9180.846
20290.9630.873
20301.0100.899
20311.0590.925
20321.1100.951
20331.1640.978
Table 6. Q statistic test.
ItemStatisticsp Value
Q10.0970.756
Q22.9590.228
Q32.9840.394
Q42.9850.560
Q53.0020.700
Q64.8310.566
Disclaimer/Publisher’s Note: The statements, opinions and data contained in all publications are solely those of the individual author(s) and contributor(s) and not of MDPI and/or the editor(s). MDPI and/or the editor(s) disclaim responsibility for any injury to people or property resulting from any ideas, methods, instructions or products referred to in the content.

