
Responses of the Leaf Water Physiology and Yield of Grapevine via Different Irrigation Strategies in Extremely Arid Areas
Abstract
:1. Introduction
2. Materials and Methods
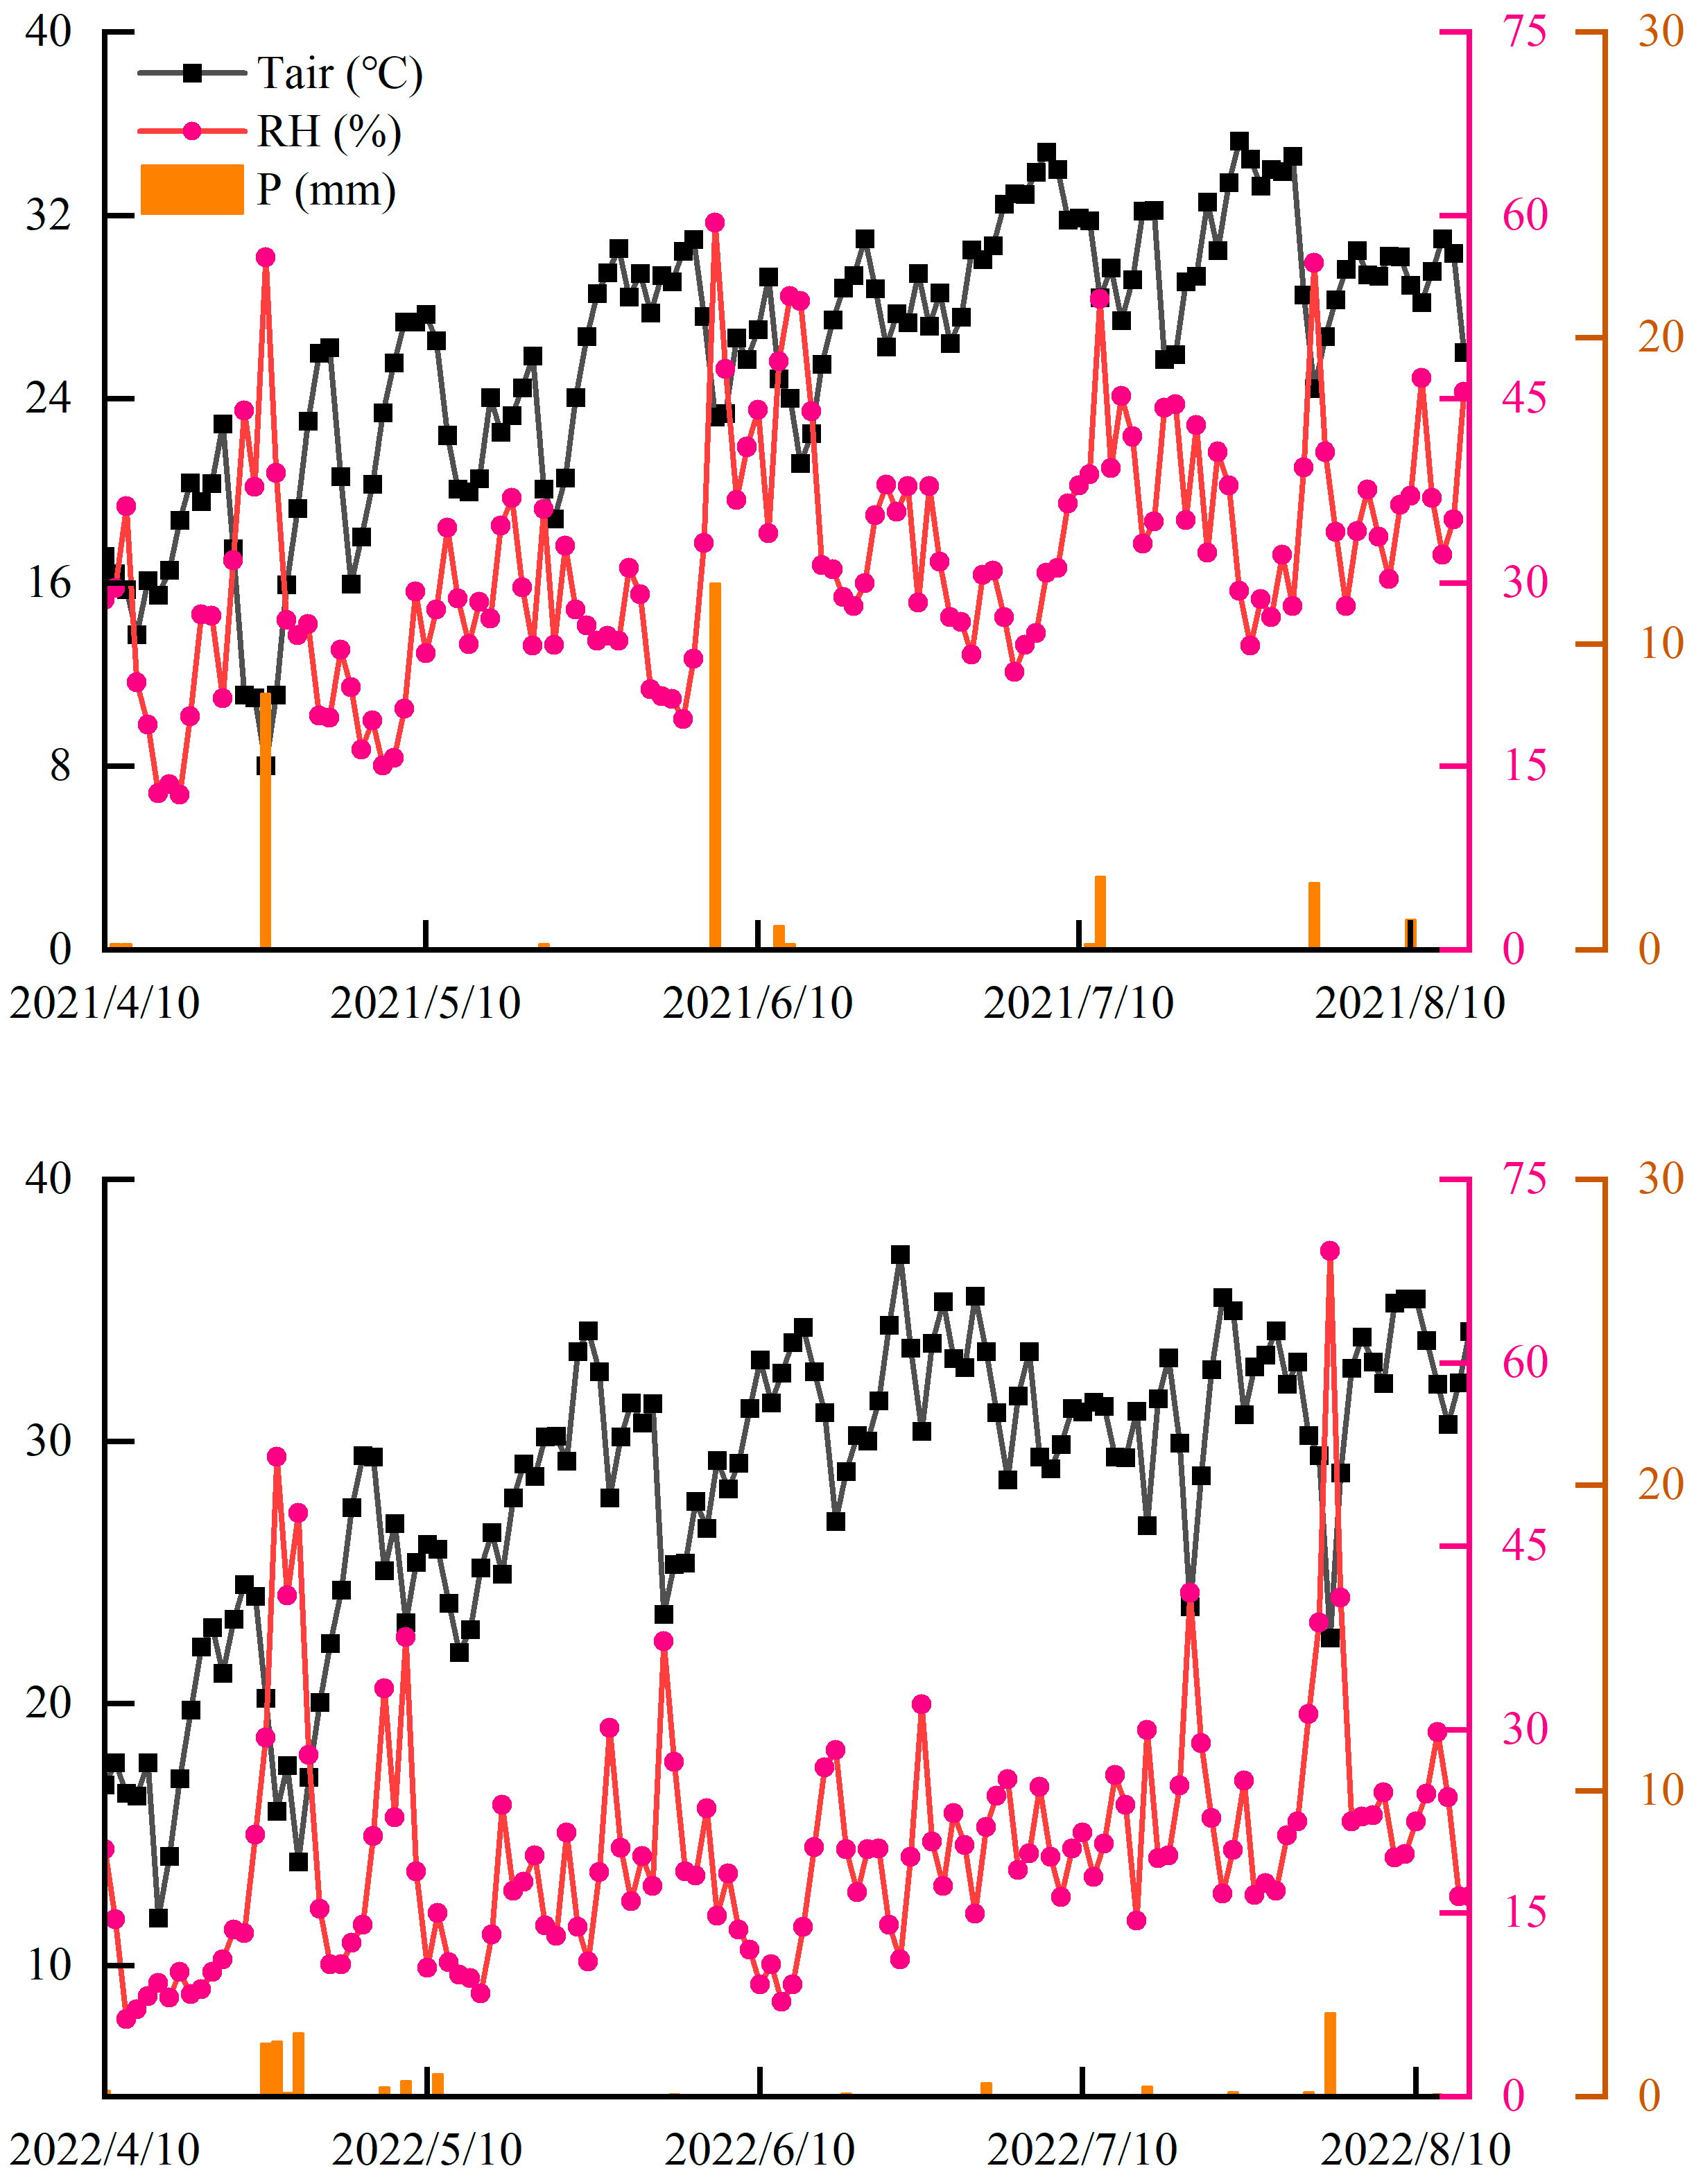
2.1. Experimental Site
2.2. Treatments and Irrigation Management
2.3. Measurement Indices and Methods
2.3.1. Soil Moisture
2.3.2. Leaf Water Potential and SPAD
2.3.3. Photosynthetic Data
2.3.4. Yield
2.4. Data Processing and Analysis
3. Results
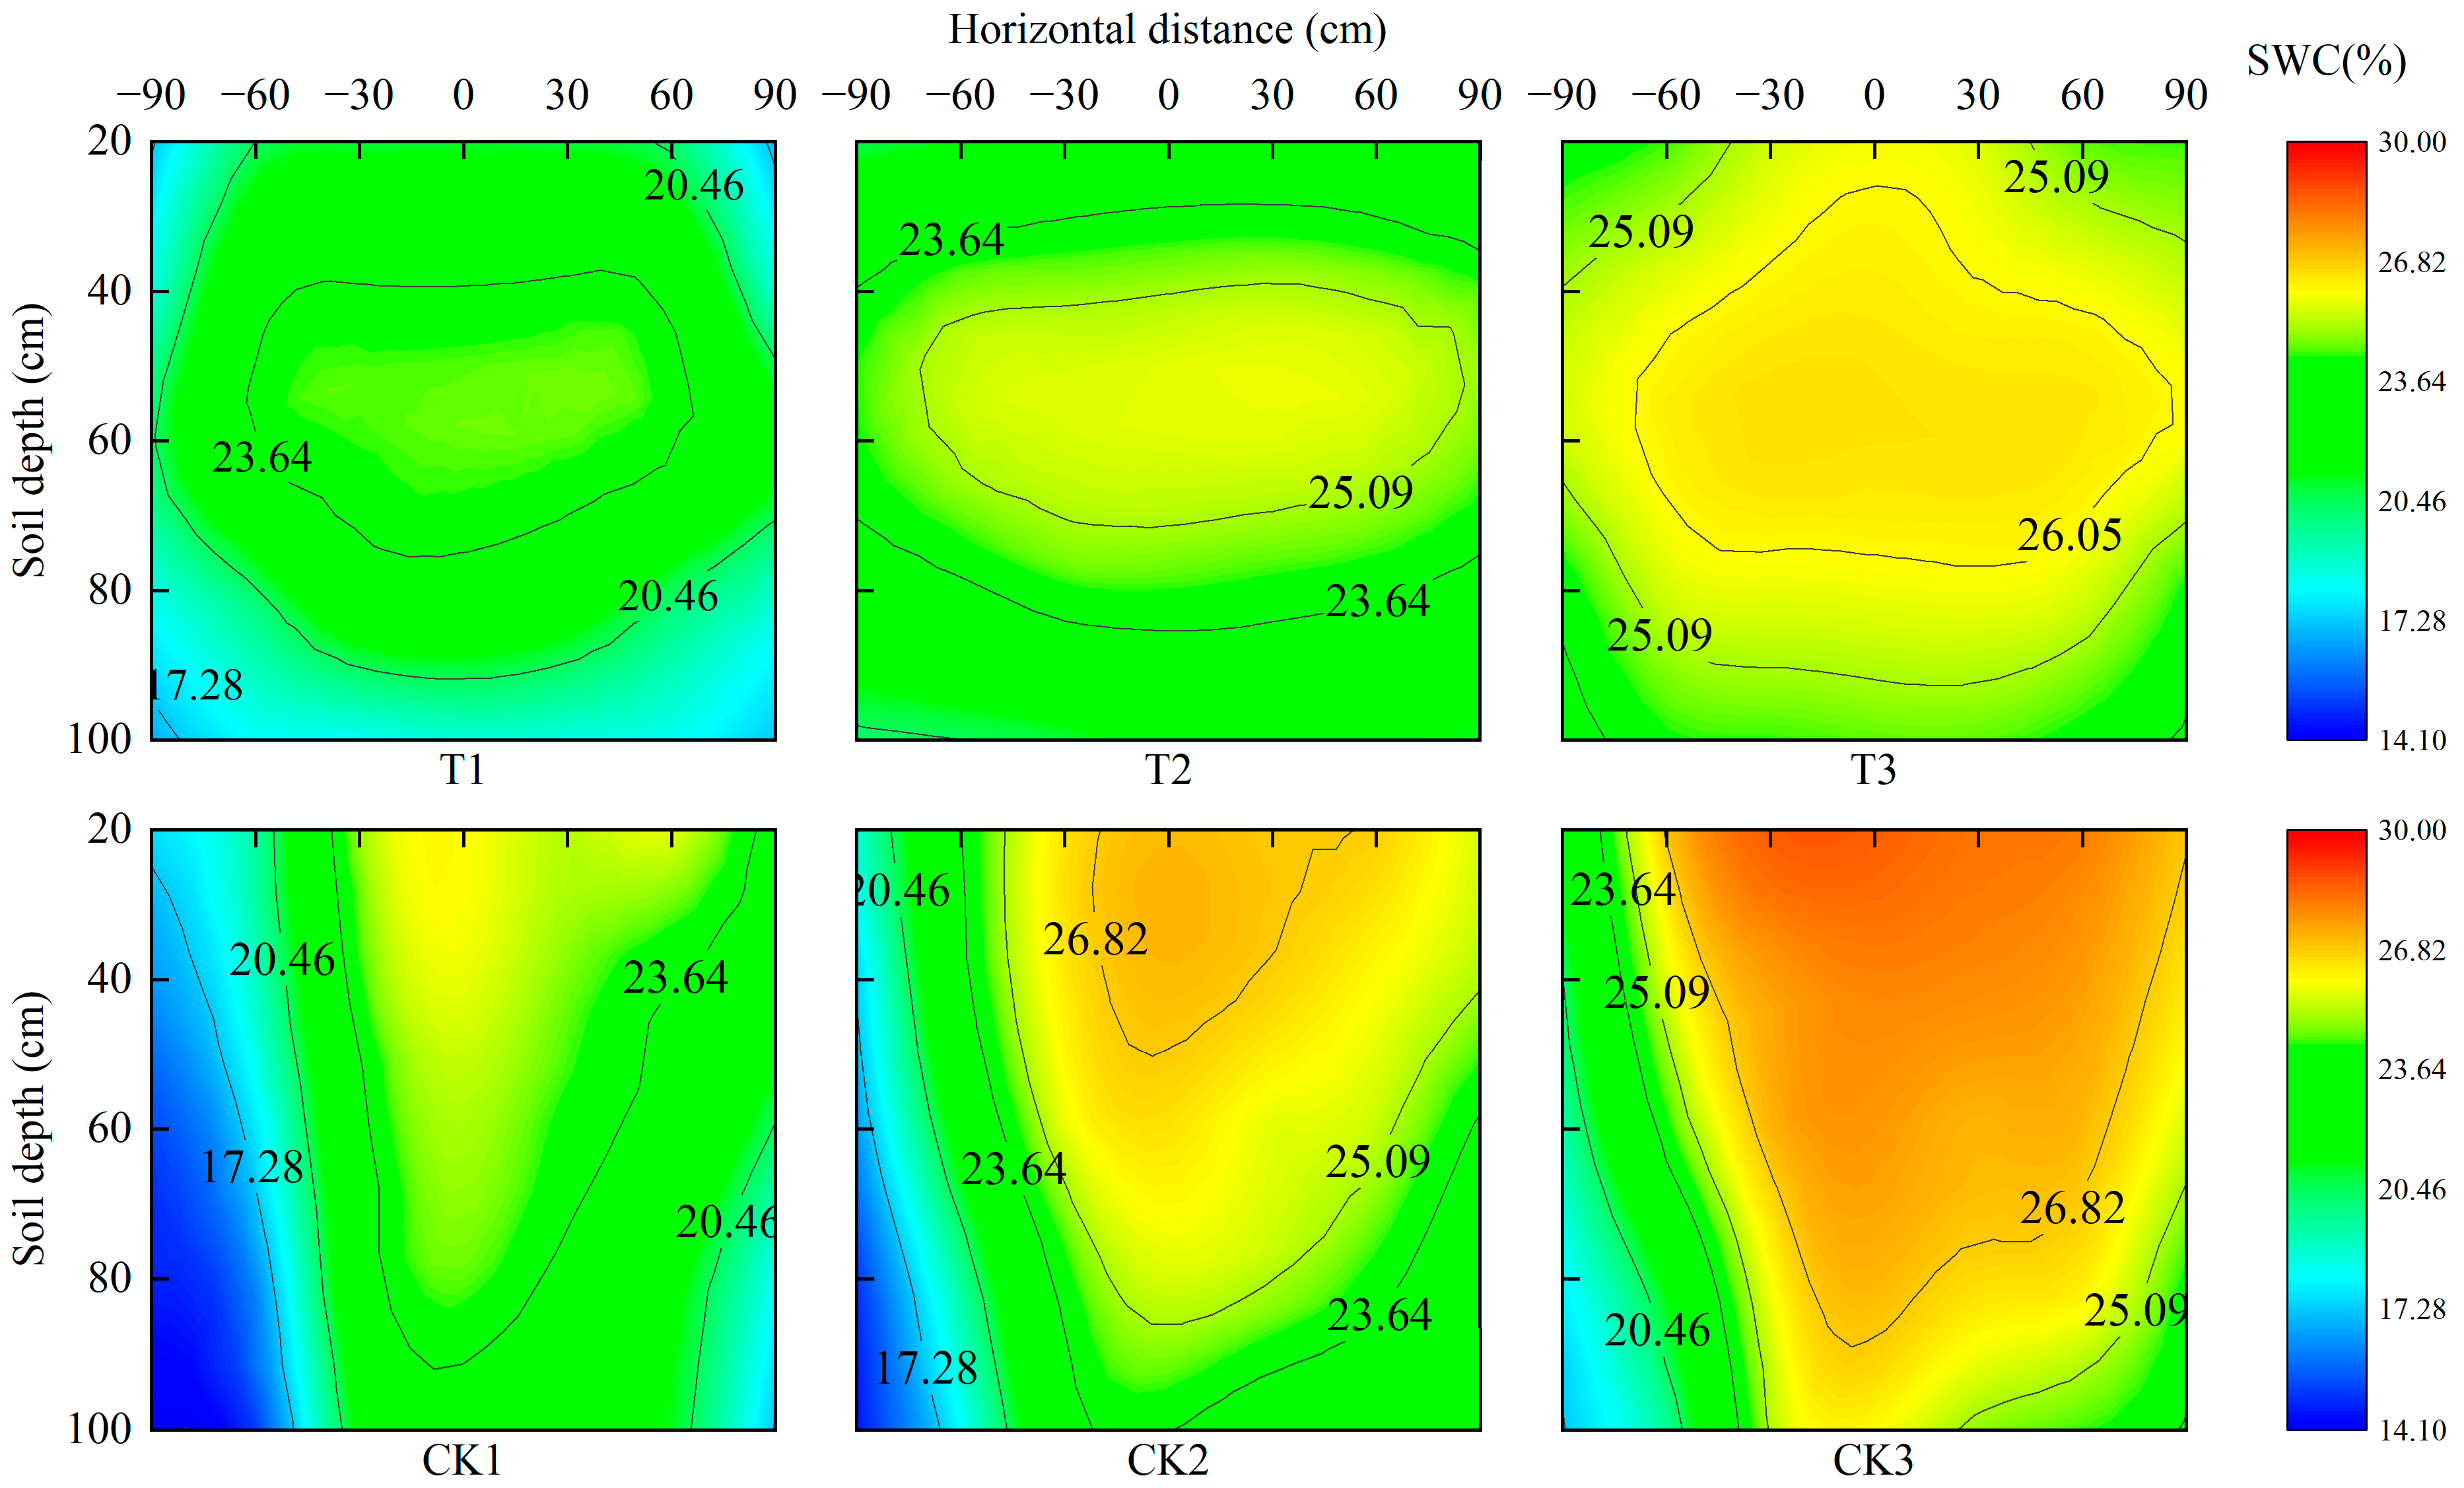
3.1. Soil Moisture
3.2. Leaf Physiology
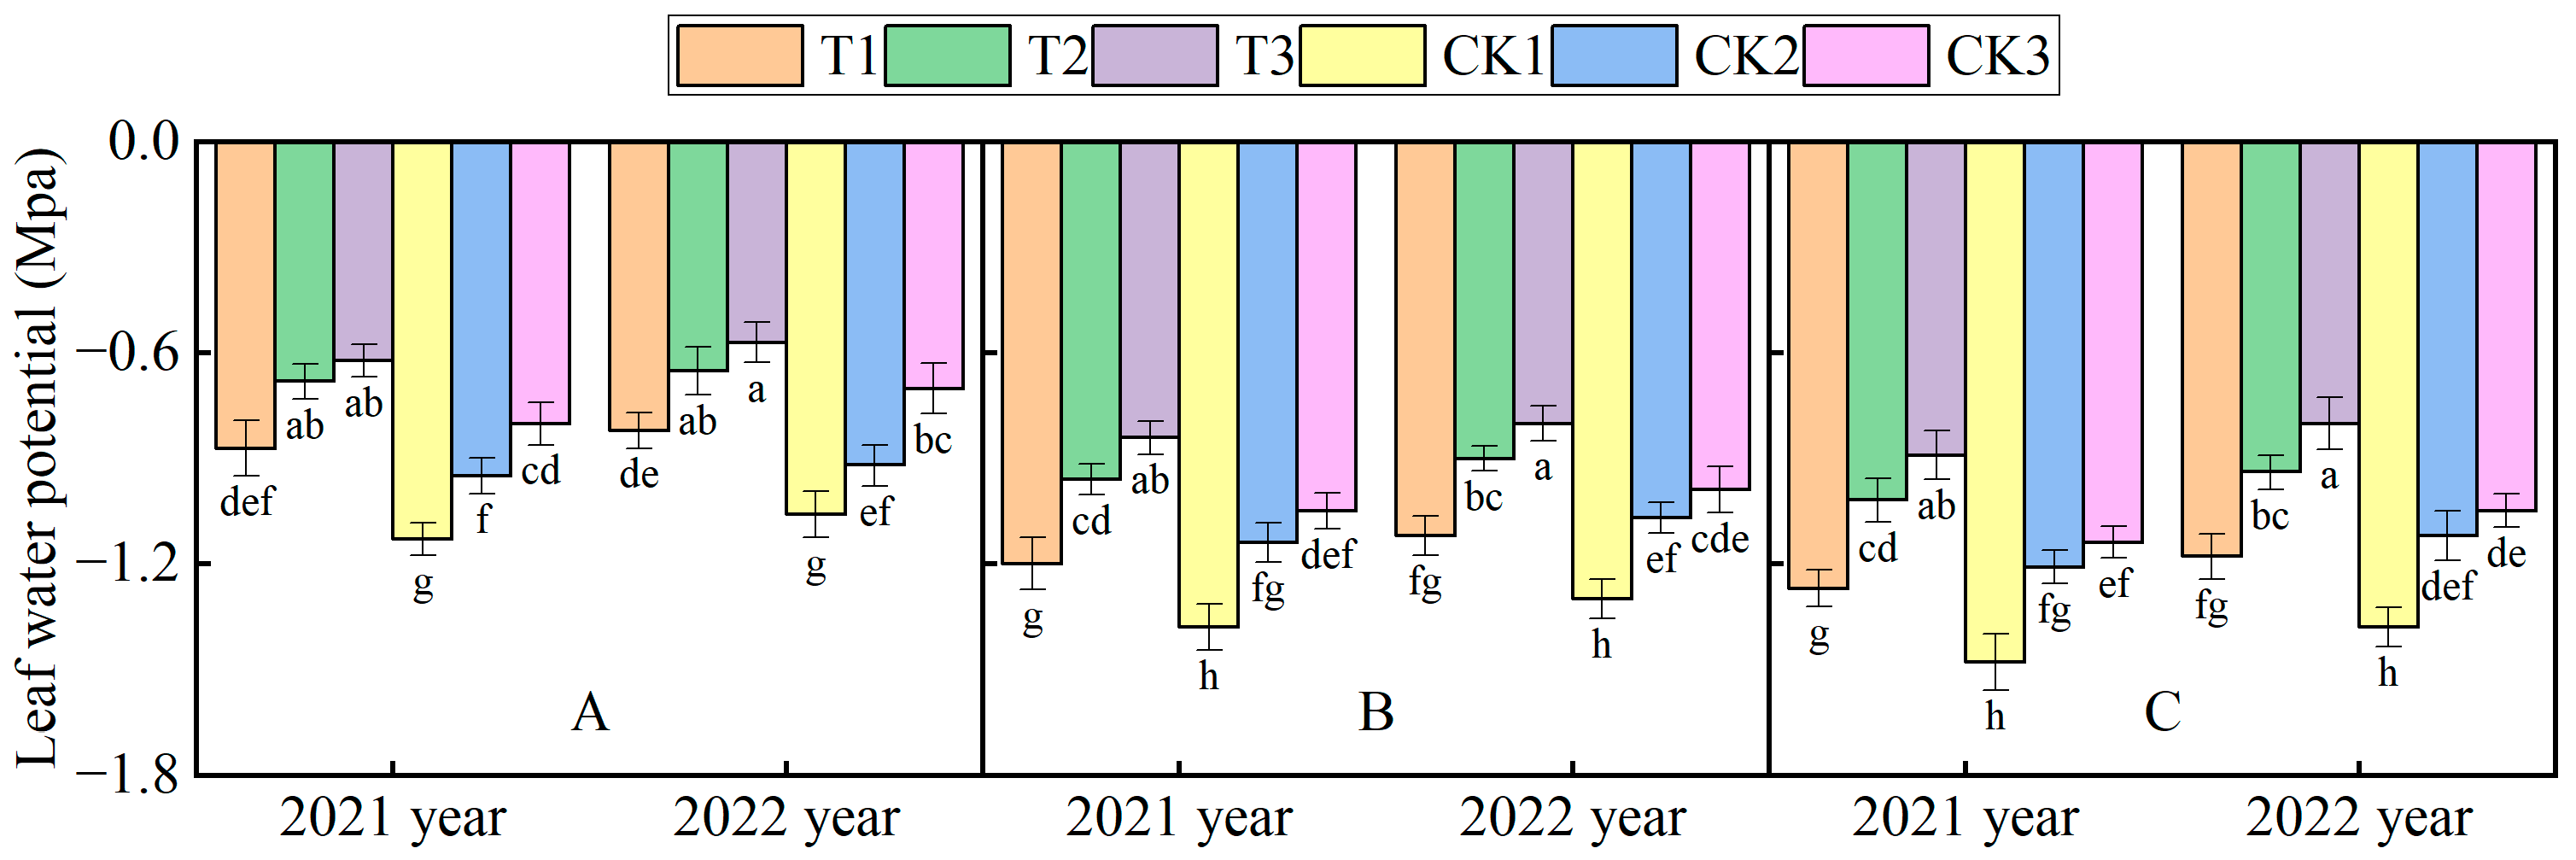
3.2.1. Leaf Water Potential
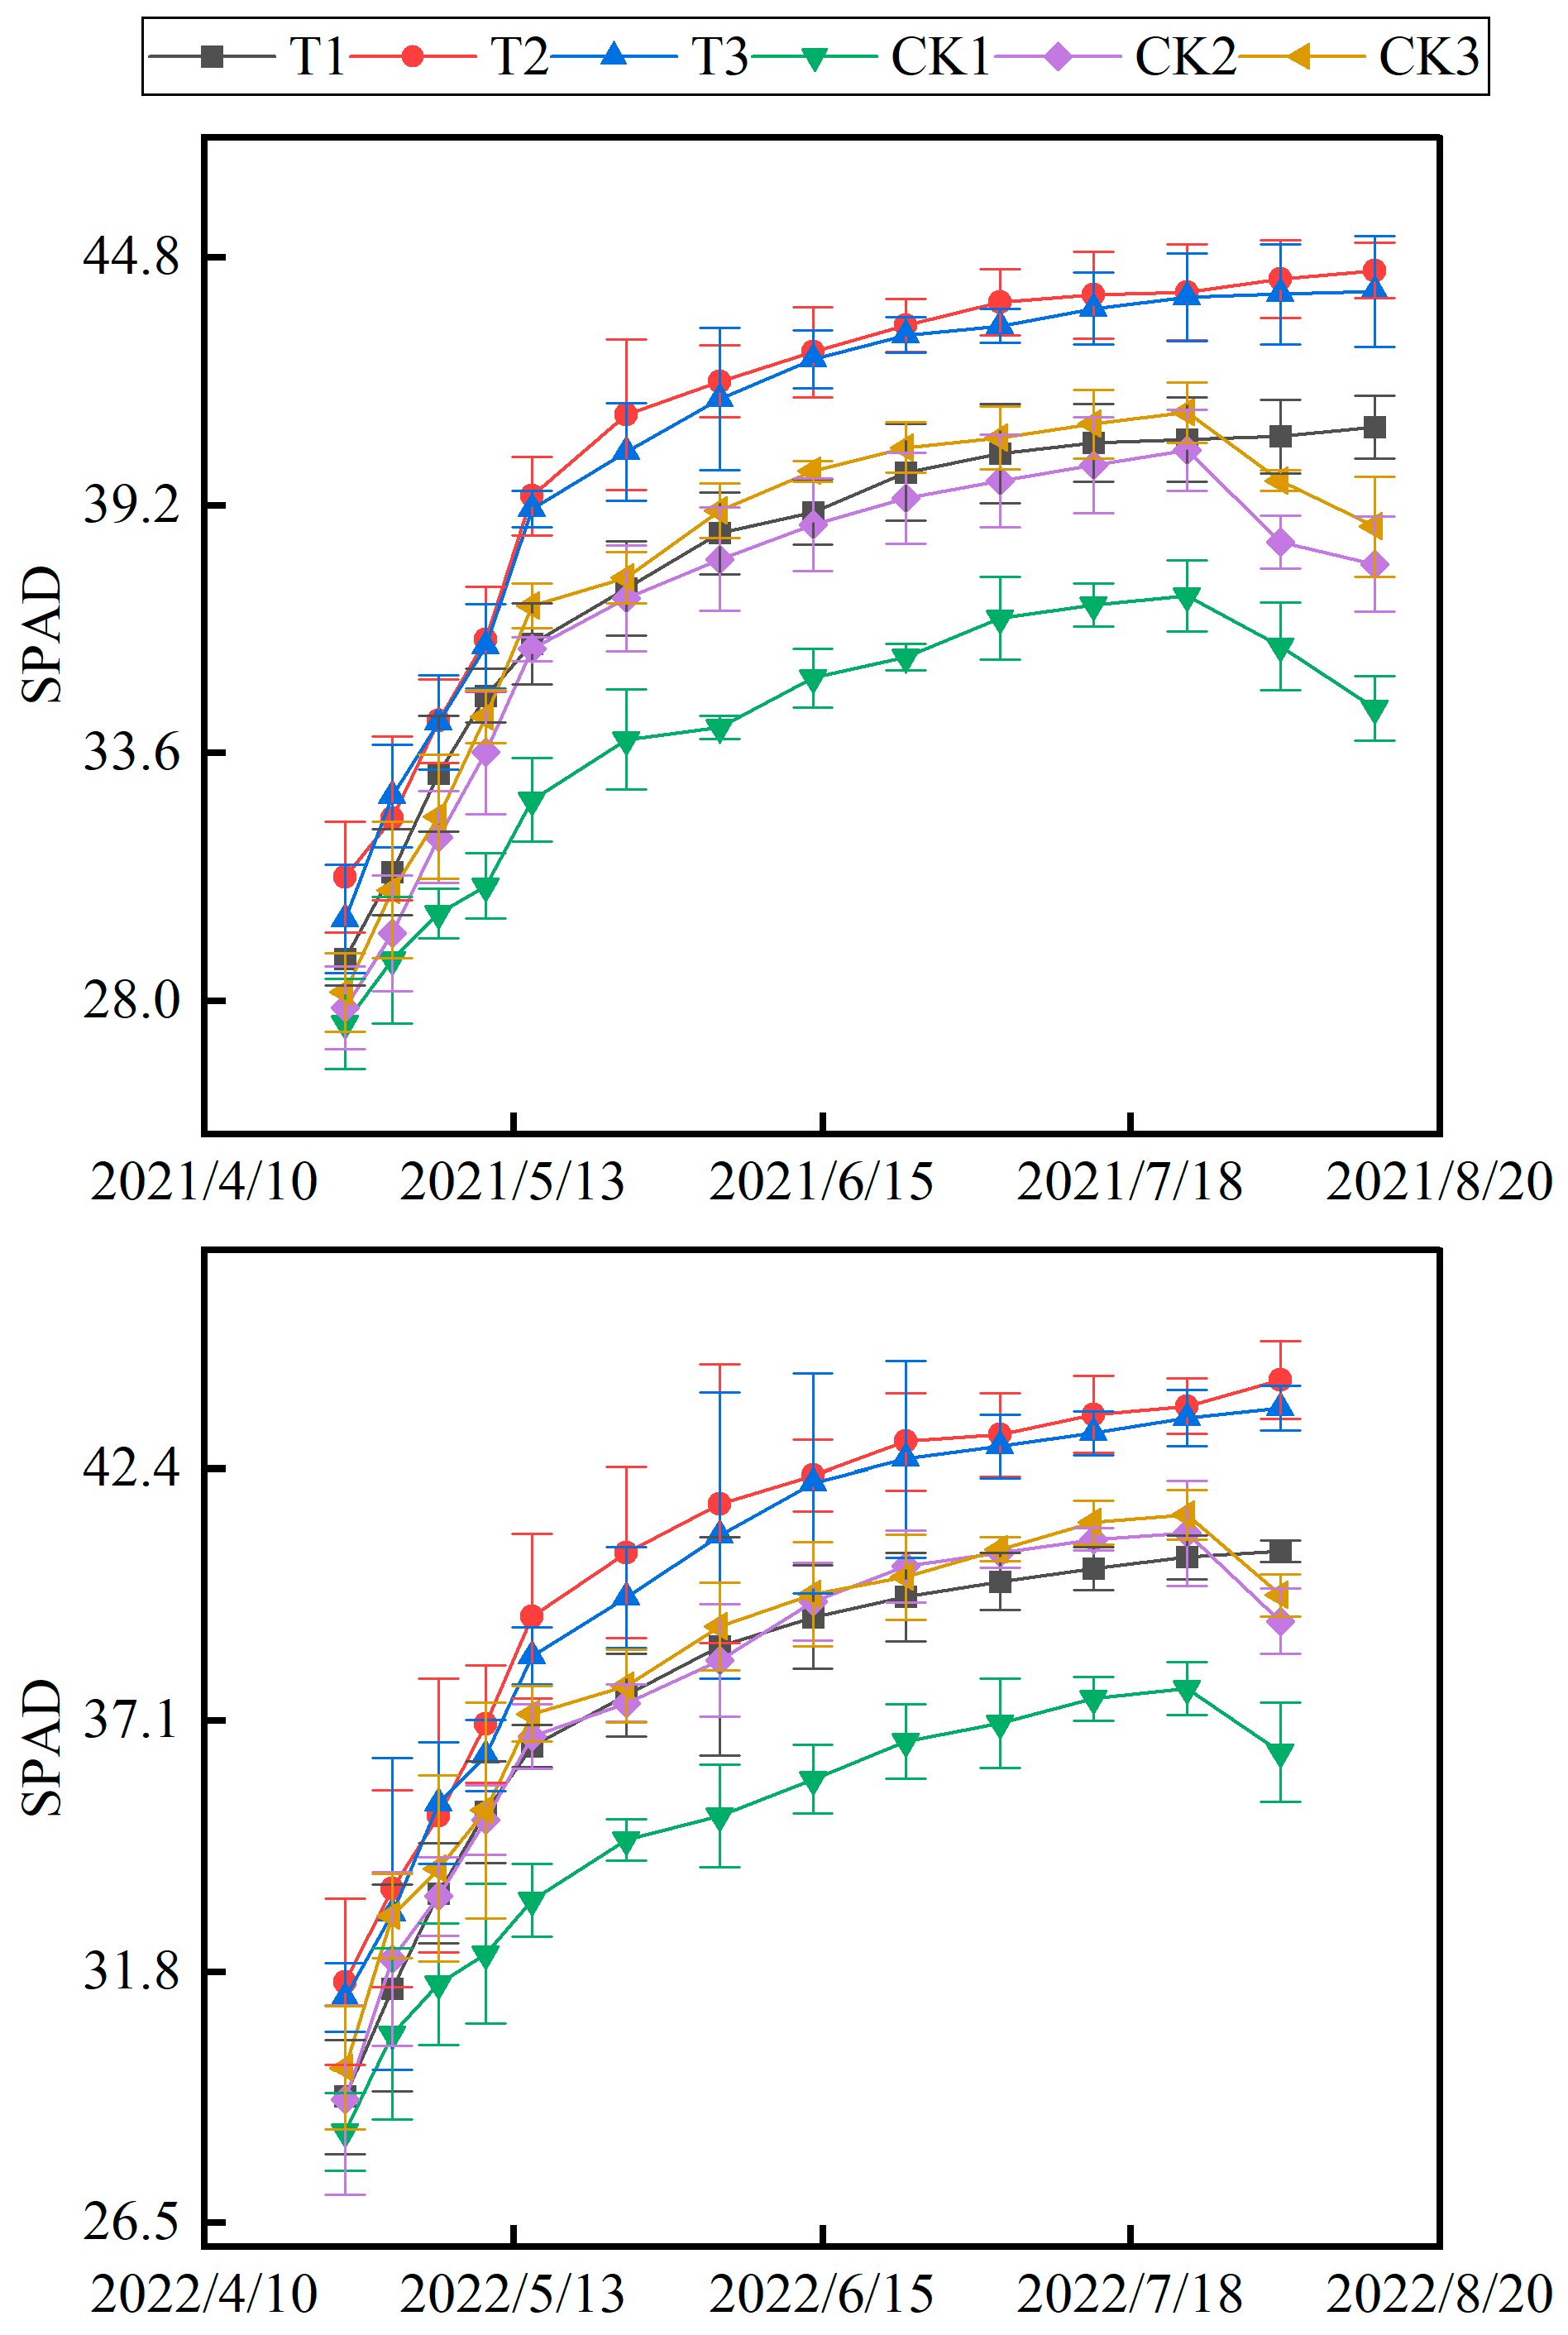
3.2.2. SPAD
3.2.3. Net Photosynthetic Rate
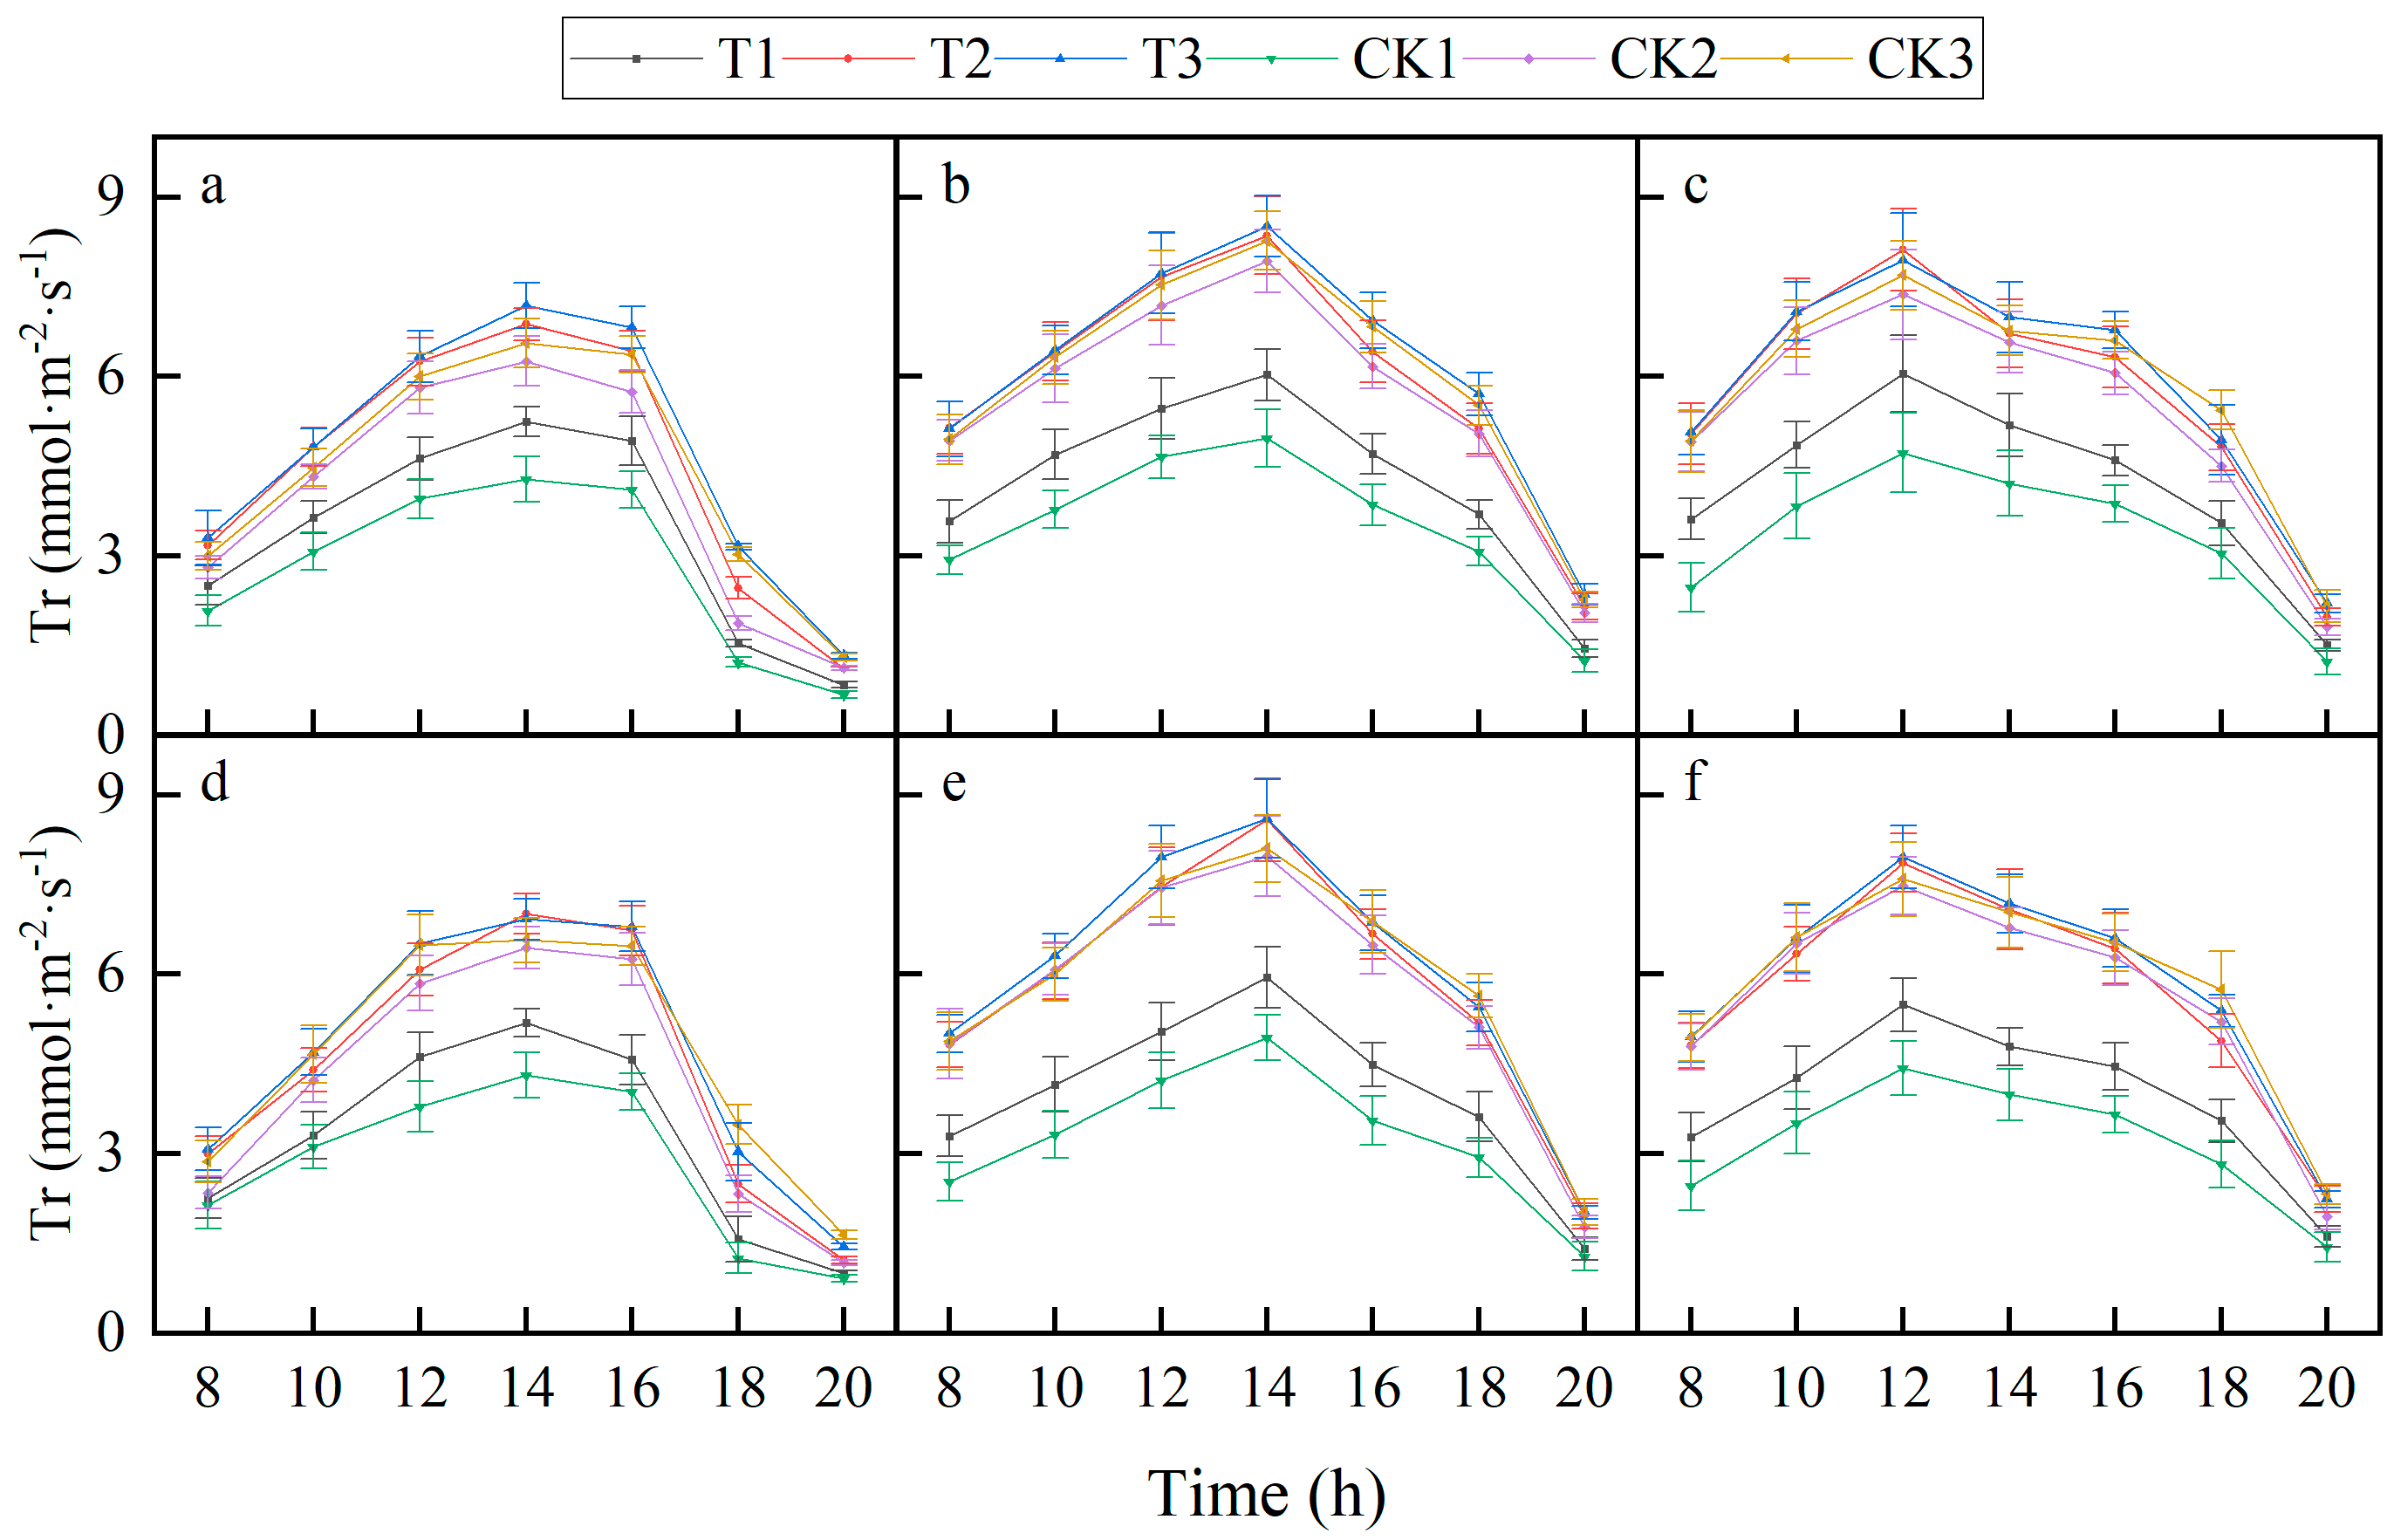
3.2.4. Transpiration Rate of Leaves
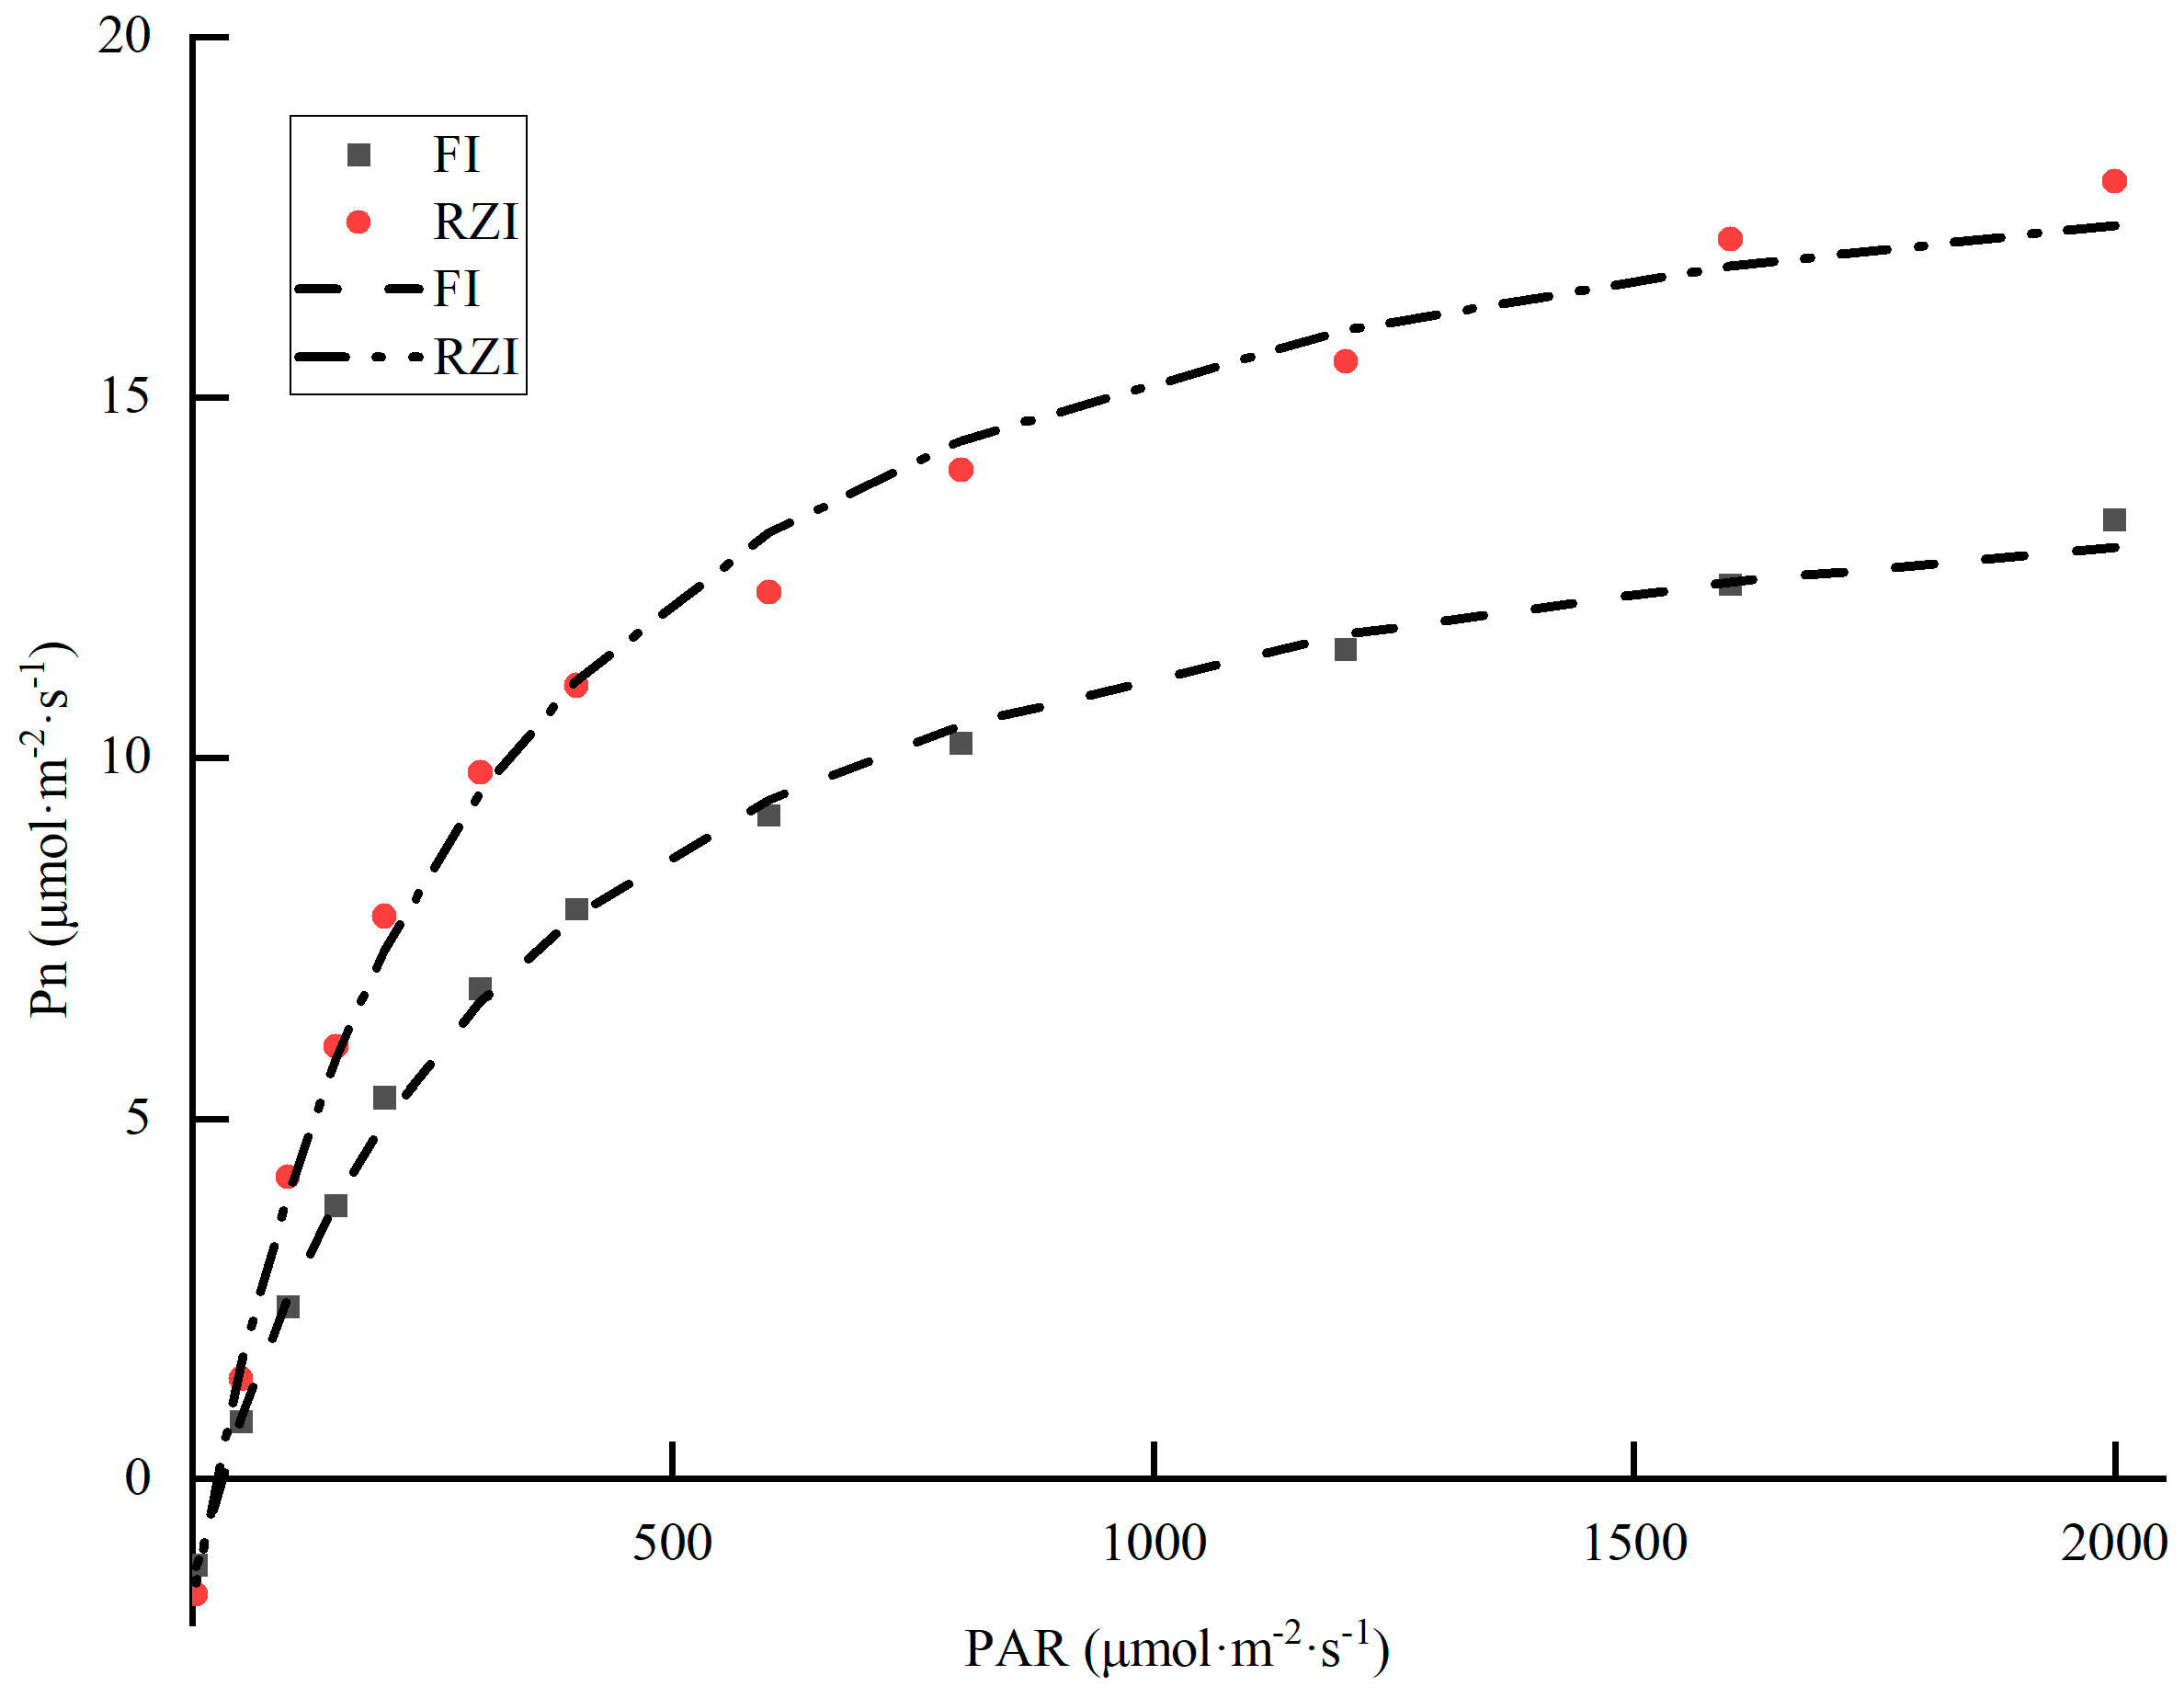
3.3. Light Response Curve
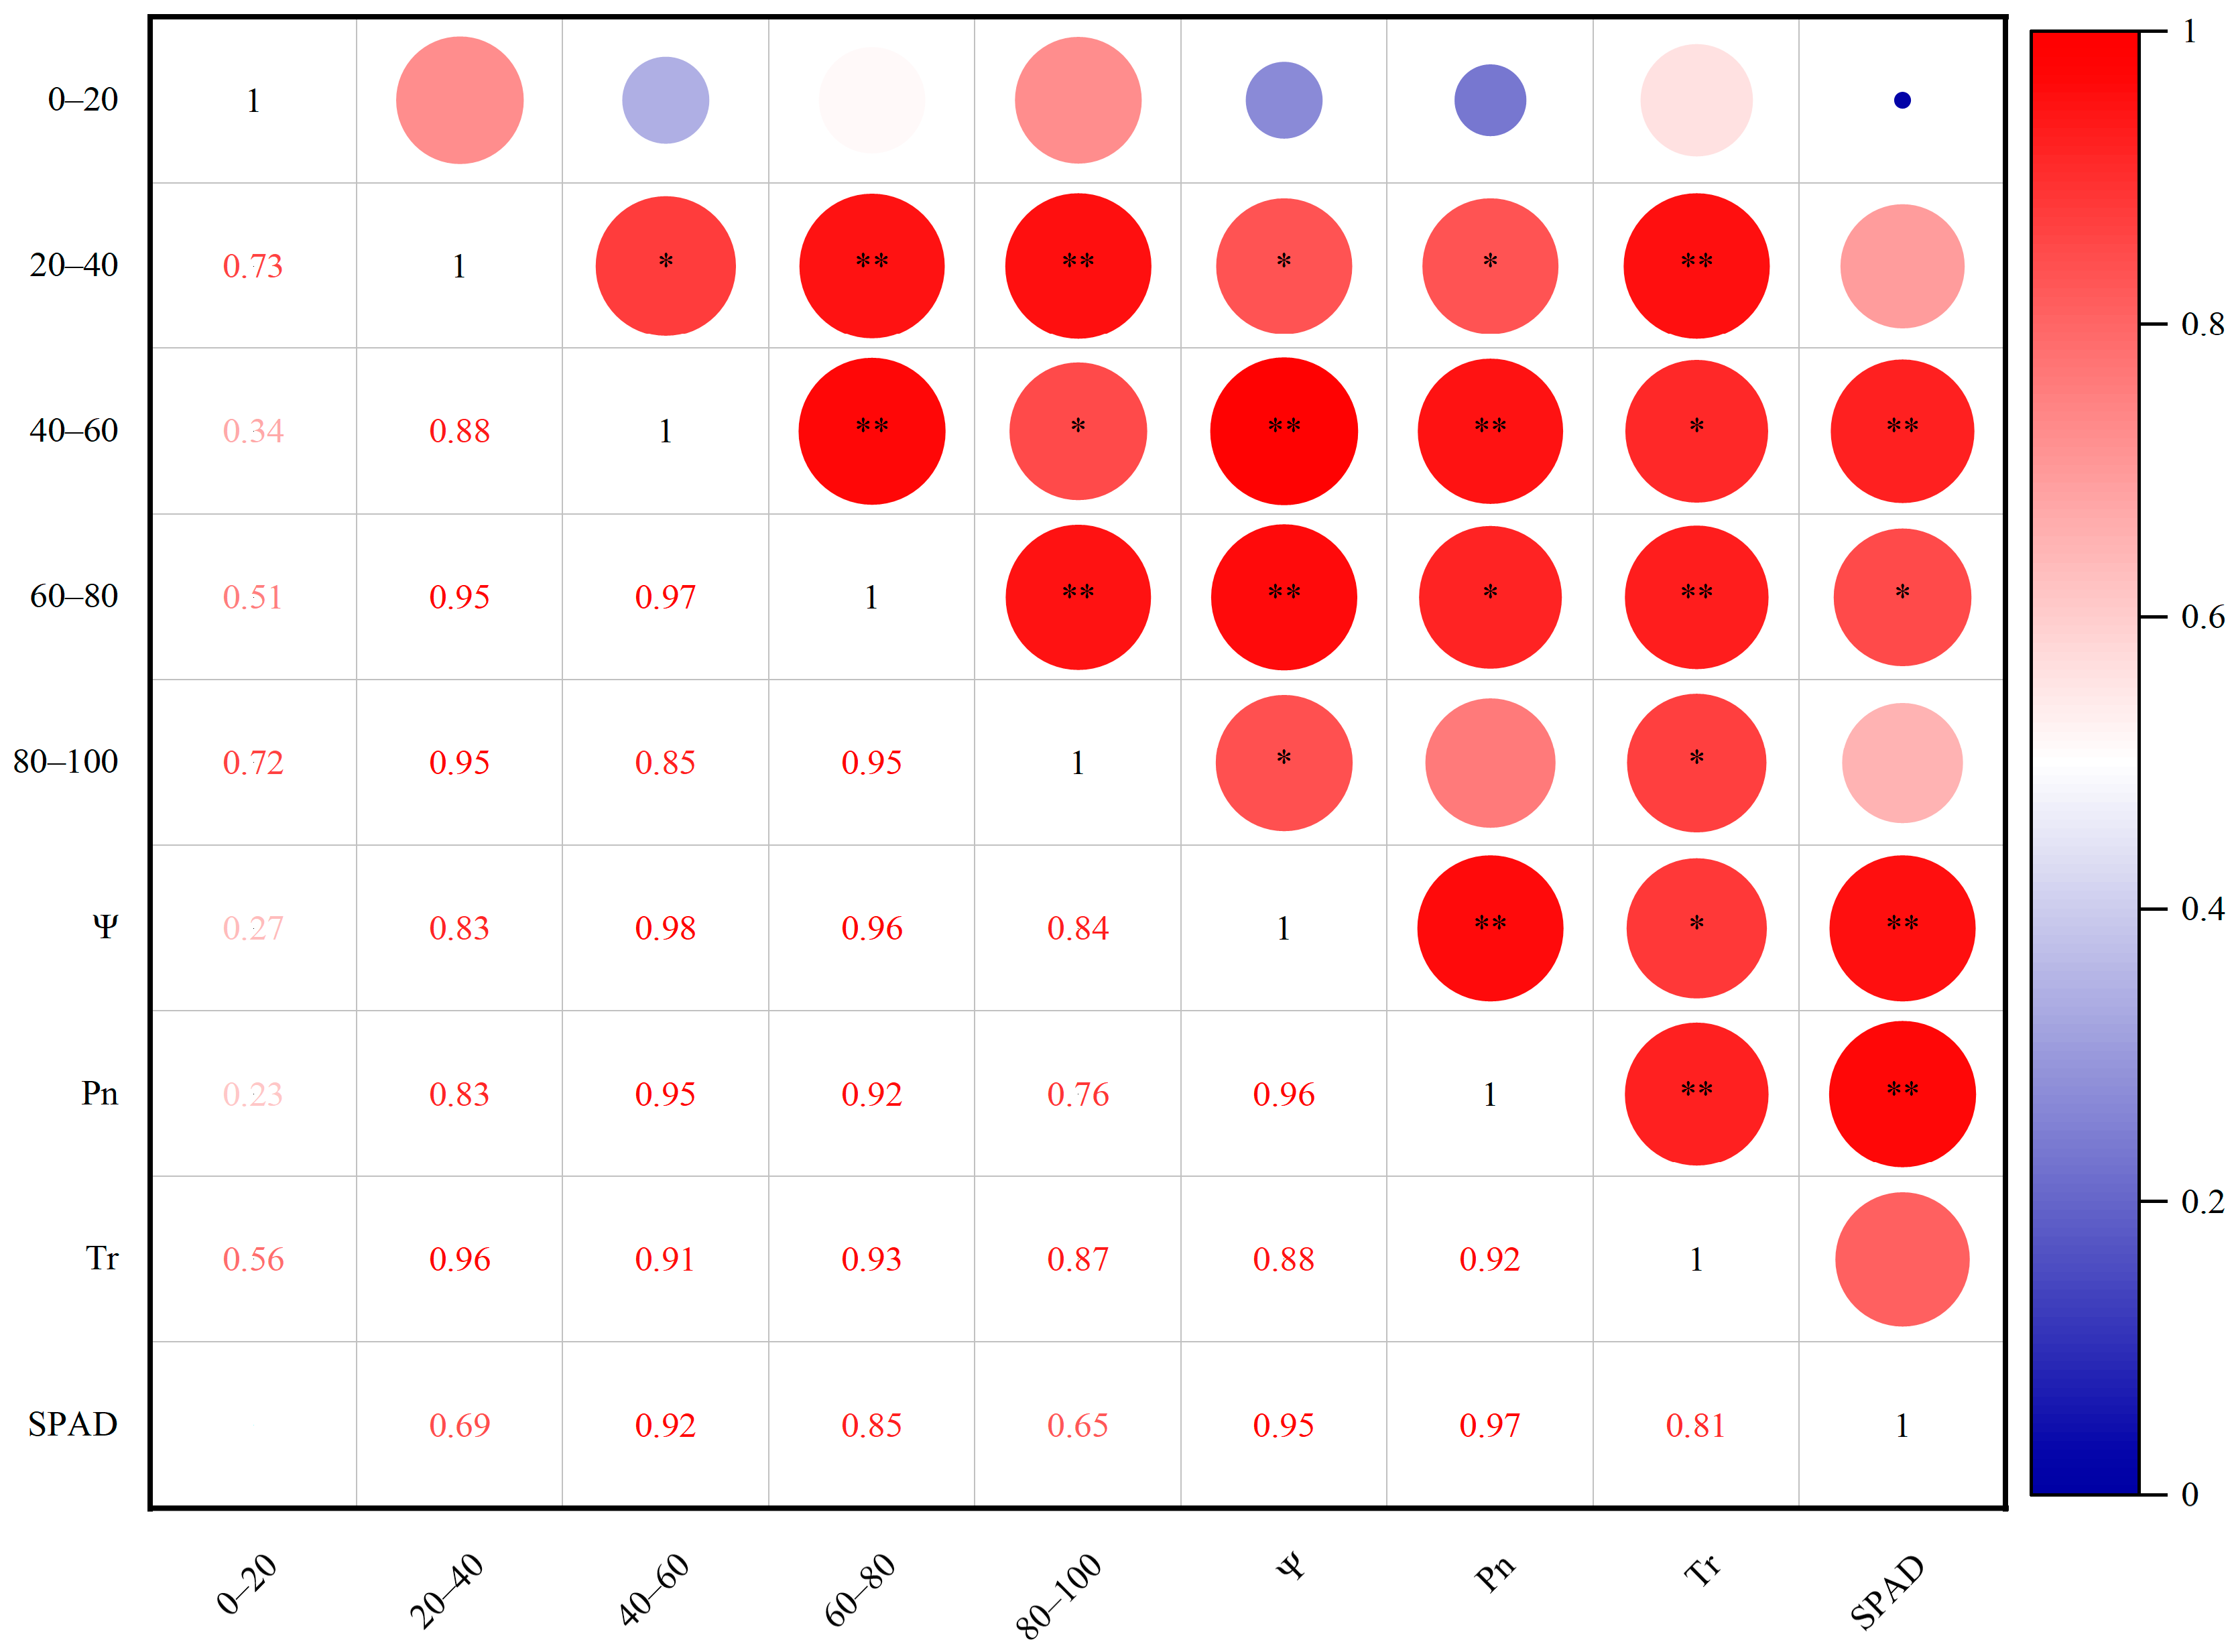
3.4. Correlation Analysis between Soil Moisture and Leaf Physiology
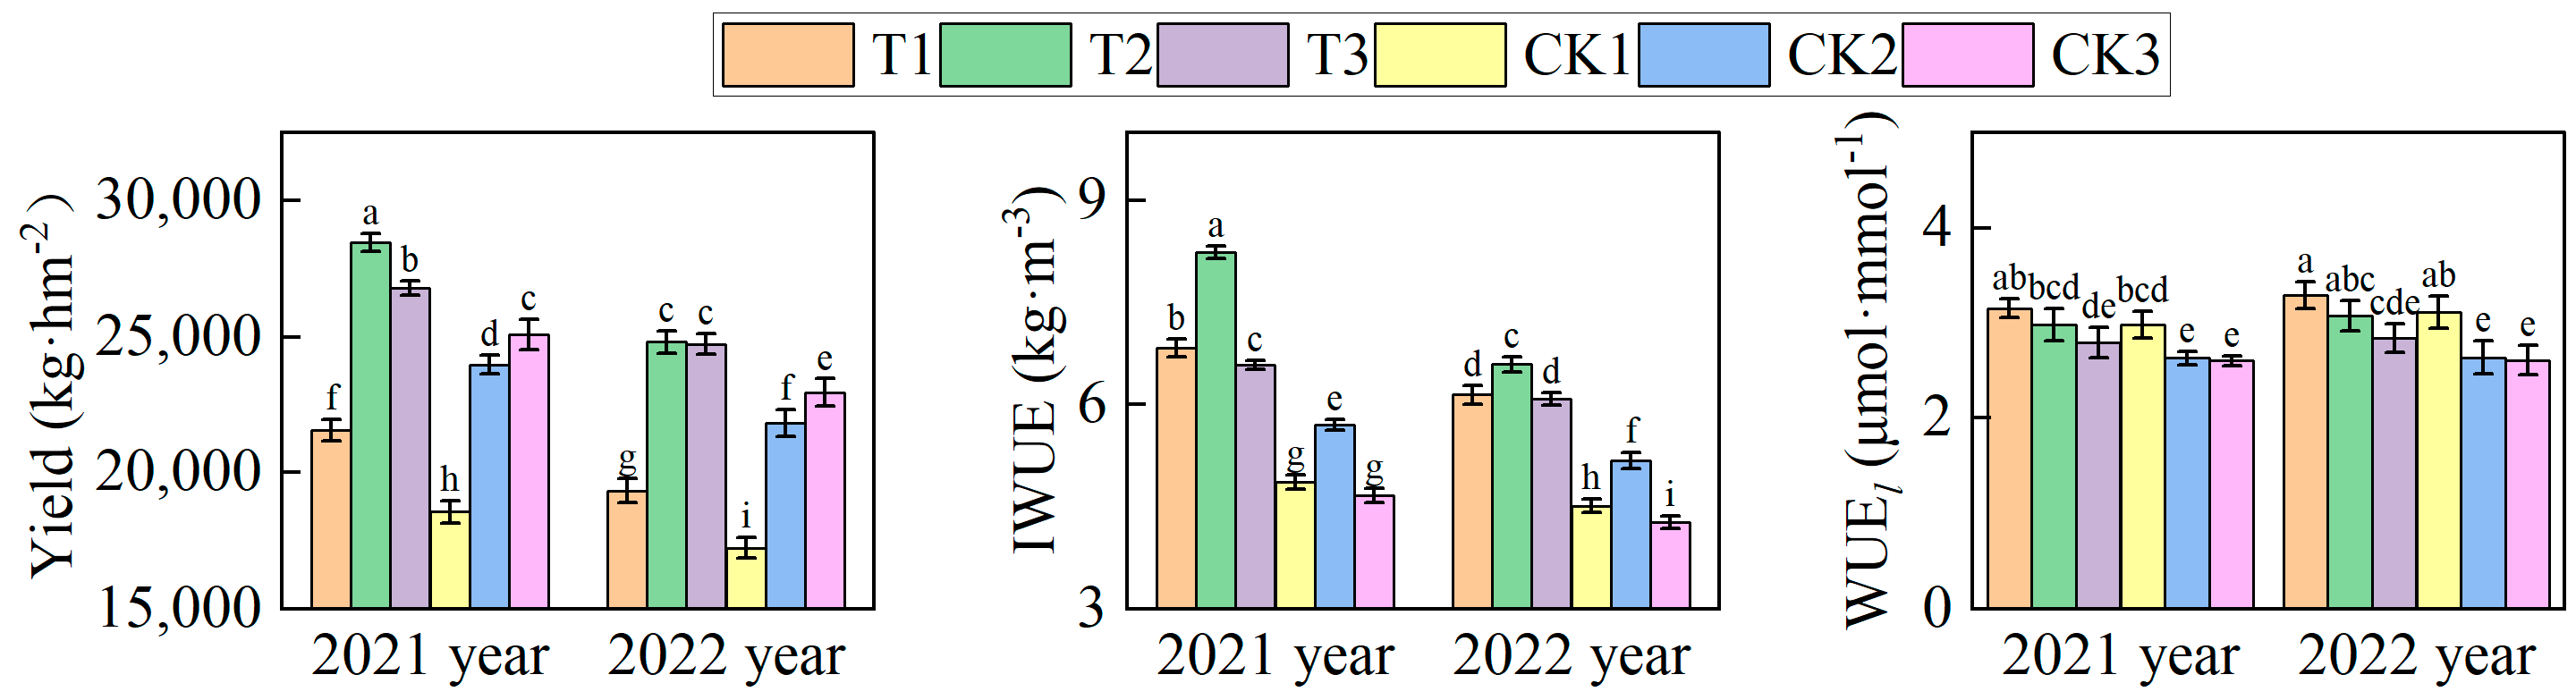
3.5. Yield, IWUE, and WUEl
4. Discussion
5. Conclusions
Author Contributions
Funding
Institutional Review Board Statement
Informed Consent Statement
Data Availability Statement
Acknowledgments
Conflicts of Interest
References
- Wang, T.Y.; Wang, Z.H.; Guo, L.; Zhang, J.Z.; Li, W.H.; He, H.J.; Zong, R.; Wang, D.W.; Jia, Z.C.; Wen, Y. Experiences and challenges of agricultural development in an artificial oasis: A review. Agric. Syst. 2021, 193, 103220. [Google Scholar] [CrossRef]
- Li, X.X.; Liu, H.G.; Li, J.; He, X.L.; Gong, P.; Lin, E.; Li, K.M.; Li, L.; Binley, A. Experimental study and multi-objective optimization for drip irrigation of grapes in arid areas of northwest china. Agric. Water Manag. 2020, 232, 106039. [Google Scholar] [CrossRef]
- Kucukyumuk, C.; Kacal, E.; Ertek, A.; Ozturk, G.; Kurttas, Y.S.K. Pomological and vegetative changes during transition from flood irrigation to drip irrigation: Starkrimson delicious apple variety. Sci. Hortic. 2012, 136, 17–23. [Google Scholar] [CrossRef]
- Li, Z.; Zong, R.; Wang, T.; Wang, Z.; Zhang, J. Adapting root distribution and improving water use efficiency via drip irrigation in a jujube (Zizyphus jujube Mill.) orchard after long-term flood irrigation. Agriculture 2021, 11, 1184. [Google Scholar] [CrossRef]
- Cheng, M.; Wang, H.; Fan, J.; Zhang, S.; Liao, Z.; Zhang, F.; Wang, Y. A global meta-analysis of yield and water use efficiency of crops, vegetables and fruits under full, deficit and alternate partial root-zone irrigation. Agric. Water Manag. 2021, 248, 106771. [Google Scholar] [CrossRef]
- Chen, X.; Qi, Z.; Gui, D.; Sima, M.W.; Zeng, F.; Li, L.; Li, X.; Feng, S. Responses of cotton photosynthesis and growth to a new irrigation control method under deficit irrigation. Field Crop. Res. 2022, 275, 108373. [Google Scholar] [CrossRef]
- Kagotani, Y.; Nishida, K.; Kiyomizu, T.; Sasaki, K.; Kume, A.; Hanba, Y.T. Photosynthetic responses to soil water stress in summer in two japanese urban landscape tree species (Ginkgo biloba and Prunus yedoensis): Effects of pruning mulch and irrigation management. Trees 2016, 30, 697–708. [Google Scholar] [CrossRef]
- Li, X.; Yang, J.; Jia, H.; Lv, Q.; Sha, R.; Yao, D.; Wu, L.; Zhang, H.; Wang, F.; Fesobi, O.P.; et al. Impact of fruit tree hole storage brick treatment on the growth of grape seedlings and water transport in the root zone under root restriction and subsurface drip irrigation. Sci. Hortic. 2023, 308, 111552. [Google Scholar] [CrossRef]
- Rodrigues, P.; Pedroso, V.; Gouveia, J.P.; Martins, S.; Lopes, C.; Alves, I. Influence of soil water content and atmospheric conditions on leaf water potential in cv. “Touriga nacional” deep-rooted vineyards. Irrig. Sci. 2012, 30, 407–417. [Google Scholar] [CrossRef]
- Pratima, P.; Sharma, N.; Sharma, D.P. Canopy temperature and water relations of kiwifruit cultivar allison in response to deficit irrigation and in situ moisture conservation. Curr. Sci. 2016, 111, 375–379. [Google Scholar] [CrossRef]
- Wang, Y.; Bertelsen, M.G.; Petersen, K.K.; Andersen, M.N.; Liu, F. Effect of root pruning and irrigation regimes on leaf water relations and xylem aba and ionic concentrations in pear trees. Agric. Water Manag. 2014, 135, 84–89. [Google Scholar] [CrossRef]
- Aishah, H.S.; Saberi, A.R.; Halim, R.A.; Zaharah, A.R. Photosynthetic responses of forage sorghums to salinity and irrigation frequency. J. Food Agric. Environ. 2011, 9, 566–569. [Google Scholar]
- Kamiloglu, O.; Sakaroglu, N. Effects of kaolin and deficit irrigation treatments on sirah grape variety in mediterranean, turkey. Fresenius Environ. Bull. 2022, 31, 9475–9486. [Google Scholar]
- Venturi, M.; Manfrini, L.; Perulli, G.D.; Boini, A.; Bresilla, K.; Corelli Grappadelli, L.; Morandi, B. Deficit irrigation as a tool to optimize fruit quality in abbe fetel pear. Agronomy 2021, 11, 1141. [Google Scholar] [CrossRef]
- Cabral, I.L.; Carneiro, A.; Nogueira, T.; Queiroz, J. Regulated deficit irrigation and its effects on yield and quality of Vitis vinifera L., Touriga Francesa in a hot climate area (Douro Region, Portugal). Agriculture 2021, 11, 774. [Google Scholar] [CrossRef]
- Hou, Y.; Wang, Z.; Ding, H.; Li, W.; Wen, Y.; Zhang, J.; Dou, Y. Evaluation of suitable amount of water and fertilizer for mature grapes in drip irrigation in extreme arid regions. Sustainability 2019, 11, 2063. [Google Scholar] [CrossRef]
- Sun, G.Z.; Liu, X.G.; Yang, Q.L.; Wang, X.K.; Cui, N.B. Alternate infiltration irrigation improves photosynthetic characteristics and water use efficiency in mango seedlings. J. Plant Growth Regul. 2021, 41, 1138–1147. [Google Scholar] [CrossRef]
- Yu, W.; Ji, R.; Jia, Q.; Feng, R.; Wu, J.; Zhang, Y. Vertical distribution characteristics of photosynthetic parameters for phragmites australis in Liaohe river delta wetland, China. J. Freshw. Ecol. 2017, 32, 557–573. [Google Scholar] [CrossRef]
- Deng, X.; Shi, Z.; Zeng, L.; Lei, L.; Xin, X.; Pei, S.; Xiao, W. Photosynthetic product allocations to the organs of Pinus massoniana are not affected by differences in synthesis or temporal variations in translocation rates. Forests 2021, 12, 471. [Google Scholar] [CrossRef]
- Pinnamaneni, S.R.; Anapalli, S.S.; Reddy, K.N. Photosynthetic response of soybean and cotton to different irrigation regimes and planting geometries. Front. Plant Sci. 2022, 13, 894706. [Google Scholar] [CrossRef]
- Ashrafi, N.; Nikbakht, A.; Gheysari, M. Effect of recycled water applied by surface and subsurface irrigation on the growth, photosynthetic indices and nutrient content of young olive trees in central Iran. J. Water Reuse Desalin. 2017, 7, 246–252. [Google Scholar] [CrossRef]
- Baronti, S.; Vaccari, F.P.; Miglietta, F.; Calzolari, C.; Lugato, E.; Orlandini, S.; Pini, R.; Zulian, C.; Genesio, L. Impact of biochar application on plant water relations in Vitis vinifera (L.). Eur. J. Agron. 2014, 53, 38–44. [Google Scholar] [CrossRef]
- Lu, J.; Ma, L.; Hu, T.; Geng, C.; Yan, S. Deficit drip irrigation based on crop evapotranspiration and precipitation forecast improves water- use efficiency and grain yield of summer maize. J. Sci. Food Agric. 2022, 102, 653–663. [Google Scholar] [CrossRef] [PubMed]
- Li, Y.; Zhang, M.; Lu, Z.; Zhang, Y.; Wang, J. Effects of irrigation strategy and plastic film mulching on soil N2O emissions and fruit yields of greenhouse tomato. Agriculture 2022, 12, 296. [Google Scholar] [CrossRef]
- Abolafia-Rosenzweig, R.; Badger, A.M.; Small, E.E.; Livneh, B. A continental-scale soil evaporation dataset derived from soil moisture active passive satellite drying rates. Sci. Data 2020, 7, 406. [Google Scholar] [CrossRef] [PubMed]
- Li, T.; Zhang, J.F. Effect of pit irrigation on soil water content, vigor, and water use efficiency within vineyards in extremely arid regions. Sci. Hortic. 2017, 218, 30–37. [Google Scholar] [CrossRef]
- Medrano, H.; Escalona, J.M.; Cifre, J.; Bota, J.; Flexas, J. A ten-year study on the physiology of two Spanish grapevine cultivars under field conditions: Effects of water availability from leaf photosynthesis to grape yield and quality. Funct. Plant Biol. 2003, 30, 607–619. [Google Scholar] [CrossRef]
- Ma, X.C.; Sanguinet, K.A.; Jacoby, P.W. Performance of direct root-zone deficit irrigation on Vitis vinifera L. Cv. Cabernet sauvignon production and water use efficiency in semi-arid southcentral Washington. Agric. Water Manag. 2019, 221, 47–57. [Google Scholar] [CrossRef]
- Zhou, X.B.; Yang, L.; Shi, L.B.; Yong, Y.Y. Effect of population horizontal structure and water condition on physiological characteristic and evapotranspiration of winter wheat. Int. J. Agric. Biol. 2019, 22, 263–269. [Google Scholar]
- Salmon, Y.; Lintunen, A.; Dayet, A.; Chan, T.; Dewar, R.; Vesala, T.; Holtta, T. Leaf carbon and water status control stomatal and nonstomatal limitations of photosynthesis in trees. New Phytol. 2020, 226, 690–703. [Google Scholar] [CrossRef]
- Pratima, P.; Sharma, N. Response of kiwifruit cultivars to deficit irrigation in terms of canopy temperature and water relations. Indian J. Hortic. 2017, 74, 515–519. [Google Scholar] [CrossRef]
- Guo, X.H.; Lei, T.; Sun, X.H.; Ma, J.J.; Zheng, L.J. Effects of pit depth and soil moisture on the photosynthetic characteristics of young apple trees under water storage pit irrigation. Fresenius Environ. Bull. 2019, 28, 8031–8040. [Google Scholar]
- Ma, X.C.; Jacoby, P.W.; Sanguinet, K.A. Improving net photosynthetic rate and rooting depth of grapevines through a novel irrigation strategy in a semi-arid climate. Front. Plant Sci. 2020, 11, 575303. [Google Scholar] [CrossRef] [PubMed]
- Yuan, Y.-b.; Chen, D.-y.; Shao, X.-H.; Li, Y.-H.; Ding, F.; Kwizera, C. Effects of different irrigation quantities on plant growth and photosynthesis characters of flue-cured tobacco. J. Food Agric. Environ. 2012, 10, 1160–1163. [Google Scholar]
- Hua, L.; Yu, F.; Qiu, Q.; He, Q.; Su, Y.; Liu, X.D.; Li, J.Y. Relationships between diurnal and seasonal variation of photosynthetic characteristics of eucalyptus plantation and environmental factors under dry-season irrigation with fertilization. Agric. Water Manag. 2021, 248, 106737. [Google Scholar] [CrossRef]
- Zheng, C.; Wang, R.; Zhou, X.; Li, C.; Dou, X. Photosynthetic and growth characteristics of apple and soybean in an intercropping system under different mulch and irrigation regimes in the loess plateau of China. Agric. Water Manag. 2022, 266, 107595. [Google Scholar] [CrossRef]
- Zheng, M.; Bai, Y.; Zhang, J.; Liu, H.; Cai, J.; Bai, S.; Ding, B.; Ding, P. Effects of shading and micro-spray of canopy on photosynthetic characteristics, quality and yield of drip-irrigated grapes. Irrig. Drain. 2021, 71, 23–34. [Google Scholar] [CrossRef]
- Zhang, B.; Xu, D.; Liu, Y.; Li, F.; Cai, J.; Du, L. Multi-scale evapotranspiration of summer maize and the controlling meteorological factors in north China. Agric. For. Meteorol. 2016, 216, 1–12. [Google Scholar] [CrossRef]
- Patane, C.; Corinzia, S.A.; Testa, G.; Scordia, D.; Cosentino, S.L. Physiological and agronomic responses of processing tomatoes to deficit irrigation at critical stages in a semi-arid environment. Agronomy 2020, 10, 800. [Google Scholar] [CrossRef]
- Meng, F.; Zhang, J.; Yao, F.; Hao, C. Interactive effects of elevated co2 concentration and irrigation on photosynthetic parameters and yield of maize in northeast China. PLoS ONE 2014, 9, e98318. [Google Scholar] [CrossRef]
- Zheng, L.; Ma, J.; Sun, X.; Guo, X. Improving leaf photosynthetic performance of apple through a novel root-zone irrigation in the loess plateau. Agriculture 2022, 12, 1362. [Google Scholar] [CrossRef]
- Ramos, M.C.; Martinez-Casasnovas, J.A. Soil water balance in rainfed vineyards of the Penedss region (northeastern Spain) affected by rainfall characteristics and land levelling: Influence on grape yield. Plant Soil 2010, 333, 375–389. [Google Scholar] [CrossRef]
- Wei, J.; Liu, G.; Liu, D.; Chen, Y. Influence of irrigation during the growth stage on yield and quality in mango (Mangifera indica L.). PLoS ONE 2017, 12, e0174498. [Google Scholar] [CrossRef] [PubMed]
- Wang, L.; Wu, W.; Xiao, J.; Huang, Q.; Hu, Y. Effects of different drip irrigation modes on water use efficiency of pear trees in northern china. Agric. Water Manag. 2021, 245, 106660. [Google Scholar] [CrossRef]
- Kovalenko, Y.; Tindjau, R.; Madilao, L.L.; Castellarin, S.D. Regulated deficit irrigation strategies affect the terpene accumulation in gewurztraminer (Vitis vinifera L.) grapes grown in the Okanagan valley. Food Chem. 2021, 341, 128172. [Google Scholar] [CrossRef] [PubMed]
- Zheng, L.; Ma, J.; Sun, X.; Guo, X.; Li, Y.; Ren, R.; Cheng, Q. Effective root growth zone of apple tree under water storage pit irrigation using stable isotope methodology. Arch. Agron. Soil Sci. 2019, 65, 1521–1535. [Google Scholar] [CrossRef]
- Mitchell-McCallister, D.; Cano, A.; West, C. Meta-analysis of crop water use efficiency by irrigation system in the Texas high plains. Irrig. Sci. 2020, 38, 535–546. [Google Scholar] [CrossRef]
- Al-Omran, A.M.; Sheta, A.S.; Falatah, A.M.; Al-Harbi, A.R. Effect of drip irrigation on squash (Cucurbita pepo) yield and water-use efficiency in sandy calcareous soils amended with clay deposits. Agric. Water Manag. 2005, 73, 43–55. [Google Scholar] [CrossRef]


| Germination Stage 1 (m3·hm−2) | Irrigation Norm (m3·hm−2) | Irrigation Frequency | Total Irrigation Amount (m3·hm−2) | ||||
|---|---|---|---|---|---|---|---|
| Shoot Growth Stage | Fruit Expansion Stage | Mature Stage | |||||
| 2021 | T1 | 700 | 306.15 | 1 | 5 | 2 | 3149.20 |
| T2 | 306.15 | 2 | 5 | 2 | 3455.35 | ||
| T3 | 306.15 | 2 | 6 | 3 | 4067.65 | ||
| CK1 | 390.00 | 1 | 5 | 2 | 3820.00 | ||
| CK2 | 390.00 | 2 | 5 | 2 | 4210.00 | ||
| CK3 | 390.00 | 2 | 7 | 3 | 5380.00 | ||
| 2022 | T1 | 700 | 306.15 | 1 | 5 | 2 | 3149.20 |
| T2 | 306.15 | 2 | 5 | 3 | 3761.50 | ||
| T3 | 306.15 | 2 | 6 | 3 | 4067.65 | ||
| CK1 | 390.00 | 1 | 5 | 2 | 3820.00 | ||
| CK2 | 390.00 | 2 | 5 | 2 | 4210.00 | ||
| CK3 | 390.00 | 3 | 6 | 3 | 5380.00 | ||
| α | Pmax (μmol·m−2·s−1) | Ic (μmol·m−2·s−1) | Rd (μmol·m−2·s−1) | R2 | |
|---|---|---|---|---|---|
| RZI | 0.08 | 21.84 | 24.61 | 1.76 | 0.99 |
| FI | 0.05 | 16.64 | 29.98 | 1.42 | 0.99 |
| 2021 | 2022 | |||||
|---|---|---|---|---|---|---|
| Ψ | Pn | SPAD | Ψ | Pn | SPAD | |
| Yield | 0.988 ** | 0.918 ** | 0.926 ** | 0.987 ** | 0.946 ** | 0.951 ** |
Disclaimer/Publisher’s Note: The statements, opinions and data contained in all publications are solely those of the individual author(s) and contributor(s) and not of MDPI and/or the editor(s). MDPI and/or the editor(s) disclaim responsibility for any injury to people or property resulting from any ideas, methods, instructions or products referred to in the content. |
© 2023 by the authors. Licensee MDPI, Basel, Switzerland. This article is an open access article distributed under the terms and conditions of the Creative Commons Attribution (CC BY) license (https://creativecommons.org/licenses/by/4.0/).
Share and Cite
Sun, R.; Ma, J.; Sun, X.; Zheng, L.; Guo, J. Responses of the Leaf Water Physiology and Yield of Grapevine via Different Irrigation Strategies in Extremely Arid Areas. Sustainability 2023, 15, 2887. https://doi.org/10.3390/su15042887
Sun R, Ma J, Sun X, Zheng L, Guo J. Responses of the Leaf Water Physiology and Yield of Grapevine via Different Irrigation Strategies in Extremely Arid Areas. Sustainability. 2023; 15(4):2887. https://doi.org/10.3390/su15042887
Chicago/Turabian StyleSun, Ruifeng, Juanjuan Ma, Xihuan Sun, Lijian Zheng, and Jiachang Guo. 2023. "Responses of the Leaf Water Physiology and Yield of Grapevine via Different Irrigation Strategies in Extremely Arid Areas" Sustainability 15, no. 4: 2887. https://doi.org/10.3390/su15042887