Abstract
With past and continued loss of secondary forests in urban areas, this paper aims to assess the current distribution of secondary forests and evaluate the ecological values of secondary forests in terms of patch sizes, plant density and biodiversity values by using the analysis tools of GIS and FRAGSTATS. According to the analysis in this paper, over 1782 ha of secondary forest cover in Singapore has been lost due to the urbanization, such as residential and infrastructure development, in the past decade. It is estimated that about 7331 ha of secondary forests are planned to be cleared for new development. The future loss of secondary forests is about 1.2 times larger than the entire area of all parks and nature reserves in Singapore. It is shown that secondary forests became more fragmented compared with 2011, and more than 80% of patches are smaller than 1 ha. Most of the secondary forests’ patches are with high plant density and high biodiversity values in terms of ecological connection. Discussions towards the improvement of biodiversity and phase development planning for secondary forests in a tropical high-density city are addressed in this paper. There is lots of potential to integrate secondary forests into future land use developments for improving biodiversity based on the literature review and analysis results.
1. Introduction
Tropical forests, which store large amounts of high biodiversity, are degrading at alarming rates [1]. Masses of high-density, high-rise public housing have been built in Singapore since its independence in the 1960s [2]. Over the past 60 years, Singapore has been transformed increasingly into a high-rise building area from a landscape covered by secondary forests before [3]. The term secondary forests means the development of successional forests after clearing the original forests [4]. According to current data from United Nations World Population Prospects, Singapore’s population density is among the world’s highest—with roughly 8749 people per square kilometer of land in 2022. Singapore is a high-density city, in which biodiversity conservation is threatened by future competing land use developments [5]. According to the Urban Redevelopment Authority (URA) 2019 Master Plan of Singapore, it is foreseen that a mass of secondary forests will be developed in the coming decade. There is no doubt that secondary forest loss will have a massive impact on native biodiversity.
1.1. Transformation Process of Secondary Forests in Singapore
There has been a constant change in land transformation in Singapore over the past 200 years, which could be divided into three main land transformation stages from 1819 to 1990 [6]: the first prominent change was during 1819 to 1910; the land use of primary forest had rapidly decreased by nearly 100% due to colonization by the British [7]. The second noticeable change is that, since the 1910s, there was fast growth in land use for cultivated land; over 50% of land was occupied by cultivated land until the 1950s. The third transformation stage was after the independence of Singapore, and land use change was driven by urbanization and modernization after the 1960s; effective large-scale land redevelopment has been implemented since that period [8]. By 1990, over half of Singapore was urbanized, and most of the plantations were abandoned [6,9].
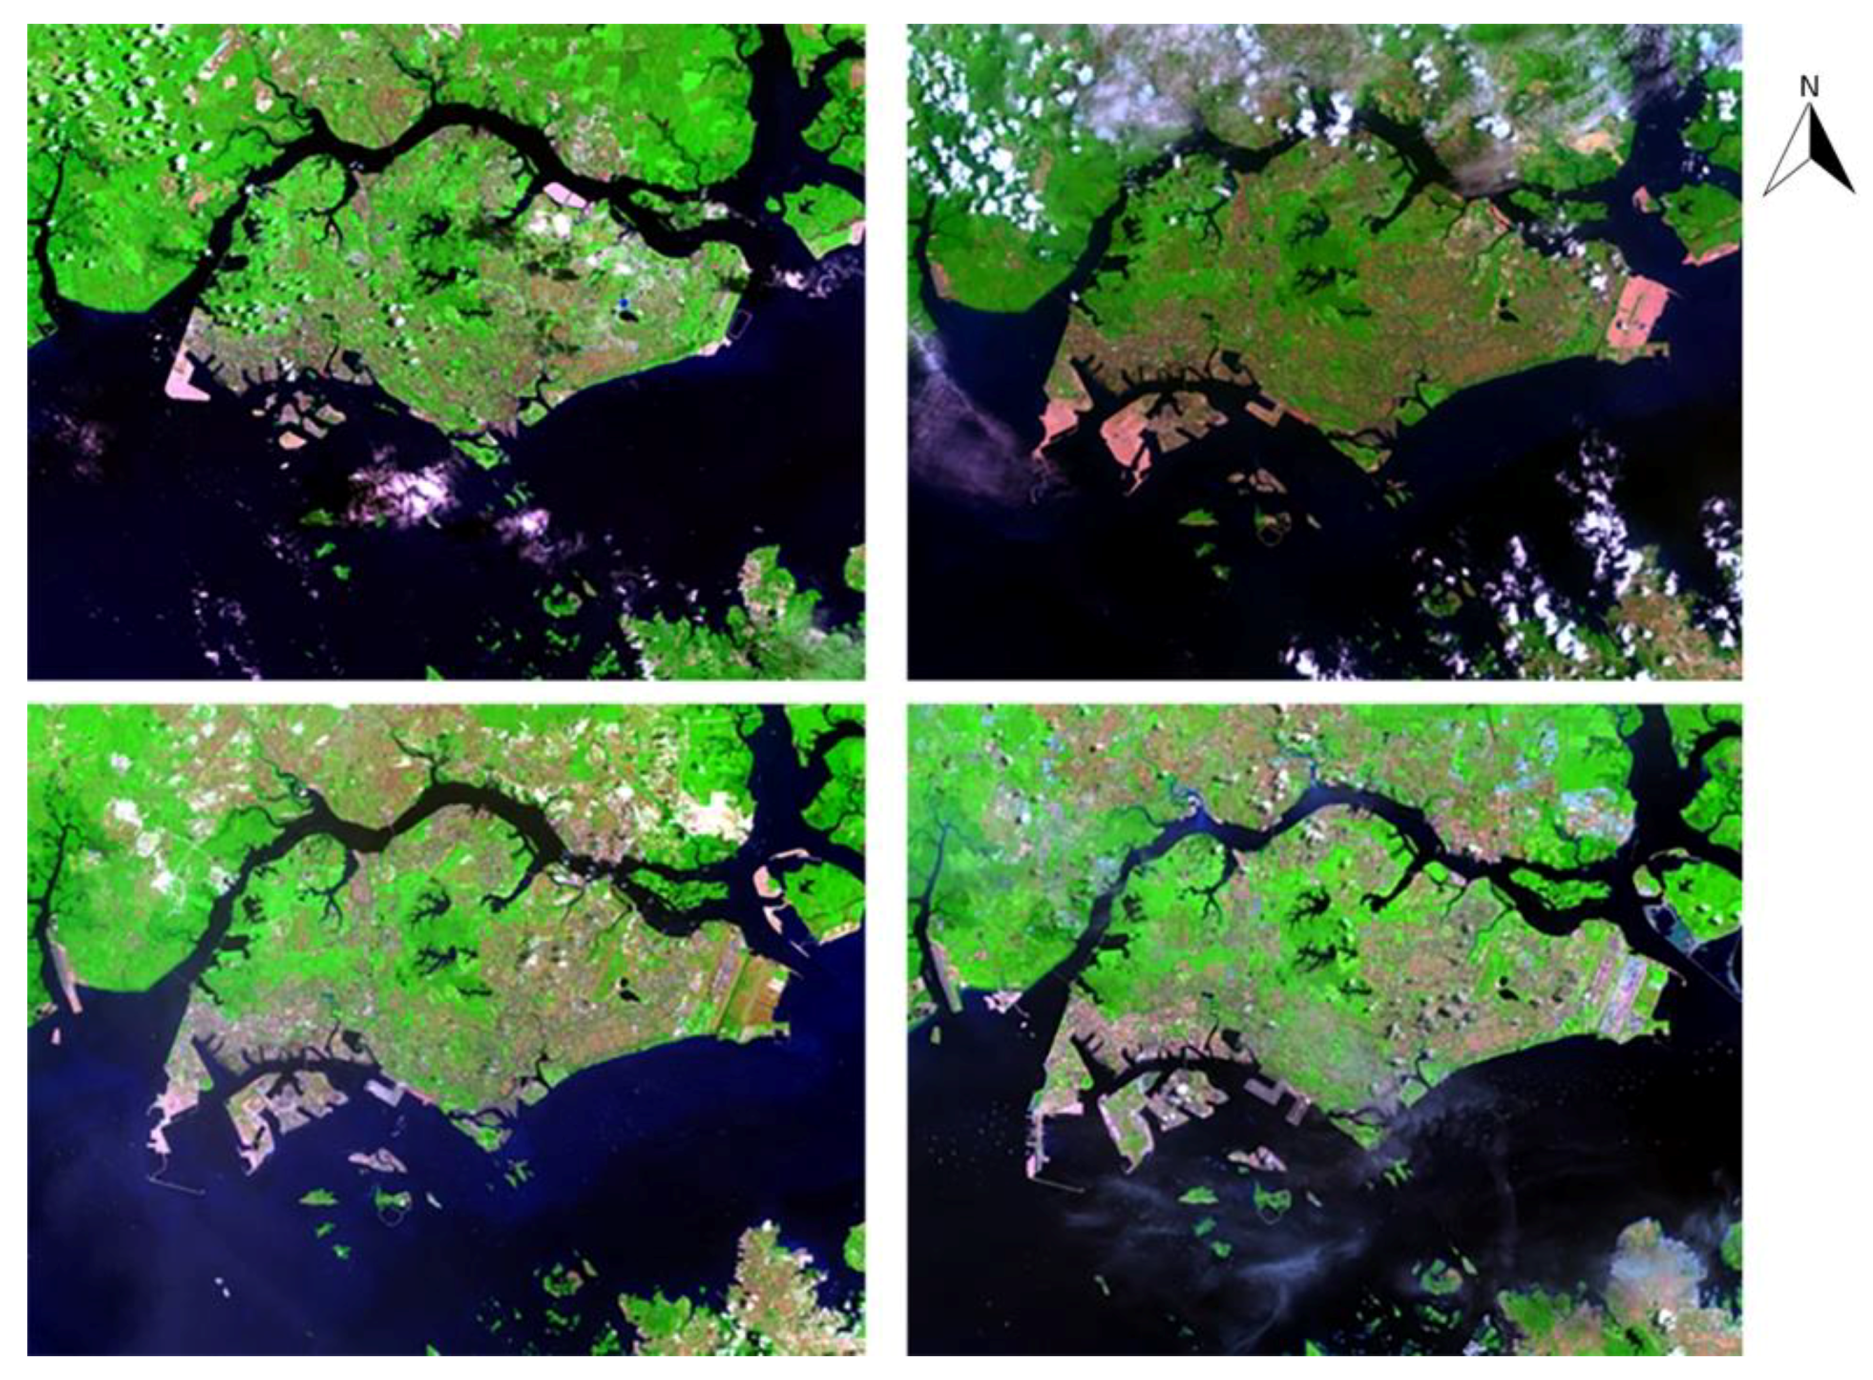
After the 1990s, besides the change of more reclaimed land along the coastline being created according to the observations from the satellite images (Figure 1), large patches of secondary grassland, scrub, and forest have been completely cleared and transformed into urban developments [10]. Over the past 200 years, the land transformation of Singapore has been in constant change, and trend of conversion is to be more and more urbanized.

Figure 1.
Landsat images of Singapore in 1989 and 2002 (top), and 2009 and 2021 (bottom). (USGS, n.d.).
At the beginning of the 19th century, the main crops of cultivation in Singapore were gambier and pepper, which require vast amounts of timber to process. Without limitations on cultivation and the protection of the forest, these cultivations affected the soil conditions and caused serious destruction of forests. In the late 19th century, there was a period during which the colonial government attempted to develop nature reserves and water reservoirs to counteract much of the massive deforestation and destruction, which resulted in the development of secondary forests [11]. According to comparisons between 1950s aerial photography and recent aerial photography, some parts of the regenerating forests of the 1900s have developed into good 100–150-year old secondary forests [11]. In the early 1900s, most of the land use in Singapore was for rubber plantations, while the remaining area was traditional villages where fruit trees were usually cultivated. The industry of rubber plantations started to decline in the 1950s as the result of the development of urbanisation of Singapore. Many plantation areas and kampungs were abandoned [6]. Against this background, there are forests regrown from these abandoned lands, which have become the primary patches of secondary forests today.
1.2. Distribution and Classification of Secondary Forests in 2011
According to data on the distribution of vegetation cover in Singapore provided in Tan et al. [12], there was 56% vegetation cover in Singapore, of which unmanaged greenery accounted for 28.5%, in 2011. Among the unmanaged vegetation, it is noticeable that secondary forests (including young and old) accounted for 20.97% and the total area of secondary forests was 15,283.16 ha. The number of patches of secondary forests in Singapore was 2962 by 2011 [7].
As it is showed in Tan et al.’s [10] studies, the distribution of secondary forests in Singapore in 2011 is rather scattered in general. The majority of the patches are distributed around the centre of the city (Central Catchment area) and north-western part of the island, which together form an ecological corridor. There were also large patches of secondary forest distributed in Pulau Ubin and Tekong Island. Minority patches are spread along the coastline of the south-eastern and north-eastern parts.
In Singapore, some classification of secondary forests, which reflects the vegetation’s age, has been done previously based on different disciplines. From Gilliland’s [13] studies, the first successive stage of secondary forests is secondary woody vegetation, then the Rhodamnia–Champereia stage, and finally the Arthrophyllum–Anisophyllea stage. R. D. Hill’s [14] vegetation map of Singapore illustrates the following types of vegetation: grassland and scrubland, low secondary forest, and tall secondary forests. From Wee and Corlett’s [15] studies, descriptions of secondary forest and wasteland vegetation categories are given. According to R. T. Corlett [9], secondary vegetation is divided into four successive stages, as mentioned previously, with the final stage being called “tall secondary forest”. Turner et al. [16] used aerial photograph interpretations to classify secondary forests based on the evenness of their canopy layer. Singapore’s habitats and secondary vegetation are broadly classified as herbaceous vegetation, low secondary forests or scrubland, and tall secondary forests [9]. Abandoned rubber plantation vegetation is considered a secondary forest in a transitional state.
In recent years, Yee et al. [17] proposed to classify secondary forests based on the speculation that land-use history of the forest patches influences secondary succession and tree species composition [18]. As a result, there are three main types of secondary forests in their description: native-dominated secondary forests, abandoned-land forests, and waste-woodlands. According to Hughes et al.’s research, it is optional to conserve the secondary forests that regenerate on abandoned agricultural land to safeguard biodiversity, as the current rate of deforestation is unlikely to decline [19].
The term plant community is also used for plant classification: for example, a native plant community or a naturalized urban plant community [20,21]. There are different types of secondary forests as they include different characteristics. Hence, further illustrations based on the analysis of spatial characteristics will be used in this study to diversify classification of secondary forests to capture differences beyond generalising them as a single type of secondary forests.
1.3. Land Use of Secondary Forests
With limited land but diverse requirements for land functions in the city-state [12], Singapore has high land use pressure. Singapore is a high-density city where secondary forests are threatened by future competing land uses from development. With secondary forests as unmanaged greenery, their ecological and social values are usually overlooked. When there are land-use developments in secondary forests, the secondary forests will usually be just entirely removed without sufficient consideration of conservation or integration with new development. The current GIS analysis results provide an initial assessment of the loss of secondary forests recently as well as potential losses in the future. According to the research by Tan et al. [10], it shows from 2007 to 2012 a vegetation cover loss of about 53%, which is about 2600 ha, which could be ascribed to the loss of young secondary forests. There will be more secondary forests to be removed in the next 10 to 15 years considering the land usage as outlined in the Master Plan 2014. It’s also mentioned that in Singapore the secondary forests are distributed in critical areas designated for land usage (residential, commercial, institutional, and reserve sites) [10]. In this case, the total area which may be lost to development is about 4700 ha. Notably, in Singapore, there is an apparent trend of deforestation, which may lead to the loss of secondary forests now and in the future [10].
The past land use of secondary forest to some extent affects the dominant species in the forest and forest succession, while the future land use of secondary forests will determine the future of biodiversity loss. Although the social and ecological values of secondary forests have been addressed, more secondary forests are facing the fate to be developed [22]. It is important to know what kind of development will be ongoing in the secondary forest and to see the possibilities to integrate the ecological design of secondary forests in the future.
1.4. Significances of Secondary Forests
Secondary forests in Singapore are significant from ecological and biophysical as well as social perspectives. For ecological value, ecosystem service can be used as a framework for understanding essential ecological functions. There are four services that secondary forests can provide. (1) Regulating services, including 1. microclimate regulation through shade and transpiration; 2. air filtering by particulate matter adhesion to leaves and gaseous absorption; 3. stormwater regulation via rainfall interception; and 4. carbon sequestration. (2) Provisioning services: providing fruit, timber, and firewood. (3) Cultural services: aesthetics/stress recovery/cultural heritage/recreational heritage. (4) Supporting services: photosynthesis. Increasing the ecosystem services provided by the urban forest within cities can reduce reliance on external inputs, such as food for human consumption or electricity for cooling, and lead to a more sustainable system [23].
Biodiversity is affected by deforestation and reforestation worldwide [24]. Compared with primary forests, secondary forests are more widespread worldwide, playing an essential role in the biosphere [25]. For the biophysical value, secondary forests are playing a significant role in broader biodiversity in Singapore. According to Gibson et al. [26], the conservation value of secondary forests is low, since they are considered to hold considerably less biodiversity than primary forests. However, there is an increasing amount of proof showing that the urban forest is an important resource for many animals [27]. Secondary forests, especially native-dominated ones, serve multiple functions that deserved to be considered to be conserved. Taking the secondary forests in a nature reserve as an example, they are firstly prospective sites for the primary forest species to inhabit. Secondly, they also function as buffers which can protect core habitat patches from being affected by urban disturbances. Lastly, they can offer additional habitats for many forest fauna [28]. Secondary forest covers are also associated with various social values. For instance, they have been characterized by residents as multiple resources for mental and physical health, public environmental education, and urban aesthetic value [12]. The public in Singapore is also more and more concerned about the issue of deforestation; for example, the development project of Tagore Forest provoked heated discussion between different authorities in 2016. From the news in recent years, conservation values regarding spontaneous vegetation such as secondary forests are become more acceptable by citizens in Singapore. Overall, the value of secondary forests in Singapore is significant, and secondary forests will play a vital role in sustainable development for the city in the future.
Today, there is a trend regarding ecological science as an essential source of principles for landscape design and planning. Indeed, the adoption of ideas from ecology contributed to a renewal of the discipline in the 1960s [18]. In Europe, many guidelines and suggestions for decision-making regarding land use planning are interwoven with landscape ecology. Landscape-level studies are the basis for the determination of land use decisions in Czechoslovakia [29]. By applying urban ecology to planning, the design and planning field could become a key to solving the accelerating degradation of land. Serious incorporation of theory, the science of ecology, several dimensions of human culture, and bold solutions are required to create areas where both nature and people thrive, and, at least at present, landscape ecology offers the most promising foundation for sustainably meshing nature and culture on land. Together, these themes form a vision for the design and planning of nature [18].
Design and planning may be said to shape space by integrating human structures with the protection of natural resources [30]. Indeed, considering these spatial patterns and natural processes is central to designers’ and planners’ work. There is sufficient evidence to support the idea that secondary forests are essential for native biodiversity and should be considered to be conserved. However, relatively little literature has been published on how to conduct the conservation of different patches of secondary forests, especially towards integrating secondary forests into land use development. There are theoretical gaps between evaluating the ecological values of secondary forests and utilizing the evaluation information to guide urban planning towards secondary forests. Thus, in this article, relevant ecology findings are applied to support the idea that secondary forests could be integrated into land-use planning for planners to plan and design the land for a more sustainable future in Singapore. The following research questions are addressed in this article: what are the spatial characteristics of secondary forests in Singapore, and how is it possible to evaluate the ecological values of secondary forests in Singapore? Could this information be utilized to guide urban planning towards secondary forests? Based on the development background and literature reviews on secondary forests in Singapore, this research seeks to explore the possibility of integrating secondary forests into future land use development through comprehensive understanding of secondary forests’ spatial pattern characteristics and ecological values, so as to provide practical reference value for biodiversity conservation and development regarding secondary forests.
2. Materials and Methods
2.1. Study Area
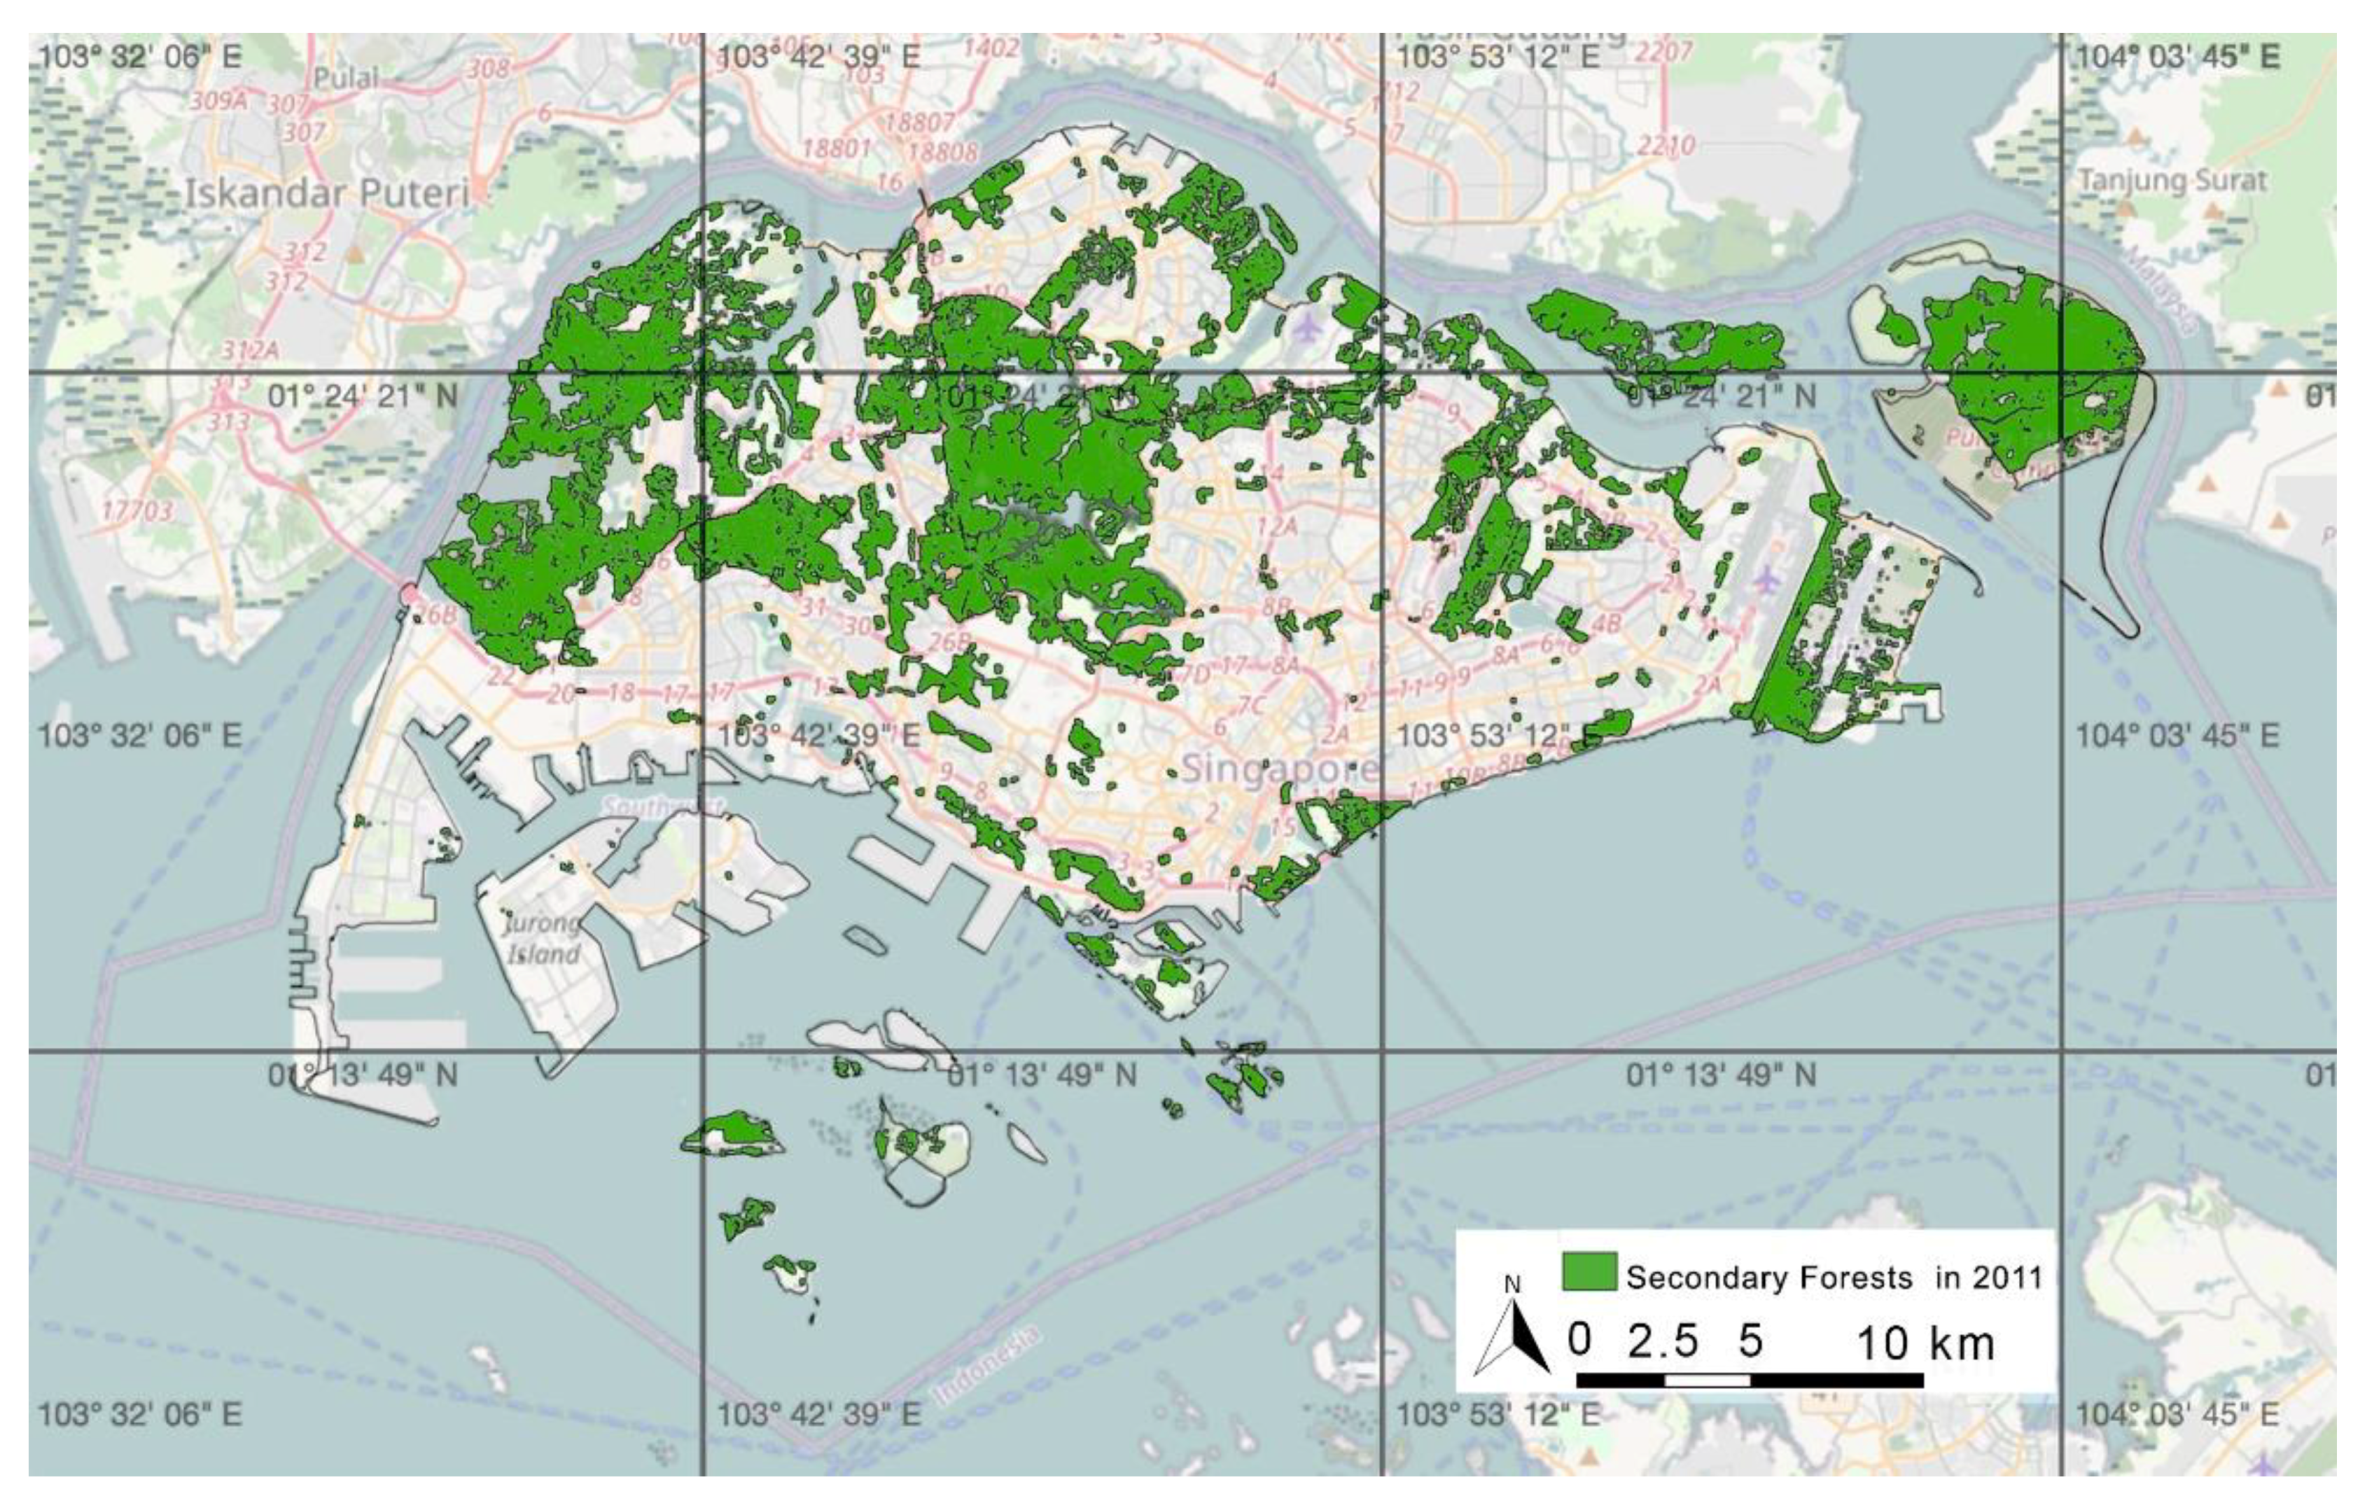
The site of the study covered all secondary forests of the whole of Singapore (Figure 2). The total area of Singapore is 71,910 ha, including reclaimed land and offshore islands. This city-scale research spanned the last decade, from 2011 to 2021. According to research done by Yee et al. [7,10] in 2011, the majority of the secondary forests are distributed in the central and north-western parts of the island, as well as Pulau Ubin and Tekong Island. The study area of secondary forests in 2021 is within the boundary of secondary forests in 2011.

Figure 2.
Map of secondary forests for the whole of Singapore in 2011 based on the information from Tan et al. [10].
2.2. Data collection and Pre-Processing
For the identification of secondary forest loss and NDVI analysis, current Landsat data for Singapore is needed. Landsat data was collected from the USGS website. The Landsat 8 level-one data with the least cloud area on 25 February 2021 were selected for analysis. Landsat 8 level-one data on 17 June 2021 and September 5th 2021 were collected to replace the 2% area affected by cloud.
To analyze the change of secondary forests in Singapore between 2011 and 2021, the map of the distribution secondary forests in Singapore in 2011 was collected from the research paper of Tan et al. [10]. To predict the future land use of secondary forests in Singapore, the 2019 Master Plan map of Singapore is required, and it was downloaded from the URA official website. To assess the biodiversity value in terms of an ecological network, a map of cohesive habitat networks was collected from the research paper of Hamid and Tan [5].
Regarding the relationship between form and function [31], this article will analyze three factors in secondary forests, which are the distributional patterns, patch size, and plant density. The first factor is distributional pattern. Recognizing “indispensable spatial patterns” of nature will be among the top priorities in almost all projects, and it is mentioned that mapping distributional patterns and looking for concentrations of diversity is an obvious approach for conserving plant biodiversity. Furthermore, distributional patterns are related to the fragmentation of habitats. From the results of the analysis of the distributional patterns of the secondary forests, some solutions to promote biodiversity and ecological connection are visible.
The second factor is patch size. Recent research on metapopulations among Lepidoptera has indicated that the size and isolation of patches affect the patch occupancy of habitats. It is easier for large patches to be colonized if they are huge and near other big and involved patches, while it is more likely for isolated patches with small community populations to be extinct [32]. The arrangement and size of the forest patches also indicate environmental characteristics such as the typologies of soil and the landform. On the other hand, patch size is related to species. Adjustments towards the connectivity of habitats or patch sizes can have substantial impacts on species plenitude and their patterns of movement [33]. The characteristic of patch size of secondary forests may be combined with other societal goals. For example, to cool an urban area, fragmented habitats in the form of a fine mesh of tiny vegetation patches may be better than a single large greenspace or park [21]. These works in the literature review suggest that patch size is an essential factor that determines the value for conservation as well as development potential for landscape materials.
The third factor is plant density. For forest plots, the measure of plant density is one of the critical aspects revealing environmental health [34]. We could estimate the health of the secondary forests by measuring the plant density. Furthermore, the succession stage of different secondary forests patches could also be evaluated by analyzing the plant density. There is evidence in the Central Reserves area showing that some native-dominated secondary forests have been transformed to taller and more species-rich vegetation through the succession process [28]. Thus, to some extent, from the plant density, valuable patches of secondary forest can be identified to conserve in the next land planning stage. Based on the literature review and ecology principles, distributional patterns, plant density, and patch sizes will be the critical factors for spatial characteristics analysis of secondary forests in Singapore.
2.3. Data Analysis
The mapping of current secondary forest distribution was done through the analysis of NDVI values within the secondary forest boundary in 2011 done by Yee et al. [7]. NDVI values below 0 were marked and, through comparison with current aerial images (2021) of Singapore, the loss of secondary forest could be confirmed. Some patches of secondary forest may have been removed and developed, which is updated in the current distribution map, and the loss of secondary forest is calculated using the Map Calculator of ArcGIS.
Patch size of secondary forest patches is based on tiff file information exported from ArcGIS. The next step was using FRAGESTSTS to analyze the tiff file of secondary forests and get the list of patch information. The size of each patch could be found by referring to its patch identification. The data on patch size was categorized into different groups by Excel, and the patch size map was mapped using GIS.
The plant density of the secondary forests in Singapore is indicated through calculation of an NDVI value (range from −1 to +1) with GIS. The formula used for NVDI calculation is NDVI = (NIR−RED)/(NIR + RED).
The assessment of the biodiversity values of secondary forests followed the map of cohesive habitat networks for biodiversity done by Hamid and Tan [5] in 2017, by overlapping the boundary of the secondary forest in 2021 with the map of Singapore’s cohesive habitat networks.
By overlapping the boundary of the secondary forest in 2021 with the 2019 Master Plan of Singapore, the future land use of secondary forests was predicted. Through the GIS calculation, the area for different land uses was calculated, and an updated assessment of the potential future loss of secondary forests was made.
2.4. Limitation of Research Data and Methodology
The first limitation of this research is that the Landsat data used for the NDVI analysis does not go through the process of atmosphere correction, which may affect the outcome of the NDVI analysis. The second limitation of the data is that there is 2% cloud area in the Landsat data, and this was replaced by other data, so the NDVI values were slightly affected. The third limitation is that the results of this research could not provide detailed information for small site scales, because the precision of the Landsat data is 30 m × 30 m.
3. Results
3.1. Spatial Characteristic of Secondary Forests
Based on the NDVI analysis and satellite imagery observation, the total loss of secondary forests in Singapore during 2011 to 2021 was about 1782 ha (Figure 3). Most of the losses of secondary forests were caused by the development of residential, commercial, and airport areas. The total area of loss of secondary forests was about 28% of the entire current area of parks and nature reserves.
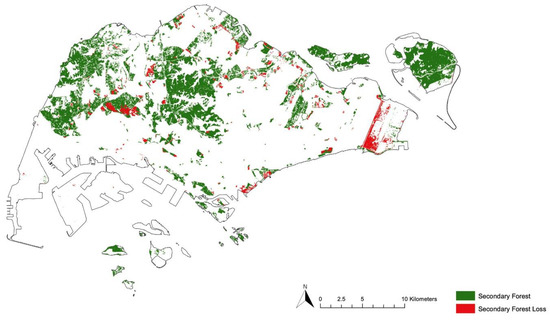
Figure 3.
Changes in secondary forests in Singapore from 2011 to 2021 based on NDVI analysis and satellite imagery observation. (Source: the author).
The current total area of secondary forests in Singapore is about 13,501 ha. The majority of secondary forests are distributed in the central area and the north-west part of Singapore in the mainland and on two big offshore islands. The rest is spread in the south and middle east areas.
According to data comparison analysis by FRAGSTATS (Table 1), the patch number has decreased by over 300, which indicates the stability of species interaction in secondary forest is lower. The patch density has slightly increased, which means that, compared with 2011, secondary forests in 2021 have more spatial heterogeneity. To some extent, the patches of secondary forests become more fragmented.

Table 1.
Landscape metrics analysis toward the secondary forest (2011 and 2021) by FRAGSTATS (TA: total area; NP: number of patches; PD: patch density) (Source: the author).
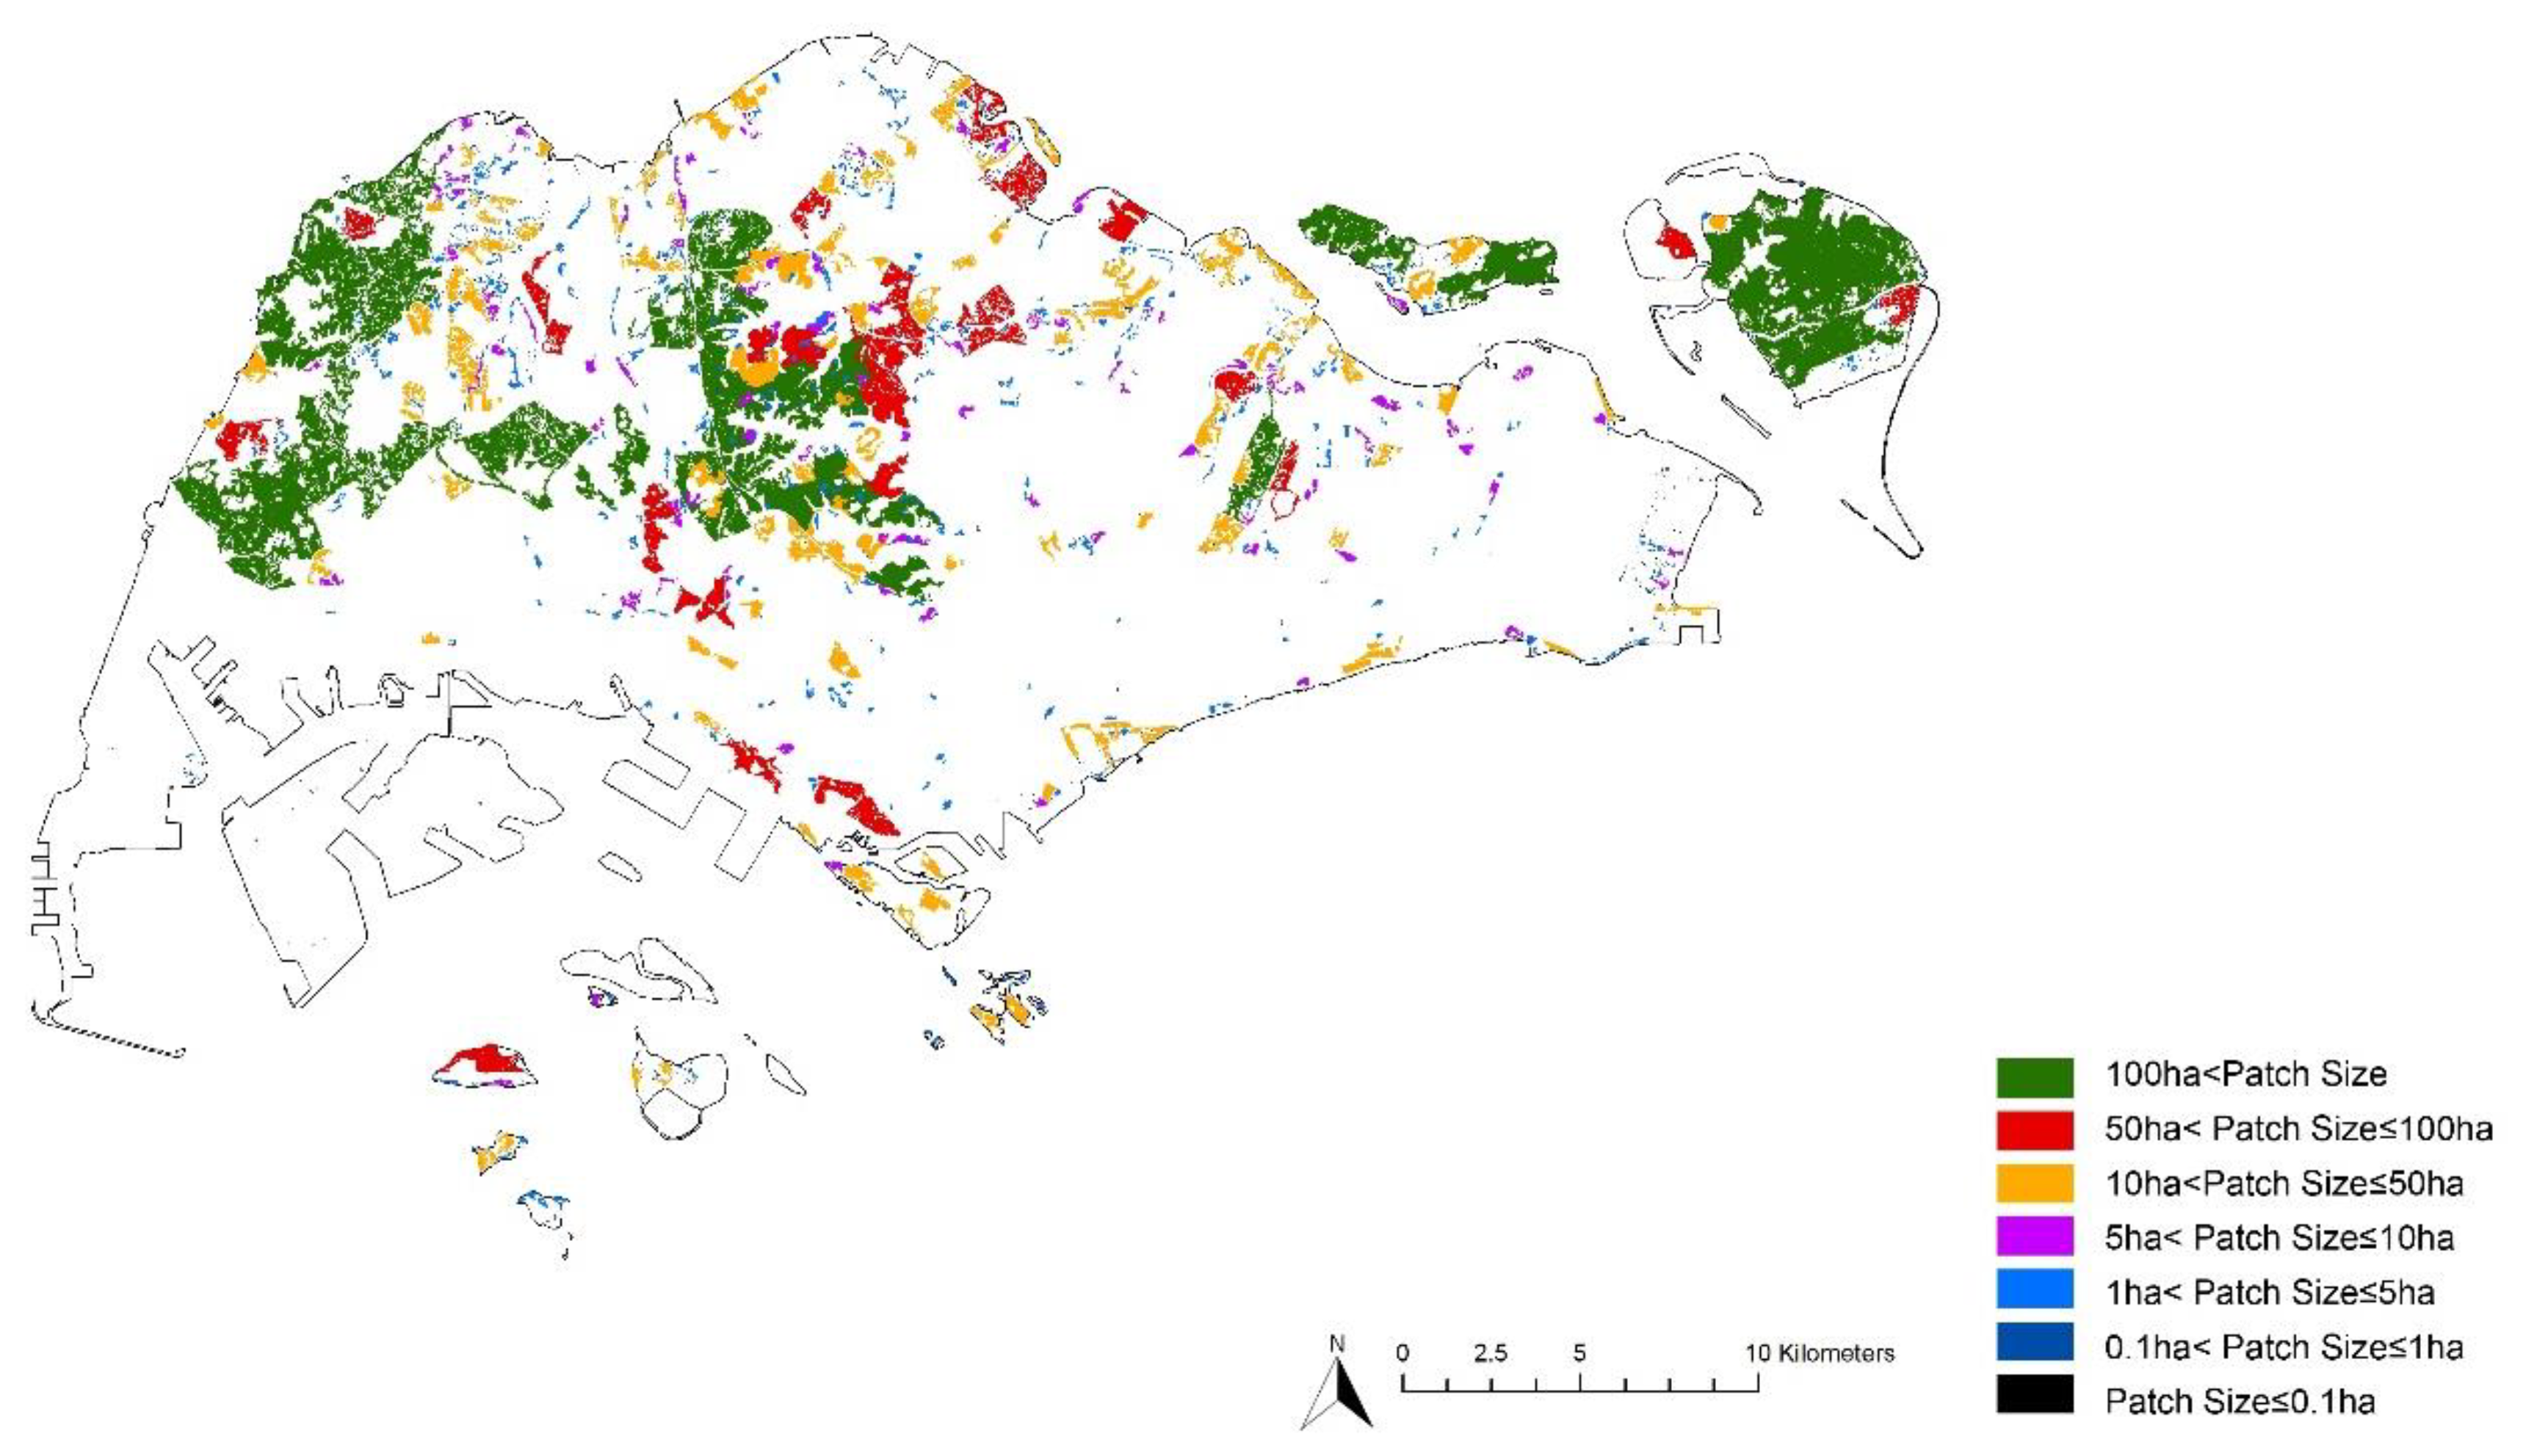
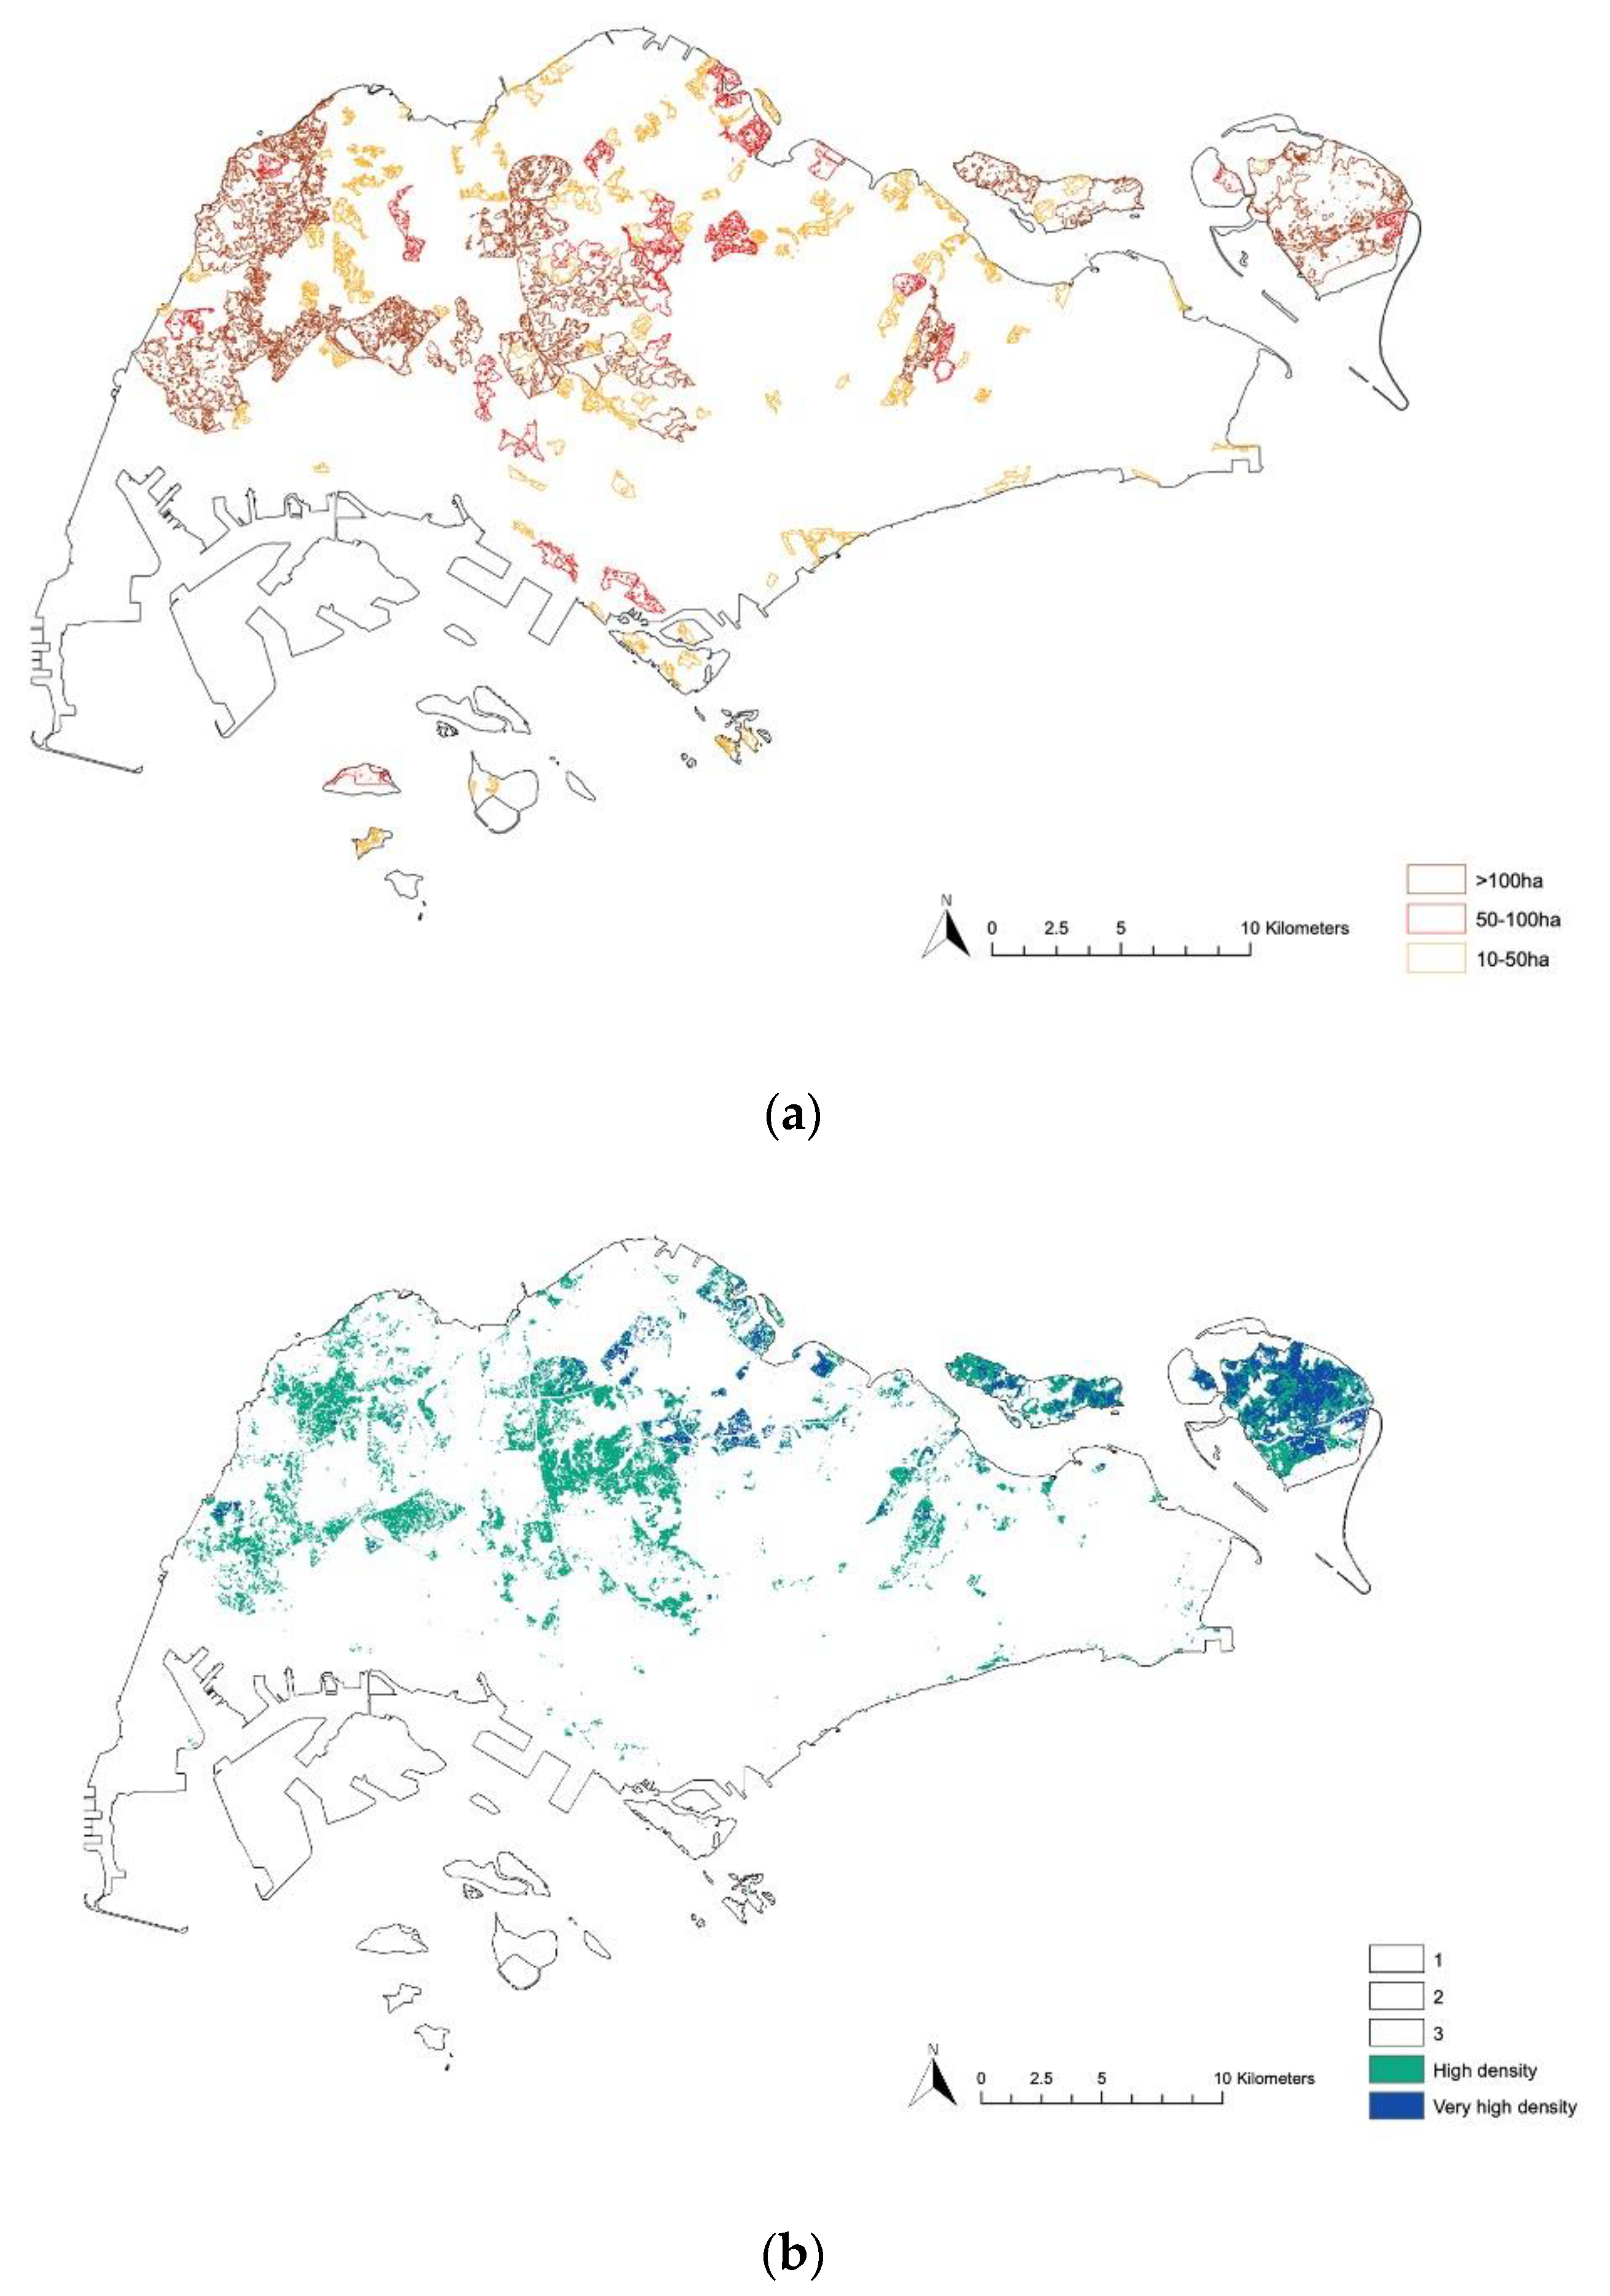
Based on the FRAGSTATS calculation, different sizes of patches were categorized into seven groups (Figure 4), which are: Patch Size ≤ 0.1 ha; 0.1 ha < Patch Size ≤ 1 ha; 1 ha < Patch Size ≤ 5 ha; 5 ha < Patch Size ≤ 10 ha; 10 ha < Patch Size ≤ 50 ha; 50 ha < Patch Size ≤ 100 ha; Patch Size > 100 ha. Patches larger than 100 ha are mainly distributed in the central and west areas, with two big offshore islands (Pulau Ubin and Tekong Island). On the main island, patches over 100 ha are mainly distributed in the north-west area (Tengah) and central catchment area. Most of the patches in the south area are below 1 ha.
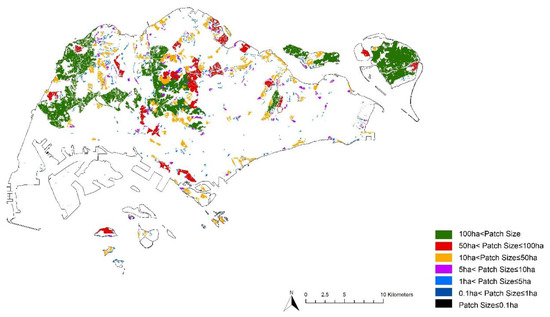
Figure 4.
Categorized patch sizes of secondary forests in Singapore based on FRAGSTATS calculations. (Source: the author).
According to Figure 5, nearly 80% of secondary forest patch sizes are below 1 ha, only 5% of secondary forest patch sizes are over 10 ha, and nearly 90% of the area of secondary forests is distributed on patch size categories over 10 ha. Although the number of patches of which the size is over 100 ha account for 0.6% of patches, they make up 62.05% of the total area of secondary forest (Figure 6).
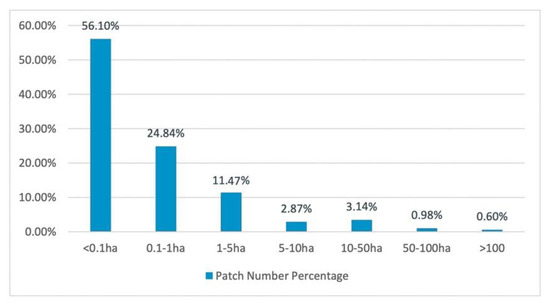
Figure 5.
Number percentage of secondary forests located in different patch size categories. (Source: calculated by the author.
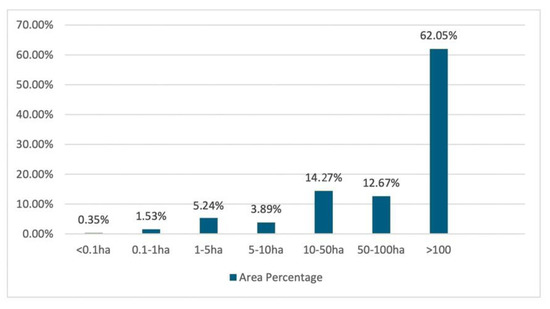
Figure 6.
Area percentage of secondary forests located in different patch size categories. (Source: calculated by the author).
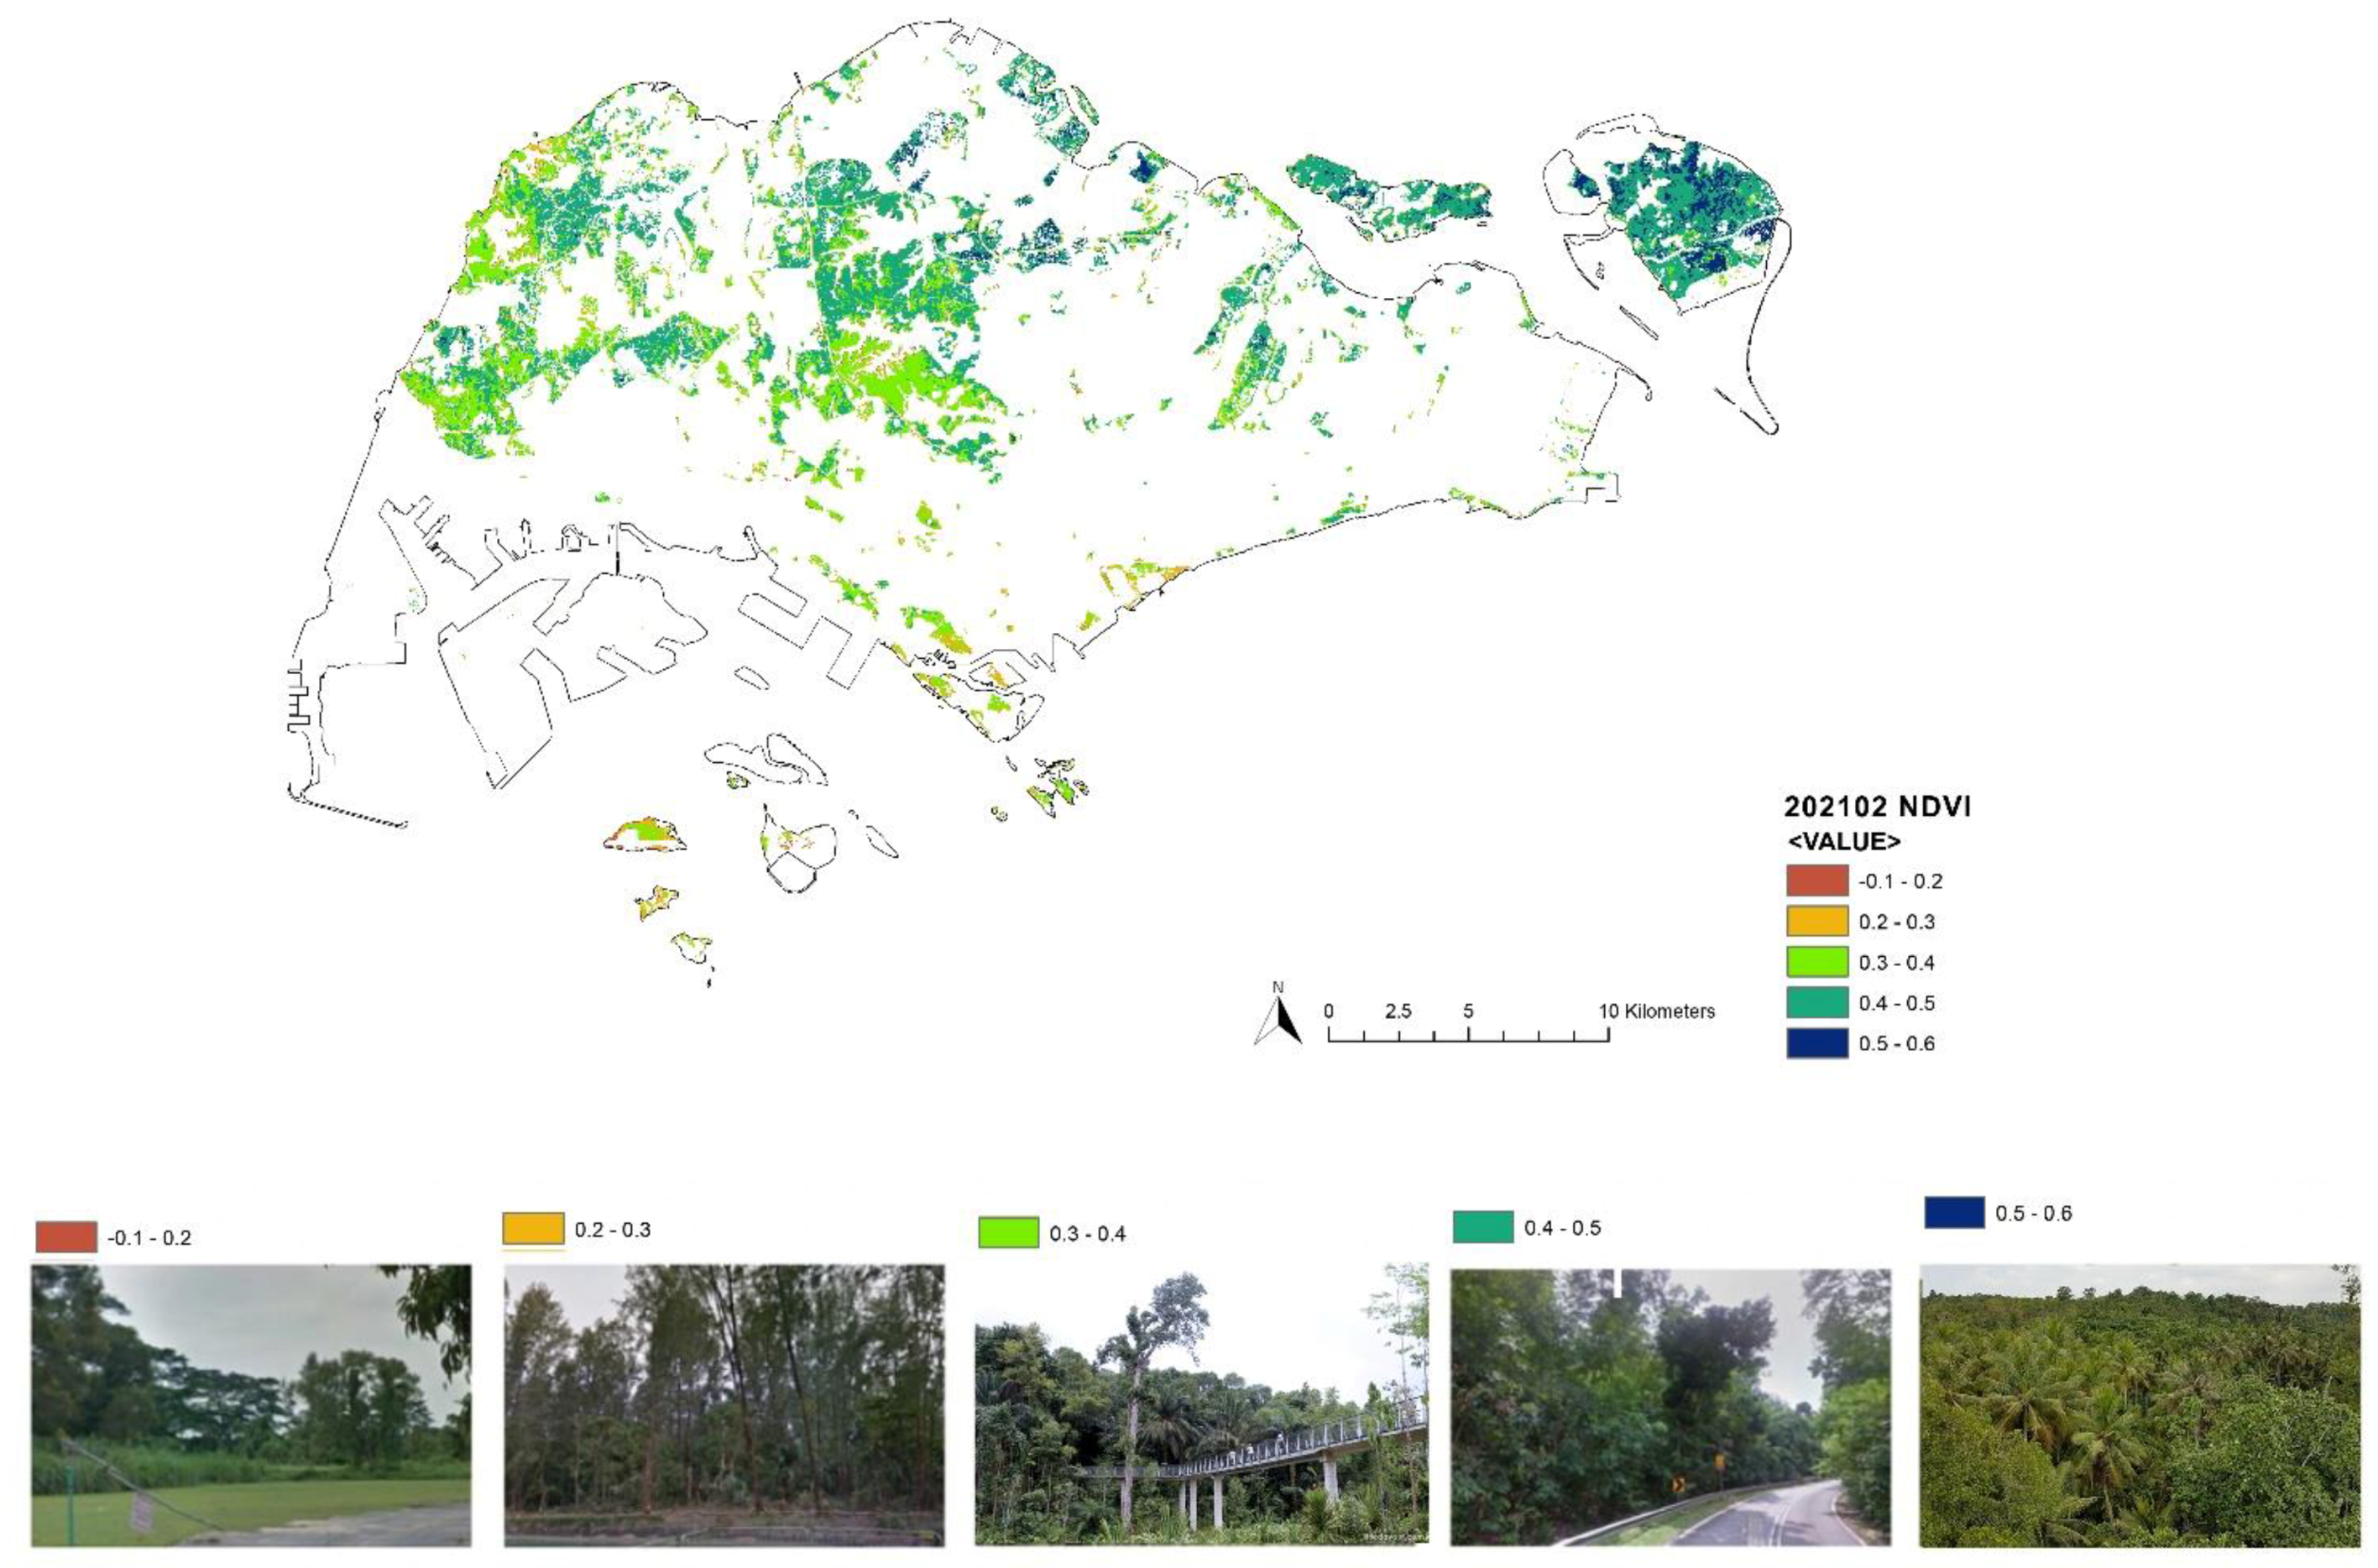
According to the NDVI analysis, the NVDI values of secondary forests in Singapore in 2021 are in the range between −0.1 and 0.6. The NVDI values of secondary forests are categorized into five ranges (Figure 7). To show the differences in plant density with different NDVI values, each NDVI value category is related to on-site images from Google Street View. The plant density with different categories of NDVI values is shown in Figure 8.
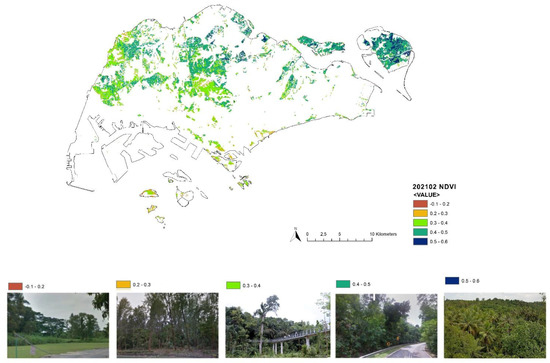
Figure 7.
NDVI of secondary forest in 2021 based on Landsat data on 25 February 2021. The plant density that each range of NDVI values represents is referred to on-site images from Google Street View. (Source: the author).
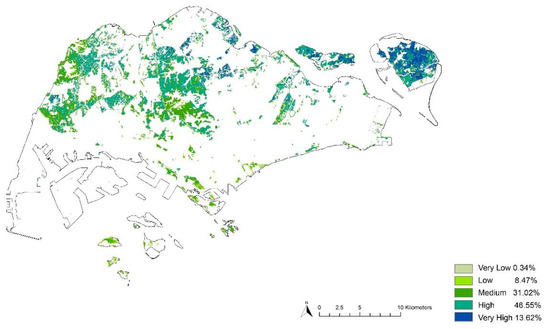
Figure 8.
Plant density of secondary forests in 2021 based on the NVDI values. (Source: the author).
According to the NDVI values, the plant density of secondary forest is categorized into five ranges (Figure 8). Over 60% of the plant density of the secondary forest is in the high and very high categories. Most of the very-high-density patches are located in the north-east area, while the dense area is concentrated in the central and west areas. The plant density in the south area seems to be less. According to Figure 9, the average plant density of larger patch sizes appears to be slightly higher.
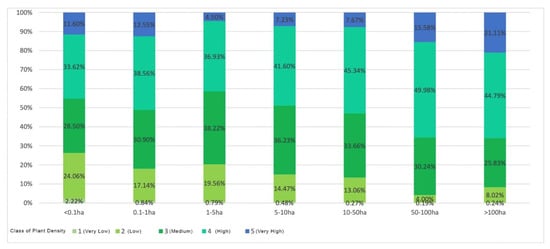
Figure 9.
Percentage of different classes of plant density located in different patch size categories. (Source: the author).
3.2. Biodiversity Values in Terms of Ecological Connections
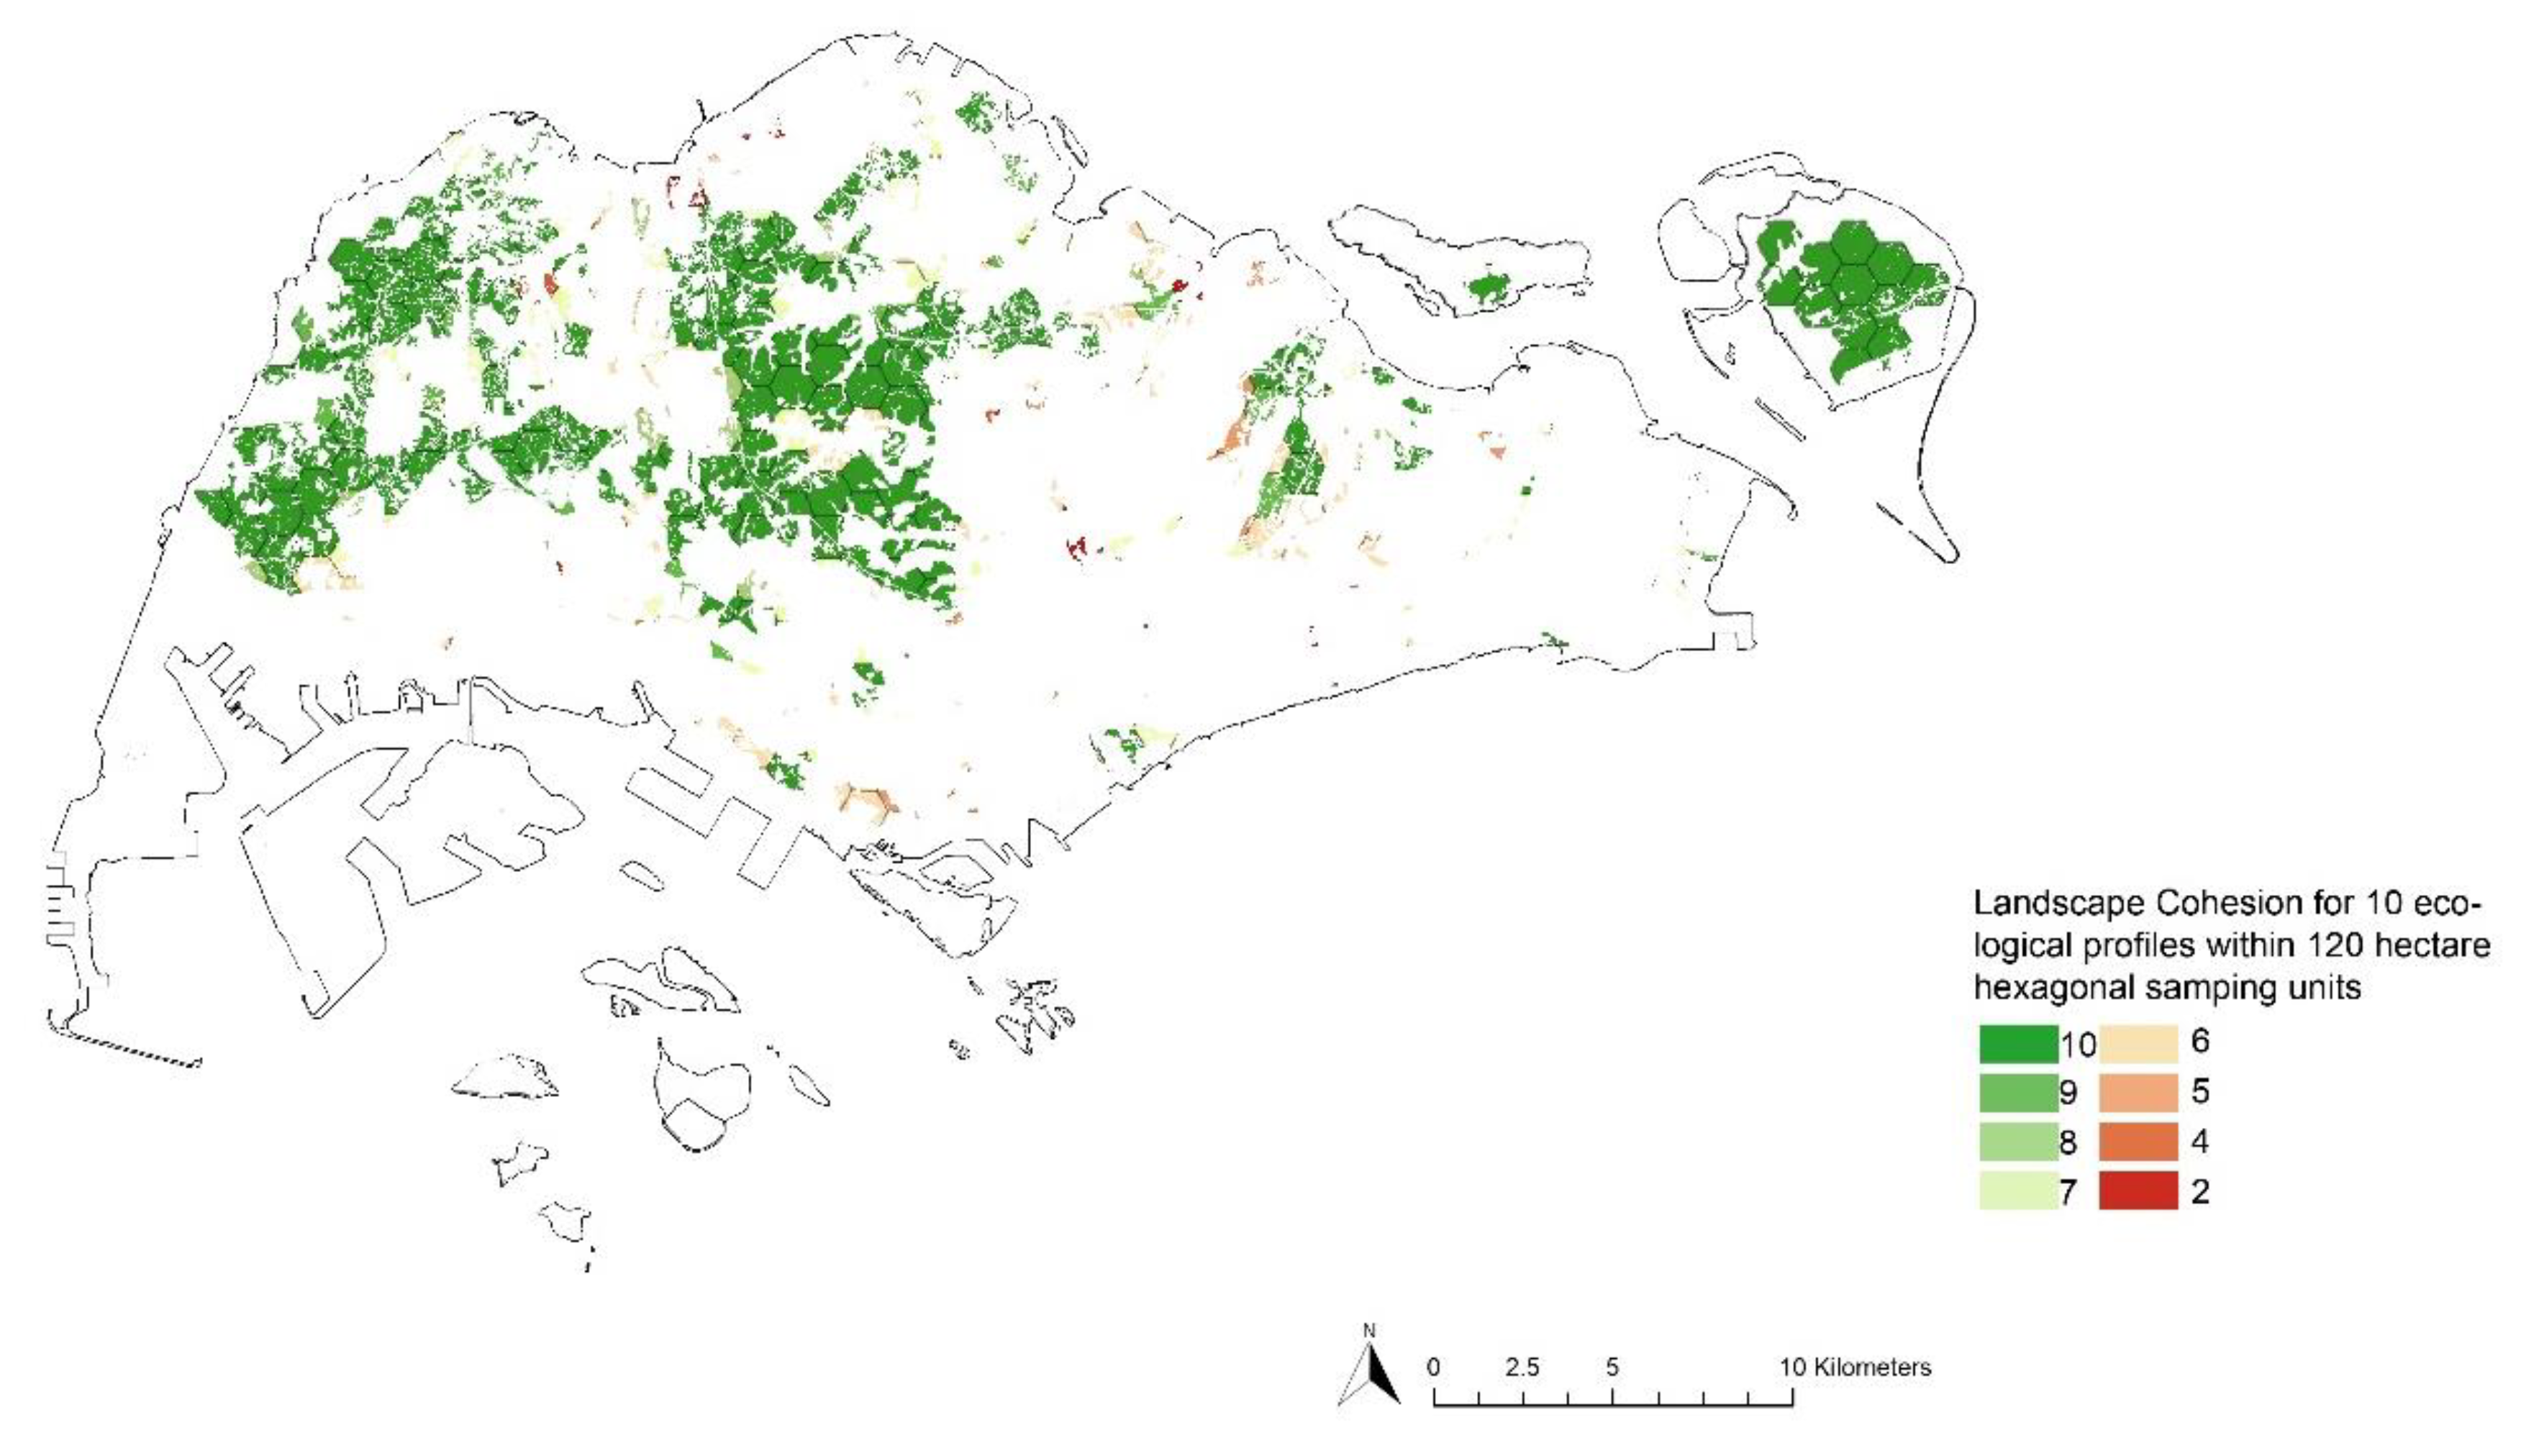
According to Hamid and Tan’s research, based on the combination of all network cohesion maps, the cohesive habitat network for biodiversity in Singapore was mapped incorporating ten ecological profiles [5]. The number of ecological profiles (from 2 to 10) is the indicator for the species level of biodiversity. After overlapping the map of cohesive habitat networks in 2017 with the current secondary forest boundary, the biodiversity value of each patch of secondary forest is reflected (Figure 10). The more ecological profiles secondary forest patches contain, the higher the value of the biodiversity they preserve. This indicates that most of the secondary forest patches are sitting in the zone that contains more than nine ecological profiles, which relates to preserving the high biodiversity value. Especially in the northwest and central areas, the secondary forests sit in the vital zone for a cohesive ecological network, preserving the highest biodiversity values. These secondary forest patches with high biodiversity values function as ecological corridors that connect the west and central area. The patches in the middle east area (near Punggol Serangoon Reservoir) with the second-highest biodiversity value (the number of ecological profiles is between six and eight) are also critical for the east–west flow of connection. Biodiversity assessment of secondary forests indicates which patches of secondary forests are more deserving to be conserved in terms of biodiversity value. Furthermore, it shows there is lots of potential to integrate secondary forests into the improvement of ecological corridor networks in Singapore, even for the isolated patches of secondary forests, which could be helpful to mitigate the biodiversity extinction crisis by recovering species at high risk of extinction and improving landscape connectivity [1]. According to Acevedo-Charry and Aide’s research, secondary forests are essential habitats for many vertebrates, and they tend to be similar to reference forests through about a 40-year succession. The necessity of preserving secondary forests in the long term is emphasized [24].

Figure 10.
Biodiversity assessment of secondary forest in Singapore based on the information from Hamid and Tan’s research [5].
3.3. The Future Change of Secondary Forests
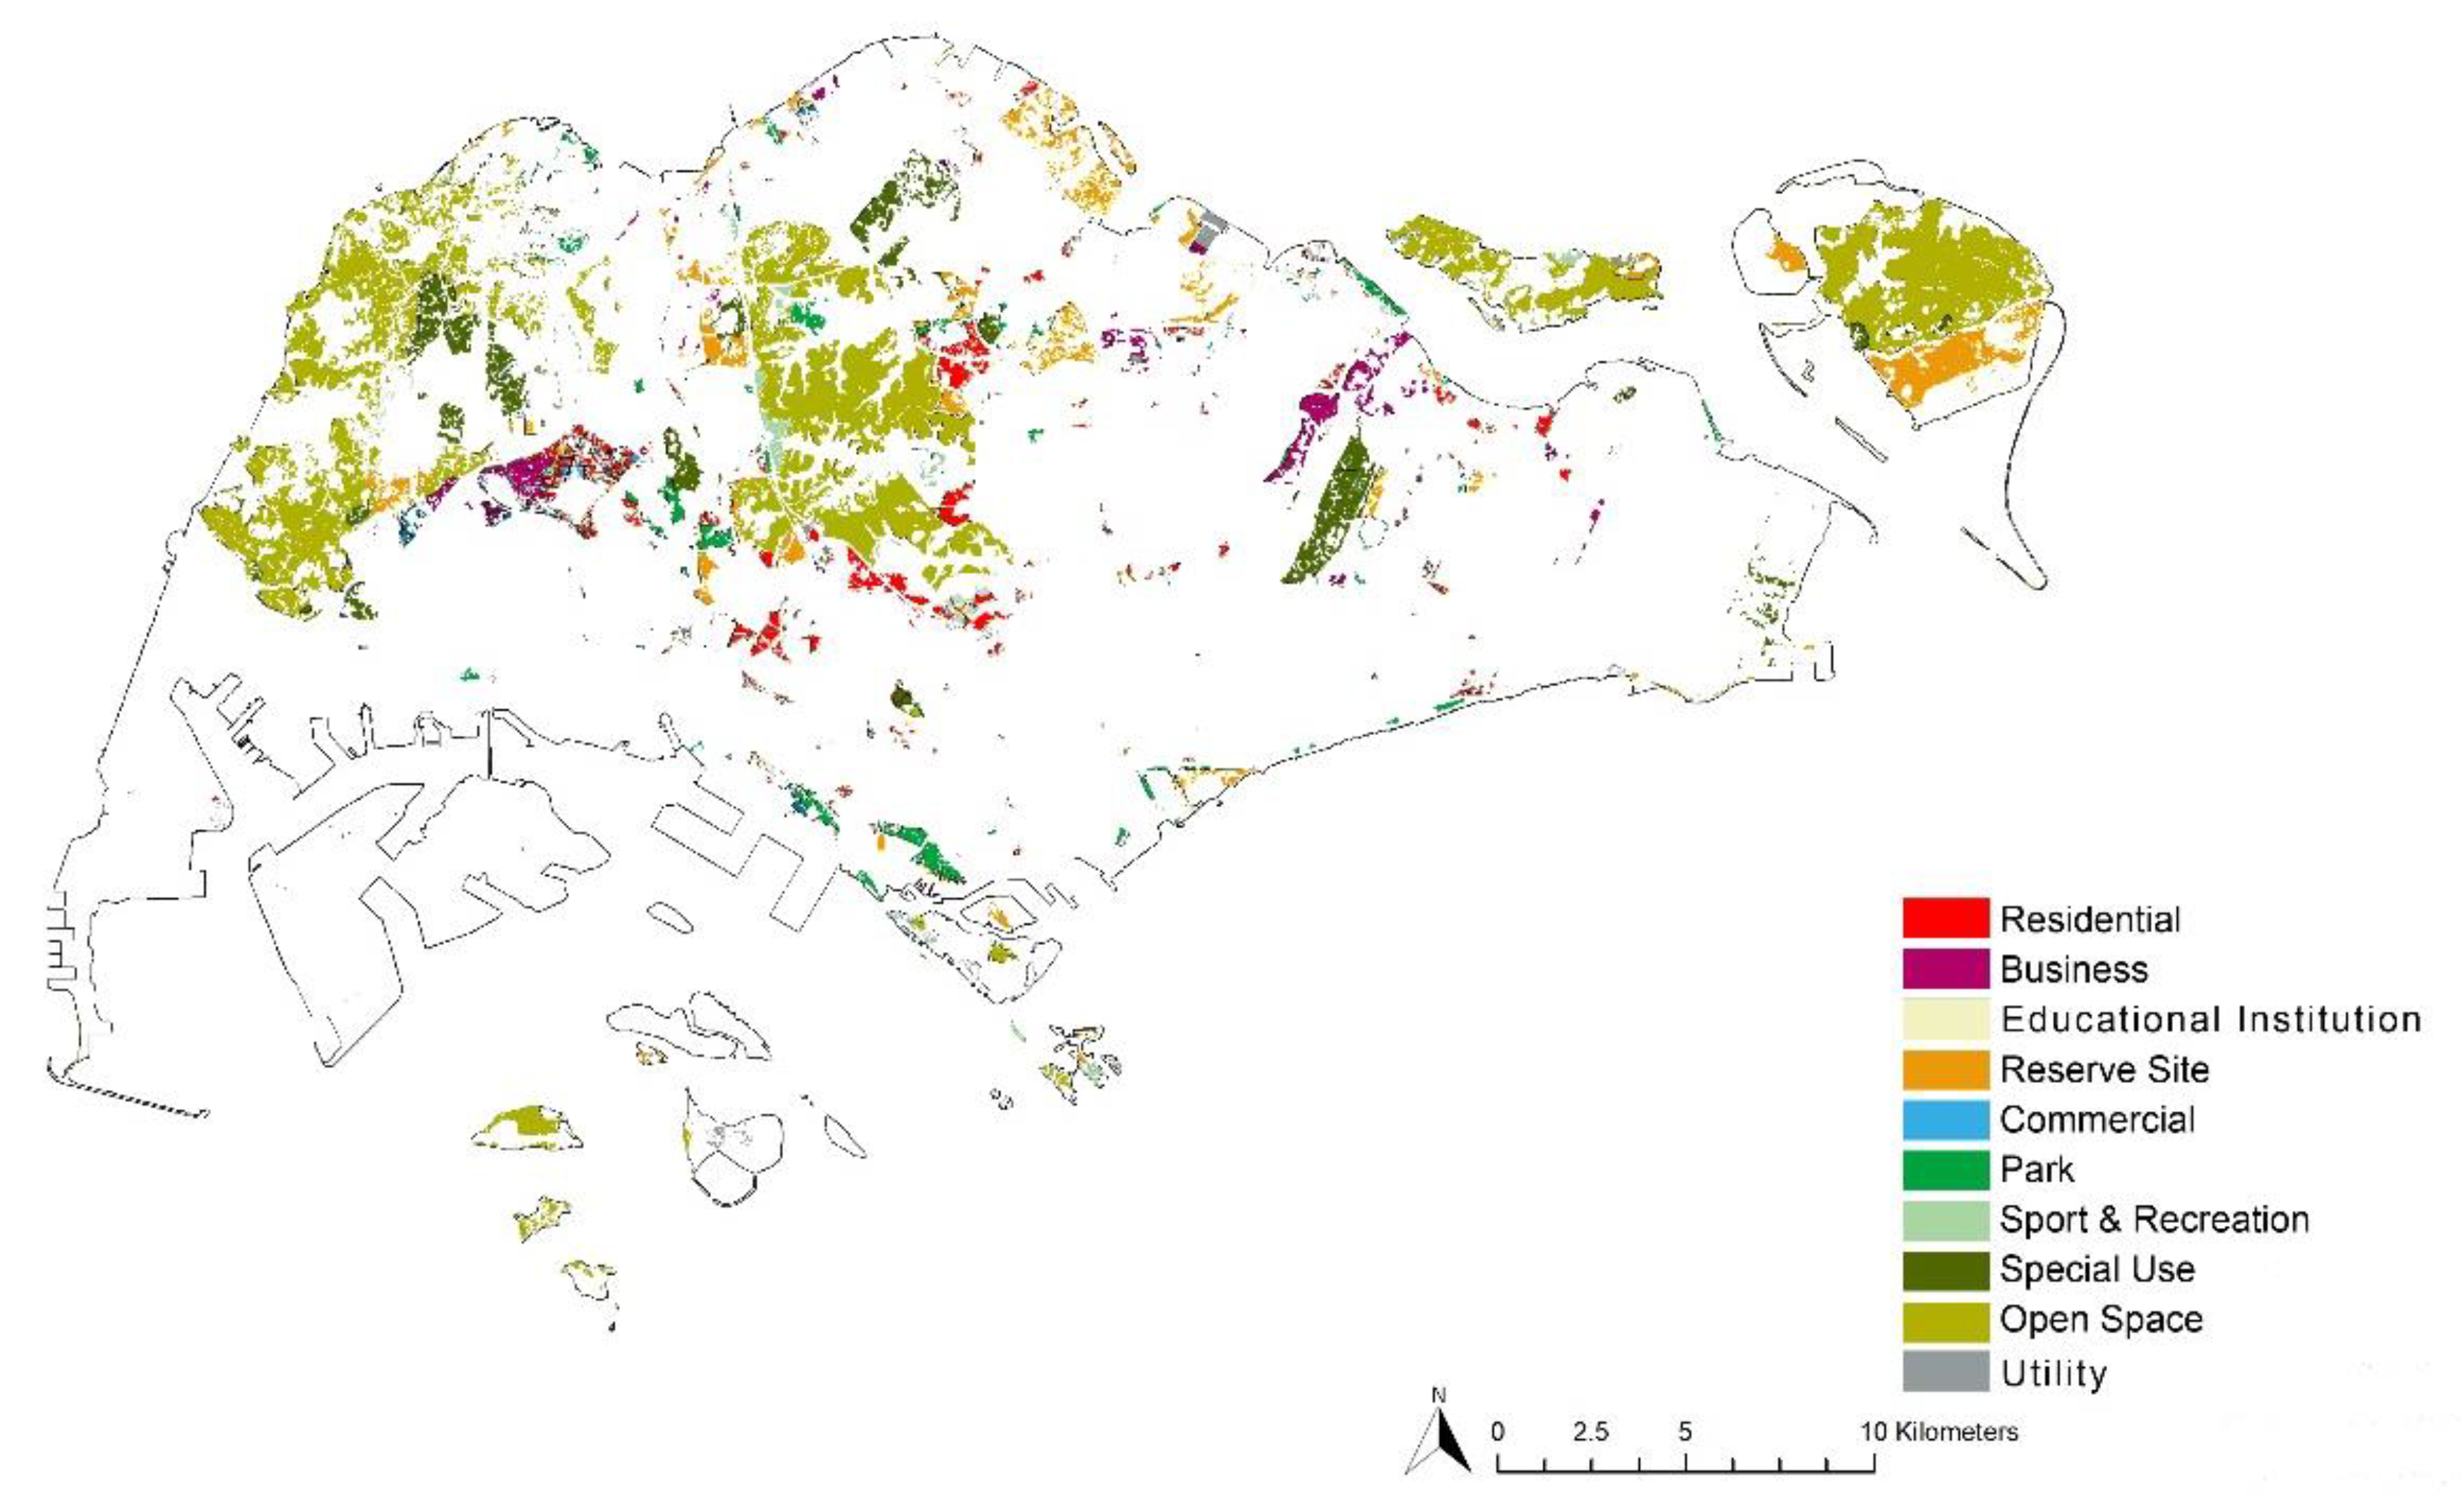
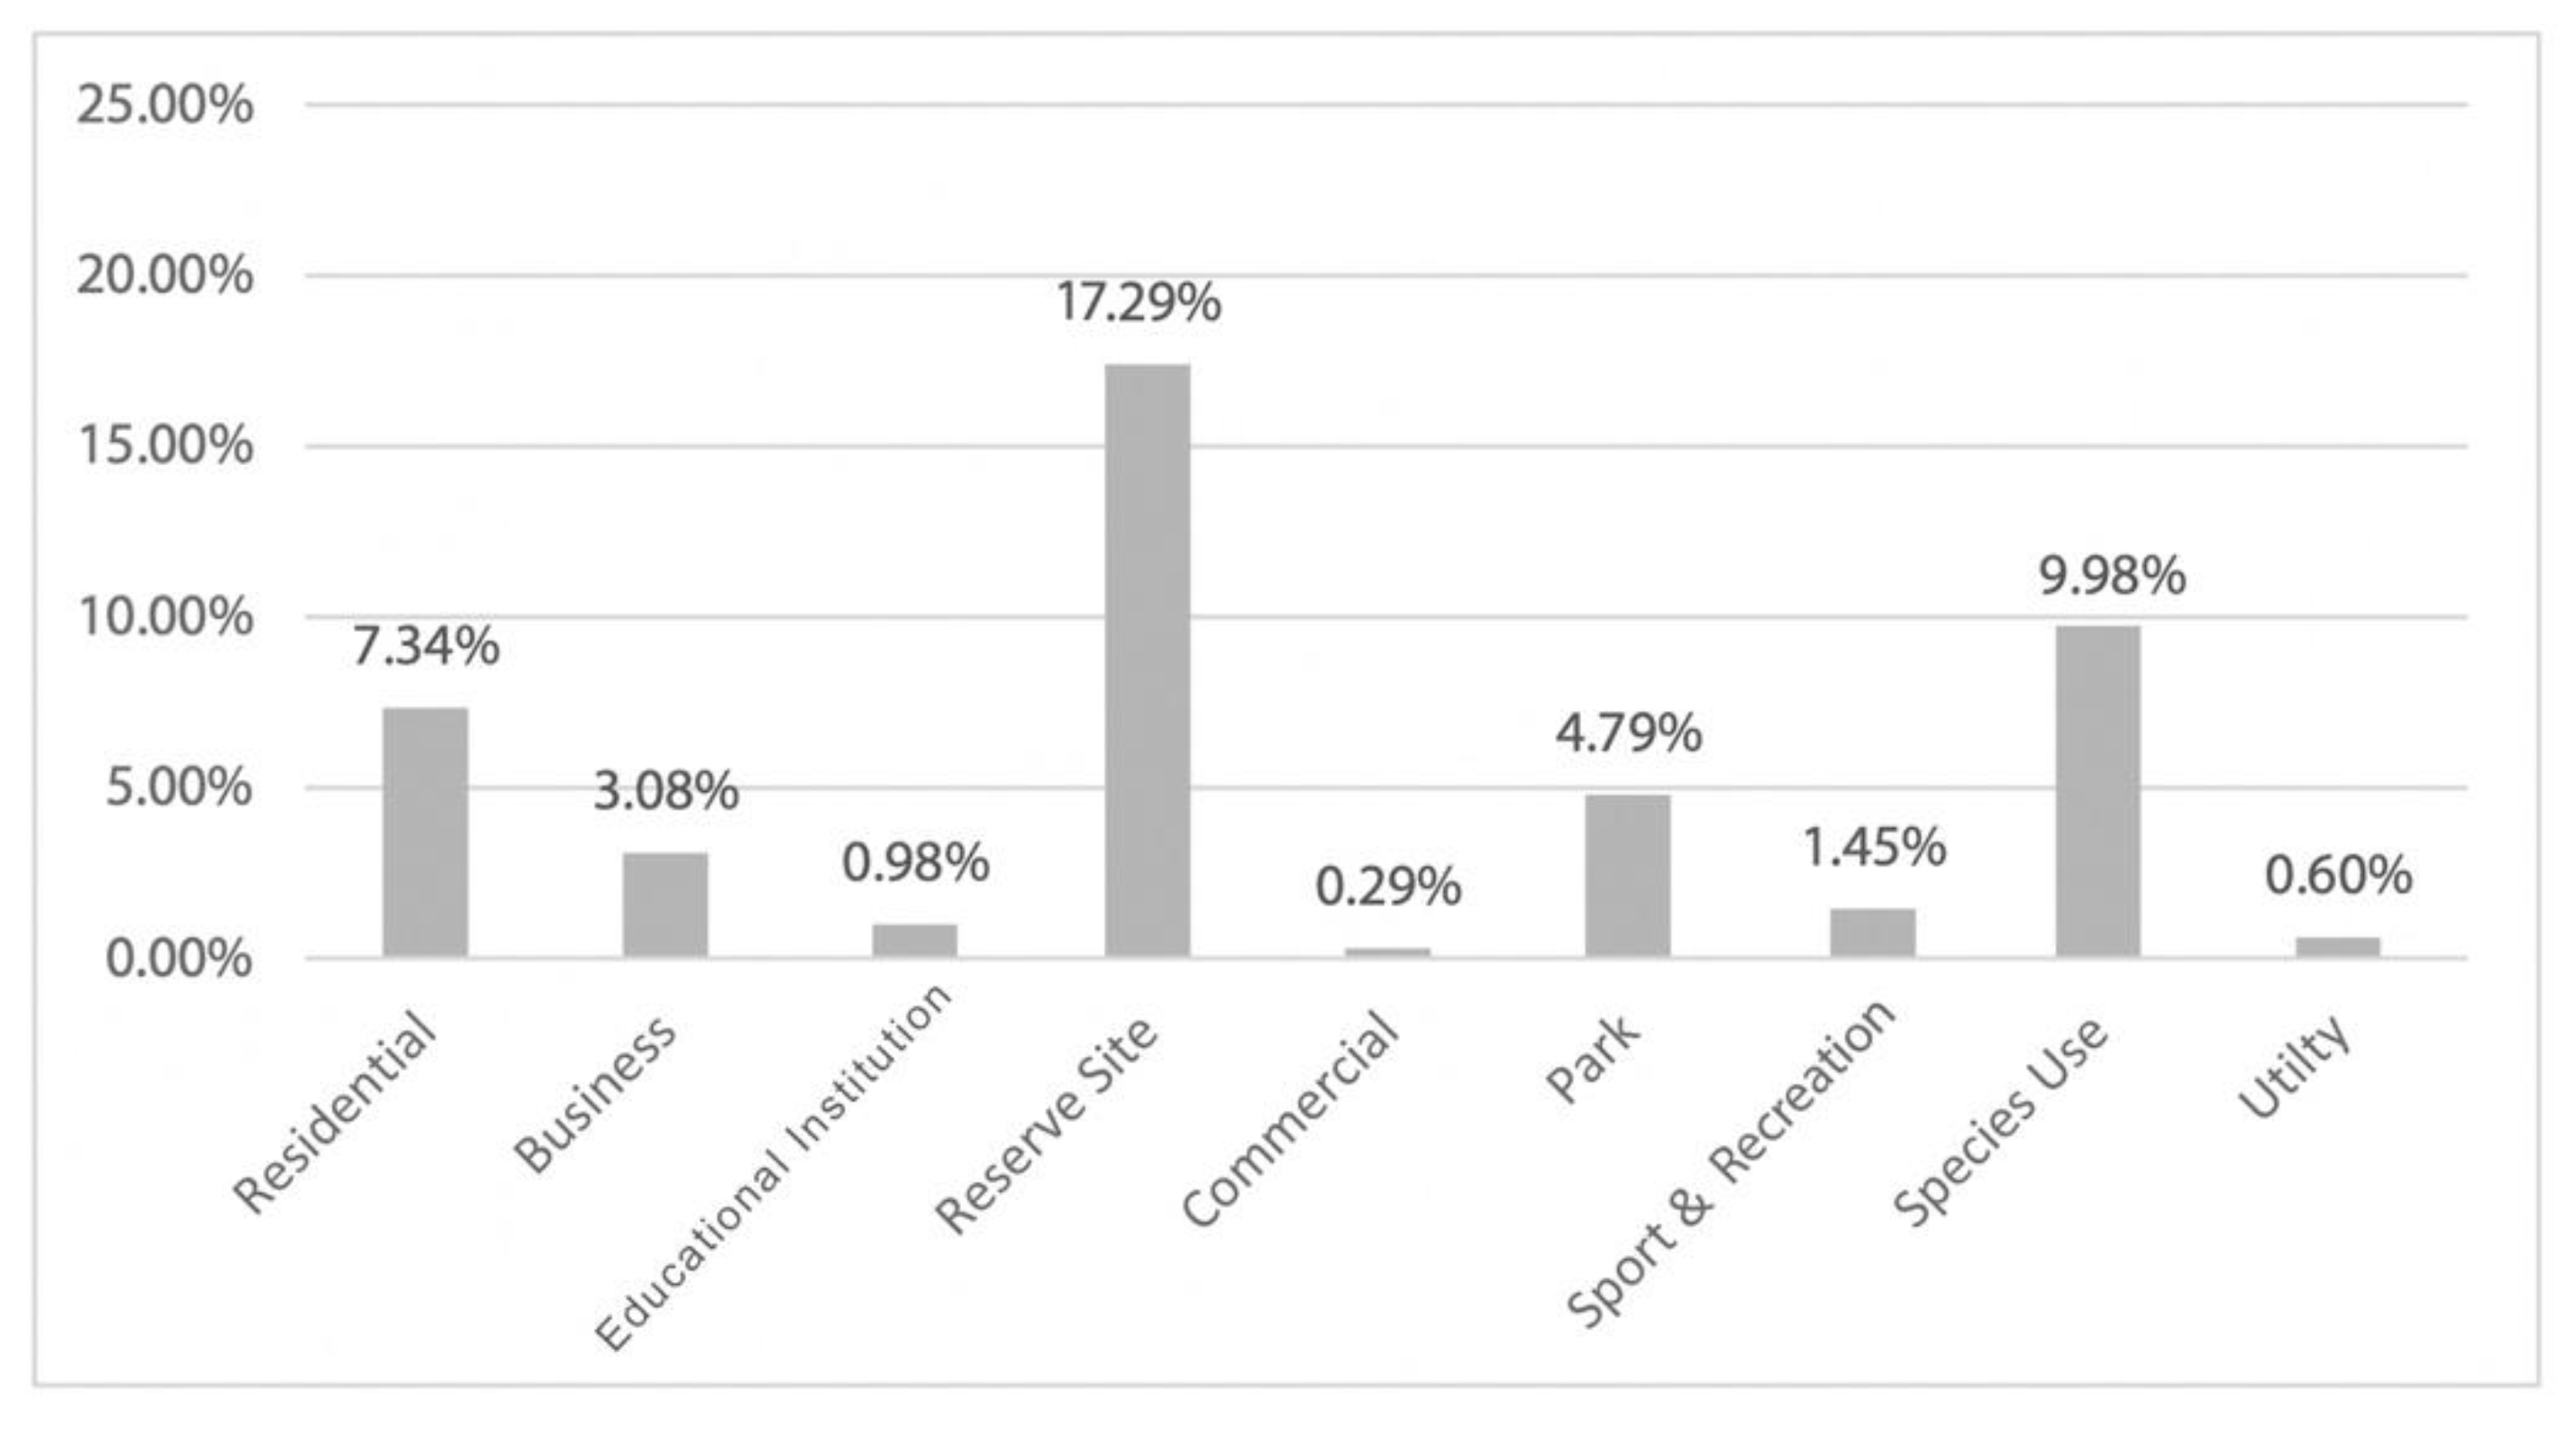
After overlapping the 2019 Master Plan of Singapore with the current secondary forest boundary, the future land use of secondary forest is indicated in Figure 11. According to the calculation (Figure 12), nearly 45.70% of secondary forests will continue to be open space while the remaining 54.30% will be transformed. Among the transformations, 17.29% of secondary forests will be reserve sites and 9.98% will be used for special uses, followed by 7.34% which will be transformed into residential use. Land use for parks accounts for 4.79% and for business accounts for 3.08%. The remaining secondary forests are planned for sports and recreation, educational institution, utility, and commercial use. Land use cover change in secondary forests will increase the landscape’s fragmentation level and accelerate the fragmentation process of ecosystems [35]. To maximize the conservation benefits of secondary forests, integrating local and regional patterns of fragmentation is critical [19]. It is necessary to find solutions to minimize the negative impacts of land use change. It is apparent that integrating secondary forests into land use developments such as residential uses and parks is a mutually beneficial strategy to achieve a balance between land use development and biodiversity conservation in the context of a high-density city.

Figure 11.
Future land use of secondary forest according to the URA 2019 Master Plan. (Source: the author).
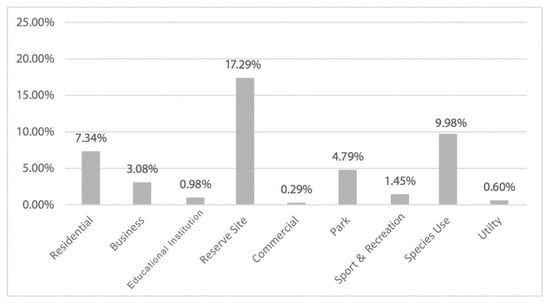
Figure 12.
Percentages of different future land uses of secondary forests. (Source: the author).
4. Discussion
4.1. Improving the Biodiversity Conservation Values of Secondary Forests
According to the literature review, patch size and plant density are both related to biodiversity. Thus, to conserve biodiversity in Singapore generally, large patches and patches with high plant density are recommended for preservation. However, as results on the plant density have shown, only 13.62% of secondary forests are very-high-density forests. There are many large patches with lower plant density, especially in the western and southern areas. For the forested areas with lower vegetation density and large patch sizes, forest restoration through tree improvement programs such as planting native species and fauna-attractive trees could be introduced to improve the level of biodiversity. This strategy is linked with Lee et al.’s research in the urban forests of Hong Kong, which indicates the idea that planting native species in urban forests can enrich the biodiversity of these sites [36]. Relevant theory is also mentioned in Abbas et al.’s research on the secondary forests of Hong Kong, in which the necessity of introducing late-succession species for ecosystem restoration in tropical secondary forests is emphasized [25]. Optimizing the structure of secondary forests will also enhance biodiversity, so constructing multi-layer canopies in lower-density vegetation areas could improve the complexity of the community and the biomass abundance [37]. According to the research results in the previous section, the patches of secondary forest in the south parts of Singapore are more fragmented, with smaller patch sizes and lower plant density, and are evaluated with lower biodiversity conservation values. Strategies such as optimizing the structure of secondary forests in the southern area could be applied to improve these biodiversity conservation values.
4.2. Considering Phase Development of Secondary Forests for Ecological Values
According to all of the previous analysis regarding patch size, plant density, and biodiversity assessment of the secondary forests in Singapore, each patch of secondary forest could be profiled according to the information on the patch size, plant density, and biodiversity value. Based on the principles that patches with larger sizes, higher plant density, and higher biodiversity values are more desirable for preservation, the ecological value rank for each patch could be assessed. Referring to the future land use of each patch, a development guide and strategies could be created based on these ecological assessments. Table 2 provides examples of the ecological assessments of ten patches, which may be useful for site-scale planning considerations. In these ten examples, there are three classes of patch sizes: patch size > 100 ha; 50 ha < patch size ≤ 100 ha; and 10 ha < patch size ≤ 50 ha, which refer to most desirable, desirable, and least desirable in sequence. This is similar to the plant density and biodiversity values. There are also three classes of plant density (Class 3, Class 4, Class 5) among these examples, and the rank of plant density is Class 5 > Class 4 > Class 3. The biodiversity values of these examples are from 6 to 10, and refer to the number of ecological profiles contained (mentioned in Section 3.2). In order to match the classifications of patch size and plant density, the biodiversity values were classified into three classes: 9–10 is high, 7–8 is the middle, and below 6 is low, so the biodiversity value ranking is 9–10 > 7–8 > 6. The ecological rank is assigned according to these assessments. For example, in terms of determining the priority for development of the same land, Patches No. 1142, No. 1387, and No. 1583 are all reserved for site development, but their ecological value ranks are No. 1583 > No. 1387 > No. 1142. As a result of this, patch No. 1142 may be developed first, while No. 1583 may need to be preserved and developed at a later stage. For patches with the same ecological value rank and future land use development, it is necessary to go back to look at the differences between them in detail. It is also necessary to undergo a trade-off process in which the criteria may be patch size < plant density or plant density > biodiversity values. In this case, further investigation and evaluations such as expert discussions, public opinion polls, and more site-specific analyses would be required.
Table 2.
Ecological value assignment for ten example patches of secondary forest in Singapore. (Source: the author).
For city-scale planning, assessment of the whole picture regarding the secondary forests should be considered. The selection of the phase development may take into consideration certain patch sizes (for example, over 10 ha), plant density (for example, plant density over Class 4), and biodiversity values (for example, values over 9) (Figure 13). Regarding patch size, based on the literature review that determined larger patches to contain more ecological value, patch size should be considered to be a part of the selection processes in terms of setting the priority of development. Large secondary forest patches are recommended to be conserved first (Figure 13a); the small patches may be developed first. As for a standard for what sizes of patches should be preserved, further investigations through other comprehensive analyses are still needed.

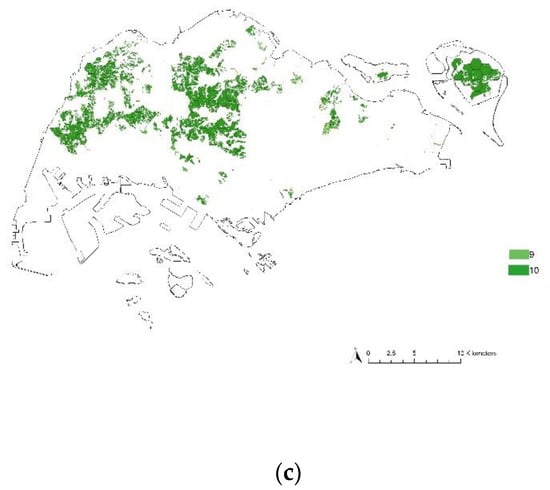
Figure 13.
Planning considerations for development and conservation priorities in terms of patch size (a), plant density (b), and biodiversity value (c): (a) selected patches with patch sizes of over 10 ha; (b) selected patches with high plant density; (c) selected patches with high biodiversity values. (Source: the author).
Regarding plant density, high-density patches (Figure 13b) are recommended to be granted priority for preservation during the new developmental stages. Patches with lower density could be transformed into buffer areas for the high-density area. New developments could be built up in the less dense areas. Regarding biodiversity assessment, patches with higher biodiversity values (Figure 13c) should be preserved for the cohesive habitat networks. The east–west-oriented biodiversity network could be strengthened through the restoration of forest patches in the east area.
4.3. Integrating the Secondary Forest into Future Land Use Development
It should be recognized that about 54.30% of secondary forests will be developed in the future, covering an entire area of about 7331 ha, which is 1.2 times larger than the recent total area of all parks and nature reserves. Among the future losses in secondary forests, residential development will occupy a remarkable portion of 7.34%, park development will account for 4.79%, and commercial and business development will account for 3.37%, followed by sports and recreation for 1.45% and educational institution development for 0.98%. There is potential for incorporating secondary forest into future development, as was previously mentioned. Besides ecological considerations, the social and cultural aspects of secondary forests should not be overlooked, as secondary forests are also connected with a sense of place and the improvement of human well-being. For residential development, ecological and social planning considerations should take such measures as integrating the forested area into the residential landscape and making the secondary forest an important part of the everyday landscape for residents. For park development, there is potential for optimizing the biodiversity values of existing patches by incorporating them with a large intensive ecological network such as in a park connector and nature reserve system. For commercial use, considerations may focus on how to maximize the ecological and economic benefits that the forest could provide. Dense vegetative structures could slightly cool down the heat effect in built-up areas [38]. Secondary forest patches with high vegetative density could be conserved for their micro-climate-ameliorating function. For sports and recreation, secondary forests could be integrated into the edge design of the sports field, since dense vegetation could form a part of the natural fence to weaken the barrier between humans and nature while still providing habitats and corridors for wildlife. For institutional developments such as social and educational uses, secondary forests could be integrated into community centers and scientific research or be transformed into learning forests for environmental education. Overall, there are many possibilities for integrating secondary forests into different land use scenarios for ecological, economic, and social benefits.
Besides the planning considerations, the site-specific design strategy could be guided by the profile information for each secondary forest patch in combination with other useful information such as precious resources and endangered wildlife species. Take the patch of Tagore Forest (developed in 2017) as an example, whose ecological profile is shown in Table 3. Based on its profile information, consideration for the design aspect may be guided as follows: as the size of Tagore Forest is in the medium range, of larger than ten ha and smaller than fifty ha, how large the forest area should be maintained needs to be discussed by all stakeholders to satisfy the requirements for both ecological aspects and social considerations. As the average plant density is Class 4, which means it is a forested area with high plant density and multilayered structures, it should be highlighted and protected as a habitat core while the less densely vegetated areas may be developed into built-up areas. The fact that biodiversity values are very high in the Tagore Forest, where it is one of the habitats for endangered species like the banded leaf monkey, should be recognized. In this case, biodiversity conservation should be implemented, such as protecting the key habitats and restoring the habitats in built-up areas. Furthermore, the ecological corridor that connects to the nearby nature reserve should be restored to improve ecological connectivity for the movement of wildlife. According to the literature review, the historical land use of the forest patches affects secondary succession and the composition of tree species [39]. Because the past land use for the Tagore Forest was abandoned land, more native species and fauna-attractive plant species could be introduced into the forest area. Last, but not least, water-sensitive design development could be incorporated into the new residential area, since there are two precious freshwater streams inside the forest.
Table 3.
Ecological Profile for Tagore Forest based on the information from site investigation in September 2016. (Source: the author).
Overall, there are many applicable planning and design strategies that could incorporate secondary forest into future land use developments. The first step to take before considering future development projects should be preserving forest patches with high biodiversity conservation values based on the ecological assessment. Other affiliated strategies could be: (1) managing increased runoff and water quality through new development; (2) reconnecting the ecological corridor and regenerating habitats for wildlife by implementing a succession planting scheme; (3) placing buildings in areas where they would minimize destruction to the forest; (4) maximizing the usage of natural resources like rainwater, topsoil, and existing trees; and (5) retrofitting urban infrastructures such as vehicular roads to support natural movements [38]. More planning policies should focus on conserving secondary forests in Singapore’s context. As the critical decision-maker in planning for the physical development of Singapore, URA should take the evaluation of ecological values of secondary forests into consideration for land use development prioritization and seek possibilities to integrate secondary forests into future land use development. URA should draw up more development control and conservation guidelines to consider the conservation of secondary forests. More urban planning and design strategies for integrating secondary forests should be advocated and explored by urban planners and landscape architects. Some of the planning, thinking, and strategies regarding secondary forests in Singapore is replicable and could translate to other high-density cities to inform new approaches to integrating secondary forests into future developments for biodiversity objectives.
5. Conclusions
In this paper, a comprehensive understanding of secondary forests in Singapore is provided through literature reviews. The necessity of the issue of future development of secondary forests is addressed. This paper offers a city-scale study of the distributional characteristics of secondary forests in Singapore. The current distribution of secondary forests in Singapore is updated, and the future land use of secondary forests is estimated. The analysis found that nearly 1782 hectares of secondary forest have been lost in Singapore over the last decade, and more than half of the existing secondary forests, nearly 7331 ha, will be developed. A comprehensive analysis regarding patch size, plant density, and biodiversity values are provided for planning guidance for minimizing the passive environmental effects when future urban development happens. Actions for the improvement of biodiversity for different cases of patches are discussed. Furthermore, practical planning considerations regarding the phase development of secondary forests are proposed. Planning and design strategies for different land use developments are presented, which provide examples of how to integrate secondary forests into future development. This article provides reference values for decision-makers regarding practical urban planning and land use development rather than theoretical principles. To achieve a balance between biodiversity conservation and urban development is not just a slogan anymore. This article fills the theoretical gaps in conserving secondary forests, especially towards integrating secondary forests into land use development. It demonstrates how to evaluate the ecological values of secondary forest patches in Singapore and utilizes the evaluation’s information to guide urban planning towards secondary forests. This research opens a discussion of how to evaluate the ecological values of different land patches based on the research results and to determine priorities for the selection of developments. More systematic analysis and site-specific studies of secondary forests are required for sensitive development in the future. Besides ecological assessments of secondary forests like what is analyzed in this paper, more social aspects of the evaluation, regarding public perception or sense of place, are also important for guiding future development. The future development of secondary forests is related to the overall quantity and quality of Singapore’s greenery, and more efforts in further studies and considerations of secondary forest should be involved in stakeholders’ negotiations for future developments.
Funding
This research received no external funding.
Institutional Review Board Statement
Not applicable.
Informed Consent Statement
Not applicable.
Data Availability Statement
The Landsat data was collected from the USGS website [https://earthexplorer.usgs.gov] (accessed on 25 December 2021). The 2019 Master Plan map of Singapore was collected from the URA official website [https://www.ura.gov.sg/maps/?service=MP#] (accessed on 10 November 2022).
Acknowledgments
I would like to thank my graduate school, National University of Singapore, where I learned lots of about combining design with research. I would especially like to thank Hwang Yun Hye and Tan Puay Yok, for their help and suggestions on this research topic and methodology. I also would like to thank the reviewers, who gave me professional suggestions.
Conflicts of Interest
The author declares no conflict of interest.
References
- Matos, F.A.; Magnago, L.F.; Aquila Chan Miranda, C.; de Menezes, L.F.; Gastauer, M.; Safar, N.V.; Schaefer, C.E.; da Silva, M.P.; Simonelli, M.; Edwards, F.A. Secondary Forest Fragments Offer Important Carbon and Biodiversity Cobenefits. Glob. Chang. Biol. 2020, 26, 509–522. [Google Scholar] [CrossRef] [PubMed]
- Samant, S. Cities in the Sky: Elevating Singapore’s Urban Spaces. Int. J. High-Rise Build. 2019, 8, 137–154. [Google Scholar]
- Menz, S.; Rassia, S.; Jiang, Y.; Kumar, A.; Bastianello, D.; Glaser, M.A.; Graham, C.C. Public Space Evolution in High-Density Living in Singapore: Ground and Elevated Public Spaces in Public Housing Precincts; Future Cities Laboratory, ETH Singapore SEC Ltd.: Singapore, 2014. [Google Scholar]
- Chokkalingam, U.; De Jong, W. Secondary Forest: A Working Definition and Typology. Int. For. Rev. 2001, 3, 19–26. [Google Scholar]
- Tan, P.Y. Urban Ecological Networks for Biodiversity Conservation in Cities. In Greening Cities; Springer: Berlin/Heidelberg, Germany, 2017; pp. 251–277. [Google Scholar]
- Corlett, R.T. The Ecological Transformation of Singapore, 1819–1990. J. Biogeogr. 1992, 19, 411–420. [Google Scholar] [CrossRef]
- Yee, A.T.K.; Corlett, R.T.; Liew, S.C.; Tan, H.T. The Vegetation of Singapore—An Updated Map. Gard. Bull. Singap. 2011, 63, 205–212. [Google Scholar]
- Wong, P.P. Artificial Coastlines: The Example of Singapore in Geomorphology of Changing Coastlines. Z. Geomorphol. Suppl. Stuttg. 1985, 57, 175–192. [Google Scholar]
- Corlett, R.T. Plant Succession on Degraded Land in Singapore. J. Trop. For. Sci. 1991, 4, 151–161. [Google Scholar]
- Tan, P.Y.; Feng, Y.; Hwang, Y.H. Deforestation in a Tropical Compact City Part A: Understanding Its Socio-Ecological Impacts. Smart Sustain. Built Environ. 2016, 5, 6099. [Google Scholar] [CrossRef]
- O’Dempsey, T.; Emmanuel, M.; van Wyhe, J.; Taylor, N.P.; Tan, F.L.; Chou, C.; Yi, G.H.; Heng, C. Nature Contained: Environmental Histories of Singapore; NUS Press: Singapore, 2014. [Google Scholar]
- Tan, P.Y.; Wang, J.; Sia, A. Perspectives on Five Decades of the Urban Greening of Singapore. Cities 2013, 32, 24–32. [Google Scholar] [CrossRef]
- Gilliland, H.B. Plant Communities on Singapore Island. Gard. Bull. Singap. 1958, 17, 82–90. [Google Scholar]
- Hill, R.D. Vegetation Map of Singapore: A First Approximation. J. Trop. Geogr. 1977, 45, 26–33. [Google Scholar]
- Wee, Y.C.; Corlett, R. The City and the Forest: Plant Life in Urban Singapore; Singapore University Press: Singapore, 1986. [Google Scholar]
- Turner, I.M.; Wong, Y.K.; Chew, P.T.; bin Ibrahim, A. Rapid Assessment of Tropical Rain Forest Successional Status Using Aerial Photographs. Biol. Conserv. 1996, 77, 177–183. [Google Scholar] [CrossRef]
- Yee, A.T.K.; Chong, K.Y.; Neo, L.; Tan, H.T. Updating the Classification System for the Secondary Forests of Singapore. Raffles Bull. Zool. 2016, 32, 11–21. [Google Scholar]
- Johnson, J.B.; Melnick, R. Ecology and Design: Frameworks for Learning. Island Press: Washington, DC, USA, 2002; Volume 1. [Google Scholar]
- Hughes, E.C.; Edwards, D.P.; Sayer, C.A.; Martin, P.A.; Thomas, G.H. The Effects of Tropical Secondary Forest Regeneration on Avian Phylogenetic Diversity. J. Appl. Ecol. 2020, 57, 1351–1362. [Google Scholar] [CrossRef]
- Forman, R.T. Urban Regionsecology and Planning beyond the City; Cambridge University Press: Cambridge, UK, 2008. [Google Scholar]
- Hough, M. Cities and Natural Process; Routledge: Abingdon-on-Thames, UK, 2002. [Google Scholar]
- Hwang, Y.H.; Roscoe, C.J. Preference for Site Conservation in Relation to On-Site Biodiversity and Perceived Site Attributes: An on-Site Survey of Unmanaged Urban Greenery in a Tropical City. Urban For. Urban Green. 2017, 28, 12–20. [Google Scholar] [CrossRef]
- McPherson, E.G. Cooling Urban Heat Islands with Sustainable Landscapes. In The Ecological City: Preserving and Restoring Urban Biodiversity; Platt, R.H., Rowntree, R.A., Muick, P.C., Eds.; University of Massachusetts Press: Amherst, MA, USA, 1994; pp. 151–171. [Google Scholar]
- Acevedo-Charry, O.; Aide, T.M. Recovery of Amphibian, Reptile, Bird and Mammal Diversity during Secondary Forest Succession in the Tropics. Oikos 2019, 128, 1065–1078. [Google Scholar] [CrossRef]
- Abbas, S.; Nichol, J.E.; Zhang, J.; Fischer, G.A.; Wong, M.S.; Irteza, S.M. Spatial and Environmental Constraints on Natural Forest Regeneration in the Degraded Landscape of Hong Kong. Sci. Total Environ. 2021, 752, 141760. [Google Scholar] [CrossRef]
- Gibson, L.; Lee, T.M.; Koh, L.P.; Brook, B.W.; Gardner, T.A.; Barlow, J.; Peres, C.A.; Bradshaw, C.J.; Laurance, W.F.; Lovejoy, T.E. Primary Forests Are Irreplaceable for Sustaining Tropical Biodiversity. Nature 2011, 478, 378–381. [Google Scholar] [CrossRef]
- Alvey, A.A. Promoting and Preserving Biodiversity in the Urban Forest. Urban For. Urban Green. 2006, 5, 195–201. [Google Scholar] [CrossRef]
- Corlett, R.T. The Vegetation in the Nature Reserves of Singapore. Gard. Bull. Singap. 1997, 49, 147–159. [Google Scholar]
- Turner, M.G. Landscape Ecology: The Effect of Pattern on Process. Annu. Rev. Ecol. Syst. 1989, 20, 171–197. [Google Scholar] [CrossRef]
- Nassauer, J.I. Cultural Sustainability: Aligning Aesthetics and Ecology; Island Press: Washington, DC, USA, 1997. [Google Scholar]
- Forman, R.T. Some General Principles of Landscape and Regional Ecology. Landsc. Ecol. 1995, 10, 133–142. [Google Scholar] [CrossRef]
- Hill, J.K.; Thomas, C.D.; Lewis, O.T. Effects of Habitat Patch Size and Isolation on Dispersal by Hesperia Comma Butterflies: Implications for Metapopulation Structure. J. Anim. Ecol. 1996, 65, 725–735. [Google Scholar] [CrossRef]
- Turner, M.G.; Gardner, R.H.; Dale, V.H.; O’Neill, R.V. Predicting the Spread of Disturbance across Heterogeneous Landscapes. Oikos 1989, 55, 121–129. [Google Scholar] [CrossRef]
- Brauner-Otto, S.R. Environmental Quality and Fertility: The Effects of Plant Density, Species Richness, and Plant Diversity on Fertility Limitation. Popul. Environ. 2014, 36, 1–31. [Google Scholar] [CrossRef]
- Legarreta-Miranda, C.K.; Prieto-Amparán, J.A.; Villarreal-Guerrero, F.; Morales-Nieto, C.R.; Pinedo-Alvarez, A. Long-Term Land-Use/Land-Cover Change Increased the Landscape Heterogeneity of a Fragmented Temperate Forest in Mexico. Forests 2021, 12, 1099. [Google Scholar] [CrossRef]
- Lee, C.H.; Tang, A.; Lai, D.Y.; Tai, A.P.; Leung, A.S.; Tao, D.K.; Leung, F.; Leung, S.S.; Wu, C.; Tong, S. Problems and Management of Acacia-Dominated Urban Forests on Man-Made Slopes in a Subtropical, High-Density City. Forests 2021, 12, 323. [Google Scholar] [CrossRef]
- Da, L.-J.; Song, Y.-C. The Construction of Near-Natural Forests in the Urban Areas of Shanghai. In Ecology, Planning, and Management of Urban Forests; Springer: Berlin/Heidelberg, Germany, 2008; pp. 420–432. [Google Scholar]
- Hwang, Y.H.; Feng, Y.; Tan, P.Y. Managing Deforestation in a Tropical Compact City Part B: Urban Ecological Approaches to Landscape Design. Smart Sustain. Built Environ. 2016, 5, 6099. [Google Scholar] [CrossRef]
- Thompson, J.; Brokaw, N.; Zimmerman, J.K.; Waide, R.B.; Everham, E.M., III; Lodge, D.J.; Taylor, C.M.; García-Montiel, D.; Fluet, M. Land Use History, Environment, and Tree Composition in a Tropical Forest. Ecol. Appl. 2002, 12, 1344–1363. [Google Scholar] [CrossRef]


Disclaimer/Publisher’s Note: The statements, opinions and data contained in all publications are solely those of the individual author(s) and contributor(s) and not of MDPI and/or the editor(s). MDPI and/or the editor(s) disclaim responsibility for any injury to people or property resulting from any ideas, methods, instructions or products referred to in the content. |
© 2023 by the author. Licensee MDPI, Basel, Switzerland. This article is an open access article distributed under the terms and conditions of the Creative Commons Attribution (CC BY) license (https://creativecommons.org/licenses/by/4.0/).