Abstract
Firms adjust their capital structures to avoid financial distress and bankruptcy to sustain in the market. Asian firms have significantly different financial patterns than their USA and European counterparts. The moderation model gains a better understanding of the relationship between the model variables. We tested the moderating roles of life cycle stages and macro-economic factor gross national income per capita to find their moderating impacts on the speed of adjustment towards target capital structures of Asian manufacturing firms from 2010 to 2018. Our sample of manufacturing industries comes from the eleven Asian economies. We used the dynamic GMM model to estimate moderating impacts and applied the pooled OLS and fixed effect estimations to test the validity of the coefficient of lagged leverage. We find that life cycle stages have positive moderating impacts, and different gross national incomes per capita have no significant effects in adjusting the capital structure. We test the combined moderating impacts of the life cycle and gross national income by applying the full model. The results reveal that moderator variables significantly impact adjusting the target capital structure. From the policy perspective, it is recommended that investors should consider the firms’ life cycle stages and per capita income of the economy in making their international investment portfolios. The government should ensure requisite finance for firms at subsidized interest rates to financially support them at critical stages like introduction and decline.
Keywords:
life cycle of firm; target capital structure; gross national income; sustainable development JEL Classification:
G32; G39; E01
1. Introduction
The firms exploit risks associated with higher debt and adjust their debt structures relative to equity financing. Adjusting the financing structure enables them to avoid financial distress and critical developments to bankruptcy. The dynamics of debt financing need not only to depend on the macro-economic market structures: bank-based economies [1] but also on the firms’ transitory states. Transitory states mean the firms’ cash flow patterns place them into different life cycle stages [2]. The stages pertain to specific characteristics that drive firms to adjust their capital structures against debt financing risks.
Debt financing is concerned with significant dimensions. It ranges from conventional financing [3,4] to green financing [5,6,7]. The financial institutions’ role in financing green projects also impacts the sustainability of the business [8]. Conventional financing is concerned with meeting the long, and short-term financing needs to finance the working capital and growth opportunities. Green financing is concerned with sustainability issues for both businesses and the planet. We investigate the firms’ debt financing behaviors to sustain their businesses in the dynamic global environment by responding to environmental and other conventional sustainability concerns.
The capital structure theories like the trade-off (TOT) hypothesis and pecking order (POT) hypothesis have been empirically investigated separately [4,9]. Some researchers have focused on both theories in their empirical studies [3,10]. In adjusting their target capital structures (TCS), firms seek the trade-off between the cost–benefits of debt financing (trade-off hypothesis). POT hypothesis supports that firms adjust their TCS by analyzing the cost of disequilibrium and the cost of adjustments in adjusting capital structures. Both theories complement each other in estimating the speed of adjustment (SOA) [11].
Some studies explore the moderating effects of capital structure; Mansour et al. [12] investigate the moderating effect of capital structure in determining the relationship between the quality of corporate governance and the performance of Malaysian firms. Mathur et al. [13] test the moderating impact of competitive intensity on the relationship between capital structure and the performance of Indian pharmaceutical companies. Mubeen et al. [14] investigate the mediating role of capital structure to analyze the association between performance and market competition among Chinese firms.
The moderator role of capital structure for the firms’ sustainability does matter. However, our study expects that the significant variable life cycle stages (LCS) are a significant moderator in adjusting the TCS because firms demonstrate significantly different financing patterns across the years [2]. Moreover, the differences in the financial patterns of the firms are due to the different explicit and implicit factors, including the life cycle and macroeconomic structures. Literature [15] has tested moderating impact of political competition and firms’ lobbies on the power of influence of firms on devising public policies. They find that political institutions effects significantly impact selecting the corporate strategic lobbies to get favorable public policies to grow and sustain. Khan et al. [16] investigate the moderator role of financial development to examine the impact of energy consumption on economic growth. However, our study expects that the moderator role of the economies’ gross national income (GNI) may impact the SOA of firms operating in different GNI structures. Based on our best knowledge, the extant literature is inadequate concerning the interdisciplinary subjects of LCS and GNI as the moderators in studying the SOA.
The life cycle of the firms captures the differences in adjustment speed of the capital to avoid financial distress conditions to sustain. The sustainability of firms varies across the life cycle, and expects that the firms have significantly different responses across their life cycle Moreover, it is expected that the firms in the different levels of GNI also have significant variations in the financing costs to adjust their capital structures. We use the GNI proxy to capture the economic and financial policy impacts across the high, upper, and middle GNI economies.
The firms not only have internal constraints, including insufficient funds but also have to face external constraints, including the bonding costs in adjusting their capital structures. The degree and magnitude of external constraints significantly differ across the economies. The firms in different GNI economies have significantly different total debt structures; in particular, they have proportionally higher short-term debt [17,18]. Firms in bank-oriented and market-oriented economies have significantly different financial structures [19].
Our empiric is different from other studies, majorly in different dimensions. First, we empirically estimate the adjustment speed of Asian manufacturing firms in adjusting their target financial structures by observing the moderator impact of the life cycle. Second, we empirically investigate the moderating impact of GNI in adjusting capital structure. Third, we use the full sample model by including both moderator variables, LCS and GNI. Fourth, we prefer to apply a dynamic System Generalized Method of Moments (GMM) to avoid the autocorrelation, endogeneity, and heteroskedasticity issues in the sample.
From its inception to its death, the firm has different trade-offs between the costs and benefits of debt and asymmetrical information. The classical school of thought posits that life cycle theory is sequential [20,21]. The contemporary school of thought asserts that life cycle theory is non-sequential [2]. In our paper, we follow the contemporary classification of the life cycle of firms into different stages, as proposed by Dickinson [2].
We have four primary objectives. First, we focus on Asian manufacturing firms to avoid heterogeneity. Second, we expect that different life cycle stages have different moderating impacts in adjusting target capital structures (TCS) to avoid bankruptcy and sustain in the market. Third, we also investigate the moderating impact effects of different GNI in adjusting the TCS. Fourth, we re-investigate the application of capital structure theories under the moderator roles of life cycle and GNI.
Our contribution to the interdisciplinary literature on corporate finance is to estimate the moderator roles of LCS and GNI in adjusting TCS. We assume that financial managers and investors respond differently across different GNI economies and LCS.
Our study has significant managerial implications for the management to have adequate supervision and control over the financial leverage along with the life cycle phases; otherwise, they ought to have faced difficulties to avoid the financial distress situations and sustainability that may lead to bankruptcy or voluntary liquidation.
We highlight different scholars’ significant contributions to advancing capital structure theories. We also highlight our research gaps and hypotheses related to the moderator roles of life cycle and GNI per capita in adjusting capital structure in Section 2. Section 3 provides the theoretical and conceptual framework of our empirical study. We discuss our research methodology to test the hypothesis in Section 4. Section 5 briefly discusses the results, and Section 6 concludes the empirical findings and suggests the policy implications for diverse stakeholders.
2. Theoretical Framework and Development of Hypotheses
2.1. Trade-Off Theory and Speed of Capital Adjustment
Modigliani and Miller’s [22,23] hypotheses explain the firms’ wealth and financial structures based on rational assumptions of a perfect financial market. Where the firms have homogeneous financial securities and investors have similar information related to the risks and returns of the different financial securities: debts and shares. They conclude that firms’ decisions are independent of the choice of the types of financial securities. Hirshleifer [24] and Kraus and Litzenberger [25] reject their rational assumptions on which firms make financial decisions. They argue that firms have irrational behaviors in financial decision-making. The different firms in the industry and economy have different information and constraints to make their financial decisions and different responses from the different investors to different financial decisions of the firms. The tax shields financial securities like bonds and bank loans, increasing the firms’ wealth [23,26]. However, the study by Miller [27] concludes that the net advantage of the tax game is zero when we take the broader range of tax regimes. The firms have different costs, including stochastic and non-stochastic [28,29] and other agency costs, to reduce the conflict of interests between the management, bondholders, and shareholders [30]. The above scholars and authors assume that the firms have a static nature of financial decisions and costs to adjust the capital structure.
However, the researchers Fischer, Heinkel, and Zechner [31] criticize the static nature of the TOT model in making financial decisions, mainly to adjust the capital structure. They rejected it based on the argument as it can incorporate practical implications, including transactions and adjustment costs in adjusting the target capital structure. Transaction costs determine the financial policies and behavior of the firms and propose the dynamic version of TOT. The critical dynamic nature of different costs associated with retiring the debt, issuing the share capital, and overpricing the potential debt arrangements [32,33]. All these costs, directly and indirectly, impact the choice of financial securities to adjust the financial structure.
Regarding the dynamic version of TOT, it is appropriate for our study to estimate SOA under the umbrella of the dynamic TOT version as it advocates that firms with higher adjustment costs tend to slow down the SOA in adjusting target financial structures [34,35,36].
2.2. Pecking Order Theory and Speed of Capital Adjustment
Donaldson [37] was the first researcher who coined the pecking order. His model only proposes the preferences of financial securities and debts based on the predefined hierarchy. Myers [29] criticizes Donaldson’s [37] pecking order model and suggests a new version of POT that supports soft target capital structure and adjusts it by capturing asymmetric financial information opportunities. Myers [29] proposed that POT addresses market timing, adverse section, and signaling effects to make financial decisions under the umbrella of asymmetric information opportunities and threats related to shares, bonds, and other financial loans. Information plays a critical role in capital markets, particularly in disclosing earnings announcements, mostly cited in accounting literature [38]. The firm prefers to issue new equities instead of debt to capture the asymmetric information opportunity for the overvalued shares [29]. The investors perceive debt issuing firms’ future earnings will meet their debt obligations, whereas equity issuing firms are reaping overvalued shares [39]. When asymmetric information concerns the firm’s riskiness, the financial manager prefers to retain earnings to avoid adverse selection [29]. The asymmetric information, signaling effects, and adverse selection induce the disequilibrium costs. The firms bear disequilibrium costs when they are above or below their targets.
2.3. Role of Moderators
The application of moderation variables is increasing to understand better the association among the model variables [12]. Sharma, Durand, and Gur-Arie [40] define the moderator variable as a variable that systematically modifies the relationship between the regressor(s) and regressed variables in form and strength. Moderator variables of LCS have implications for understanding the behavior of firms in adjusting their TCS.
Empirical studies have started to explore the moderating impacts of capital structure. Mansour et al. [12] investigate the moderating effect of capital structure in determining the relationship between the quality of corporate governance and the performance of Malaysian firms. Mathur et al. [13] test the moderating impact of competitive intensity on the relationship between capital structure and the performance of Indian pharmaceutical companies. Mubeen et al. [14] investigate the mediator role of capital structure to find the association between firms’ performance and market competition among Chinese firms. Based on the emerging application of moderating role variables, we explore the impacts of moderator roles of LCS and GNI in adjusting the SOA towards TCS.
2.3.1. Moderating Role of Firm’s Life Cycle
The researchers examine the firms’ life cycle from different perspectives. Researchers like Boulding [41] and Anthony and Ramesh [42] and their followers examine the firms’ life cycle as the living organism’s life cycle, known as the chronological and consecutive order approach. The second group of researchers, like Miller and Friesen [21] and Dickinson [2], criticize the chronological and consecutive order approach and propose the random and inconsecutive approach.
Like a living organism, a firm passes through birth to death stages [41,42]. The followers of the sequential approach prefer to use age and size as significant proxies for the life cycle [42,43,44,45,46,47]. The second school of thought argues that the firm life cycle is non-sequential in nature and exhibits a random and inconsecutive life cycle pattern [2,21]. Behavioral sciences are significantly different from physical sciences [48]. So, the proxies of firms’ life cycle stages based on a non-sequential approach are derived from the operating, financing, and investing activities. Classifying the firms into different life cycle stages based on cash flow patterns is parsimony, non-sequential, and concurrent with financial and economic theories, unlike the mono-variable and multi-variables proxies: age and size [2].
Based on the above discussion of the choice of the proxy variable to estimate the moderator role of the firm’s life cycle, we follow the non-sequential approach proposed by Dickinson [2]. This approach is appropriate to capture the dynamic and random stage of the firm life cycle. Furthermore, the investing and operating activities portfolio and matrix provide the roadmap for the firms in choosing and adjusting the financial structure. The operating activities concern the financial performance and market position of the firms. The marketing and other management strategies are formulated to capture a higher market share. The sales revenues from the different product portfolios are a significant source of internal financing to meet the financing and investing requirements. The investing activities concern the firms’ long-term survival and growth perspectives, whereas the financing activities concern maintaining short-term and long-term liquidity and solvency.
Capital structure is among the financing puzzle [27]. Firms have TCS and move to adjust their targets to avoid potential risks of bankruptcy and agency problems [9,10]. The sequential life cycle theory proposed by Dickinson [2] addresses the different financial characteristics of firms along with the life cycle stages. We find a research gap in exploring the moderator role of the life cycle in adjusting the capital structure to sustain. Thus, we expect that different LCS have different adjustment costs and moderators and slower the SOA towards the TCS.
We conclude that disequilibrium and adjustment costs in adjusting TCS have critical impacts on the SOA. We assume that the firms in the maturity stages are above their target capital and have comparatively lowered disequilibrium and adjustment costs due to their higher profitability, size, growth opportunities, and tangibility of assets. So, we hypothesize the following statement:
H1:
The maturity stages of Asian manufacturing firms have a comparatively higher moderator impact on capital adjustment speed than other stages.
2.3.2. The Moderating Role of the Gross National Income of the Economies
The financial structure of an economy formulates the financial pattern of the firms. Bank- and market-oriented firms have different financial preferences in determining the capital structure and adjustment speed [17,19,49]. Firms in developing and developed economies have different financial patterns [11]. The production sector always welcomes changes in technologies, including digitalization, and becomes an integrated part of a business’s production and non-production functions [50]. The economies pursuing infrastructure development to achieve their green economy objectives have reduced their adverse impacts on the material footprint [51]. Economic developments to achieve economic goals have dynamic interrelationships with financial development, information technologies, and carbon emission [52]. Economies with sustainability objectives have different economic policies that directly influence the manufacturing industry. Therefore, we assume that the manufacturing industry in a diverse GNI economy has different sustainability issues and financial requirements to sustain itself in the market. Asian firms from different economies face different financial constraints due to the differences in economic and financial structures. Firms from developing economies are more debt intensive in the long term and short term than their counterparts in advanced economies [17]. The economic and financial structure impacts the firms’ capital structure [11]. The financial structure of a country influences the firms’ choices of financing. The developments of equity and bank markets significantly affect the capital structure [17,19,49].
Firms in developed, transparent, and competitive financial markets have lower transaction costs. The Asian economies of Japan, Singapore, and South Korea are among the developed economies and characterized among the HI economies from 2010 to 2018. Therefore, we assume that high GNI economies’ financial markets have a higher moderating impact in adjusting capital structure than UMI and LMI economies. Further, our study compares the financial estimates’ results of the different GNI economies to find the moderator impacts on capital adjustment speed, so we hypothesize the following statement:
H2:
High gross national income economies have more moderator impact on the speed of capital adjustment of manufacturing firms than their counterparts in upper and lower gross national income economies.
2.4. Control Determinants of the Capital Structure
Control variables can impact dependent variables and identify the net effect of independent variables [53]. Therefore, it is imperative to include control variables to test our hypotheses.
2.4.1. Profitability
The profitability varies along with LCS. The introduction stage has uncertain revenues and costs [54]. Firms have lesser customers and market shares [2]. As the firm grows and becomes more prominent, it gains a positive profit margin. The firms in the maturity stage have the highest profit. However, firms begin to lose their market share in the decline stage [2]. POT supports the negative relationship between profitability and capital structure. Firms with higher profits finance their projects from internal sources. If a firm continuously finances its projects from internal sources causes, it to slow down SOA even if the costs of adjustment are lower [36,55,56]. TOT supports the positive relationship of profitability with capital structure. Firms with higher profits have lesser financial distress and bankruptcy costs and play an essential role incost–benefitt analysis in adjusting capital structure [57,58,59].
2.4.2. Growth Opportunities
Growth opportunities (market-to-book ratio) are an appropriate proxy to capture a firm’s expected growth, and it decreases along with LCS [2]. POT supports the positive relation of growth opportunities with capital structure. Firms consider stock prices by adjusting their capital structure [4,60]. TOT supports hostile relations with growth opportunities, as it is an intangible asset and cannot be collateral against debt [55,57,61,62,63].
2.4.3. Tangibility
Tangibility (investment in tangible assets) is higher in earlier stages than maturity. The firms in the maturity stage maintain the existing portfolio of fixed assets. The firms in the decline stage liquidate their tangibles to avoid financial distress situations [2]. POT supports that firms prefer to finance their fixed assets from internal sources [18,64]. TOT supports that firms with higher tangible assets have a higher collateral value that helps to reduce their bankruptcy and adjustment costs [57,65].
2.4.4. Size
The firm size (log of market capitalization) is cyclic and demonstrates nonlinear behavior across LCS [2]. Larger firms have more power to access debt markets than smaller ones [66]. POT supports that growing firms enjoy higher market share and profits and have ample surpluses to finance projects [64,67]. TOT supports that larger firms have more access to the financial market, lower financial and distress costs, and prefer debt financing.
3. Theoretical and Conceptual Framework
Figure 1 presents the theoretical and conceptual framework of the capital structure and speed of capital adjustment towards the targeted in the presence of the countries′ moderator variables of the life cycle and GNI. Our primary interest variable is the lagged financial leverage. The values of the leveraged-1 must range between 0 and 1. The coefficient of leveraget-1 measures the adjustment costs. The lower the estimate of it means the higher the adjustment speed. The adjustment speed is calculated by subtracting the coefficient of leveraget-1 from 1.
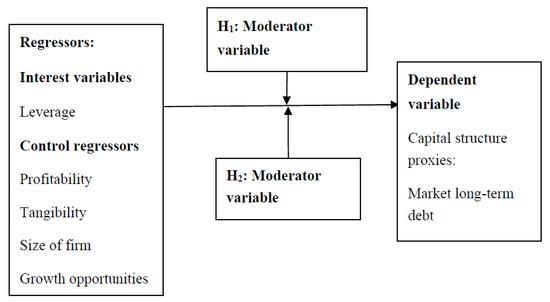
Figure 1.
Impacts moderatos on the leveraget−1. Source: Authors’ compilation.
Figure 2 presents the conceptual framework of the speed of capital adjustment and costs of adjustments across the life cycle stages within the different high, upper, and lower-middle GNI economies. We expect that the maturity stages of the firms in developed countries with high GNI levels have the lowest adjustment costs and eventually move toward the target at the highest speed.
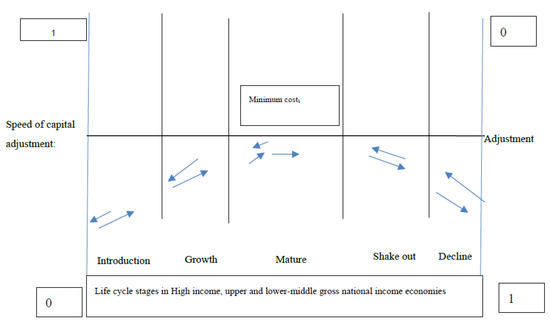
Figure 2.
Moderator impacts of life cycle stages and GNI in adjusting target capital structure. Source: Authors’ compilation.
Table 1 presents the names, measures, and empirical references of the variables used in this study:

Table 1.
Measurement of model variables.
4. Methodology and Data
We obtain financial data from the OSIRIS database and focus on the manufacturing industry as two US SIC codes (20–39). The manufacturing industry differs from service industries in terms of higher plant and machinery types and debt-equity structure patterns. Mainly, it is regulated and operated by the corporate sector. Our sample includes South Korea, Turkey, Japan, Pakistan, Singapore, Indonesia, Sri Lanka, Thai Land, India, Malaysia, and the Philippines. We select the sampled economies based on non-oil exporting and non-transition economies criteria.
Further, sampled economies have significant differences in their financial and economic structure. Japan, Singapore, and South Korea are classified as developed and placed into the HI panel data set. Malaysia, Turkey, and Thai Land are classified into UMI economies. In contrast, India, Pakistan, Sri Lanka, Philippines, and Indonesia are categorized into LMI economies as proposed by the World Bank Atlas methodology. ASEAN economies have a financial and economic attraction for domestic and international firms. Business regulations in these economies mitigate the adverse impacts of natural resources on financial development [73].
We have 2835 firms from 2010 to 2018, with 25,515 observations. We winsorized assets deflated variables at the 1st and 99th percentile to mitigate the effects of outliers and classify firms into different LCS based on the proposed methodology by Dickinson [2] as given in the following Table 2.
Table 2.
Scheme for categorizing a firm into different life cycle stages based on the cash flow pattern.
The firms are placed into introduction stages in a specified year when their operating and investing net cash flows are turned negative, and net financing cash flows are turned positive. The corporations with positive net operating and financing cash flows and negative net cash flow from investing activities are classified into growth stages. The firms with negative net cash flow from investing and financing activities and positive net operating cash flows are in the maturity stages. The firms are categorized into decline stages when they have net operating cash flows in negative, net investing cash flows in positive, and net financing cash flows in negative or positive. The remaining net cash flows, a pattern of operating, investing, and financing is attributed to shakeout stages as described in Table 2.
Pooled OLS, fixed effects, and instrumental regression econometric models frequently estimate SOA towards TCS. Pooled OLS is a simple technique but cannot estimate SOA. The lagged regressed variables, the regressors variable, violate the basic assumptions of OLS strictly endogeneity and exogeneity. Pooled OLS regression estimates biased estimate of the lagged regressed variable [74,75].
FE regression violates the normality assumption of residuals and potential heteroskedasticity issues in the dynamic model. It biases the coefficient estimate and standard error of lagged or regressed variables [76].
Instrumental regression estimates the efficient coefficient but inefficient standard errors in the presence of heteroskedasticity. GMM performs better than instrumental regression by solving the heteroskedasticity issue [77]. GMM estimation is appropriate for dynamic research models. It estimates the efficient coefficients and standard error by overcoming the endogeneity, heteroskedasticity, and auto-correlation issues that are commonly found in dynamic models. The significant efforts in the development of GMM were contributed by Holtz-Eakin et al. [78], Arellano and Bond [79], Arellano and Bover [80], and Blundell and Bond [81].
Sys GMM is appropriate because our data is dynamic and may have potential problems of autocorrelation, endogeneity, and heteroskedasticity to estimate the moderating impacts of interest variables. Equation (1) presents the base model to estimate the capital adjustment speed toward the target.
present the proxies of capital structure, vector of control determinants, and dummies for the life cycle, industry, country, and years, respectively.
The industry dummies measure the industry differences. The time dummies measure the impacts of the change in the economic and management policies.
We estimate the moderator impacts of the GNI and life cycle stages proposed by [82] by adding the interaction regressors of life cycle stages and GNI with financial leveraget−1 in Equation (1).
To estimate the moderator impact of LCS to estimate the SOA towards TCS, we formulate the following Equation (2)
The are interaction variables of the , and life cycle dummies to measure their moderating impacts on the capital adjustment speed.
To estimate the moderator impact of GNI to estimate the SOA towards TCS, we formulate the following Equation (3)
To estimate the moderator impacts of LCS and GNI to estimate the SOA towards TCS by using the full sample, we formulate the following Equation (4)
The and are interaction variables of the , and life cycle dummies and panel of different GNI to measure their moderating impacts on the capital adjustment speed.
Firms bear transaction and disequilibrium costs in adjusting their target capital structure. In this case, the value of δ lies within the range of 0 and 1, representing the adjustment speed for two consecutive periods at which firms adjust the target capital structure. The interaction terms capture the incremental costs of adjustment related to specific life cycle stages and panels of GNI. We capture SOA along LCS by 1- δ- ci-ei; where δ- shows the adjustment cost of reference dummies, ci and ei present the incremental adjustment cost compared with reference dummies of the life cycle and panel of GNI.
We apply Wooldridge Wu-Hausman, and White/Koenker tests to check autocorrelation, endogeneity, and heteroskedasticity problems to check the appropriateness of the Sys- GMM. AR (1) and AR (2), Hanen’s J, and Wald tests are used to examine the validity of the Sys-GMM results. The coefficient δ of the market leverage is only reliable when it remains in the range of estimates derived from OLS and FE regressions [74].
5. Results and Discussion
Data Distribution and Means of Debt Ratios
Table 3 presents the sample distribution across the economies (Panel A) and different panels of economies (Panel B). We have larger firms from Japan and India that constitute 68.22% of the total sample and a smaller sample from Sri Lanka and the Philippines. The Japanese and Indian stock exchanges have larger firms, whereas Sri Lank and the Philippines stock exchanges have small numbers. We have a larger sample from HI and a smaller sample from UMI panels of economies. Further, the maturity stage is a prime and stable stage [2] and has the highest firm-year observations than other stages.
Table 3.
Data distribution of life cycle stages across the sampled economies.
Table 4 presents the mean values of debt ratios across the economies and different national income panels. Panel “A” presents that pooled mean of total market and book debt ratios are 0.3166 and 0.3002, respectively. The pooled mean of long-term book and market debt ratios are 0.1698 and 0.1854, respectively. Economies such as Malaysia, Singapore, Japan, Philippines, Sri Lanka, Turkey, and Thailand have lower debt ratios from the pooled means of market ratios. In contrast, Pakistan, Indonesia, India, and South Korea have higher debt ratios. The total book debt ratio ranges from 0.4080 in India and 0.2298 in Singapore. The long-term book debt ratio ranges from the highest of 0.2612 in India and the lowest of 0.0877 in Sri Lanka.
Table 4.
Means of leverage across economies and GNI economic panels.
The debt ratios are highest in LMI economies and lowest in UMI (see panel “B” of Table 3). Our descriptive results have contradicted the studies of Demirgüç-Kunt and Levine [17] and Booth et al. [11]. We find that the HI panel of economies as the developed economies has lower long-term debt ratios than UMI and LMI economies. Further, our results contradict the panel of LMI economies, as it has higher debt ratios than HI and UMI economies. We conclude that Asian firms have different financial structures from USA and European firms. The governments of LMI, such as India and Pakistan, financially support the sick industries, and their stock markets are less efficient than others affecting the market debt ratios.
Table 5 presents the means of debt ratios across the life cycle stages for different panels of economies. The maturity stage is less debt intensive than the earlier stages in all the panels of economies. Firms in decline stages are less debt intensive than maturity stages [2,63], whereas our results contradict them; decline stages have a higher debt ratio than maturity stages in LMI and UMI economies.
Table 5.
Means of Life cycle Stages across the Economic Panels.
Table 6 presents descriptive statistics of control determinants. We find that manufacturing firms from LMI have the highest means but with more considerable instability than UMI and HI. We conclude that markets of LMI are more volatile due to asymmetric information, whereas the high-income financial and consumer markets are more stable and efficient than others. Further, we find that the profitability of Asian firms along LCS behaves the same as their counterparts in the USA and Europe across the three panels of the economies. At the same time, descriptive statistics of size and growth opportunities are contradicted by Dickinson [2] and Hasan and Cheung [63]. We conclude that Asian manufacturing firms have different financial characteristics along with LCS compared to USA and European firms. The reasons may be that its specific economic and financial characteristics differ, and more information gaps exist than in the USA and European regions.
Table 6.
Descriptive statistics for control determinants.
Table 7 presents the estimates of regressors to estimate the SOA in adjusting the target capital structure by observing the moderating impacts of LCS using the long-term debt ratio. We set the maturity stage of firms as a reference category to capture the incremental moderating impacts of the other life cycle stages. The significance of pre-diagnostic tests Wooldridge, WU-Hausman, and White/Koenker show that the Sys-GMM is suitable for our study. Further, the estimated coefficients of lagged debt ratio from Sys-GMM are in the range of the estimates from the regression (OLS) and fixed effect (FE) model. Therefore, we conclude that our estimates of lagged debt ratios are reliable.
Table 7.
Estimation of SOA by observing the moderator impact of life cycle stages by using long-term market debt ratio.
The coefficients of constant and stage dummies are significant. The positive significance of stage dummies coefficients shows that other stages are more debt intensive than the maturity stage, and the negative shows less debt intensive. Based on our results (Table 6), we conclude that maturity stages are less debt intensive as compared to earlier stages (introduction and growth) and less debt intensive as compared to the later stage (decline). These findings are similar to Dickinson [2]. The results support that the firm life cycle significantly modifies the debt means.
Further, lagged debt ratio is positively significant. It means that the maturity stages of firms have 0.7508 adjustment costs and adjust their capital structure towards TCS at the speed of 24.92% (1 − 0. 7508) annually. It means firms in maturity need approximately four years to adjust their TCS. The coefficients of interaction variables of other stages are positively significant, meaning that other life cycle stages have higher adjustment costs and slower adjustment speeds than the maturity stage. The introduction, growth, and decline stages’ adjustment speed are 15.85%, 15.45%, and 18.05%, respectively. The firms in the introduction, growth, and decline stages need approximately 6.3 years, 6.5 years, and 5.54 years, respectively, to adjust their TCS. Antoniou et al. [9] find that USA firms adjust their TCS with a speed of 32.20% annually (sample firms need approximately 3.11 years to adjust their TCS). However, our study classifies the Asian sample firms into different LCS.
The results support our hypothesis 1 that firms’ LCS significantly modifies the adjustment speed towards their TCS. In addition to the above, control determinants of profitability and growth opportunities are negatively significant, and tangibility is positively substantial, whereas the size is insignificant. We conclude that profitability follows the POT hypothesis [83], whereas tangibility and growth opportunities follow TOT [57]. The study of Mansour et al. [12] finds that capital structure has a significant moderator role between corporate governance and the performance of non-financial firms listed on the Amman Stock Exchange.
Table 8 presents the results of moderating impacts of GNI by using the long-term debt ratio. We set the HI economies as a reference category to capture the incremental moderating impact of UMI and LMI economies. The significance of pre-diagnostic tests indicates that the Sys-GMM is appropriate for this study. Our estimate of lagged debt ratio is reliable based on the Leverage (t−1)’s coefficients from GMM, OLS, and FE regressions.
Table 8.
Estimation of SOA by observing the moderator impacts of different gross national income structures by using long-term market debt ratio.
The coefficient of constant is significant, and interaction variables are insignificant. The insignificance of interaction terms shows that firms in upper and lower-middle-income economies have the same SOA towards TCS. We conclude that the firms from different GNI structures have no significant SOA towards TCS. The results do not support that GNI moderator impacts on adjusting SOA as proposed in our model 2.
Now, we estimate the moderating impacts by using the full model. We use LCS and GNI dummies and their interaction terms with the capital structure to explore their moderating effects in adjusting SOA.
Table 9 presents the full model estimates of regressors to estimate the SOA in adjusting the target capital structure by observing the moderating impacts of the life cycle and GNI using the long-term debt ratio. We set the maturity stage of firms and HI economies as reference categories to capture the incremental moderating impacts of the other life cycle stages and UMI and LMI economies. The significance of pre-diagnostic tests Wooldridge, WU-Hausman, and White/Koenker show that the Sys-GMM is suitable for our study. Further, the estimated coefficients of lagged debt ratios from Sys-GMM are in the range of the estimates from the regression (OLS) and fixed effect (FE) model. Therefore, we conclude that our estimates of lagged debt ratios are reliable.
Table 9.
Full model estimation of SOA by observing the moderator impacts of life cycle stages and different GNI structures by using long-term market debt ratio.
The coefficients of constant, stage, and economy dummies are significant. The positive significance of stage dummies coefficients shows that other stages are more debt intensive than the maturity stage, and the negative shows less debt intensive. Our findings are similar to Dickinson’s [2]. Similarly, the negative coefficients of economy dummies show that stages in HI economies are more debt intensive than UMI and LMI economies. Based on our results (Table 8), we conclude that maturity stages in HI economies are less debt intensive as compared to earlier stages (introduction and growth) and less debt intensive as compared to the later stage (decline) as compared to UMI and LMI economies. The results support that the firm life cycle and GNI have significant moderating impacts on the debt means.
Further, lagged debt ratio is positively significant. It means that the maturity stages of firms from HI have 0.6853 adjustment costs and adjust their capital structure towards target capital at the speed of 31.47% (1 − 0.6853) annually and take approximately 3.18 years to adjust their TCS. Our result for the SOA is similar to Antoniou et al.’s [9]. They find that USA firms adjust their capital structures at the speed of 32.20%. The coefficients of interaction variables of other stages are positively significant, meaning that other life cycle stages in HI have higher adjustment costs and slower adjustment speeds than the maturity stage. The introduction, growth, and decline stages’ adjustment speed are 22.70%, 20.40%, and 24.27%, respectively.
The coefficient of interaction variable LMI is positively significant. It means that firms in maturity stages in LMI have 0.0842 higher adjustment costs and a slower adjustment speed of 8.42% annually compared to other firms in maturity stages from HI. The introduction, growth, and decline stages’ adjustment speed are 14.28%, 12.05%, and 15.85%, respectively. The results support hypotheses 1 and 2 that firms’ life cycle and GNI of the economies have significant moderating impacts on the adjustment speed towards their TCS. Firms in maturity stages in HI economies have the highest SOA compared to other stages and have the highest SOA along with LCS compared to LCS in UMI and LMI economies. Our findings are similar to Booth et al. [11], who find that the country factors significantly impact the capital structure.
In addition to the above, control determinants of profitability and growth opportunities are negatively significant, and tangibility is positively significant, whereas the size is insignificant. We conclude that profitability follows the POT hypothesis [55], where tangibility and growth opportunities follow TOT [84].
Further, we re-test our hypotheses to get more insights by investigating the financial behavior of Asian firms by using the total market debt ratio. Table 10 presents the results of the total market debt ratio. The sign of stage and UMI economy dummies have remained the same and significant, whereas LMI is insignificant. Based on our result, we conclude that firms in distinct stages have the same total debt structure whether they operate in HI or LMI economies. In contrast, UMI firms are less intensive in using total debts than other economies.
Table 10.
Full model estimation of SOA by observing the moderator impacts of life cycle stages and different GNI structures using the total market debt ratio.
Further, lagged leverage is positively significant. The firms at maturity stages from HI economies have 0.7239 adjustment costs and adjust their target capital structure at a speed of 27.61% (1 − 0.7239) annually. The firms in growth and decline stages in HI economies adjust their target capital structure at 20.44% (1 − 0.7239 − 0.0717) and 17.84% (1 − 0.7239 − 0.0977) annually, respectively. The coefficients of interaction variables of UMI and LMI are positively significant. The firms from LMI have 0.0894 more incremental costs than HI, and their SOA towards the target capital structure proportionately decreases by 8.94%. The maturity, growth, and decline firms from LMI have SOA of 18.67%, 11.50%, and 8.90%, respectively.
Similarly, the firms in UMI have 0.0714 comparatively more incremental costs than HI. The firms from UMI have adjustment speeds towards their target of 20.47%, 13.30%, and 10.70% for maturity, growth, and decline stages, respectively. We find similar results of the moderating impacts of the firms’ life cycle and GNI on determining the speed of capital towards the target. Nevertheless, we find that the control determinant of size turns negative and supports the POT hypothesis.
6. Conclusions and Policy Implications
We explore the moderating impacts of the firms’ life cycle and GNI of the economies to estimate the manufacturing firms’ capital adjustment speed. We use a dynamic GMM estimator to report the main results. We also test the validity of lagged capital structure by using the pooled OLS and fixed effects estimators. In the first model, we find that life cycle stages have significant moderating effects in adjusting the capital structures for the sustainability of sample Asian manufacturing firms. In the second model, we see the moderating effects of different GNI structures insignificant. In the third model, we use the full model to explore the combined moderating effects in capital structure adjustment. The moderating effects of both life cycle stages and different GNI structures are significant for the speed of adjustment toward the target capital structure.
We find that maturity stages have more moderating impacts concerning capital structures’ adjusting behaviors than those in other stages. Further, the developed economies with higher GNI also exhibit higher moderating impacts than those reflected in counterpart UMI and LMI economies. In addition, our study finds that maturity stages with higher moderating impacts cause an increase in the speed of capital adjustment behavior in high-income economies compared to other stages and GNI economies. The firms that fall in maturity stages have higher profitability, diverse size, and more access to financial markets, which causes lower adjustment costs and higher adjustment speed compared to other stages of a firm’s life cycle.
Our study has specific implications for investors, policymakers, and financial managers. In light of the variation of financial resources and approaches to accessing the financial markets, investors should consider the stage of the firm and the economy’s national income in their international portfolios. Arya et al. [18] have pointed out that among the significant weaknesses of inefficient capital markets is a sheer lack of transparency in the financial reports, and as such, bond and stock market structures may also lack transparency and higher asymmetric information that could lead to risky decisions for the national and international investment portfolios involved. The firms in the well-established financial market may exploit the financial resources at the cost of both shareholders and bondholders. To avoid financial distress, the shareholders may weigh the potential chances of transferring their wealth to bondholders. The management may transfer the bondholders’ wealth to the shareholders by distributing earnings to the shareholders. The firms in the decline and introduction stages may have the chance to commit the wealth transfer to the bondholders in adjusting their capital target structures by offsetting the other disequilibrium costs. Similarly, the firms in the maturity stages may increase the earnings distribution to the shareholders and acquire additional debt to finance the growth opportunities.
The financial and other regulator and supervisory departments should formulate the framework to reduce the chances of the wealth transfer of the shareholders to the bondholders or vice versa, as is also posited by Imbierowic and Wahrenburg [85]. However, some developing and emerging economies need more technological, institutional, and other resources to increase the financial markets (stock and bond) transparency and efficiencies and increase international investors’ trust.
In line with the proposition made by Cetorell & Strahan [86], there is a gradual need to have the optimal financial market structures with the banks and other bonds markets for the upper and lower-middle-income economies to meet the business needs of the credit. Small and medium enterprises react and adopt sustainability-oriented innovation during public emergencies or pandemics in many forms, including production, marketing, information, labor, digital economy, environmental degradation, and service innovations [87,88,89]. The firms in the introduction, decline, and shakeout may prefer to issue the bonds in the well-developed bond markets due to the fewer financial restrictions than the banks’ loans. Growth and mature firms may prefer to use bank debts due to banks’ quick availability of financial resources. They may issue new shares to capture the asymmetric information opportunity windows.
Moreover, a flexible policymaking regime, particularly for the manufacturing industry, may help the firms to cater to the financial problems in their decline and shakeout stages, where these are nearer to liquidating their capital assets and may cause significant unemployment in their economy. The financial manager should have flexible production and financial strategies to remain in their prime life cycle stage, i.e., maturity. They should closely monitor their market share and financial resources to avoid financial distress, particularly in the introduction, growth, and decline stages.
Author Contributions
Conceptualization, Y.X.; Data curation, H.K.; Formal analysis, M.S.A. and M.U.Q.; Funding acquisition, J.Z.; Methodology, Y.X.; Writing—original draft, M.S.A. All authors have read and agreed to the published version of the manuscript.
Funding
This work was supported by the Humanities and Social Sciences Research Fund Project of the Ministry of Education (17YJC880145), Jiangsu Province “333 High-level Talents Training Project” Young and Middle-aged Academic Leader Project (2018SZJS-005), Project Social Science Foundation Jiangsu Province (Grant No.22GLB026).
Institutional Review Board Statement
Not applicable.
Informed Consent Statement
Not applicable.
Data Availability Statement
The original contributions presented in this study are included in the article. Further inquiries can be directed to the corresponding author.
Conflicts of Interest
The authors declare no conflict of interest.
References
- Ezeani, E.; Salem, R.; Kwabi, F.; Boutaine, K.; Bilal; Komal, B. Board Monitoring and Capital Structure Dynamics: Evidence from Bank-Based Economies. Rev. Quant. Financ. Account. 2021, 58, 473–498. [Google Scholar] [CrossRef]
- Dickinson, V. Cash Flow Patterns as a Proxy for Firm Life Cycle. Account. Rev. 2011, 86, 1969–1994. [Google Scholar] [CrossRef]
- Fama, E.F.; French, K.R. Testing Trade-off and Pecking Order Predictions about Dividends and Debt. Rev. Financ. Stud. 2002, 15, 1–33. [Google Scholar] [CrossRef]
- Kayhan, A.; Titman, S. Firms’ Histories and Their Capital Structures. J. Financ. Econ. 2007, 83, 1–32. [Google Scholar] [CrossRef]
- Wang, Y.; Zhi, Q. The Role of Green Finance in Environmental Protection: Two Aspects of Market Mechanism and Policies. Energy Procedia 2016, 104, 311–316. [Google Scholar] [CrossRef]
- Falcone, P.M. Green Investment Strategies and Bank-Firm Relationship: A Firm-Level Analysis. Econ. Bull. 2018, 38, 2225–2239. [Google Scholar]
- Falcone, P.; Sica, E. Assessing the Opportunities and Challenges of Green Finance in Italy: An Analysis of the Biomass Production Sector. Sustainability 2019, 11, 517. [Google Scholar] [CrossRef]
- Mazzucato, M.; Semieniuk, G. Financing Renewable Energy: Who Is Financing What and Why It Matters. Technol. Forecast. Soc. Change 2018, 127, 8–22. [Google Scholar] [CrossRef]
- Antoniou, A.; Guney, Y.; Paudyal, K. The Determinants of Capital Structure: Capital Market-Oriented versus Bank-Oriented Institutions. J. Financ. Quant. Anal. 2008, 43, 59. [Google Scholar] [CrossRef]
- Huang, R.; Ritter, J.R. Testing Theories of Capital Structure and Estimating the Speed of Adjustment. J. Financ. Quant. Anal. 2009, 44, 237–271. [Google Scholar] [CrossRef]
- Booth, L.; Aivazian, V.; Demirguc-Kunt, A.; Maksimovic, V. Capital Structures in Developing Countries. J. Financ. 2001, 56, 87–130. [Google Scholar] [CrossRef]
- Mansour, M.; Al Amosh, H.; Alodat, A.Y.; Khatib, S.F.A.; Saleh, M.W.A. The Relationship between Corporate Governance Quality and Firm Performance: The Moderating Role of Capital Structure. Sustainability 2022, 14, 10525. [Google Scholar] [CrossRef]
- Mathur, N.; Tiwari, S.C.; Ramaiah, T.S.; Mathur, H. Capital structure, competitive intensity and firm performance: An analysis of Indian pharmaceutical companies. Manag. Financ. 2021, 47, 1357–1382. [Google Scholar] [CrossRef]
- Mubeen, R.; Han, D.; Abbas, J.; Raza, S.; Bodian, W. Examining the Relationship between Product Market Competition and Chinese Firms Performance: The Mediating Impact of Capital Structure and Moderating Influence of Firm Size. Front. Psychol. 2022, 12, 709678. [Google Scholar] [CrossRef]
- Choi, S.-J.; Jia, N.; Lu, J. The Structure of Political Institutions and Effectiveness of Corporate Political Lobbying. Organ. Sci. 2014, 26, 158–179. [Google Scholar] [CrossRef]
- Khan, I.; Hou, F.; Irfan, M.; Zakari, A.; Le, H.P. Does Energy Trilemma a Driver of Economic Growth? The Roles of Energy Use, Population Growth, and Financial Development. Renew. Sust. Energy Rev. 2021, 146, 111157. [Google Scholar] [CrossRef]
- Demirgüç-Kunt, A.; Levine, R. Bank-Based and Market-Based Financial Systems: Cross-Country Comparisons; World Bank Publications: Washington, DC, USA, 1999. [Google Scholar]
- Arya, A.; Glover, J.C.; Sunder, S. Are Unmanaged Earnings Always Better for Shareholders? SSRN Electron. J. 2002, 17, 111–116. [Google Scholar] [CrossRef]
- Drobetz, W.; Wanzenried, G. What Determines the Speed of Adjustment to the Target Capital Structure? Appl. Financ. Econ. 2006, 16, 941–958. [Google Scholar] [CrossRef]
- Porter, M.E. Competitive Advantage of Nations: Creating and Sustaining Superior Performance; Simon and Schuster: New York, NY, USA, 2011. [Google Scholar]
- Miller, D.; Friesen, P.H. A Longitudinal Study of the Corporate Life Cycle. Manag. Sci. 1984, 30, 1161–1183. [Google Scholar] [CrossRef]
- Modigliani, F.; Miller, M.H. The Cost of Capital, Corporation Finance and the Theory of Investment. Am. Econ. Rev. 1958, 48, 261–297. [Google Scholar]
- Modigliani, F.; Miller, M.H. Corporate Income Taxes and the Cost of Capital: A Correction. Am. Econ. Rev. 1963, 53, 433–443. [Google Scholar]
- Hirshleifer, J. Investment Decision under Uncertainty: Applications of the State-Preference Approach. Q. J. Econ. 1966, 80, 252–277. [Google Scholar] [CrossRef]
- Kraus, A.; Litzenberger, R.H. A State-Preference Model of Optimal Financial Leverage. J. Financ. 1973, 28, 911–922. [Google Scholar] [CrossRef]
- Amin, M.S.; Khan, H.; Jaddon, I.A.; Tahir, M. Capital Structure Theories and Speed of Capital Adjustment towards Target Capital Structure along Life Cycle Stages of Asian Manufacturing Firms. JAFEE 2020, 6, 53–62. [Google Scholar] [CrossRef]
- Miller, M.H. Debt and Taxes. J. Financ. 1977, 32, 261–275. [Google Scholar] [CrossRef]
- Lloyd-Davies, P.R. Optimal Financial Policy in Imperfect Markets. J. Financ. Quant. Anal. 1975, 10, 457–481. [Google Scholar] [CrossRef]
- Myers, S.C. Capital Structure Puzzle. Available online: https://www.nber.org/papers/w1393 (accessed on 25 June 2021).
- Jensen, M.C.; Meckling, W.H. Theory of the Firm: Managerial Behavior, Agency Costs and Ownership Structure. J. Financ. Econ. 1976, 3, 305–360. [Google Scholar] [CrossRef]
- Fischer, E.O.; Heinkel, R.; Zechner, J. Dynamic Capital Structure Choice: Theory and Tests. J. Financ. 1989, 44, 19–40. [Google Scholar] [CrossRef]
- Goldstein, R.; Ju, N.; Leland, H. An EBIT-Based Model of Dynamic Capital Structure. J. Bus. 2001, 74, 483–512. [Google Scholar] [CrossRef]
- Hennessy, C.A.; Whited, T.M. Debt Dynamics. J. Financ. 2005, 60, 1129–1165. [Google Scholar] [CrossRef]
- Leary, M.T.; Roberts, M.R. Do Firms Rebalance Their Capital Structures? J. Financ. 2005, 60, 2575–2619. [Google Scholar] [CrossRef]
- Faulkender, M.; Flannery, M.J.; Hankins, K.W.; Smith, J.M. Cash Flows and Leverage Adjustments. J. Financ. Econ. 2012, 103, 632–646. [Google Scholar] [CrossRef]
- Byoun, S. How and When Do Firms Adjust Their Capital Structures toward Targets? J. Financ. 2008, 63, 3069–3096. [Google Scholar] [CrossRef]
- Donaldson, G. Corporate Debt Capacity: A Study of Corporate Debt Policy and the Determination of Corporate Debt Capacity; Beard Books: Fairless Hills, PA, USA, 2000. [Google Scholar]
- Kim, J.; Jung, S.; Ha, M. Consolidated Financial Reporting and the Effect of Mandatory IFRS Adoption on the Information Content of Earnings Announcements: Evidence from Korea. Asia-Pac. J. Account. Econ. 2021, 28, 674–695. [Google Scholar] [CrossRef]
- Connelly, B.L.; Certo, S.T.; Ireland, R.D.; Reutzel, C.R. Signaling Theory: A Review and Assessment. J. Manag. 2011, 37, 39–67. [Google Scholar] [CrossRef]
- Sharma, S.; Durand, R.M.; Gur-Arie, O. Identification and Analysis of Moderator Variables. J. Mark. Res. 1981, 18, 291–300. [Google Scholar] [CrossRef]
- Boulding, E. Family Adjustments to War Separation and Reunion. Ann. Am. Acad. Pol. Soc. Sci. 1950, 272, 59–67. [Google Scholar] [CrossRef]
- Anthony, J.H.; Ramesh, K. Association between Accounting Performance Measures and Stock Prices. J. Account. Econ. 1992, 15, 203–227. [Google Scholar] [CrossRef]
- Kieschnick, R.; Moussawi, R. Firm Age, Corporate Governance, and Capital Structure Choices. J. Corp. Financ. 2018, 48, 597–614. [Google Scholar] [CrossRef]
- Seifert, B.; Gonenc, H. Issuing and Repurchasing: The Influence of Mispricing, Corporate Life Cycle and Financing Waves. J. Multinatl. Financ. Manag. 2012, 22, 66–81. [Google Scholar] [CrossRef]
- Bulan, L.; Yan, Z. Firm Maturity and the Pecking Order Theory. J. Bus. Econ. 2010, 9, 179–200. [Google Scholar] [CrossRef]
- Faff, R.; Kwok, W.C.; Podolski, E.J.; Wong, G. Do Corporate Policies Follow a Life-Cycle? J. Bank. Financ. 2016, 69, 95–107. [Google Scholar] [CrossRef]
- Berger, N.; Udell, G.F. The Economics of Small Business Finance: The Roles of Private Equity and Debt Markets in the Financial Growth Cycle. J. Bank. Financ. 1998, 22, 613–673. [Google Scholar] [CrossRef]
- Cohen, P.; Cohen, J.; Aiken, L.S.; West, S.G. The Problem of Units and the Circumstance for POMP. Multivar. Behav. Res. 1999, 34, 315–346. [Google Scholar] [CrossRef]
- Clark, B.J.; Francis, B.B.; Hasan, I. Do Firms Adjust Toward Target Capital Structures? Some International Evidence. Available online: https://papers.ssrn.com/sol3/papers.cfm?abstract_id=1286383 (accessed on 1 September 2021).
- Li, Y.; Yang, X.; Ran, Q.; Wu, H.; Irfan, M.; Ahmad, M. Energy Structure, Digital Economy, and Carbon Emissions: Evidence from China. Environ. Sci. Pollut. Res. 2021, 28, 64606–64629. [Google Scholar] [CrossRef]
- Razzaq, A.; Ajaz, T.; Li, J.C.; Irfan, M.; Suksatan, W. Investigating the Asymmetric Linkages between Infrastructure Development, Green Innovation, and Consumption-Based Material Footprint: Novel Empirical Estimations from Highly Resource-Consuming Economies. Resour. Policy 2021, 74, 102302. [Google Scholar] [CrossRef]
- Irfan, M.; Chen, Z.; Adebayo, T.S.; Al-Faryan, M.A.S. Socio-Economic and Technological Drivers of Sustainability and Resources Management: Demonstrating the Role of Information and Communications Technology and Financial Development Using Advanced Wavelet Coherence Approach. Resour. Policy 2022, 79, 103038. [Google Scholar] [CrossRef]
- Yan, P.; Choi, Y.; Choi, S.; Jung, S. Agency Theory Approach for the Performance of Returnee Entrepreneurs. J. Appl. Bus. Res. JABR 2018, 34, 447–454. [Google Scholar] [CrossRef]
- Jovanovic, B. Selection and the Evolution of Industry. Econometrica 1982, 50, 649–670. [Google Scholar] [CrossRef]
- Flannery, M.J.; Rangan, K.P. Partial Adjustment toward Target Capital Structures. J. Financ. Econ. 2006, 79, 469–506. [Google Scholar] [CrossRef]
- Vasiliou, D.; Eriotis, N.; Daskalakis, N. Testing the Pecking Order Theory: The Importance of Methodology. Qual. Res. Financ. Mark. 2009, 1, 85–96. [Google Scholar] [CrossRef]
- Matemilola, B.T.; Bany-Ariffin, A.N.; Azman-Saini, W.N.W.; Nassir, A.M. Does Top Managers’ Experience Affect Firms’ Capital Structure? Res. Int. Bus. Financ. 2018, 45, 488–498. [Google Scholar] [CrossRef]
- Frielinghaus, A.; Mostert, B.; Firer, C. Capital Structure and the Firm’s Life Stage. S. Afr. J. Bus. Manag. 2005, 36, 9–18. [Google Scholar] [CrossRef]
- Pfaffermayr, M.; Stöckl, M.; Winner, H. Capital Structure, Corporate Taxation and Firm Age. Fisc. Stud. 2013, 34, 109–135. [Google Scholar] [CrossRef]
- Mahajan, A.; Tartaroglu, S. Equity Market Timing and Capital Structure: International Evidence. J. Bank. Financ. 2008, 32, 754–766. [Google Scholar] [CrossRef]
- Baker, M.; Wurgler, J. Market Timing and Capital Structure. J. Financ. 2002, 57, 1–32. [Google Scholar] [CrossRef]
- Hovakimian, A.; Opler, T.; Titman, S. The Debt-Equity Choice. J. Financ. Quant. Anal. 2001, 36, 1–24. [Google Scholar] [CrossRef]
- Hasan, M.M.; Cheung, A. Organization Capital and Firm Life Cycle. J. Corp. Financ. 2018, 48, 556–578. [Google Scholar] [CrossRef]
- Rajan, R.G.; Zingales, L. What Do We Know about Capital Structure? Some Evidence from International Data. J. Financ. 1995, 50, 1421–1460. [Google Scholar] [CrossRef]
- Fan, J.P.H.; Titman, S.; Twite, G. An International Comparison of Capital Structure and Debt Maturity Choices. J. Financ. Quant. Anal. 2011, 47, 23–56. [Google Scholar] [CrossRef]
- Pérez, S.E.; Llopis, A.S.; Llopis, J.A.S. The Determinants of Survival of Spanish Manufacturing Firms. Rev. Ind. Organ. 2004, 25, 251–273. [Google Scholar] [CrossRef]
- Marsh, P. The Choice between Equity and Debt: An Empirical Study. J. Financ. 1982, 37, 121–144. [Google Scholar] [CrossRef]
- Alves, P.F.P.; Ferreira, M.A. Capital Structure and Law around the World. J. Multinatl. Financ. Manag. 2011, 21, 119–150. [Google Scholar] [CrossRef]
- Anthony, J.H.; Petroni, K.R. Accounting Estimation Disclosures and Firm Valuation in the Property-Casualty Insurance Industry. J. Account. Audit. Financ. 1997, 12, 257–281. [Google Scholar] [CrossRef]
- Bartolacci, F.; Paolini, A.; Quaranta, A.G.; Soverchia, M. Assessing Factors That Influence Waste Management Financial Sustainability. Waste Manag. 2018, 79, 571–579. [Google Scholar] [CrossRef]
- Choi, J.-D.; Park, J.-H. The Performance Effect of Two Different Dimensions of Absorptive Capacity and Moderating Role of Holding-Cash. Technol. Anal. Strateg. Manag. 2016, 29, 1033–1047. [Google Scholar] [CrossRef]
- Xu, J. Profitability and Capital Structure: Evidence from Import Penetration. J. Financ. Econ. 2012, 106, 427–446. [Google Scholar] [CrossRef]
- Tang, C.; Irfan, M.; Razzaq, A.; Dagar, V. Natural Resources and Financial Development: Role of Business Regulations in Testing the Resource-Curse Hypothesis in ASEAN Countries. Resour. Policy 2022, 76, 102612. [Google Scholar] [CrossRef]
- Wooldridge, J.M. Inverse Probability Weighted M-Estimators for Sample Selection, Attrition, and Stratification. Port. Econ. J. 2002, 1, 117–139. [Google Scholar] [CrossRef]
- Bevan, A.A.; Danbolt, J. Testing for Inconsistencies in the Estimation of UK Capital Structure Determinants. Appl. Financ. Econ. 2004, 14, 55–66. [Google Scholar] [CrossRef]
- Petersen, M.A. Estimating Standard Errors in Finance Panel Data Sets: Comparing Approaches. Rev. Financ. Stud. 2009, 22, 435–480. [Google Scholar] [CrossRef]
- Baum, C.F.; Schaffer, M.E.; Stillman, S. Instrumental Variables and GMM: Estimation and Testing. Stata J. 2003, 3, 1–31. [Google Scholar] [CrossRef]
- Holtz-Eakin, D.; Newey, W.; Rosen, H.S. Estimating Vector Autoregressions with Panel Data. Econometrica 1988, 56, 1371–1395. [Google Scholar] [CrossRef]
- Arellano, M.; Bond, S. Some Tests of Specification for Panel Data: Monte Carlo Evidence and an Application to Employment Equations. Rev. Econ. Stud. 1991, 58, 277–297. [Google Scholar] [CrossRef]
- Arellano, M.; Bover, O. Another Look at the Instrumental Variable Estimation of Error-Components Models. J. Econom. 1995, 68, 29–51. [Google Scholar] [CrossRef]
- Blundell, R.; Bond, S. Initial Conditions and Moment Restrictions in Dynamic Panel Data Models. J. Econom. 1998, 87, 115–143. [Google Scholar] [CrossRef]
- Cohen, P. Applied Multiple Regression/Correlation Analysis for the Behavioral Sciences; Psychology Press: London, UK, 2014. [Google Scholar] [CrossRef]
- Tascón, M.T.; Castro, P.; Ferreras, A. How Does a Firm’s Life Cycle Influence the Relationship between Carbon Performance and Financial Debt? Bus. Strategy Environ. 2021, 30, 1879–1897. [Google Scholar] [CrossRef]
- Castro, P.; Tascón Fernández, M.T.; Amor-Tapia, B.; de Miguel, A. Target Leverage and Speed of Adjustment along the Life Cycle of European Listed Firms. BRQ Bus. Res. Q. 2016, 19, 188–205. [Google Scholar] [CrossRef]
- Imbierowicz, B.; Wahrenburg, M. Wealth Transfer Effects between Stockholders and Bondholders. Q. Rev. Econ. 2013, 53, 23–43. [Google Scholar] [CrossRef]
- Cetorelli, N.; Strahan, P.E. Finance as a Barrier to Entry: Bank Competition and Industry Structure in Local U.S. Markets. J. Financ. 2006, 61, 437–461. [Google Scholar] [CrossRef]
- Huang, W.; Yin, H.; Choi, S.; Muhammad, M. Micro- and Small-Sized Enterprises’ Sustainability-Oriented Innovation for COVID-19. Sustainability 2022, 14, 7521. [Google Scholar] [CrossRef]
- Xin, Y.; Chang, X.; Zhu, J. How does the digital economy affect energy efficiency? Empirical research on Chinese cities. Energy Environ. 2022, 1, 0958305X221143411. [Google Scholar] [CrossRef]
- Xin, Y.; Li, H.; Adebayo, T.S.; Awosusi, A.A. Asymmetric linkage between biomass energy consumption and ecological footprints in top ten biomass-consuming nations. Econ. Res.-Ekon. Istraživanja 2022, 1–26. [Google Scholar] [CrossRef]


Disclaimer/Publisher’s Note: The statements, opinions and data contained in all publications are solely those of the individual author(s) and contributor(s) and not of MDPI and/or the editor(s). MDPI and/or the editor(s) disclaim responsibility for any injury to people or property resulting from any ideas, methods, instructions or products referred to in the content. |
© 2023 by the authors. Licensee MDPI, Basel, Switzerland. This article is an open access article distributed under the terms and conditions of the Creative Commons Attribution (CC BY) license (https://creativecommons.org/licenses/by/4.0/).