Abstract
Forests provide multiple ecosystem services ranging from local livelihoods and socio-economic benefits to global ecological services. Despite these benefits, human activities have put immense strain on forest resources, resulting in forest degradation, impoverishment of the environment, and loss of livelihoods. Hence, monitoring forest cover change and identifying its drivers are essential for developing sustainable forest management strategies that restore forest resources and ecosystem services. This study examined the trends of forest cover changes and its drivers in and around the Semien Mountains National Park, Northwest Ethiopia, from 1984 to 2020. Data from Landsat satellite images of 1984, 1996, 2008, and 2020 were used for forest cover mapping and quantifying the changes using remote sensing techniques. A household survey and key informant interviews were also used to identify the drivers of forest cover change. Results showed an overall decline in forest cover and grasslands while cultivated lands, bare lands and built-up areas have registered gains in the study area. The percentage area under forests declined by about 31% (33,084 ha) over the past 36 years. This loss translates to an annual average forest loss of about 1.02% (919 ha). Conversely, cultivated land, bare land, and built-up areas have experienced an increase of about 159% (33,387 ha), 220% (10,121 ha), and 366% (6356 ha), respectively, over the last 36 years. Analysis of the 36-year change detection matrix revealed that about 62% of the study area experienced a transition, of which 21% and 41% were attributable to net change and swap change, respectively. The observed reduction in forest cover was driven by agricultural expansion, population growth, growing demand for fuelwood, livestock pressure, and forest fires. Such drastic changes in forest cover have a detrimental impact on the community’s well-being, biodiversity, climate, and the availability of forest ecosystem services. Thus, the study recommends concerted efforts by stakeholders to develop participatory forest management and public awareness that consider the co-existence of nature conservation and sustainable livelihoods.
Keywords:
deforestation; forest; gains; gain-to-persistent; loss; loss-to-persistent; net change; persistence; swap change 1. Introduction
Forests, covering about 30.8% of the global land area [1], are home to most of the terrestrial biodiversity on earth and provide multiple ecosystem goods and services [2,3]. It sustains the major life support system on earth and is essential for the development of the social and economic sectors of many countries [4]. Moreover, forests are vital sources and sinks of carbon [5], protecting soil and water resources as well as biodiversity conservation and climate change mitigation [6], and are essential for subsistence, employment, and income sources for some 1.6 billion people globally [7], and are a source of energy for over two billion people [8]. However, to meet their daily needs, humans have consistently deforested and fragmented large tracts of forestlands worldwide [9] and threatened the availability of forest ecosystem services [4].
Even though deforestation has reduced globally, it continues to be a primary concern in environmental discussions in tropical countries [10]. Tropical forests constitute an important ecosystem in the world due to the numerous resources and ecosystem services they provide to support human life [1]. However, they are beset with the problem of human disturbance, reducing their ability to perform their ecosystem function [7]. A recent report by FAO and UNEP (2020) [11] revealed that between 1990 and 2020, the global forest area declined by 4.4%, representing a net loss of 178 million ha. About 6 million ha of primary forest is lost each year globally in response to agriculture, poverty, urban expansion, infrastructure development, fuelwood extraction, forest fires, and other human activities [12,13,14,15]. Hence, forest loss can potentially interrupt important ecological services provided by forests and lead to overall impoverishment of the environment and loss of livelihoods [14,16,17]. This phenomenon is more pronounced in developing countries, where most of the world’s tropical forests exist.
The rates of forest cover changes in different countries or regions are not uniform but vary over time and space [18]. In some places, forest cover is slightly increased, while in others, it is declining. For instance, the highest percentage of annual forest loss was reported in developing countries, particularly in Africa (at 3.94 million ha year−1), followed by South America (at 2.6 million ha year−1) while in a few countries in Asia, Oceania, and Europe, a reverse trend of increasing forest cover has been reported [1]. The difference in the trends in forest cover change among regions partly reflects differences in forest management practices, policies, and weak enforcement [13] and the changes in land use demands [19] that promote deforestation.
Like many other developing countries, forests are vital to the socioeconomic and environmental well-being of Ethiopia [3]. Securing food, fuel and livelihoods for the country’s growing population is inseparably linked to the exploitation of forest resources [20]. Despite their wide-reaching significance, forest resources in the country have been declining both in size (deforestation) and quality (degradation) [21]. As estimated by Pohjonen and Pukkala (1990) [22], at the turn of the twentieth century, some 40% of Ethiopia and 90% of the highlands (> 1500 m) were forested. However, much of the forests had been cleared and reduced to 16% in the 1950s and shrank further to 2.7% in the 1990s [23]. The clearance and regeneration of forests occurred sporadically until the 20th century, after which deforestation became much more pronounced. Although reliable and consistent data on deforestation are scarce and contentious in Ethiopia, various sources have reported varying figures. For instance, Pohjonen and Pukkala (1990) [22] reported that the annual rate of deforestation in Ethiopia was about 800,000 ha year−1 during the 1950s, 163,000 ha year−1 between 1986 and1990 [24], and 141,000 ha year−1 between 1990 and 2010 [25]. The difference between estimates of deforestation is attributed to much of the information having been derived from indirect sources, and not from quantitative empirical studies.
The drivers of forest cover change in Ethiopia are dynamic and complex, varying in space and time depending on diversity in vegetation types, environmental history, livelihood, and topography [26]. However, recent studies in Ethiopia have revealed that the human factor, including population growth, uncontrolled fuelwood extraction, poverty, lack of forest and land-use policies, unstable land-tenure system, and socio-political instability, are responsible for forest cover change [17,27,28]. Additionally, recent urban expansions and infrastructure development have exerted pressure on forest cover in Ethiopia [3]. It is, therefore, impossible to generalize that forest cover changes occur on a broader scale and the drivers influencing these changes are inherent landscapes.
Although deforestation is a common phenomenon and affects all of Ethiopia, the highlands are the most vulnerable area due to a long settlement and agricultural history [17,29]. Various studies have been conducted in Ethiopia to examine forest cover change using GIS and remote sensing methods [17,26,29,30,31]. These studies have documented that forest resources have declined in both space and time. Conversely, other studies have reported a slight increase in forest cover in some parts of the country [32,33]. These disparate findings necessitate time and location-specific research using integrated research approaches.
The Ethiopian highlands, particularly the northwestern highlands, have experienced rapid and extensive land cover (LC) conversions, leading to loss of biodiversity, climate change, soil erosion, shortage of forest products, food insecurity and poverty [3,17,29]. Hence, quantifying and monitoring land cover change over time has become an increasingly important consideration for environmental and development management interventions [19]. Different studies have been conducted to quantify land cover change in the northwestern highlands [33,34,35]. These studies, however, tend to emphasize the rate of change rather than the attributable causes. In addition, they mainly focused on changes in land cover, primarily observed in the lower-altitude vegetation belts. However, reliable and consistent data on forest cover change have yet to be well-documented and quantified in relatively unknown, sensitive, and biodiversity hotspot areas of high-altitude forests in the Semien Mountains National Park (SMNP). High-altitude forests, like the Semien Mountains, are vital to ecosystem stability because they store rainfall, regulate flows, reduce soil erosion, and protect against floods, landslides, and rockfall [36].
The SMNP, characterized by a wealth of biodiversity and ecosystem services, is one of Ethiopia’s most important biodiversity hotspot areas. It also has global and local significance. Although the SMNP is a global biodiversity hotspot area, its forest resources are constantly under increasing threat due to people’s dependence on forests for energy consumption as well as forest products for livelihoods [37]. Even though deforestation is a common phenomenon, the gains and losses of forest cover from specific areas vary over time [17]. Few studies have been carried out to quantify the spatial and temporal aspects of LC change in the SMNP [38,39]. These studies, however, are partial in their spatial coverage and have not provided concrete evidence on forest cover change and its drivers using an integrated approach. The use of remote sensing (RS) and geographical information systems (GIS) in mapping and quantifying forest cover changes over time is crucial as it provides adequate information for identifying conservation hotspots to support decision-making for sustainable forest management [19,26,27]. However, it cannot provide an explanation about y and how changes occur [40]. As a result, integrating RS and GIS technologies with local land users’ knowledge is vital to assess the trends in forest cover change and identify the drivers [14].
Therefore, this study aimed to (i) quantify the spatiotemporal changes in forest cover over the past 36 years and (ii) identify the drivers of forest cover change in the rapidly changing environment of the SMNP. The findings of this study will contribute valuable information for the development of future conservation policies and strategies for forests in Ethiopia and other developing countries. In addition, the study will add to the existing literature on the deforestation process in Ethiopia.
2. Materials and Methods
2.1. Description of the Study Area
The SMNP is situated in North Gondar Zone, the Amhara National Regional State (ANRS), Northwest Ethiopia. It lies between latitude 13°29′21″ to 13°29′40″ N and longitude 37°51′36″ to 38°34′33″ E (Figure 1). The SMNP falls in five woredas (Districts), including Adi-Arkay, Beyeda, Debark, Janamora, and Telemt [41]. The altitude of the SMNP ranges between 1276 and 4540 m with unique physiographic features: topographical ruggedness with steep escarpments, rolling hills in the highlands, and flat terraces dissected by rivers in the lowlands [42]. Several peaks rise from the Semein Mountains, including Ras Dejen (4543 m), the highest peak in Ethiopia and the fourth highest in Africa [43]. The Semien Mountains have a unimodal rainfall distribution between June and September, ranging from 1350 to 1600 mm, whereas the mean daily temperature of −2 and 18 °C [44]. Owing to the differences in topography and geological events, different soil types, including Andosol, Phaeozem, Vertisol, Luvisol, Regosol, and Leptosol, exist [45]. Mixed subsistence farming is the principal source of employment and income for most households [37]. Forests, grasslands, cultivated land, and bare/degraded land are the most common LULC [42]. The Semien Mountains serve as a key water tower for downstream users, forming tributaries to the Tekeze River, which supplies water to millions of people in Ethiopia, Sudan, and Egypt [45].
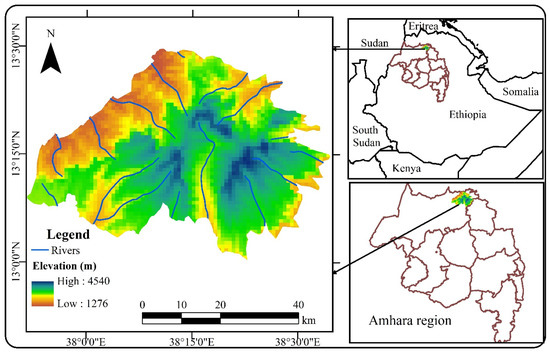
Figure 1.
Map of the Study Area.
The SMNP was inscribed in 1978 as one of Ethiopia’s four UNESCO World Heritage Sites [44]. They are important for biodiversity conservation since it is a habitat for several endangered endemic species, including the iconic and severely endangered Walia ibex (Capra walie) and Ethiopian wolf (Canis simensis) [43]. However, because of the decline of Walia ibex owing to deforestation, human settlement and cultivation, grazing, and infrastructure development, the SMNP was designated as a World Heritage Site in Danger in 1996 [39]. Furthermore, the Semien Mountains are part of the Afroalpine Center of Plant Diversity and the Eastern Afromontane Biodiversity Hotspot of plant diversity, comprising over 1200 plant species and three endemic to the Semien Mountains [42].
2.2. Data Type and Source
The study used both spatial and non-spatial (socio-economic) datasets from primary and secondary sources. The primary data were obtained from Landsat images, Google Earth, household surveys, key informant interviews (KII), and field observations. In contrast, secondary data were obtained from published materials, government reports and abstracts, and policy documents.
2.2.1. Spatial Data Acquisition
Four sets of satellite imagery, such as Landsat 4–5 (TM), Landsat 7 (ETM+), and Landsat 8 (OLI), of 1984, 1996, 2008, and 2020, respectively, were acquired from the United States Geological Survey (USGS) http://glovis.usgs.gov (accessed on 20 November 2022) (Table 1). Images were captured during the dry season to minimize the probability of classification error due to cloud cover and seasonal vegetation change. The imagery dates were defined based on major events that affected forest cover changes. For example, we selected 1984 as a period when the country was hit by drought, so forest cover change was expected; 1996 designated a period after the overthrow of the Derge regime so that massive deforestation and cropland expansion was assumed; and 2008 as a period when forest development, conservation, and utilization policies and strategies were launched. Finally, 2020 was selected to examine the current status. The satellite images were processed using ERDAS Imagine 2015, ArcGIS 10.7, and QGIS 2.41 software.

Table 1.
Characteristics of Satellite imageries used in the study.
2.2.2. Ground Truth Data
Ground truth data (reference data) for land cover classification and accuracy assessment were collected using various sources. The reference data for the historical images (1984, 1996, and 2008) were collected from Google Earth images supplemented by field visits and interviews with local elders [46]. In a participatory approach, information gathered from older people is a good reference data source for validating historical LULC maps [47]. Therefore, old toposheets were used to initiate the discussion among members of the elderly. For the recent images (2020), ground reference data were collected from a field survey using a handheld Garmin Global Positioning System (Garmin Etrex; 10 with ± 10 m accuracy). We supplemented these with a few ground reference points taken from Google Earth for some inaccessible areas. After considering the area of each land cover class, a stratified random sampling technique was employed to determine an optimal number of ground truth points for classification. Accordingly, 1717 sample points were collected from the representative LULC classes for the study years. Of these ground truth points, 1304 were used for image classification, while 414 sample points were used for the accuracy assessment of image classification for 2020 images.
2.2.3. Socio-Economic Data
Socio-economic data were collected from individual farmers and foresters via questionnaires, KIIs, and field observations to examine the drivers of forest cover changes in February 2021. Six kebeles from two districts were randomly selected for the survey. The household surveys were administered to 420 households using a systematic random sampling technique. The household survey aimed to examine socioeconomic conditions, perception of forest cover change and its associated drivers, and availability and perception of forest ecosystem service changes. Interviews were also conducted with purposively selected three officers from the forestry office and two from the Semien Mountains Park office to identify the problems and the current conditions of forests in the study site. In addition, ten local people over the age of 55 years who had lived in the area for more than 30 years were interviewed to gather historical data on forest cover changes and its drivers.
2.3. Satellite Image Pre-Processing
The satellite images have undergone both pre-and post-processing (Figure 2). To maximize classification accuracy, input images must have minimal contamination from clouds, haze, shadow, or other disturbances [48]. Since the SMNP is very rugged and mountainous, all Landsat images were topographically corrected with C-correction [49] to reduce topographic variability in observed reflectance [50]. The C-correction was performed by the free QGIS 2.41 program. In addition, atmospheric and radiometric corrections of all Landsat images acquired for the different years were made using a fully image-based technique developed by Chavez (1996) [51] called the Cost model; this model derives its input parameter from the image itself. The COST model was used to convert the at-sensor spectral radiance to reflectance at the surface of the Earth. It is a Dark Object Subtraction (DOS) extension that includes a multiplicative correction for transmittance [52]. Hence, COST incorporates all the elements of the DOS for haze removal and a procedure for estimating the effects of atmospheric gas absorption and Rayleigh scattering [53]. This correction was performed by implementing the algorithm in ERDAS Imagine 2015.
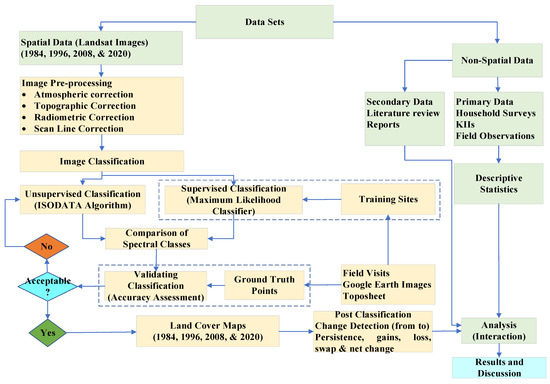
Figure 2.
Flow chart showing the process undertaken during the study.
Moreover, due to mechanical failure, the Landsat 7 image dated 1 January 2008 was affected by scan line corrector (SLC) off failure. Thus, scan lines were removed to enhance the image’s visual appearance using the Landsat toolbox’s ‘fix Landsat 7 scan line errors’ of ArcGIS software [54]. Finally, to ensure consistency between datasets throughout the classification and analysis process, all images were projected to the Universal Transverse Mercator (UTM) map Projection System, Zone 37N, and the Datum of the World Geodetic System (WGS84).
2.4. Image Classification
Following image pre-processing, both unsupervised and supervised image classification techniques were employed [53]. Initially, unsupervised classification was applied using the iterative self-organizing data analysis (ISODATA) algorithm to determine spectral clusters in images with ERDAS Imagine Version 15 [53,55,56]. Then, supervised image classification was performed after collecting training data from the existing LC classes [47]. From each of the predetermined LC classes, the signatures of polygons were delineated based on information gathered from field observations, elders, and Google Earth [56,57]. The pixels contained in these polygons were used to record the spectral signatures of the corresponding LC class acquired from satellite imagery [53]. A polygon of the homogenous map class was selected as a sample unit instead of a single pixel [47]. This was done to reduce misregistration and to increase the quality of the match of image segmentation analysis [58]. The classification was then performed using Landsat pixels that overlapped the training areas. The number of training sites varied from one LC to another depending on the ease of identification and level of variability [47]. Then, each pixel of the image dataset was placed in the LC class via the maximum likelihood classifier (MLC) algorithm in ERDAS Imagine 15 [53]. The MCL algorithm is the most widely adopted classification algorithm and uses a per-pixel method to account for the spectral information of LC classes [57]. A classification scheme of LC classes was developed for the study area (Table 2) based on a reconnaissance field survey, Google Earth imagery, and supplementary ancillary data [47,53,58].
Table 2.
Description of LULC types.
2.5. Post-Classification Processing
2.5.1. Accuracy Assessment
Classification is only complete once it achieves a satisfactory level of accuracy [61]. Before analyzing change detection, the accuracy of digitally classified images must be validated [27]. An accuracy assessment involves generating a set of points for the classified image and comparing their positions with ground truth data [62]. These sets of points were chosen at random. For this purpose, stratified random sampling was used by allocating sample points to each LULC class. Training points that were used in classification were not used for accuracy assessment. Accordingly, 414 reference points were collected from field surveys, interviews with elders, and ancillary data: Google Earth images and NDVI maps generated by a stratified random sampling technique [27,62] to validate the accuracy of the classified images. A confusion matrix was then used to evaluate classification accuracy [53]. An error matrix compares information from reference data to information on the classified map for some sample areas [63]. Finally, based on Congalton and Green’s (2009) [62] formula, we calculated overall accuracy, producer’s and user’s accuracy, and kappa statistics.
2.5.2. Change Detection Analysis
A post-classification image comparison algorithm was used to determine the changes observed and the transition between different LC classes [64]. This technique compares classified maps and provides “from-to” change class information. For instance, to examine LC change, the whole study period (1984–2020) was classified into four sub-periods (1984–1996, 1996–2008, 2008–2020, and 1984–2020). The LC change transition matrix was then computed in ArcGIS 10.8 using the overlay procedure to detect, compare, and analyze change patterns and direction, as well as to quantify persistence (The diagonal element in the matrix table indicates the proportion of the landscape that did not change (persistence) spatially over a period [56]), gains (gains are the difference between the column totals and persistence [57]), losses (losses are the difference between row totals and persistence [65]), net change (net change (absolute value) indicates the difference between gain and loss [66].), total change (total change is the sum of net change and swap or the sum of gains and losses [56,65]), and swapping (swap denotes the concurrent gain and loss of a given land cover class [65] and is computed by subtracting net change from the total change or two times the minimum of the gain and loss [66]) of LC that occurred in the study period [66,67]. In addition, the exposure of each LC class to a change was assessed using the loss-to-persistence ratio (Lp = loss/persistence), which assesses the vulnerability of LC classes to transition; gain-to-persistence ratio (Gp = gain/persistence), which measures the gain of a LULC to its time one size, and net change-to-persistence ratio (Np = net change/persistence) [68]. Values of Gp and Lp greater than one imply that a given LC has a higher probability of changing to another LC class than persisting in its current condition [67]. If the value of Np were negative, the LC class would have a higher probability of losing area to other LC types than gaining from them [69]. Furthermore, to compute the annual rate of LC changes at different periods, the compound-interest-rate formula proposed by Puyravaud (2003) [70] was used since it provides a standard method for making LC change comparisons that are insensitive to the different periods between observation dates [57].
where, r = annual rate of change, and A1 and A2 = area coverage of LC class at times t1 and t2, respectively.
3. Results
3.1. Classification Accuracy
An accuracy assessment was performed to validate image classification using a confusion (error) matrix. The diagonal values of an error matrix indicate reference data that are accurately classified, while the off-diagonal entries are misclassified references that correspond to various LC classes (Table 3). According to the classification report (Table 3), the classification had an overall accuracy of 90%, with a kappa coefficient (Khat) value of 0.88 attained for the 2020 classified map. Similarly, overall classification accuracies achieved were 89.9% (with khat of 0.87) for 2008, 89.3% (with khat of 0.87), and 88.6% (with khat of 0.85). The user’s and producer’s accuracy in each LC class ranged from 88.8% (BL) to 91.5% (BU) and 87.4% (GL) to 93.8% (BU), respectively. Applying the methods of Congalton and Green (2009) [62], the kappa coefficient values indicated strong agreements between the ground truth and the classified classes. Hence, the classified maps met the minimum accuracy requirements for the subsequent change detection analysis.
Table 3.
Accuracy Assessment results of 2020 image classification.
3.2. Status of Land Cover in and around the SMNP
A total of five LULC classes and four maps were identified and produced in the study landscape for the reference years 1984, 1996, 2008, and 2020 (Table 4 and Figure 3). In 1984, the SMNP and adjacent districts were dominated by forests and grasslands, covering about 45% and 44% of the landscape, respectively while non-vegetated lands (cultivated land, bare land, and built-up areas) covered the smallest area (11%). In 1996, grassland (~42%) replaced forests as the primary LC type, while forests retained their position as the second-largest LC class, accounting for about 37% of the total area. Cultivated land, bare land, and built-up areas are all steadily growing. In 2008, grasslands (39%) occupied the largest portion of the study area, followed by forests (37%) and cultivated land (18%). The remaining portions (6%) were occupied by bare land and built-up area. Grasslands continued to be the dominant LC class (37%) in 2020, followed by forests (31%) and non-vegetated LC classes (32%) (Table 4).
Table 4.
Summary of LULC change (in ha and %) from 1984–2020.
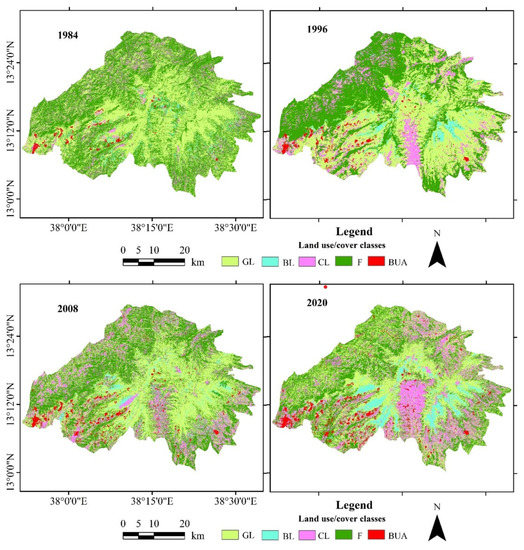
Figure 3.
Classified land cover map from 1984 to 2020.
The trend analysis for three consecutive periods (1984–1996, 1996–2008, and 2008–2020) showed spatiotemporal changes in the LC types. A comparison of the three study periods revealed that cultivated land increased at a rate of 3.7% (1984–1996), 2.3% (1996–2008), and 1.9% (2008–2020), at a rate of 971 ha year−1, 884 ha year−1, and 928 ha year−1, respectively (Figure 4). Similarly, bare land and built-up areas increased at higher rates than cultivated land in the three study periods. Conversely, substantial forest cover and grassland reductions were observed during the entire study period.
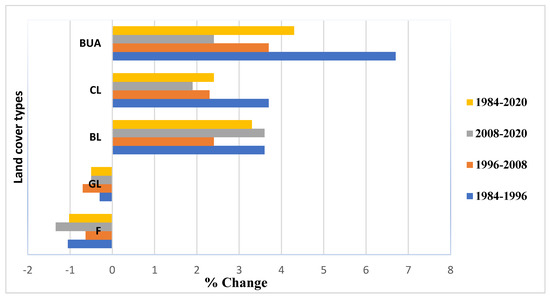
Figure 4.
Percentage of change in each land cover type.
3.3. Forest Cover Change
Table 5 shows the trends and rate of forest cover change in the study area. The results indicated that between 1984 and 2020, about 33,094 ha of forest was cleared, which is 31% of the forest cover in 1984. This translated to around 919 ha (1.02%) of forests being deforested annually. However, the highest rate of deforestation was observed during the third period, i.e., in 2008 (−1.34%), followed by the first period (–1.05%). According to experts, the reduction of forest cover during the first period (1984–1996) was most likely attributed to the civil war between the Derge and the current government, drought, and growing demand for forest products by the communities residing in the study site.
Table 5.
Rate of deforestation in ha and % (1984–2020).
Nevertheless, the reduction in forest cover during the second period (1996–2008) was attributed to changes in the regime. When the present government came to power, large, forested areas were converted into agricultural land, particularly during the transition, contributing to forest loss. Similarly, in contrast to the 2007 forest development, conservation, and utilization policy and strategy, forest resources in the study area declined substantially in the third period (2008–2020). Several factors could contribute to this, including weak institutional arrangement, rapid population growth, forest fire, and the growing demand for farmland and residential areas. Local elders and experts also confirmed this during the interview.
3.4. Land Cover Inter-Category Transition
Table 6 presents the change detection matrix of various LC types in the study area from 1984 to 2020. The diagonal entries in Table 6 show the amount of LC types that remain unchanged (persistence) between the study periods. In contrast, the off-diagonal entries revealed the column ‘gain’ and row ’loss’, indicating the increase or decrease in a particular LC type. Although all LC classes have changed, the degree of these changes was inherently different. Accordingly, the results show that about 38% (92,049 ha) of the study area persisted while 62% (149,044 ha) changed in one way or another between 1984 and 2020, indicating that the study area experienced substantial LC change. Furthermore, the analysis results from different periods revealed that most of these changes were non-linear and dynamic. For instance, forests lost the most (65,898 ha) during the study period, while cultivated land gained the most (49,547 ha) of the total land cover in the study area. Similarly, they showed a comparatively equal magnitude of net change (+33,387 ha and −33,082 ha) but in opposite directions (Table 6).
Table 6.
“From-to” transition matrix (ha) resulting from change detection analysis (1984–2020).
The change detection matrix revealed that out of 108,282 ha of forests in 1984, only 42,384 ha remained unchanged in 2020, implying that about 65,898 ha (61%) of forests were converted into various LC types, and the largest conversions were made into grassland (36,560 ha), followed by cultivated land (24,759 ha). The results also revealed that the total gain in forest cover from other LC types was about 32,816 ha, with a negative net change of 33,082 ha. These observed spatial and temporal changes in forest cover were attributed to the increasing demand for fuelwood and charcoal, farm plot expansion and grazing lands, construction materials, and farm implements, as reported by elders and experts during the interview.
The matrix also displayed that during the study period, out of 105,477 ha of grassland in 1984, about 43,008 ha remained as grassland in 2020, indicating that some 62,470 ha were converted to other LC types. However, it gained about 45,688 ha from other LC types, with a negative net change (−16,782 ha) with varying degradation levels. According to local elders, grassland has been significantly reduced over time due to the illegal expansion of cultivated land, grazing lands, and settlements. Similarly, interviews with experts and development agents confirmed that population growth and associated cultivated land encroachment, as well as uncontrolled livestock grazing, could be possible causes of grassland loss in all directions of the SMNP.
In contrast, the proportion of cultivated land increased consistently throughout the study period. The change detection analysis confirmed that 4844 ha of the total 21,004 ha of cultivated land in 1984 remained as cultivated land, indicating that 16,160 ha were converted to other LC types. The results also show that cultivated land gained a total of 49,547 ha, with a net positive change of 33,388 ha. Of these, 24,759 ha and 23,692 ha originated from forest and grassland, respectively. Similarly, over the last 36 years, bare land has increased in the study area. According to the change detection analysis, only 108 ha of the 4591 ha of bare land in 1984 remained unchanged in 2020, while about 97.6% of the bare land had been converted into forests (2040 ha), cultivated land (1092 ha), and grassland (1074 ha). However, gains in grassland and forest more than offset the loss of bare land. The overall gain in bare land from other LC types was about 14,605 ha. As highlighted by participants during the KII, the increase in the bare land was probably attributed to rapid deforestation and overgrazing, which removed the natural vegetation cover from the land and rendered it barren and exposed rock.
The built-up area was the other LC type that experienced considerable area increment during the study period. The results revealed that, of the 1739 ha of built-up area in 1984, about 1705 ha remained unchanged during the study period, suggesting that only 34 ha were converted into other LC types. The change detection matrix also revealed that the built-up area gained (6389 ha) from all other LC types, primarily from forests and grasslands but experienced the lowest conversion into other LC types. According to key informants, the rapid expansion of built-up areas can be attributed to road construction, institutions, and increasing demand for residential areas.
Furthermore, Figure 5 illustrates the conversion of LC types observed from one class to another between 1984 and 2020. The post-classification results revealed that the study area experienced deforestation, rehabilitation, and no change. First, the previously categorized five LC classes were reclassified into forest and non-forest to analyze the change from forest to non-forest and vice versa. In this instance, the classes of grassland, cultivated land, bare land, and built-up area are all regarded as non-forest, but the forest class has remained. Then, a change detection analysis is performed. As shown in Figure 5, deforestation, rehabilitation, and no change describes the transition from forest to non-forest, non-forest to forest, and non-forest to non-forest/forest to forest, respectively.
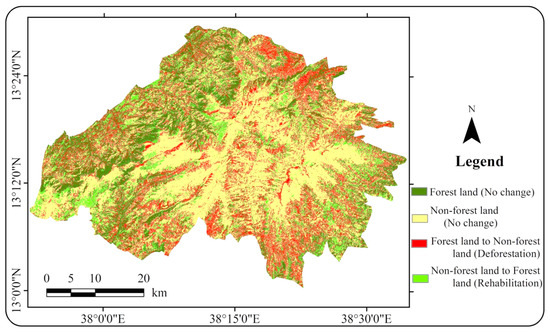
Figure 5.
Land cover changes in the study area between 1984 and 2020.
3.5. Net Change and Swap in and around the SMNP (1984–2020)
Table 7 shows the changes attributed to swap and net change. The results revealed that the highest persistence was observed for grassland (17.8%), followed by forests (17.6%) between 1984 and 2020. Similarly, cultivated land and forests experienced relatively more gains and losses (Table 7). The results further revealed that most of the LC in the study area had experienced swap changes. Changes in the built-up area were only a net change throughout the entire study period (1984–2020), whereas changes in all other LC types were a combination of swap and net changes. The change attributed to quantitative net change was highest for cultivated land (51% of the total change for cultivated land), followed by forests (33.5% of the total change for forests). Net change accounted for about 34% of the total change in and around the SMNP. However, in the study area, the changes attributable to location (swap) were highest for grassland (84% of the total change for grassland), followed by forest (66.5% of the total change for forest).
Table 7.
Summary of LULC (%) gain, loss, swap, absolute net change in the SMNP (1984–2020).
Similarly, grasslands experienced the highest total change (45%), followed by forests (41%) and cultivated land (27%). Of the total forest cover, about 67% could be attributed to swap changes. Higher values of swap indicate features of ecological damage and ecological restoration simultaneously but in different locations. In the study area as a whole, the changes attributable to location (swap: 41.1%) are greater than the changes attributable to quantity (net change: 20.7%), demonstrating the importance of net change and swap in identifying the total transition within the study area.
3.6. Vulnerability of SMNP to Transition
Table 7 also presents the vulnerability of LC types to transition in the study area. The results revealed that except for the built-up area, the loss-to-persistence (Lp) ratio for all LC types was greater than 1. This implies that all the LC types in the study area tended to change to other LC types more than persisting. However, the Lp ratio for the built-up area was less than 1, indicating that the LC type tends to persist rather than lose. Furthermore, the gain-to-persistence (Gp) ratio was greater than 1 for all LC types except forests, suggesting that most LC types tended to grow compared to their original extent. However, the Gp ratio of the forest is less than 1, implying that forest cover has experienced deforestation. Similarly, the net-change-to-persistence (Np) ratio for forest and grassland was negative, indicating that these LC types are more likely to lose their areas than other LC types. Conversely, the Np ratios of cultivated land, bare land, and built-up areas were relatively high, signifying their persistence compared to their net loss.
3.7. Drivers of Forest Cover Changes
Linking remote sensing results with the KII and household surveys allows us to examine the drivers of forest cover change. Accordingly, many intertwined and connected factors, some natural but mostly anthropogenic, exacerbate deforestation. From household surveys and KII, six drivers were identified as the main drivers of forest cover change in the study area (Table 8). As reported by key informants and surveyed households, the expansion of subsistence agriculture to meet the food needs of the growing population has been one of the leading causes of deforestation in the study area. The results revealed that 98% of the surveyed households viewed agriculture expansion as the primary driver of deforestation
Table 8.
Drivers of Forest Cover Change in and around the SMNP.
Similarly, the remote sensing analysis confirmed that agricultural land had expanded significantly from 8.7% in 1984 to 22.6% in 2020 at the expense of forests, implying 24,759 ha of forests converted to agricultural land. In addition, biomass, particularly fuelwood harvesting for domestic use, is the second driver of deforestation mentioned by 75% of the surveyed households. The SMNP and adjacent communities rely on biomass fuel to meet their energy needs. However, as confirmed by experts, the steadily growing demand for fuelwood, the slow development of rural electrification, and the limited availability of alternative energy sources have resulted in unsustainable forest exploitation. The local elders also confirmed during the interviews that the population in and around the SMNP has a low income and lacks alternative means of subsistence. Hence, harvesting and selling fuelwood and charcoal is an easy and quick way to make a living, contributing to deforestation.
On the other hand, surveyed households and key informants reported population growth as an important driver of deforestation. According to the central statistical agency (CSA), the population in and around the SMNP has increased from 157,779 in 1984 to 378,929 in 2020, representing a 140% increase. As the population grows, demand for agricultural land, residential areas, fuelwood, and other forest products increases, putting enormous pressure on forest resources. Hence, the results revealed that 65% of surveyed households perceived population growth as the third driver of deforestation. In addition, livestock pressure was mentioned by 60.4% of the respondents as the fourth driver of deforestation. Free grazing is a significant problem for vegetation resources in areas with a high livestock population, like the SMNP and adjacent districts. This is a problem since vegetation is a valuable source of fodder for livestock, especially during the dry season. Consequently, livestock pressure has accelerated the rate at which forests and grass species are becoming scarce, as experts confirmed. Furthermore, surveyed households have reported forest fires occasionally occurred, particularly during the dry season, and are viewed by 17% of the surveyed households as another driver of deforestation. Locals also claim that the fire started when clearing debris on their farm plots and during honey harvesting; however, it quickly spread to the forests and grasslands, resulting in deforestation.
3.8. Impacts of Forest Cover Change on the Availability of Forest Ecosystem Services
Declining forest cover has far-reaching impacts on the availability of forest products and services in the study area. The results revealed that 92% of the surveyed households perceived a change in forest ecosystem services availability, while only 8% did not perceive changes (Table 9).
Table 9.
Households’ perception of the change in the availability of forest ecosystem services.
In addition, the results revealed that five ecosystem services provided by the Semien Mountains forests were highly impacted by deforestation (Figure 6). About 94% of the surveyed households reported that deforestation has reduced fuelwood availability. Similarly, 87% of the surveyed households use fuelwood for domestic purposes (Table 9). Because of this reason, the Semien Mountains forests have significantly been deforested, leading to fuelwood scarcity. Moreover, according to elders and experts, deforestation by the growing population has resulted in a decline in fuelwood availability. The results revealed that the average travel time (round trip) to collect fuelwood ranged from 1 h to more than 8 h, with an average of about 3 h (Table 9). Furthermore, surveyed households reported that deforestation had reduced the availability of wild food (73.4%), fodder (63.4%), and freshwater (40.2%) derived from the Semien Mountains. Overall, deforestation exacerbates soil loss, fuelwood scarcity, flooding, biodiversity loss, climate-induced drought, and economic loss, as reported by experts during the interview.
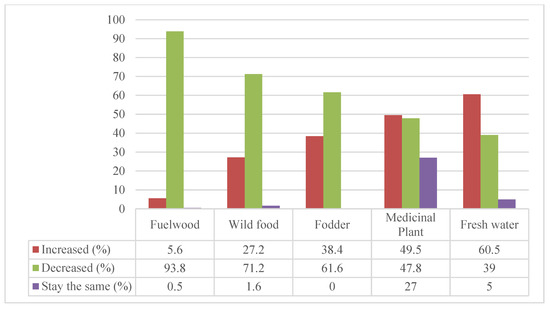
Figure 6.
Availability of forest ecosystem services in the SMNP; Source: Household Survey (2021).
4. Discussion
The Semien Mountains’ forest resources provide various socio-economic, ecological, and environmental benefits locally, regionally, and globally but the local community benefits the most [39]. However, the analysis reveals that the forests had experienced spatiotemporal changes over the last 36 years, resulting in a loss of about 33,084 ha of forest. As a result, the capacity of these forests to provide forest benefits and services to society is sustainably threatened by continuous deforestation. Changes in forest cover jeopardize ecosystem services: fuelwood availability, climate regulation, biodiversity conservation, and water catchment protection [14,17,36,71,72]. In contrast, agricultural land and built-up areas increased by 33,387 and 6356 ha, respectively. This makes the expansion of agricultural land and built-up areas the two most dominant causes of deforestation in the study area.
The conversion of a large portion of forest resources into cultivated land by smallholder farmers has been reported throughout Ethiopia [61,73], and this has occurred in and around the SMNP as well [39]. During the last 36 years, about 24,759 ha of forests have been converted into farmland in the study area. The remote sensing analysis also revealed that an estimated 927 ha of cultivated land was added each year, primarily from forests. Between 1984 and 2020, the annual rate of deforestation was 1.02%, which is very close to Ethiopia’s estimated annual deforestation rate of 1.1% [25], implying that the forest in the study area is prone to cultivation. Similar to the present study, previous studies conducted in various parts of Ethiopia [17,60,74,75] and elsewhere in developing countries [14,58,71,76] documented a reduction in forest cover owing to agricultural expansion. However, in contrast to previous and current findings, an increase in forest cover was observed in Ethiopia’s highlands [29,33,72]. The deviation could be attributed to management practices, a change in the definition of forest, and the study’s spatial coverage.
However, expanding agricultural land often comes with many environmental costs as it is practiced without proper land management [75]. The rapid expansion of agricultural lands at the expense of forests severely impacts land resources. For instance, the European Union Delegation to Ethiopia (EUDE, 2016) [77] reported that in the deforested highlands of Ethiopia, the topsoil has already been substantially degraded, causing the soil depth to drop to less than 10 cm, which in turn hinders crop productivity. Hailemariam et al. (2016) [73] reported that an estimated 30,000 ha of productive land is lost in Ethiopia’s highlands due to soil erosion. Similarly, WBISPP (2005) [78] stated that the annual production lost due to soil erosion in the ANRS alone is about 10,000 tons. In agreement with the finding of this study, studies conducted elsewhere in the Ethiopian highlands [60,73,76,79,80] documented that agricultural land expansion aggravates land degradation and affects the livelihoods of local communities.
The other LC type that experienced a substantial change in and around the SMNP was bare land, which increased by 220% between 1984 and 2020. According to the experts during the interview, the increase in bare land was due to the volcanic and rocky nature of the mountains as well as continued deforestation and overgrazing. This finding is consistent with the findings of [60,80,81] but differs from [47,74], who both reported a decrease in bare land.
Furthermore, the built-up areas showed a considerable increase in cover. The overall expansion of the built-up area has been 6356 ha (365% ha), owing to natural population increase, infrastructural development, and increased demand for the residential area, as confirmed by locals and experts during the interview. This finding is in line with the findings of [33,60], who documented that built-up areas were rapidly expanded at the expense of forests and grasslands.
A broad range of drivers of forest cover changes is observed in different parts of the world. The drivers of change are time and location-specific [47]. A driver identified a decade ago may not be valid in recent times if intervention measures are made regarding the driving factors [58]. Many, if not most, land cover changes are intended or unintended consequences of human decisions and subsequent actions [82]. Dynamic drivers contributing to forest loss in different social and ecological contexts have been reported by various studies in Ethiopia [28,29,34,47,61,65] and elsewhere in developing countries [14,58,83].
Geist and Lambin (2002) [83] highlighted that tropical deforestation occurs due to direct and indirect drivers. Direct drivers of deforestation include anthropogenic activities or immediate actions that directly impact forest cover and loss of carbon, like agriculture, urban expansion, mining, livestock grazing, and forest fires [19]. The indirect drivers encompass complex interactions of fundamental political, socio-economic, cultural, and technological processes: corruption, poor governance, population growth and land tenure uncertainties [7,19]. Hence, understanding the drivers of deforestation is fundamental for developing policies and measures to alter current trends in forest activities toward a more climate and biodiversity outcome [84].
Based on the results of key informants and household surveys, several factors contributed to the change in forest cover in the study area over the last 36 years. According to the study, the most important cause of deforestation was population growth, along with agricultural expansion. Though the impact of population growth on forest cover is controversial, rapid population growth drives forest cover change [75]. In their study, Geist and Lambin (2001) [83] estimate that population growth is responsible for 61% of tropical deforestation. Additionally, Bremner et al. (2010) [85] showed that population growth contributes to deforestation. Our study revealed that the study area’s population has more than doubled in the last 36 years, thus increasing the demand for agricultural land and food. A study by Wondie et al. (2016) [86] concluded that land conversion is an immediate solution to meeting the food demand of the country’s rapidly growing population. Since agriculture is the main livelihood in the study area, the conversion of most of the natural vegetation cover into farmland is a peculiar phenomenon. In line with this finding, studies conducted in Ethiopia’s highlands [47,74,80,87] reported that population growth is a cause for concern for forest destruction.
Moreover, fuelwood collection is another significant driver of forest cover change in the study area between 1984 and 2020. Biomass, particularly fuelwood, is an invaluable source of energy for local communities in the study area. The demand for biomass has increased over the past few decades as the population has grown. According to Bewket (2005) [88], this demand is related to traditional three-stone open-fire stoves for cooking and baking, which forces communities to use more fuelwood, contributing to deforestation and fuelwood scarcity [89]. As a result, natural vegetation has significantly diminished and is currently found only in a few remote mountainous areas. Our study’s findings agree with those of previous studies conducted in the highlands of Ethiopia [82,87].
Similarly, livestock pressure and poor management of grazing areas also contribute to forest loss. Based on satellite image analysis (Table 4), grasslands have receded over the last 36 years since natural grasslands are the major feed sources for livestock. A study conducted by EWCA (2015) [42] reported that an estimated 129,270 Tropical Livestock Units (TLUs) reside in and around the SMNP, which translates to an average of 7 TLUs. As a result, overgrazing would occur, threatening the remaining grasslands and forests. This finding agrees with [33,65], who found that livestock ranching contributes to the loss of vegetation cover.
Furthermore, forest fires occasionally occur in the study area during the dry season. As reported by key informants during the interview, the fires originate from slash-and-burn land preparation methods, using fire during honey harvesting and the burning of grazing land to allow for pasture regeneration, contributing to a decline in forest cover and biodiversity loss. This finding is in agreement with the findings of [19,34], who reported that fires contribute to the loss of forests and biodiversity.
5. Implications of Forest Cover Change
Forest cover changes are an inevitable and complex phenomenon with multifaceted socio-economic and ecological effects [14]. The conversion of vegetation, the habitat of animals and microbes, into agricultural and other land-use types poses the greatest threat to biodiversity loss due to land cover change [65]. According to key informants, multipurpose indigenous tree species, such as Juniperus procera, Hagenia abyssinica, and Olea Africana, once found in the Semien Mountains and adjacent districts, are on the verge of extinction due to deforestation. These indigenous trees can currently be found only in protected areas and inaccessible steeper mountainous areas [44]. Similarly, as forest and grassland cover declines, so does the number of wild animals [37]. According to key informants, wild animals such as tigers, leopards, and antelope were common in the study area 36 years ago. However, the conversion of forest and grassland to cropland and other land uses has decreased the number of these wild animals. In addition, deforestation may affect the ecosystem services provided by forests, such as the decline of direct benefits of wild food, fuelwood, construction materials, and biodiversity [14]. Moreover, it indirectly contributes to the loss of soil fertility, degradation of freshwater resources, and emission of carbon [5,6,54].
6. Conclusions
Monitoring forest cover change and identifying its drivers have immense potential for decision-making, sustainable management, and policy development. Using multitemporal Landsat images coupled with household surveys and KIIs, this study examined spatio-temporal forest cover change and its drivers in and around the SMNP from 1984 to 2020. In data-scarce situations, we used simple but important techniques to offset the limitations of the coarse-resolution Landsat images and improve the accuracy of the mapping of forests. Since the SMNP is very rugged and mountainous, topography affects the reflectance due to illumination effects and cast shadows, which introduce errors in land cover classification. In addition, a significant portion of the area in the Landsat 7 image of 2008 was affected by scan line corrector (SLC) failure. Hence, we employed C-correction to correct topographic effects. Similarly, we applied Landsat toolboxes in ArcGIS 10.8 to fix scan line errors.
According to the image classification, the SMNP has experienced spatio-temporal forest cover change over the past 36 years. Between 1984 and 2020, about 33,084 ha of forest were cleared, accounting for 31% of the forest cover in 1984. In other words, about 919 ha (1.02%) of forests are deforested annually. In contrast, farmland, bare land, and built-up areas increased from 9%, 2%, and 1% in 1984 to 23%, 6%, and 3% in 2020, respectively. This implies that the increase in farmland, bare land, and built-up areas results from deforestation and grassland conversion. The observed reduction in forest cover was driven by many intertwined factors, including population growth, growing demand for farmland and fuelwood, livestock pressure, and forest fires.
The change analysis matrix revealed that 62% of the study area had experienced a change, while 38% of the landscape remained unchanged. Specifically, the change matrix showed that forests lost the most (65,898 ha) while cultivated land gained the most (49,547 ha) of the total land cover in the study area. On the landscape, the change attributable to location (swap: 41%) is greater than the change attributable to quantity (net change: 21%). Moreover, the spatial pattern of change revealed that forest cover experienced both swap and net change. From 1984 to 2020, there was a net change of 14% and a total change of 41% in forest cover. Over the same period, swap changes accounted for about 67% of the forest cover changes.
Overall, the forest resources of the Semien Mountains deserve much attention since it is home to endangered endemic species, including the iconic and severely endangered Walia ibex (Capra walie) and Ethiopian wolf (Canis simensis), found only in the SMNP. The result of this study can guide government, community, and stakeholders in their conservation and restoration efforts by focusing on the degradation of hotspots. Improving local communities’ awareness of the co-existence of nature conservation and sustaining their livelihood, disseminating improved cookstoves, and enhancing participatory forest management are possible solutions to reduce the pressure on the forest resources of the Semien Mountains. Finally, the study recommends further research to investigate the impact of forest cover change on the forest ecosystem service value and the socio-economic well-being of adjacent communities.
Author Contributions
Conceived, B.D., F.S., E.T., D.D. and D.T.; designed the study, B.D., F.S., E.T., D.D. and D.T.; data curation, B.D.; carried out the field-work, B.D.; writing—original draft preparation, B.D.; writing—review, F.S., E.T., D.D. and D.T.; supervision, F.S., E.T., D.D. and D.T. All authors have read and agreed to the published version of the manuscript.
Funding
The authors are indebted to Addis Ababa University and Open Society Foundations [IN2020-77156] for their financial support.
Institutional Review Board Statement
Not applicable.
Informed Consent Statement
Not applicable.
Data Availability Statement
Data will be made available on request. The Landsat images that support the findings of this study are available from USGS.
Acknowledgments
The authors would like to thank Addis Ababa University and the Open Society Foundation for their financial support. In addition, the authors are greatly indebted to thank communities who reside in and around the SMNP for their patience and active participation during the interviews and household surveys.
Conflicts of Interest
The authors declare that they have no conflict of interest.
References
- Food and Agriculture Organization of the United Nations; Forestry Department (Rome). Global Forest Resources Assessment 2020 Main Report; Food and Agriculture Organization of the United Nations: Rome, Italy, 2020. [Google Scholar] [CrossRef]
- Deka, S.; Tripathi, O.P.; Paul, A. Perception-based assessment of ecosystem services of Ghagra Pahar forest of Assam, Northeast India. Geol. Ecol. Landsc. 2018, 3, 197–209. [Google Scholar] [CrossRef]
- Duguma, L.A.; Atela, J.; Minang, P.A.; Ayana, A.N.; Gizachew, B.; Nzyoka, J.M.; Bernard, F. Deforestation and Forest Degradation as an Environmental Behavior: Unpacking Realities Shaping Community Actions. Land 2019, 8, 26. [Google Scholar] [CrossRef]
- Jebiwott, A.; Ogendi, G.M.; Makindi, S.M.; Esilaba, M.O. Forest Cover Change and Its Impacts on Ecosystem Services in Katimok Forest Reserve, Baringo County, Kenya. In Handbook of Climate Change Resilience; Leal Filho, W., Ed.; Springer: Cham, Switzerland, 2019. [Google Scholar]
- Köhl, M.; Lasco, R.; Cifuentes, M.; Jonsson, Ö.; Korhonen, K.T.; Mundhenk, P.; de Jesus Navar, J.; Stinson, G. Changes in forest production, biomass and carbon: Results from the 2015 UN FAO Global Forest Resource Assessment. For. Ecol. Manag. 2015, 352, 21–34. [Google Scholar] [CrossRef]
- Miura, S.; Amacher, M.; Hofer, T.; San-Miguel-Ayanz, J.; Ernawati; Thackway, R. Protective functions and ecosystem services of global forests in the past quarter-century. For. Ecol. Manag. 2015, 352, 35–46. [Google Scholar] [CrossRef]
- United Nations Strategic Plan for Forests 2017–2030 and Quadrennial Programme of Work of the United Nations Forum on Forests for the Period. Available online: https://digitallibrary.un.org/record/856827 (accessed on 20 November 2022).
- Bošković, B.; Chakravorty, U.; Pelli, M.; Risch, A. The effect of forest access on the market for fuelwood in India. J. Dev. Econ. 2023, 160, 102956. [Google Scholar] [CrossRef]
- Ken, S.; Sasaki, N.; Entani, T.; Ma, H.O.; Thuch, P.; Tsusaka, T.W. Assessment of the Local Perceptions on the Drivers of Deforestation and Forest Degradation, Agents of Drivers, and Appropriate Activities in Cambodia. Sustainability 2020, 12, 9987. [Google Scholar] [CrossRef]
- Sulieman, H.M. Exploring divers of forest degradation and fragmentation in Sudan: The case of Erawashda Forest and its surrounding community. Sci. Total Environ. 2018, 621, 895–904. [Google Scholar] [CrossRef]
- FAO; UNEP. The State of the World’s Forest 2020: Forests, Biodiversity and People; UN: Rome, Italy, 2020.
- FAO. Global Forest Resources Assessment 2015: How Are the World’s Forests Changing? FAO: Rome, Italy, 2016. [Google Scholar]
- Addo-Fordjour, P.; Ankomah, F. Patterns and drivers of forest land cover changes in tropical semi-deciduous forests in Ghana. J. Land Use Sci. 2016, 12, 71–86. [Google Scholar] [CrossRef]
- Ahammad, R.; Stacey, N.; Eddy, I.M.; Tomscha, S.A.; Sunderland, T.C. Recent trends of forest cover change and ecosystem services in eastern upland region of Bangladesh. Sci. Total Environ. 2019, 647, 379–389. [Google Scholar] [CrossRef] [PubMed]
- Ngwira, S.; Watanabe, T. An Analysis of the Causes of Deforestation in Malawi: A Case of Mwazisi. Land 2019, 8, 48. [Google Scholar] [CrossRef]
- Käyhkö, N.; Fagerholm, N.; Asseid, B.S.; Mzee, A.J. Dynamic land use and land cover changes and their effect on forest resources in a coastal village of Matemwe, Zanzibar, Tanzania. Land Use Policy 2011, 28, 26–37. [Google Scholar] [CrossRef]
- Gebrehiwot, S.G.; Bewket, W.; Gärdenäs, A.I.; Bishop, K. Forest cover change over four decades in the Blue Nile Basin, Ethiopia: Comparison of three watersheds. Reg. Environ. Chang. 2014, 14, 253–266. [Google Scholar] [CrossRef]
- Lambin, E.F.; Geist, H.J.; Lepers, E.; Meyer, W.B.; Turner, I.B.L.; Meyfroidt, P.; Alix-Garcia, J.; Wolff, H.; Bentley, J.W.; Innes, R.; et al. Dynamics of Land-Use and Land-Cover Change in Tropical Regions. Annu. Rev. Environ. Resour. 2003, 28, 205–241. [Google Scholar] [CrossRef]
- Rotich, B.; Ojwang, D. Trends and drivers of forest cover change in the Cherangany hills forest ecosystem, western Kenya. Glob. Ecol. Conserv. 2021, 30, e01755. [Google Scholar] [CrossRef]
- Baye, T.G. Poverty, peasantry and agriculture in Ethiopia. Ann. Agrar. Sci. 2017, 15, 420–430. [Google Scholar] [CrossRef]
- Young, N.E.; Evangelista, P.H.; Mengitsu, T.; Leisz, S. Twenty-three years of forest cover change in protected areas under different governance strategies: A case study from Ethiopia’s southern highlands. Land Use Policy 2020, 91, 104426. [Google Scholar] [CrossRef]
- Pohjonen, V.; Pukkala, T. Eucalyptus globulus in Ethiopian forestry. For. Ecol. Manag. 1990, 36, 19–31. [Google Scholar] [CrossRef]
- EFAP. Ethiopian Forestry Action Program: The Challenge for Development; EFAP: Addis Ababa, Ethiopia, 1993; Volume 2. [Google Scholar]
- Reusing, M. Monitoring Forest Resources in Ethiopia; Government of the Federal Democratic Republic of Ethiopia, Ministry of Agriculture: Addis Ababa, Ethiopia; Natural Resources Management and Regulatory Department & German Agency for Tech-nical Cooperation (GTZ): Addis Ababa, Ethiopia, 1998. [Google Scholar]
- FAO. Global Forest Resources Assessment 2010; Main Report; FAO: Rome, Italy, 2010. [Google Scholar]
- Assefa, E.; Bork, H.-R. Deforestation and Forest Management in Southern Ethiopia: Investigations in the Chencha and Arbaminch Areas. Environ. Manag. 2013, 53, 284–299. [Google Scholar] [CrossRef] [PubMed]
- Kindu, M.; Schneider, T.; Teketay, D.; Knoke, T. Land Use/Land Cover Change Analysis Using Object-Based Classifi-cation Approach in Munessa-Shashemene Landscape of the Ethiopian Highlands. Remote Sens. 2013, 5, 2411–2435. [Google Scholar] [CrossRef]
- Gebrelibanos, T.; Assen, M. Land use/land cover dynamics and their driving forces in the Hirmi watershed and its adjacent agro-ecosystem, highlands of Northern Ethiopia. J. Land Use Sci. 2013, 10, 81–94. [Google Scholar] [CrossRef]
- Belayneh, Y.; Ru, G.; Guadie, A.; Teffera, Z.L.; Tsega, M. Forest cover change and its driving forces in Fagita Lekoma District, Ethiopia. J. For. Res. 2018, 31, 1567–1582. [Google Scholar] [CrossRef]
- Mezgebu, A.; Workineh, G. Changes and drivers of afro-alpine forest ecosystem: Future trajectories and management strategies in Bale eco-region, Ethiopia. Ecol. Process. 2017, 6, 42. [Google Scholar] [CrossRef]
- Babiso, B.; Bajigo, M.; Mesene, M. Trends in forest cover change and degradation in Duguna Fango, Southern Ethio-pia. Cogent Environ. Sci. 2020, 6, 1834916. [Google Scholar] [CrossRef]
- Bantider, A.; Hurni, H.; Zeleke, G. Responses of rural households to the impacts of population and land-use changes along the Eastern Escarpment of Wello, Ethiopia. Nor. Geogr. Tidsskr.-Nor. J. Geogr. 2011, 65, 42–53. [Google Scholar] [CrossRef]
- Moges, D.M.; Bhat, H.G. An insight into land use and land cover changes and their impacts in Rib watershed, north-western highland Ethiopia. Land Degrad. Dev. 2018, 29, 3317–3330. [Google Scholar] [CrossRef]
- Zewdie, W.; Csaplovics, E. Remote sensing based multi-temporal land cover classification and change detection in northwestern Ethiopia. Eur. J. Remote Sens. 2015, 48, 121–139. [Google Scholar] [CrossRef]
- Wubie, M.A.; Assen, M.; Nicolau, M.D. Patterns, causes and consequences of land use/cover dynamics in the Gumara watershed of lake Tana basin, Northwestern Ethiopia. Environ. Syst. Res. 2016, 5, 1. [Google Scholar] [CrossRef]
- Chaudhary, S.; Tshering, D.; Phuntsho, T.; Uddin, K.; Shakya, B.; Chettri, N. Impact of land cover change on a mountain ecosystem and its services: Case study from the Phobjikha valley, Bhutan. Ecosyst. Health Sustain. 2017, 3, 1393314. [Google Scholar] [CrossRef]
- ANRS; PaDPA. Development of Alternative Livelihoods for the Population of the Simien Mountains National Park; Parks Development and Protection Authority: Bahr Dar, Ethiopia, 2007. [Google Scholar]
- Wondie, M.; Schneider, W.; Melesse, A.M.; Teketay, D. Spatial and Temporal Land Cover Changes in the Simen Mountains National Park, a World Heritage Site in Northwestern Ethiopia. Remote. Sens. 2011, 3, 752–766. [Google Scholar] [CrossRef]
- Jacob, M.; Frankl, A.; Hurni, H.; Lanckriet, S.; De Ridder, M.; Guyassa, E.; Beeckman, H.; Nyssen, J. Land cover dynamics in the Simien Mountains (Ethiopia), half a century after establishment of the National Park. Reg. Environ. Chang. 2017, 17, 777–787. [Google Scholar] [CrossRef]
- Fisher, R. Tropical forest monitoring, combining satellite and social data, to inform management and livelihood im-plications: Case studies from Indonesian West Timor. Int. J. Appl. Earth Obs. Geoinf. 2012, 16, 77–84. [Google Scholar]
- Chernet, T. A Resource Base and Climate Change Risk Maps for Simien Mountains National Park; PHE-Ethiopia Consortium: Addis Ababa, Ethiopia, 2015. [Google Scholar]
- EWCA. Simien Mountains National Park: Grazing Pressure Reduction Strategy. 2015. Available online: https://whc.unesco.org/document/140897 (accessed on 10 January 2023).
- Debonnet, G.; Melamari, L.; Bomhard, B. Reactive Monitoring Mission to Simien Mountains National Park; Joint World Heritage Center-IUCN monitoring mission to Semien Mountains National Park World Heritage property: Paris, France, 2006. [Google Scholar]
- Asrat, A.; Demissie, M.; Mogessie, A. Geoheritage conservation in Ethiopia: The case of the Simien Mountains. Quageo 2012, 31, 7–23. [Google Scholar] [CrossRef]
- Hurni, H.; Ludi, E. Reconciling Conservation with Sustainable Development: A Participatory Study inside and around the Simen Mountains National Park, Ethiopia; Center for Development and Environment. 2000. Available online: https://www.jstor.org/stable/3674065#metadata_info_tab_contents (accessed on 10 January 2023).
- Lossou, E.; Owusu-Prempeh, N.; Agyemang, G. Monitoring Land Cover changes in the tropical high forests using multi-temporal remote sensing and spatial analysis techniques. Remote Sens. Appl. Soc. Environ. 2019, 16, 100264. [Google Scholar] [CrossRef]
- Ewunetu, A.; Simane, B.; Teferi, E.; Zaitchik, B.F. Land cover change in the Blue Nile river headwaters: Farmers’ perceptions, pressures, and satellite-based mapping. Land 2021, 10, 68. [Google Scholar] [CrossRef]
- Azzari, G.; Lobell, D.B. Landsat-based classification in the cloud: An opportunity for a paradigm shift in land cover monitoring. Remote Sens. Environ. 2017, 202, 64–74. [Google Scholar] [CrossRef]
- Teillet, P.M.; Guindon, B.; Goodenough, D. On the Slope-Aspect Correction of Multispectral Scanner Data. Can. J. Remote Sens. 1982, 8, 84–106. [Google Scholar] [CrossRef]
- Hale, S.R.; Rock, B.N. Impact of Topographic Normalization on Land-Cover Classification Accuracy. Photogramm. Eng. Remote Sens. 2003, 69, 785–791. [Google Scholar] [CrossRef]
- Chavez, P.S. Image-based atmospheric corrections-revisited and improved. Photogramm. Eng. Remote Sens. 1996, 62, 1025–1035. [Google Scholar]
- López-serrano, P.M.; Corral-rivas, J.J.; Díaz-varela, R.A. Evaluation of Radiometric and Atmospheric Correction Algorithms for Aboveground Forest Biomass Estimation Using Landsat 5 TM Data. Remote Sens. 2016, 8, 369. [Google Scholar] [CrossRef]
- Teferi, E.; Uhlenbrook, S.; Bewket, W.; Wenninger, J.; Simane, B. The use of remote sensing to quantify wetland loss in the Choke Mountain range, Upper Blue Nile basin, Ethiopia. Hydrol. Earth Syst. Sci. 2010, 14, 2415–2428. [Google Scholar] [CrossRef]
- Abir, F.A.; Saha, R. Assessment of land surface temperature and land cover variability during winter: A spa-tio-temporal analysis of Pabna municipality in Bangladesh. Environ. Chall. 2021, 4, 100167. [Google Scholar] [CrossRef]
- Gashaw, T.; Tulu, T.; Argaw, M.; Worqlul, A.W. Evaluation and prediction of land use/land cover changes in the Andassa watershed, Blue Nile Basin, Ethiopia. Environ. Syst. Res. 2017, 6, 17. [Google Scholar] [CrossRef]
- Baral, P.; Wen, Y.; Urriola, N. Forest Cover Changes and Trajectories in a Typical Middle Mountain Watershed of Western Nepal. Land 2018, 7, 72. [Google Scholar] [CrossRef]
- Teferi, E.; Bewket, W.; Uhlenbrook, S.; Wenninger, J. Understanding recent land use and land cover dynamics in the source region of the Upper Blue Nile, Ethiopia: Spatially explicit statistical modeling of systematic transitions. Agric. Ecosyst. Environ. 2013, 165, 98–117. [Google Scholar] [CrossRef]
- Munthali, M.G.; Davis, N.; Adeola, A.M.; Botai, J.O.; Kamwi, J.M.; Chisale, H.L.; Orimoogunje, O.O. Local perception of drivers of Land-Use and Land- Cover change dynamics across Dedza district, Central Malawi region. Sustainability 2019, 11, 832. [Google Scholar] [CrossRef]
- MEFCC (Ministry of Environment, Forest and Climate Change). Ethiopia’s Forest Reference Level Submission to the United Nations Framework Convention for Climate Change. 2016. Available online: https://redd.unfccc.int/files/2016_submission_frel_ethiopia.pdf (accessed on 10 January 2023).
- Miheretu, B.A.; Yimer, A.A. Land use/land cover changes and their environmental implications in the Gelana sub-water. Environ. Syst. Res. 2017, 6, 7. [Google Scholar] [CrossRef]
- Deribew, K.T.; Dalacho, D.W. Land use and forest cover dynamics in the North-eastern Addis Ababa, central highlands of Ethiopia. Environ. Syst. Res. 2019, 8, 8. [Google Scholar] [CrossRef]
- Congalton, R.G.; Green, K. Assessing the Accuracy of Remotely Sensed Data: Principles and Practices, 2nd ed.; CRC Press: Boca Raton, FL, USA, 2009. [Google Scholar]
- Haque, M.I.; Basak, R. Land cover change detection using GIS and remote sensing techniques: A spatio-temporal study on Tanguar Haor, Sunamganj, Bangladesh. Egypt. J. Remote Sens. Sp. Sci. 2017, 20, 251–263. [Google Scholar] [CrossRef]
- Soffianian, A.; Madanian, M. Monitoring land cover changes in Isfahan Province, Iran using Landsat satellite data. Environ. Monit. Assess. 2015, 187, 543. [Google Scholar] [CrossRef] [PubMed]
- Yesuph, A.Y.; Dagnew, A.B. Land use/cover spatiotemporal dynamics, driving forces and implications at the Beshil-lo catchment of the Blue Nile Basin, North Eastern Highlands of Ethiopia. Environ. Syst. Res. 2019, 8, 21. [Google Scholar] [CrossRef]
- Pontius, R.G., Jr.; Shusas, E.; McEachern, M. Detecting important categorical land changes while accounting for persistence. Agric. Ecosyst. Environ. 2004, 101, 251–268. [Google Scholar] [CrossRef]
- Braimoh, A.K. Random and systematic land-cover transitions in northern Ghana. Agric. Ecosyst. Environ. 2006, 113, 254–263. [Google Scholar] [CrossRef]
- Ouedraogo, I.; Tigabu, M.; Savadogo, P.; Compaoré, H.; Odén, P.C.; Ouadba, J.M. Land cover change and its relation with population dynamics in Burkina Faso, West Africa. Land Degrad. Dev. 2010, 21, 453–462. [Google Scholar] [CrossRef]
- Adugna, A.; Abegaz, A.; Legass, A.; Antille, D.L. Random and Systematic Land-Cover Transitions in North-Eastern Wollega, Ethiopia. Bois. Forets Des. Trop. 2017, 332, 3–15. [Google Scholar] [CrossRef]
- Puyravaud, J.-P. Standardizing the calculation of the annual rate of deforestation. For. Ecol. Manag. 2003, 177, 593–596. [Google Scholar] [CrossRef]
- Agariga, F.; Abugre, S.; Appiah, M. Spatio-temporal changes in land use and forest cover in the Asutifi North District of Ahafo Region of Ghana, (1986–2020). Environ. Chall. 2021, 5, 100209. [Google Scholar] [CrossRef]
- Bewket, W. Land Cover Dynamics Since the 1950s in Chemoga Watershed, Blue Nile Basin, Ethiopia. Mt. Res. Dev. 2002, 22, 263–269. [Google Scholar] [CrossRef]
- Hailemariam, S.N.; Soromessa, T.; Teketay, D. Land Use and Land Cover Change in the Bale Mountain Eco-Region of Ethiopia during 1985 to 2015. Land 2016, 5, 41. [Google Scholar] [CrossRef]
- Meshesha, T.W.; Tripathi, S.K.; Khare, D. Analyses of land use and land cover change dynamics using GIS and remote sensing during 1984 and 2015 in the Beressa Watershed Northern Central Highland of Ethiopia. Model. Earth Syst. Environ. 2016, 2, 1–12. [Google Scholar] [CrossRef]
- Belay, T.; Mengistu, D.A. Land use and land cover dynamics and drivers in the Muga watershed, Upper Blue Nile basin, Ethiopia. Remote. Sens. Appl. Soc. Environ. 2019, 15, 100249. [Google Scholar] [CrossRef]
- Suleiman, M.S.; Wasonga, O.V.; Mbau, J.S.; Elhadi, Y.A. Spatial and temporal analysis of forest cover change in Fal-gore Game Reserve in Kano, Nigeria. Ecol. Process. 2017, 6, 11. [Google Scholar] [CrossRef]
- EUDE. Assessing the Root Causes of Recurring Food Insecurity in Ethiopia; 2016. [Google Scholar]
- Woody Biomass Inventory and Strategy Planning Project (WBISPP). A National Strategic Plan for the Biomass Energy Sector; Ministry of Agriculture and Rural Development: Addis Ababa, Ethiopia, 2015. [Google Scholar]
- Gebrehiwot, K.; Teferi, E.; Woldu, Z.; Fekadu, M.; Desalegn, T.; Demissew, S. Dynamics and drivers of land cover change in the Afroalpine vegetation belt: Abune Yosef mountain range, Northern Ethiopia. Environ. Dev. Sustain. 2020, 23, 10679–10701. [Google Scholar] [CrossRef]
- Agidew, A.-M.A.; Singh, K.N. The implications of land use and land cover changes for rural household food insecurity in the Northeastern highlands of Ethiopia: The case of the Teleyayen sub-watershed. Agric. Food Secur. 2017, 6, 56. [Google Scholar] [CrossRef]
- Hassen, E.E.; Assen, M. Land use/cover dynamics and its drivers in Gelda catchment, Lake Tana watershed, Ethiopia. Environ. Syst. Res. 2017, 6, 4. [Google Scholar] [CrossRef]
- Kindu, M.; Schneider, T.; Teketay, D.; Knoke, T. Drivers of land use/land cover changes in Munessa-Shashemene landscape of the south-central highlands of Ethiopia. Environ. Monit. Assess. 2015, 187, 452. [Google Scholar] [CrossRef] [PubMed]
- Geist, H.J.; Lambin, E.F. What Drives Tropical Deforestation? LUCC Rep. Ser. 2001, 4, 116. [Google Scholar]
- Hosonuma, N.; Herold, M.; De Sy, V.; De Fries, R.S.; Brockhaus, M.; Verchot, L.; Angelsen, A.; Romijn, E. An assessment of deforestation and forest degradation drivers in developing countries. Environ. Res. Lett. 2012, 7, 044009. [Google Scholar] [CrossRef]
- Bremner, J.; Lopez-Carr, D.; Suter, L.; Davis, J. Population, poverty, environment, and climate dynamics in the devel-oping world. Interdiscip. Environ. Rev. 2010, 11, 112–126. [Google Scholar] [CrossRef]
- Wondie, M.; Schneider, W.; Katzensteiner, K.; Mansberger, R.; Teketay, D. Modelling the dynamics of landscape transformations and population growth in the highlands of Ethiopia using remote-sensing data. Int. J. Remote Sens. 2016, 37, 5647–5667. [Google Scholar] [CrossRef]
- Bewket, W.; Abebe, S. Land-use and land-cover change and its environmental implications in a tropical highland watershed, Ethiopia. Int. J. Environ. Stud. 2013, 70, 126–139. [Google Scholar] [CrossRef]
- Bewket, W. Biofuel Consumption, Household Level Tree Planting and Its Implications for Environmental Management in the Northwestern Highlands of Ethiopia. East. Afr. Soc. Sci. Res. Rev. 2005, 21, 19–38. [Google Scholar] [CrossRef]
- Damte, A.; Koch, S.F.; Mekonnen, A. Coping with Fuelwood Scarcity. Household Responses in Rural Ethiopia. Environ. Dev. Discuss. Pap. Ser. 2011, 25, 1–34. [Google Scholar]


Disclaimer/Publisher’s Note: The statements, opinions and data contained in all publications are solely those of the individual author(s) and contributor(s) and not of MDPI and/or the editor(s). MDPI and/or the editor(s) disclaim responsibility for any injury to people or property resulting from any ideas, methods, instructions or products referred to in the content. |
© 2023 by the authors. Licensee MDPI, Basel, Switzerland. This article is an open access article distributed under the terms and conditions of the Creative Commons Attribution (CC BY) license (https://creativecommons.org/licenses/by/4.0/).