Case Report

Study on Carbon Emissions from the Renovation of Old Residential Areas in Cold Regions of China

1
State Key Laboratory of Building Safety and Environment & National Engineering Research Center of Building Technology, Beijing 100013, China
2
School of Architecture and Urban Planning, Shandong Jianzhu University, Jinan 250101, China
*
Authors to whom correspondence should be addressed.
Sustainability 2023, 15(4), 3018; https://doi.org/10.3390/su15043018
Submission received: 20 November 2022 / Revised: 12 January 2023 / Accepted: 6 February 2023 / Published: 7 February 2023

Abstract

:
With the implementation of dual-carbon and new human-centric urbanization strategies, the renovation of old buildings in China was inevitable. In this study, we establish the carbon emission values of retrofitting building from the perspective of carbon emissions, and propose a carbon accounting calculation method. Meanwhile, according to an economic viewpoint, we propose carbon emission evaluation indexes, including carbon increments, carbon emission intensity, carbon saving during the operation phase, and the static payback period of carbon increments. We retrofitted a building in an old residential area in Jinan, which both extended the building’s life and met the energy consumption needs of modern buildings. Through the case study, the annual carbon emissions during the use phase were reduced by 80.64% after retrofitting, and the building materials generated carbon emissions during the materialization phase of 11.04 t CO2/a. Considering the carbon increment factor, the comprehensive carbon emission reduction was 71.43%. The carbon increment per unit of building area was 110.32 kg CO2/m2, of which the carbon emission during the materialization stage accounted for 96.04%. Promoting low-carbon building materials and improving the energy efficiency would be an important means to reduce the carbon increments during building renovations. The static payback period for the carbon increment was 2.05 years, indicating that retrofitting measures were effective. Our work is informative for the development and quantitative assessment of low-carbon retrofitting programs for older buildings.

1. Introduction

Greenhouse gas emissions have become a significant global environmental concern in recent years. The Chinese government has undertaken various emission-reduction measures in response to global climate change [1]. In the 75th United Nations General Assembly [2], China pledged to peak its carbon emissions by 2030 and reach carbon neutrality by 2060.
The building sector has faced high-energy-consumption and environmental pollution issues. The statistics [3] show that the total carbon emissions from China’s building industry in all processes amounted to 4.997 billion t CO2 in 2019, accounting for 50.6% of the national carbon emissions, including 28% in the production stage of building materials, 1% in the construction stage, and 21.6% in the operation stage. Therefore, reducing building carbon emissions has become an essential strategy for improving environmental quality and achieving sustainability. Meanwhile, the report [3] shows over 40 billion m2 of residential buildings, some of which were built over 20–30 years. According to the estimated data, China has about 160,000 old residential areas because of early construction. These buildings have problems, such as disrepair, poor living conditions, and high-energy-consumption activity.
The Chinese government highly prioritizes the renovation of old residential areas. With the in-depth promotion of new human-centric urbanization strategies [4], China’s urban construction has developed in the direction of equal emphasis on the stock upgrading and quality transformation of old neighborhoods, and the optimization and adjustment of incremental structures [5]. Old neighborhoods [6] are residential neighborhoods built before 2000, with poor public facilities and are not included in the shantytown renovation plan. The State Council included the renovation of old neighborhoods into the scope of urban renewal [7] and promulgated the “Guidance on Comprehensively Promoting the Renovation of Old Urban Neighborhoods” in 2020, the renovation of old urban neighborhoods built before the end of 2000 that need to be renovated will be completed “by the end of the 14th Five-Year Plan period”. The cold regions cover about 42% of the national population and are the primary building renovation areas in China’s old neighborhoods. According to the Ministry of Housing and Construction statistics, the number of old neighborhoods in cold regions accounts for more than 30% of the overall urban stock, such as Jinan and Beijing, accounting for 49% and 47%, respectively.
Therefore, considering the carbon emissions of buildings and the carbon emission reduction potential of old residential areas, it is significant to enforce a carbon assessment of renovating old residential areas with a high amount of emissions in China.
There are significant differences in the climate between the south and north of China, and the focus on building energy use is different [8], among which building operation energy consumption in the northern heating zone accounts for about 54% of the national building operation energy consumption [9]. Therefore, the work to improve old districts in cold climate zones mainly focuses on building energy efficiency renovation, including other measures involving people’s livelihoods.
A high number of “Khrushchyovka” buildings were built in the 1960s in the former Soviet Union [10] to encounter people’s housing problems. Due to the construction conditions at that time, there was a relatively large gap in modern building energy requirements. At present, about 40% of the total number of Khrushchyovka buildings in the Russian region have been built. Since 1997, the Russian government has been retrofitting “Khrushchyovka” buildings to meet modern building energy requirements; Arena [11] uses fiber cement and cellulose insulation to improve energy efficiency; Astakhova [12] shows two types of designs for the first generation of industrialized residential buildings that address the social problems of settlement in a timely manner. Absimetov [13] presented a solution to the problem of modernizing the thermal energy of the facade and improving hygienic living conditions. The buildings of the 1980s and 1990s in northern China are very similar to the Khrushchyovka buildings in terms of construction methods. Therefore, the “Khrushchyovka” building renovation model provides a reference for the renovation of old buildings in northern China. After entering the 21st century, Europe, Canada, the United States, Japan, and other countries also introduced a series of policies for the renovation of old buildings. Scholars have conducted the relevant research studies based on the cases. Shady Attia [14] developed an energy performance dataset and built a performance simulation benchmark model for studying near-zero energy consumption after renovations or new constructions. Gon Kim [15] et al. targeted old apartments for double building skins to manage the interaction between outdoor and indoor environments. Robert Shipley [16] et al. proposed building renovation options from a return-on-investment perspective.
In recent years, Chinese scholars have also conducted research on the renovation of old buildings with Chinese characteristics. Lei et al. [17] explored the effects of external walls, external windows, and roofs on building energy consumption rates. Han et al. [18] explored the reasonable value of building exterior-wall-insulation thickness and the impact on air-conditioning load. Liu et al. [19] established a retrofit model for the energy efficiency of non-energy-efficient residential buildings in typical cities in severely cold regions. Huang [20] established a building envelope thermal performance optimization model for the energy efficiency retrofit of existing residential buildings based on the life cycle cost analysis, and proposed an economical insulation thickness of exterior walls formula to calculate the optimal relationship between building thermal envelope performance. Zhang [21] proposed a TNM-based calculation model for winter heating and domestic-hot-water-supply energy consumption before and after the retrofitting of old buildings in Beijing.
In the context of carbon neutrality, building retrofitting has to meet the requirements of modern buildings’ energy demands and architectural designs. Carbon emissions from building retrofitting has also become a key concern. The input–output model was applied to study the ecological footprint in 1998 [22]; Jonas [23] used the input–output model to perform a top–down analysis of the Swedish building. Luo [24] proposed a carbon footprint calculation method in “building materialized” based on BIM, and proposed a list of different accounting objective analysis models; Luo [25] calculated the carbon emissions of office buildings at the embodied stage based on this method. Wang [26] established a carbon emissions model for external-wall-insulation systems in cold areas. Vanessa [27] explored how to measure building facades’ life cycle CO2 emissions based on LCA. Tettey [28] analyzed the impact of carbon emissions of different insulation materials in a multi-story residential building. Georgios [29] compared the embodied CO2 emissions of four typical construction materials. Seyed [30] conducted a multi-objective simulation to optimize building renovation in terms of energy consumption and life cycle cost. Zhang [31] analyzed the energy-carbon-investment return of a prefabricated envelope system. Manuela [32] studied the relationship between the cost of building retrofit energy efficiency measures and energy efficiency benefits and optimizing building renovation measures.
Building renovation is a systematic project, and different combinations of solutions and retrofit strategies can be designed according to different scenarios and requirements. There are few studies on carbon increments in retrofitting solutions, carbon reduction in building operations after retrofitting, and carbon increment recovery period. This paper references a whole life cycle management approach, uses a building retrofitting case in Ji’nan as the research object, quantifies and analyzes the impact of renovation measures on the carbon emissions of buildings in materialization and operation stages, accounts for the carbon increments in multiple renovation measures and the carbon emission intensity of building unit area retrofitting practices, analyzes the importance and impact of multi-objective renovation measures on building operation carbon emissions and carbon saving, and constructs a method for calculating building retrofit carbon accounting, operation carbon reduction, and carbon increments’ static recovery period. From a carbon perspective, the renovation of old buildings means extending the life of the buildings and meeting the housing needs of modern residents.

2. Methodology

2.1. System Boundary

Based on LCA, building carbon emissions are the sum of carbon emissions from the materialization, operation, and disposal stages [33]. In this paper, we studied the carbon increments generated by building renovation measures and the carbon saving of building operations before and after an energy-saving retrofit. These renovation measures are integral parts of the original building and are not considered for separate demolition. Meanwhile, the carbon emissions in the demolition stage have a smll proportion, accounting for 0.7–1.2% [25]. Based on the IPCC’s principle [34] of “sustainability and need for precise measurement” in carbon accounting, we did not include carbon emissions of the demolition phase in establishing the study boundary. The technology roadmap is shown in Figure 1.

2.2. Basic Calculation Method

Building carbon emissions are the sum of the greenhouse gas emissions produced in each phase, expressed in carbon dioxide equivalents. The emission factor is a widely used and accepted method of carbon accounting in the building sector. It works by multiplying energy consumption and carbon emission factors [35]. In our work, we also used carbon emission factors for carbon accounting. Carbon emission factors of relevant construction materials and construction machinery quantities referred to the Chinese national standard “Standard for building carbon emission calculation” (GB/T 51366—2019). The accounting Formula (1) is as follows:
E = A D i × E F i
where E is CO2 emissions, A D i is activity level data. E F i is the emission factor, the level of CO2 emissions per unit of activity level.

2.3. Carbon Emissions Calculation

According to the Kyoto Protocol’s Clean Development Mechanism (CDM) [36], the calculation of carbon emissions should be realistic and measurable. However, it is difficult to accurately measure carbon emissions from the demolition phase of the building renovation process, especially since there was only one building in the project. At the same time, carbon emissions from the demolition phase account for a small percentage of the life cycle carbon emissions of buildings [9]. In this study, carbon emissions calculations included two aspects: the materialization and use stages. The Formula (2) is as follows:
E r e = E m a + E o p
where E r e is the renovation process resulting in carbon emissions from the residential area. E m a is the carbon emissions 6 during the materialization stage. E o p is the carbon emissions during the operation stage.

2.3.1. Carbon Emissions during the Materialization Stage

Carbon emissions during the materialization stage mainly include energy consumption and processes releasing CO2 during the production of building materials, CO2 from fuel combustion during material transportation, and carbon emissions generated by the energy consumption levels of mechanical equipment in the construction stage. The Formula (3) is as follows:
E m a = E p + E t + E c
where E m a is the carbon emissions during the materialization stage, kg CO2; E p is the carbon emissions from material production, kg CO2; E t is the carbon emissions from material transportation, kg CO2; and E c is the carbon emissions during the construction stage, kg CO2.
  • It generates CO2 when building materials are produced and processed because of energy consumption and raw material mining. These values should be accounted for by carbon emission factors from the National Standards [37]. The Formula (4) is as follows:
E p = M i × C F i
where M is material consumption, which would be obtained or calculated from the projects list; i is the type of building materials involved in the renovation; and C F is the carbon emissions factor for the materials.
2.
Carbon emissions released from material transportation are associated with the mode of transportation and distance. The calculating Formula (5) is as follows:
E t = M i × D i × T i
where D i is the transport distance; the default transportation distance for concrete is 40 km, and for other building materials it is 500 km [37]. T i is the carbon emissions factor for the transportation type.
3.
The type of machinery and equipment calculates carbon emissions and shifts during the retrofitting process.
E c = E c , i × E F i
where E c , i is the sum of energy consumption; i is the type of energy; and E F i is the carbon emissions factor of energy.

2.3.2. Carbon Emissions during the Operation Stage

This study focused on the carbon reduction effect of retrofit measures during the operation stage, ignoring the carbon source/sink. The energy consumption of buildings includes electricity, heating, and cooling. The Formula (7) used to calculate carbon emissions during the use stage is as follows:
E o p = ( E o p , i i × E F i ) × y
where E o p , i is the sum of energy consumption in the building operation; i is the type of energy; and y is running time in years.

2.4. Carbon Emission Assessment Indicators of Renovation

Building renovations would increase production activities, which would increase carbon emissions. Following the economics input recovery perspective, we proposed the concept of carbon recovery. By quantifying the carbon emission indicators of building retrofitting, we were able to guide the low-carbon retrofitting process and optimize the impact of each retrofitting measure on the carbon emissions from building operations.

2.4.1. Carbon Increments

During the renovation process, building materials are used for the existing building to improve residential conditions. Meanwhile, production, transportation, and construction would increase the carbon emissions in the life cycle of the building, which is called carbon increments, numerically equal to carbon emissions at the materialization stage.

2.4.2. Carbon Saving

During the operation phase, the retrofitted building reduces building energy consumption for cooling, heating, and lighting compared to the existing building. The building retrofit operation’s carbon saving value is calculated according to Equation (8):
E s a = E o p E o p
where E s a is carbon saving; E o p is the sum of energy consumption in an existing building operation; and E o p is the energy consumption sum in a retrofitted building operation.

2.4.3. Carbon Emission Intensity of Building Renovation per Area

Carbon emission intensity of building renovation per area is a parameter measuring the carbon indicator used for retrofitting measures in buildings, communities, or old residential neighborhoods, which can be calculated according to Equation (9):
C r e = E m a / ( A × y )
where C r e is the carbon emission intensity of building renovations per unit area spread over the expected years of use remaining; A is the building area; and y is the expected years of use remaining.

2.4.4. Building Renovation Carbon Increment’s Static Payback Period

Regarding an economic point of view, the static payback period T is calculated for the carbon increments, see Equation (10):
T = E i n / E s a

3. Case Study

3.1. Case Selection

The study researched a building in China’s cold region in Ji’nan city, Shandong Province. The building was built in 1990 and had a service life of 50 years in architectural design. It was a five-story, typical residential building, with a height of 16 m, a flat roof, a brick-wall structure with a total construction area of 1800.72 m2, 500.45 m2 of roof area, 1427.87 m2 of exterior wall area, and 371.25 m2 of exterior window area. The building included three dwelling units, but the stairwell was exposed to the outside environment without doors and windows. These buildings were developed in the 1980s to meet the rapid growth and wide distribution of the population. Central heating is used for heating in the winter; air conditioners are used for cooling in every household. Because of the houses’ age, the lack of insulation and comfortable living conditions means that it has not been easy to satisfy good living requirements. The renovation was completed in April 2021 and the the building will remain in use for 18 years.
The floor plan of the case study building is shown in Figure 2.

3.2. Building Model

Based on the basic design parameters of the building envelope and the specific data in Table 1, the building model was set in DesignBuilder to simulate energy consumption values in the building. In this building model, 26 °C and 18 °C were set as set-point values for summer and winter, respectively.
Efficiency had a direct impact on the primary energy consumption and carbon emissions values. For room air conditioners, energy efficiency was selected at 4.00 (energy efficiency grade III) [38]. Because heat-supply networks have long operation times with poor insulation conditions and heat loss rates of up to 25% and higher [39], the heat loss of a heat-supply network was set at 25% in this study.
The annual load of the building was simulated at 57,499.85 kWh converted into 31.93 kWh/m2 (cooling), 759,214.73 MJ converted into 117.12 kWh/m2 (heating), and 492.75 kWh (public lighting in the stairwell). The primary energy consumption was converted from the building load. According to Formula (1), the carbon emissions in the use stage of the existing building will be calculated at 119.99 t CO2/a, which equals 66.63 kg CO2/(m2·a). The carbon emissions factor for heating is 0.11 t CO2/GJ; the electricity emissions factor in Shandong province is 0.5810 t CO2/MWh. Table 2 shows the annual carbon emissions in the use stage.

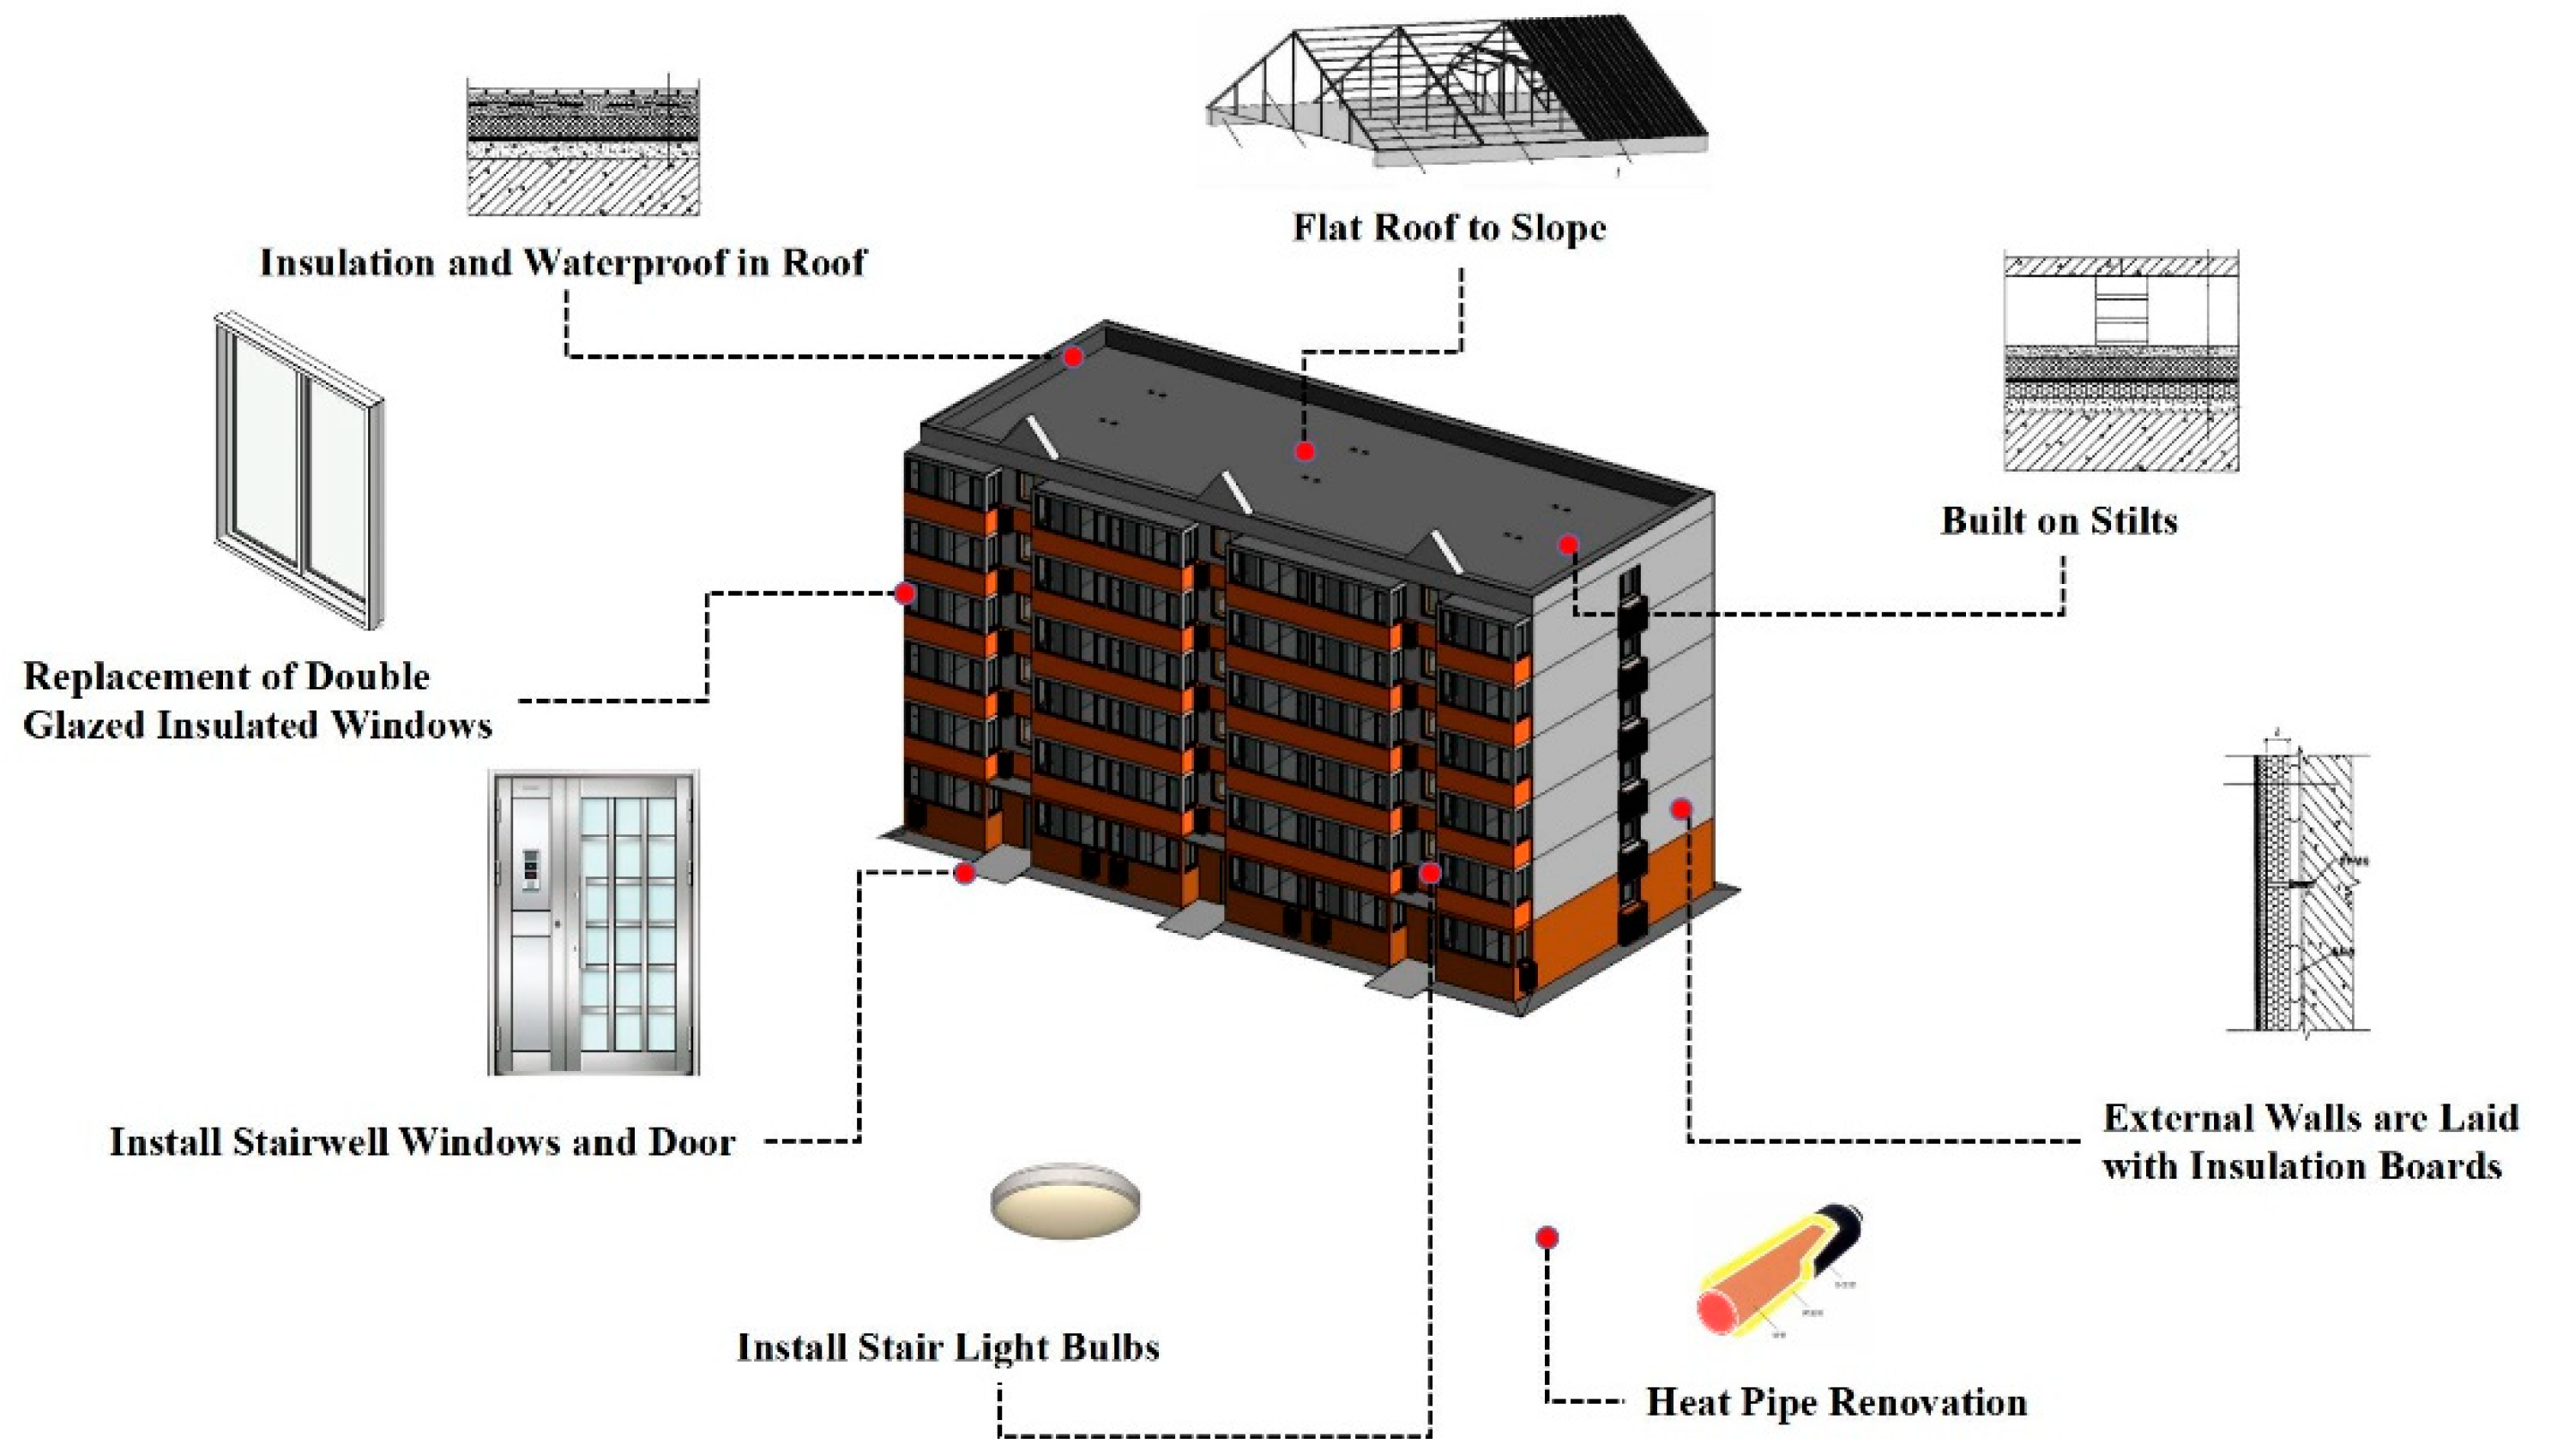
3.3. Renovation Measures

According to the Design Standard for Energy Efficiency of Residential Buildings [40], the energy saving rate should stay at 75%, which means renovated buildings have to reduce 75% of their energy use. Hence, these energy-saving measures were designed to attain an energy saving level and are shown in Figure 3. The parameters of the renovated building envelope are shown in Table 3.

3.3.1. External Wall

The outer layer of the exterior wall of the original building fell off, and there were no insulation materials in the walls. In the renovation project, the EPS external insulation system covered the existing walls to improve the thermal insulation’s performance. The thickness of the EPS insulation board was calculated at 80 mm.
Construction: powder coatings and insulation mortar were used to fix the external insulation system (manpower and machinery).
The U-value of a new and renovated external wall was 0.40 W/(m2·K).

3.3.2. Roof

The roof of the original building was severely damaged, including the insulation and waterproof layers. During the renovation project, the insulation and waterproof layer needed to be repaired and light-galvanized-color steel needed to be installed on the four-sided sloped roof.
The thermal insulation material used was an XPS thermal insulation board, with a thermal conductivity value of 0.03 W/m·K. In order to satisfy the energy saving requirements, the thickness of the XPS board was calculated at 35 mm.
An SBS-modified asphalt waterproof coil was used for the waterproofing project.
Under the condition that the parapet was not damaged on the original roof, the light steel roof truss was set by a two-point support, and the slope was 30°.
Construction details (manpower and machinery):
  • We used 120 mm × 2.5 mm square steel with 3.5 m spacing as the frame;
  • We used 60 mm × 2.0 mm square steel as bollards;
  • We used C-shaped steel C140 × 50 mm × 20 mm × 2.5 mm as roof purlins;
  • We used 120 mm × 2.5 mm steel beams.
The roof was pitched on all sides and laid with galvanized-colored steel tiles.
The U-value of the new and renovated roof was 0.35 W/(m2·K).

3.3.3. External Window

There were single-layer glass aluminum alloy windows in the old residential building. In the renovation project, the aluminum–plastic co-extruded double-glazed windows replaced the original windows.
Construction: demolish the existing windows, then install the prefabricated window (manpower and machinery).
The U-value of the new and renovated windows was 2.3 W/(m2·K).

3.3.4. Stairwell

Due to disrepair, there were no main doors and windows in the public stairwell, with poor insulation and air tightness. During the renovation project, the main doors and double-glazed windows were installed to improve comfort.
Construction: install the prefabricated window (manpower).

3.3.5. Public Lighting

There was incandescent light (45 w) in the stairwell, during the renovation project, under the same luminous flux; LED lights (7 w) with an acousto-optic time-delay control (the 60 s) were used as alternative lighting. The sum of lights was 15.
Construction: install LED lights (manpower).

3.3.6. Heat-Supply Network

During the renovation project, the heating pipe network was repaired with insulation, and the pipes in poor condition were replaced. Meanwhile, a heat-supply network upgrade requires the installation of a compensator and heat metering device.
Construction: demolish the existing insulation in poor condition, then place high-performance insulation on the heating pipe (manpower and machinery).

4. Results

4.1. Carbon Emissions during the Materialization Stage

Carbon emissions during the materialization stage were divided into production, transportation, and construction factors. Carbon emissions during this stage depended on the number of building materials collected and the construction methods. The data are from the field research, budget list, reference statistics, and standard value. The details are shown in Table 4, Table 5, Table 6 and Table 7. According to Formula (3), the carbon emission value during the materialization stage is 198.66 t CO2.

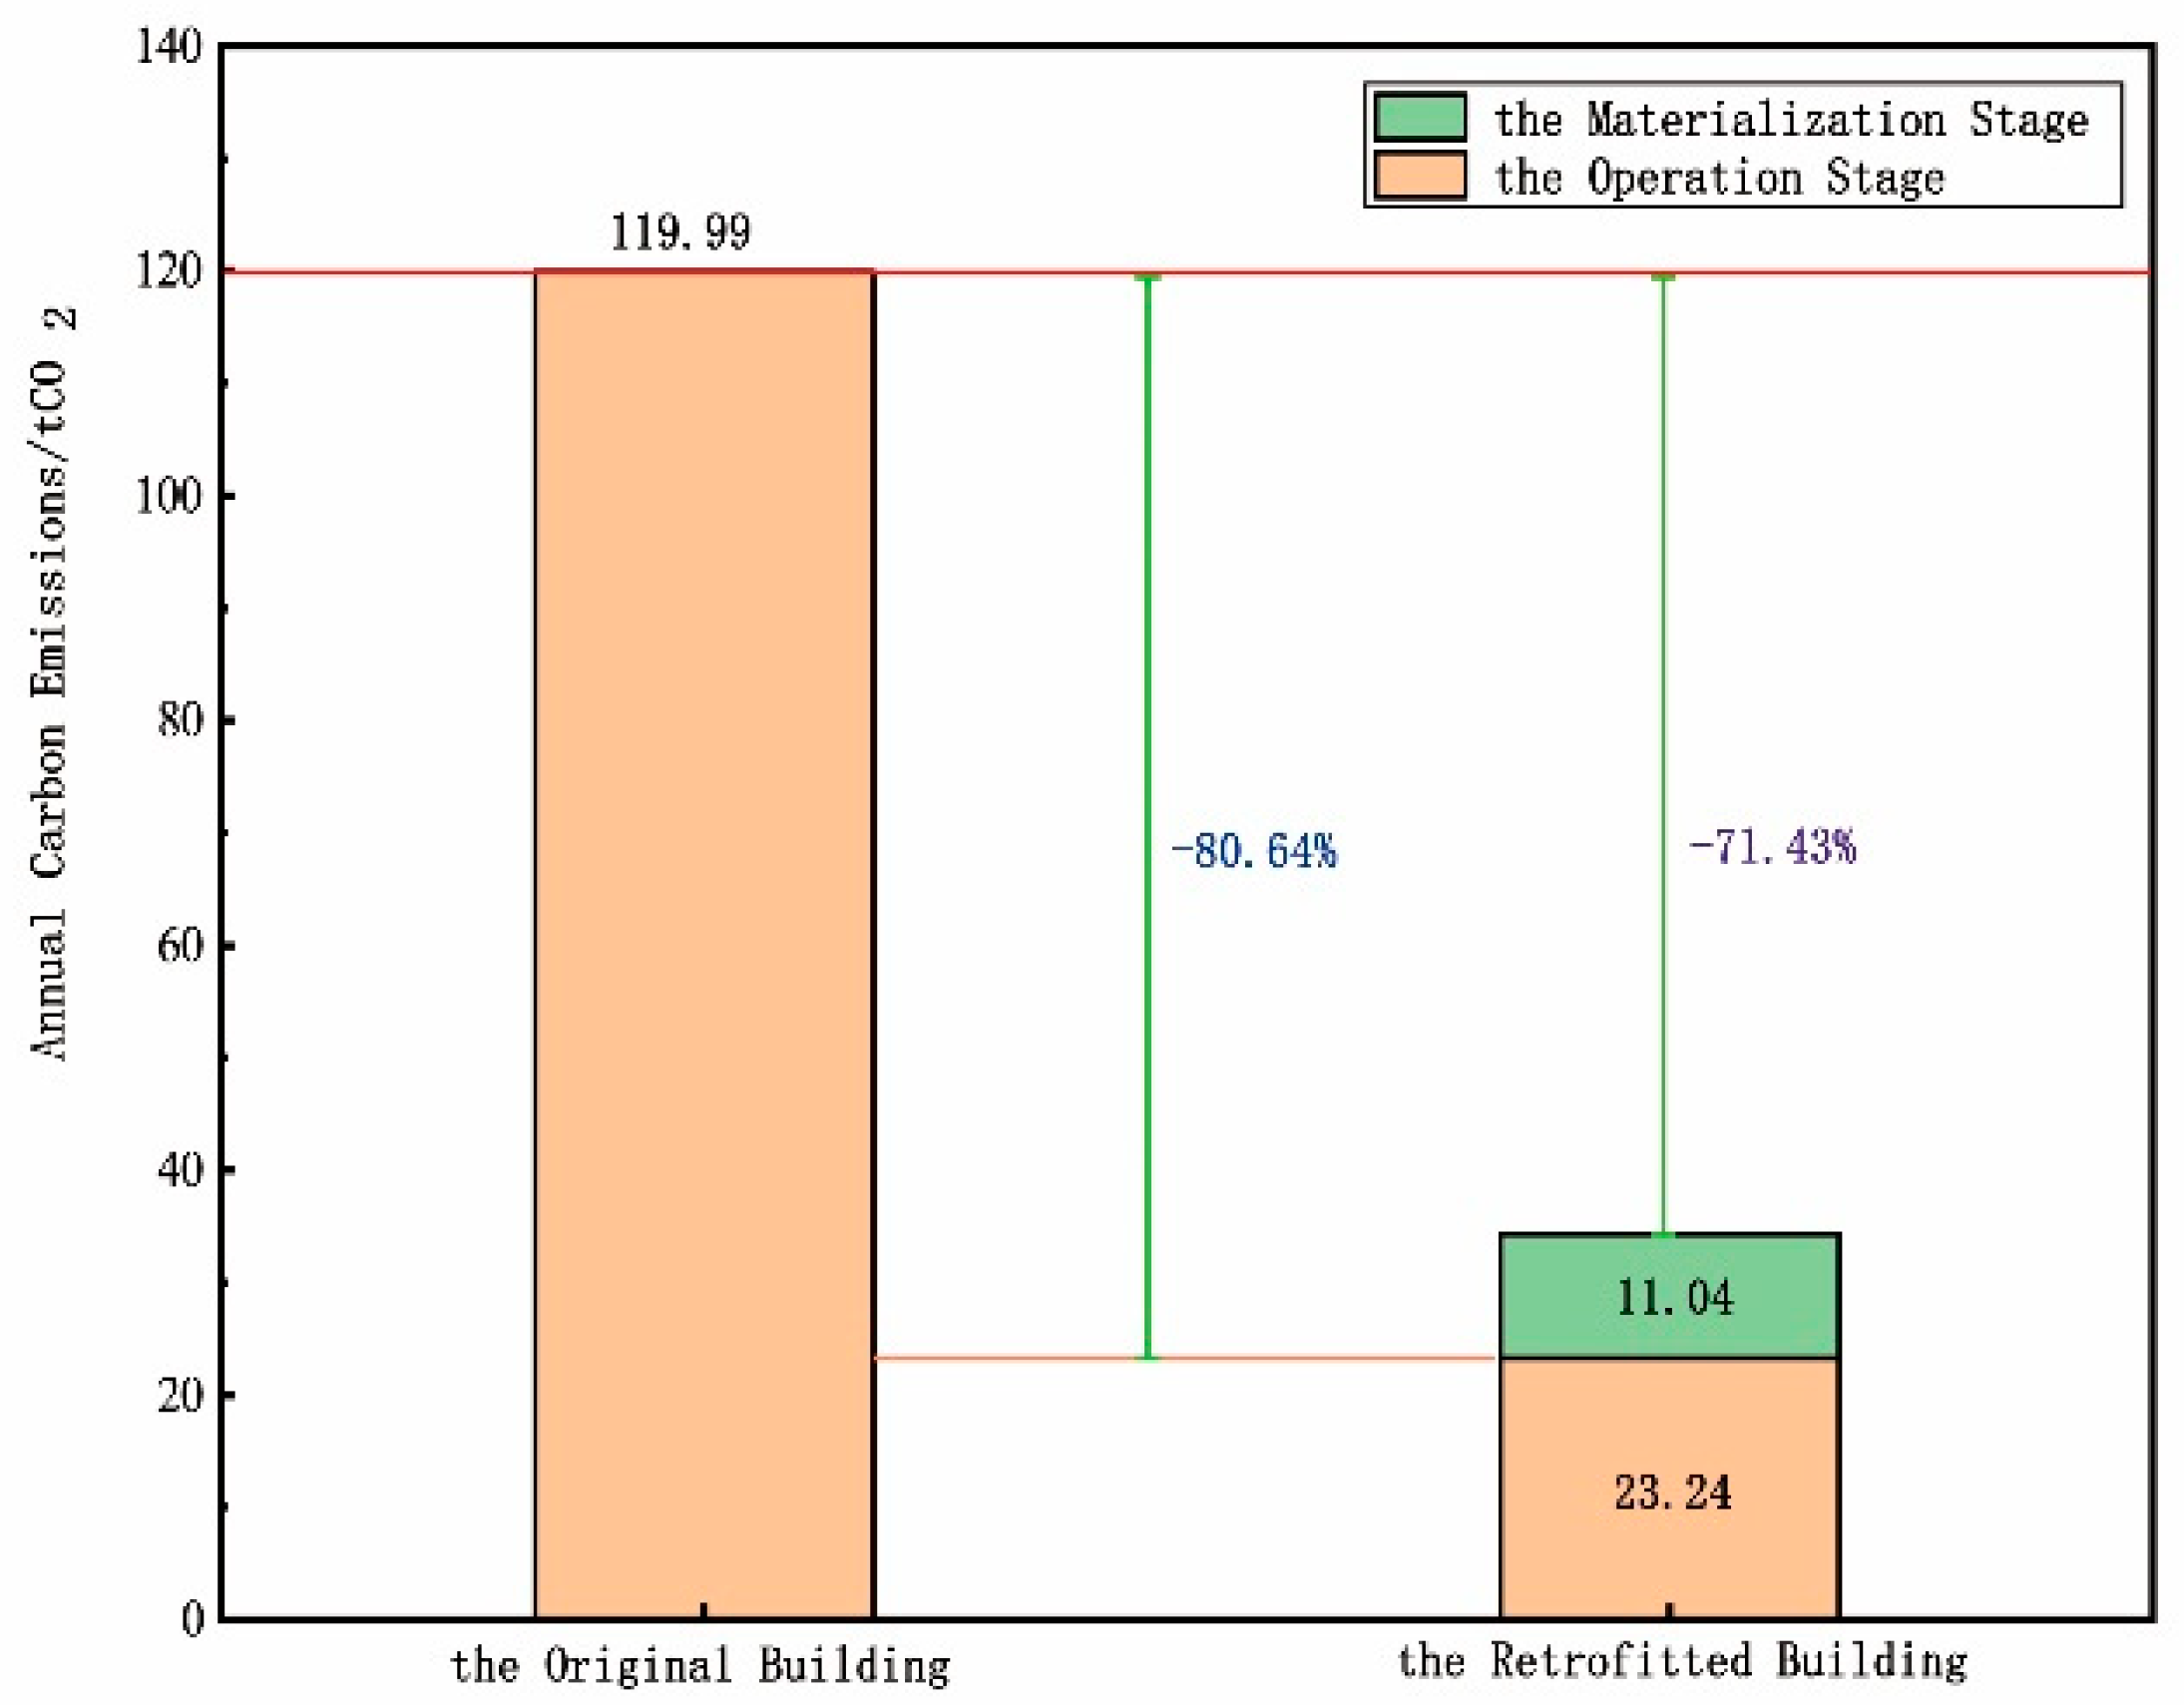
4.2. Carbon Emissions from the Operation Stage

Following the renovation of the building, the building’s remaining useful life is 18 years. Annual carbon emissions during the operation stage can be simulated and calculated by energy loads of retrofitted buildings, which are 43,157.97 kWh, 138,451.70 MJ, and 76.65 kWh, respectively, for cooling, heating, and lighting from DesignBuilder. When the pipe insulation was improved, the heat network efficiency was enhanced to 90% [44], which meant that the heat lost from the heat-supply network was reduced to 10%. Based on Formula (7), carbon emissions can be obtained at 23.24 t CO2/a and 12.90 kg CO2/(m2·a) in Table 8.
The performance of the building envelope was improved by retrofitting measures, which improved heating and cooling energy consumption rates. According to the relevant research, Dodoo [45] obtained energy renovation measures for a typical 1970s multi-family building and saved 35–43% of energy in this project.

4.3. The Life Cycle

As shown in Figure 4, the carbon emissions from the original building during the operation stage is 119.99 t CO2/a; following the transformation, it was reduced to 23.24 t CO2/a and the rate of reduction was up to 80.64%. However, the renovation process generated carbon emissions of 198.66 t CO2 in total, which was converted to 11.04 t CO2/a; considering this carbon emissions value, the carbon reduction rate still remains at 71.43%.
Overall, Table 9 shows the carbon emissions of this study. Regardless of the attenuation, the carbon emissions during the use stage were accumulated over 18 years to attain 418.32 t CO2 taking up 67.80% of the whole carbon emissions during life cycle.

5. Discussion

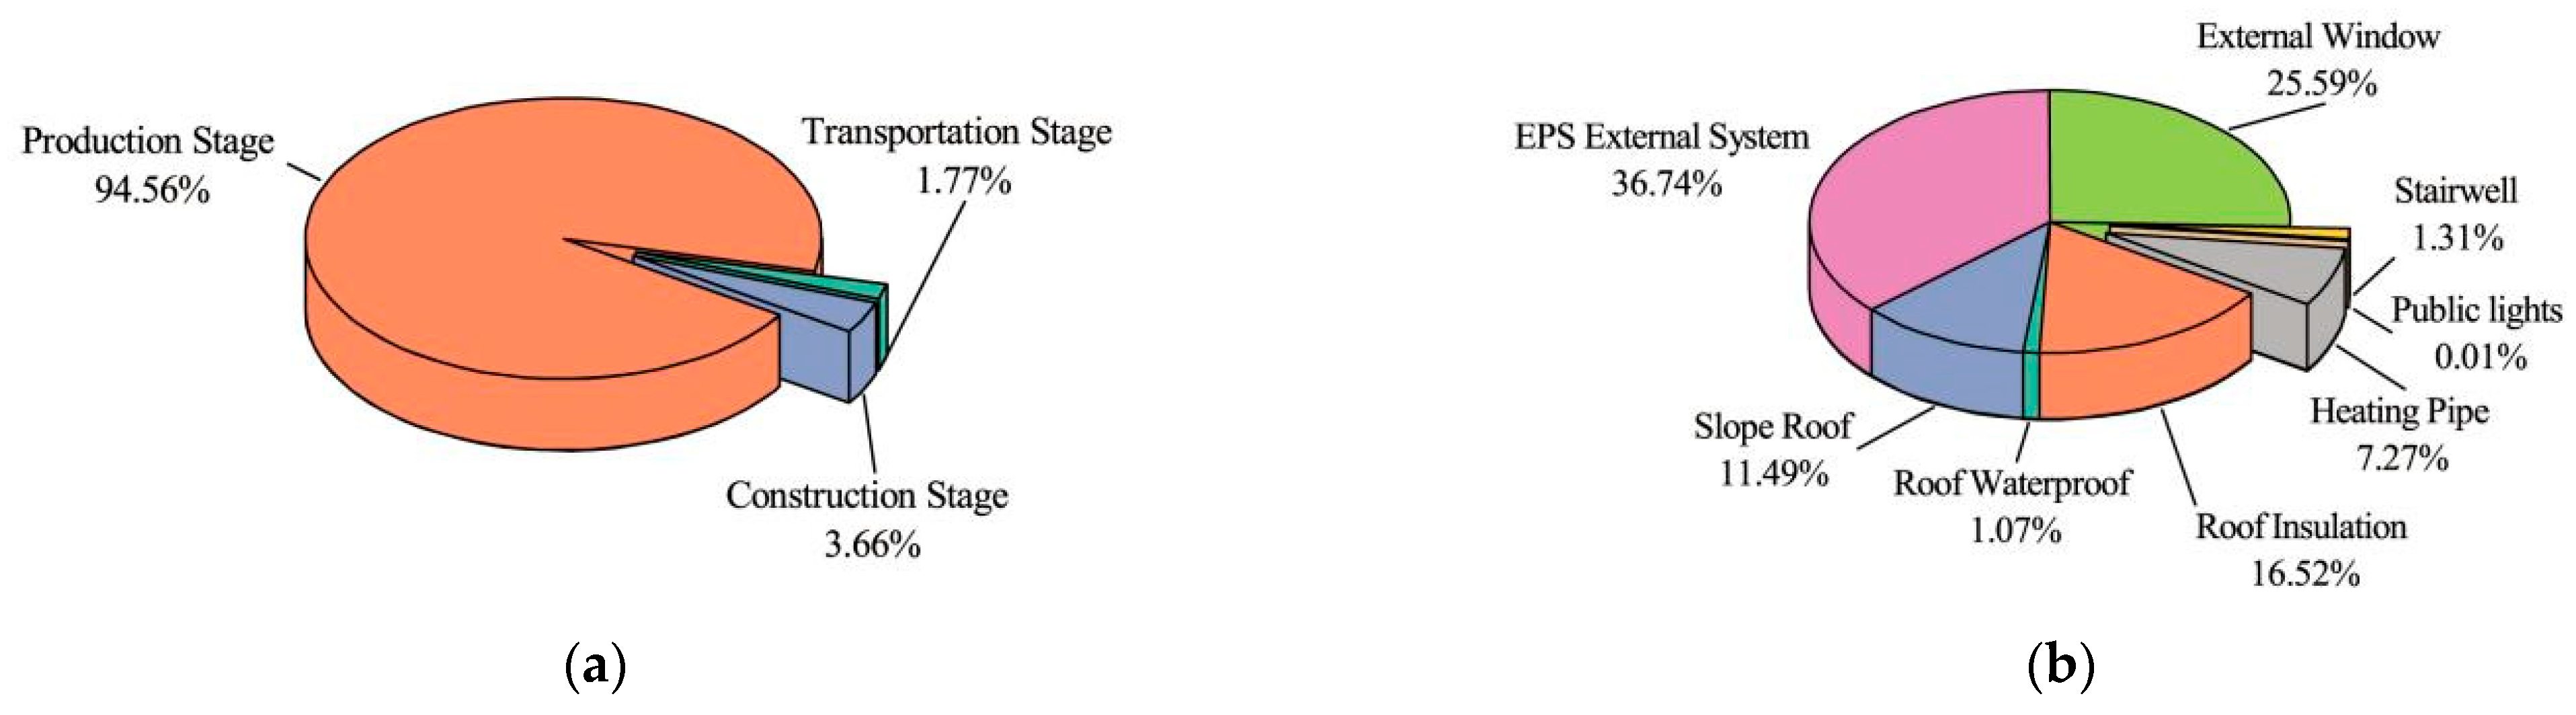
5.1. Impact of Renovation Measures on Carbon Increments

In this project, the additional carbon emission values were from the use of renovation material, which equaled 198.66 t CO2. Table 10 and Figure 5a shows the rates of carbon emissions during the materialization stage. The material production generated 187.86 t CO2, accounting for 96.04% of the carbon increments. Meanwhile, Figure 5b shows the carbon emissions during the renovation measures. Envelope conversion generates high carbon emissions and performs well to improve the thermal insulation’s performance, including the external wall, windows, and roof, and reduce energy consumption rates. In terms of quality-of-life improvements, such as repairing heat pipes and installing main doors, windows, and LED lights in the stairwell, their carbon emissions take up 8.59%.
Based on the results, it is necessary to focus on carbon increments and their proportion. Ignoring the carbon increments produced by renovations leads to an overestimation of the carbon-reduction effects of some actions. In this case, the carbon-reduction effect would be overestimated by 9.18%. Some studies have achieved similar conclusions. Anderson’s [46] analysis determined that the materials used for renovation projects increased the buildings’ embodied emissions by 7 and 14%. In particular, the use of materials affects the carbon increments as they occupy a high percentage. The retrofitting measures of the EPS external system, external window, sloped roof, and roof insulation are the main cause of carbon increments. Cang [47] observed that steel, thermal-insulation materials, doors and windows, and water-based paint were major sources of carbon emissions during the materialization phase. The results of these studies suggest that carbon increments are taken into account and focus on the choice of building materials.

5.2. Impact of Renovation Measures on Carbon Saving

Following the renovation, the carbon emissions from cooling, heating, and public lighting in the use phase were reduced and exceeded our expectations at 12.90 kg CO2/(m2·a). Compared to the original building, the annual carbon savings were 96.75 t CO2/a, which represents 53.73 kg of CO2 per unit area and would decrease during the use stage each year. There is a significant decline in heating parts, with the greatest carbon reduction at 94.43 t CO2/a. Energy use for public lighting remarkably declined by 84.45% after switching to LED bulbs. Considering the life cycle factor, the retrofitted building can reduce emissions to 1741.58 t CO2 during the use stage.
The performance of the building envelope was improved by retrofitting measures, which provide benefits for heating and cooling energy consumption rates. According to the relevant research, Dodoo [45] obtained energy renovation measures for a typical 1970s multi-family building and saved 35–43% of the energy during this project (Table 11).

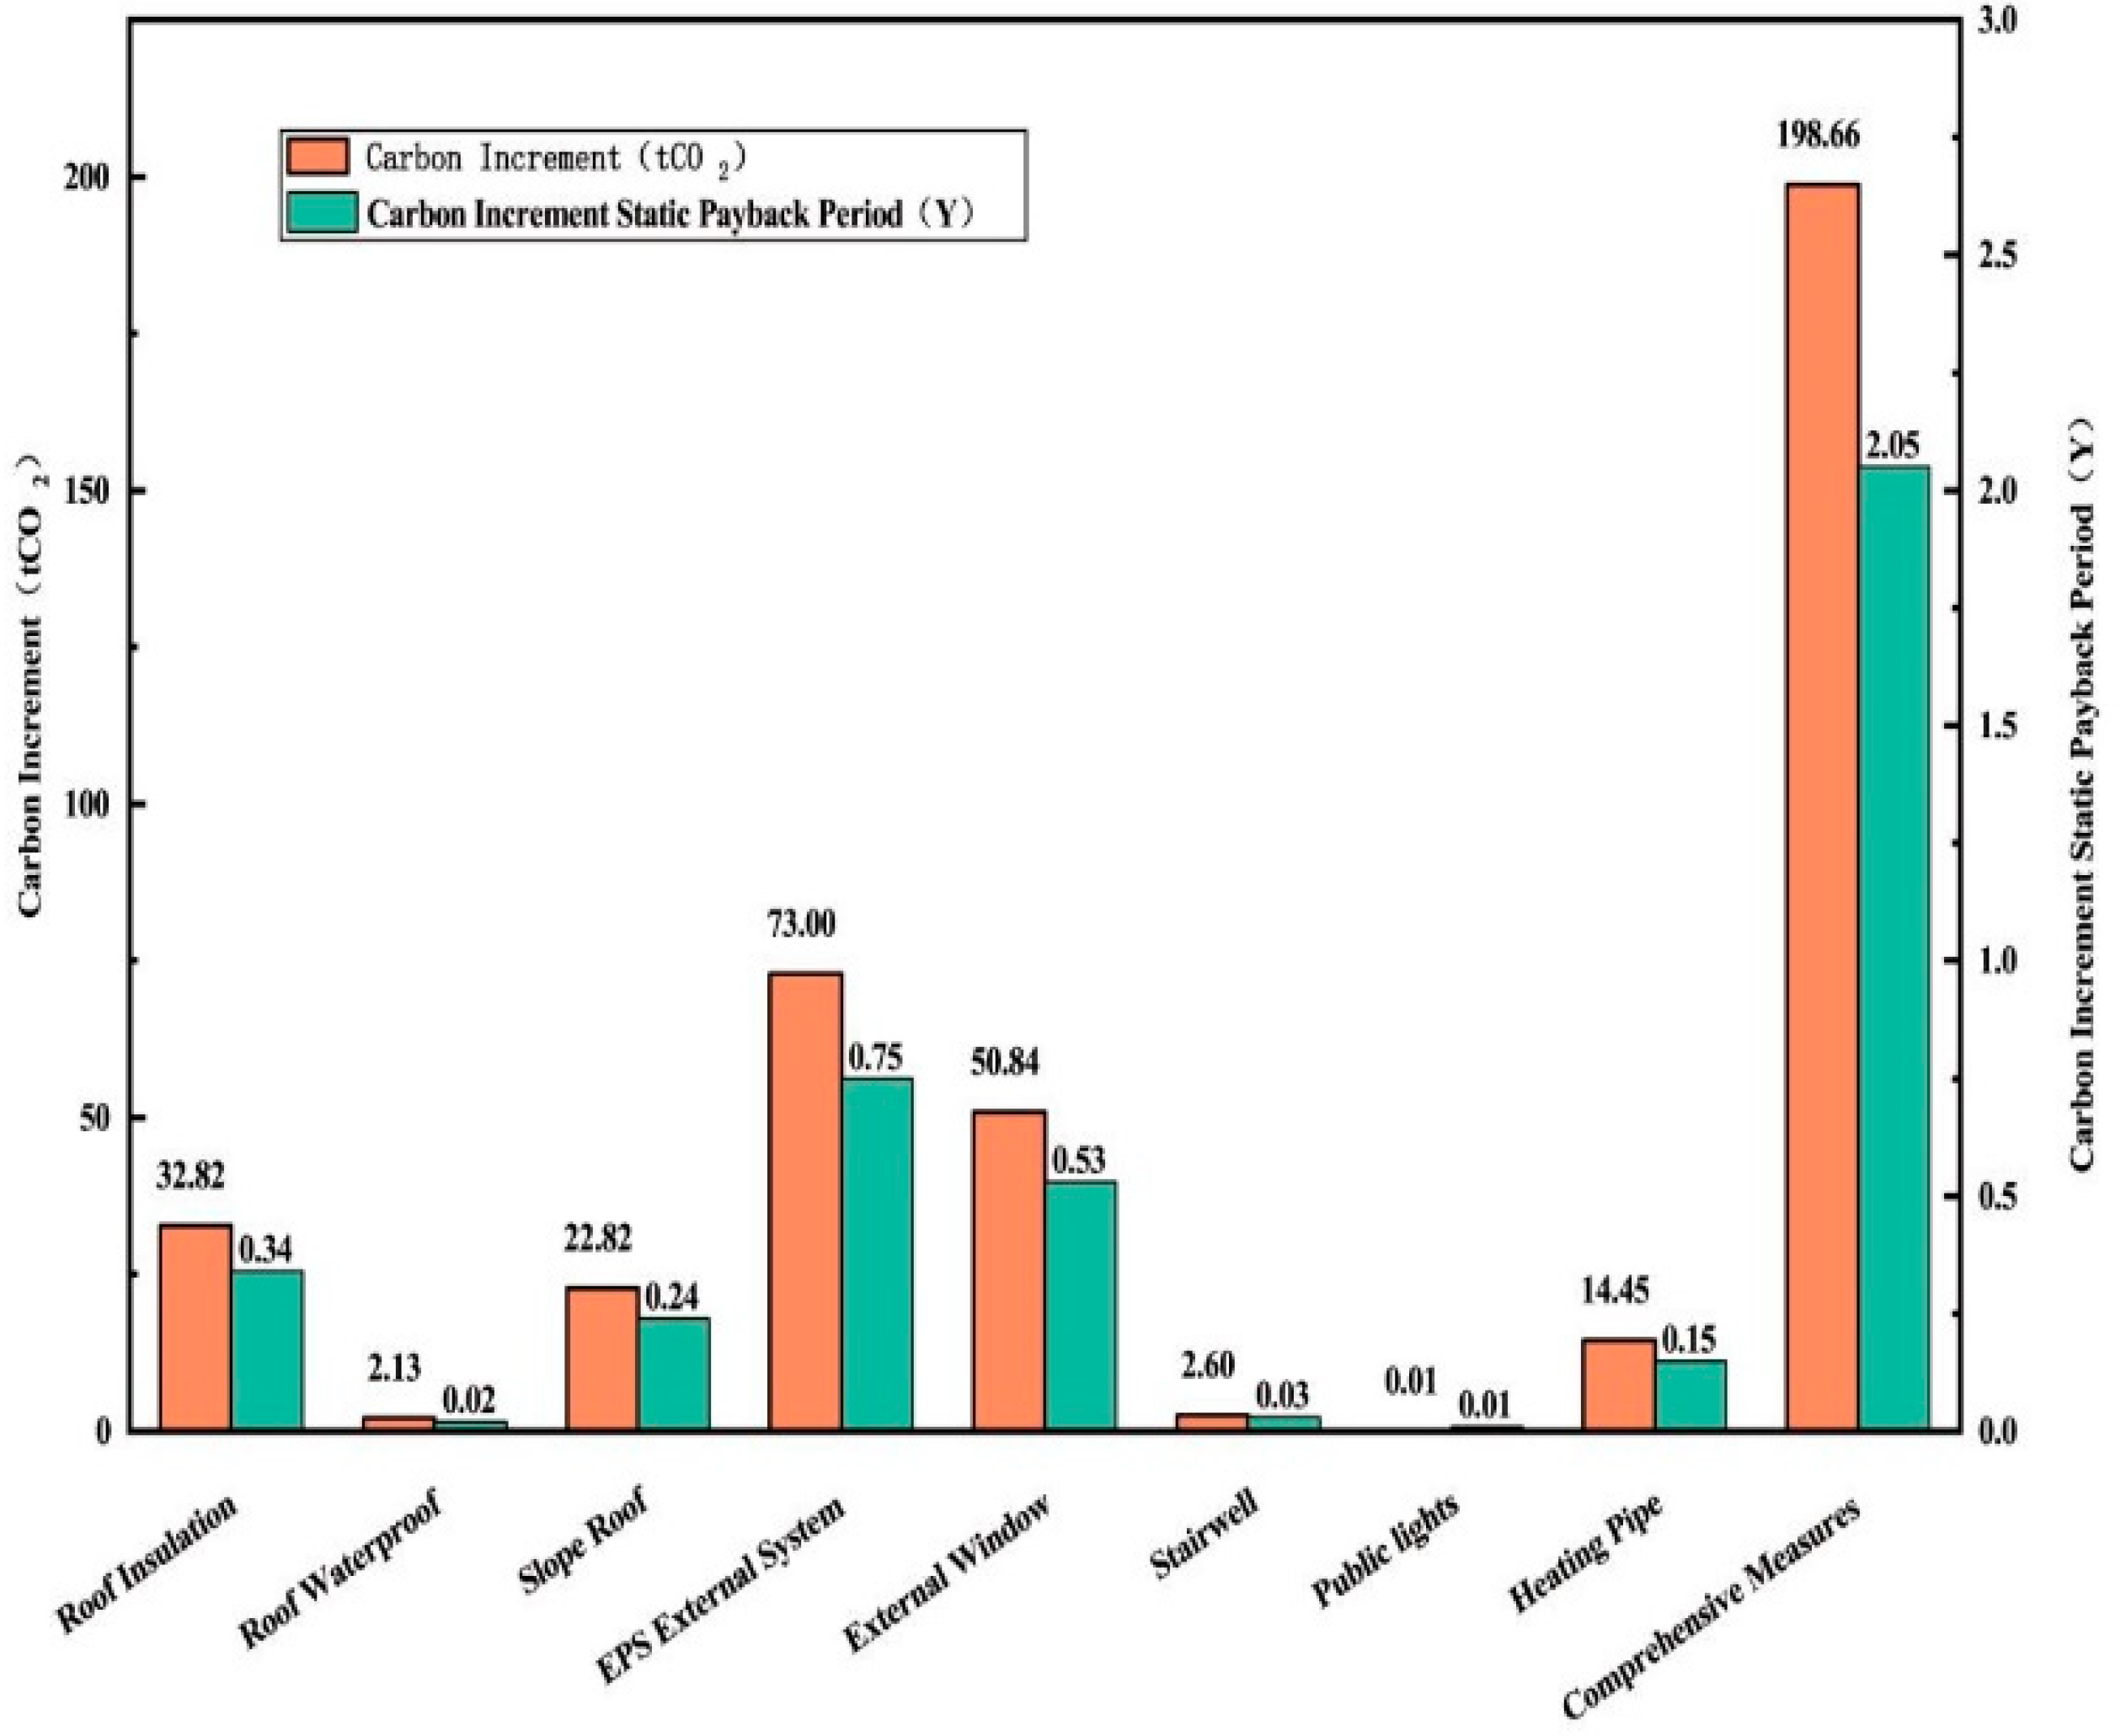
5.3. Carbon Increments’ Static Payback Period

In this case study, the carbon increment was 198.66 t CO2, equal to 110.32 kg CO2/m2. Following the renovation, carbon emissions during the use stage will be reduced by 53.73 kg CO2/m2 annually. According to Formula (10), the carbon payback of all renovation measures is 2.05 years. Figure 6 shows the static payback period of each measure to compare and analyze that measures that should be promoted, preferentially.
There are correlational studies about carbon payback time. In Anderson’s study [46], he simulated the improved thermal performance of residential buildings’ envelope structures and accounted for the payback time for CO2 emissions of renovations ranging from 1 to 3 years. Bull [48] observed that the carbon payback time for energy-saving renovations of a school building in the UK was 3.9 years. The results of these studies suggest that the renovations are beneficial and should be considered.

6. Conclusions

In our work, we proposed a carbon accounting boundary and calculation method for retrofitting buildings from the perspective of carbon emissions. We analyzed the carbon savings in the use phase of the buildings and quantified the carbon emissions and carbon increments of various retrofitting processes. Meanwhile, for retrofitting buildings, we established carbon emission assessment indexes, including carbon increments, carbon saving, carbon emission intensity, and static payback period of carbon increments. These indicators provide a reference calculation method for quantitatively assessing building retrofitting practices from a carbon perspective.
We conducted the assessment for our case study. The carbon emissions from the building during the operation stage before and after renovations were 119.99 t CO2/a and 23.24 t CO2/a, respectively. The carbon increment was 198.66 t of CO2 from the transformation during the materialization stage. Based on these results, the main conclusions are as follows:
  • In this case, renovation measures would positively influence carbon emission reductions during the use stage. A total of 96.75 t of CO2 would be reduced every year, and the rate of carbon saving would be about 80%. Nevertheless, renovation measures must rebuild the existing building with new materials, increasing the life cycle of carbon emissions. Significantly, the renovation involved in the building envelope (EPS external insulation, roof insulation, sloped roof, and external windows) would comprise a 91.41% carbon increase, improve common areas (stairwell, lighting), and replace heat pipes occupying 1.32% and 7.27%, respectively. In sum, the carbon increments per unit area of the combination of retrofitting measures are 110.32 kg CO2/m2. The static payback period of carbon increments is 2.05 years.
  • In this case, the production of materials during the materialization stage was 96.04% of the carbon increments. Hence, promoting low-carbon, lightweight, high-performance building materials with low coats is essential. In other words, there is an effective way to reduce payback time, which reduced carbon increments and saves more energy to decrease carbon emissions.
  • The carbon emissions from the operation occupies the highest proportion, close to 70%. Electricity and heating are the primary sources of carbon emissions. If energy sectors were expedited to shift to green energy and fossil energy was substituted by renewable energy in the building sector, carbon emissions would be decreased further.

Author Contributions

Writing—original draft, data curation, Y.H.; investigation, Y.W.; methodology, Z.S.; writing—review and editing, validation, H.Y.; resources, Y.X. All authors have read and agreed to the published version of the manuscript.

Funding

This work was supported by the Opening Funds of the State Key Laboratory of Building Safety and Built Environment & National Engineering Research Center of Building Technology (No. BSBE2020-10), the Natural Science Foundation of Shandong Province (No. ZR2020KE020, ZR2021ME185), and the Science and Technology SMEs Innovation Capacity Enhancement Project of Shandong Province (No. 2022TSGC2144, 2022TSGC2322).

Institutional Review Board Statement

Not applicable.

Informed Consent Statement

Not applicable.

Data Availability Statement

Data are contained within the article.

Conflicts of Interest

The authors declare no conflict of interest.

References

  1. Zhang, F.; Deng, X.; Xie, L.; Xu, N. China’s energy-related carbon emissions projections for the shared socioeconomic pathways. Resour. Conserv. Recycl. 2021, 168, 105456. [Google Scholar] [CrossRef]
  2. Le, X.A.; Mf, A.; Ly, B.; Shuai, S.C. Heterogeneous green innovations and carbon emission performance: Evidence at China’s city level. Energy Econ. 2021, 99, 105269. [Google Scholar] [CrossRef]
  3. China Association of Building Energy Efficiency. 2021. Available online: https://mp.weixin.qq.com/s/tnzXNdft6Tk2Ca3QYtJT1Q (accessed on 18 December 2022).
  4. Li, T.T. Promoting People-Centered New Urbanization. China City News 2021, 5, 49. [Google Scholar] [CrossRef]
  5. Duan, Y.X. New Mode of Urban Self-Regeneration in Innovation-Driven Cities. City Plan. Rev. 2022, 46, 100–107. [Google Scholar]
  6. Mu, C. Cost-Benefit Evaluation Analysis of Comprehensive Renovation of Existing Residential Buildings in Old Districts. Master’s Thesis, Lanzhou University of Technology, Lanzhou, China, 2021. [Google Scholar] [CrossRef]
  7. Mei, Y.L.; Wang, C.H.; Li, L.L. Organic regeneration-oriented renovation of old residential areas: A study on the compilation of technical guide for the renovation of old residential areas in Jiangsu. City Plan. Rev. 2022, 46, 108–118. [Google Scholar]
  8. Cai, Y.N.; Yang, X.J.; Li, L.L. “Micro-Transformation”: The Renewal Method of Old Urban Community. Urban Dev. Stud. 2017, 24, 29–34. [Google Scholar] [CrossRef]
  9. Research Report on Building Energy Consumption in China 2020. J. Build. Energy Effic. 2021, 49, 1–6.
  10. Zhang, Z.Q. The research on interior environment art of the Great Hall of the People. Ph.D. Thesis, Central South University of Forestry and Technology, Changsha, China, 2007. [Google Scholar]
  11. Arena, T. Social Housing Building Envelope Retrofit in Russia New Material Assembly Application. 2016. Available online: https://hdl.handle.net/10125/45586 (accessed on 18 December 2022).
  12. Astakhova, E. The residential buildings of the 1960s architectural renovation. IOP Conf. Ser. Mater. Sci. Eng. 2019, 698, 033017. [Google Scholar] [CrossRef]
  13. Absimetov, V.E.; Solovev, D.B. The Use of Effective Design Solutions and High-Tech Building Materials for Reconstructing Residential Buildings of Mass Development in 1960–1990. IOP Conf. Ser. Mater. Sci. Eng. 2020, 753, 032027. [Google Scholar] [CrossRef]
  14. Attia, S.; Canonge, T.; Popineau, M.; Cuchet, M. Developing a benchmark model for renovated, nearly zero-energy, terraced dwellings. Appl. Energy 2022, 306, 118128. [Google Scholar] [CrossRef]
  15. Kim, G.; Schaefer, L.; Kim, J.T. Development of a Double-Skin Façade for Sustainable Renovation of Old Residential Buildings. Indoor Built Environ. 2012, 22, 180–190. [Google Scholar] [CrossRef]
  16. Shipley, R.; Utz, S.; Parsons, M. Does Adaptive Reuse Pay? A Study of the Business of Building Renovation in Ontario, Canada. Int. J. Herit. Stud. 2006, 12, 505–520. [Google Scholar] [CrossRef]
  17. Lei, S.Y.; Cao, Z.Q.; Li, D.L. The Influence of Thermal Parameters of Outer Envelope of a High-rise Residential Building on Building Energy Consumption in Nanjing. Build. Energy Environ. 2020, 39, 78–82. [Google Scholar]
  18. Han, J.T.; Nie, J.Z.; Li, D.Y. Study on the Reasonable Insulation Thickness of Exterior Wall in Commercial Buildings. New Build. Mater. 2018, 45, 127–130+137. [Google Scholar] [CrossRef]
  19. Liu, X.; Yang, X.; Liu, Y.; Zhang, X.; Lu, Q.; Zhou, Q. Analysis on Energy-saving Potential of Envelope Structure Reconstruction of Rural Houses in Cold Areas. Constr. Sci. Technol. 2021, 5, 33–38. [Google Scholar] [CrossRef]
  20. Huang, J.; Wang, S.; Teng, F.; Feng, W. Thermal performance optimization of envelope in the energy-saving renovation of existing residential buildings. Energy Build. 2021, 247, 111103. [Google Scholar] [CrossRef]
  21. Zhang, X.; Nie, S.; He, M.; Wang, J. Energy-saving renovation of old urban buildings: A case study of Beijing. Case Stud. Therm. Eng. 2021, 28, 101632. [Google Scholar] [CrossRef]
  22. Bicknell, K.B.; Ball, R.J.; Cullen, R.; Bigsby, H.R. New methodology for the ecological footprint with an application to the New Zealand economy. Ecol. Econ. 1998, 27, 149–160. [Google Scholar] [CrossRef]
  23. Nässén, J.; Holmberg, J.; Wadeskog, A.; Nyman, M. Direct and indirect energy use and carbon emissions in the production phase of buildings: An input–output analysis. Energy 2007, 32, 1593–1602. [Google Scholar] [CrossRef]
  24. Luo, Z. Study on Calculation Method of Building Life Cycle CO2 Emission and Emission Reduction Strategies. Ph.D. Thesis, Xi’an University of Architecture and Technology, Xi’an, China, 2016. [Google Scholar]
  25. Zhixin, L.; Liu, Y.; Jiaping, L. Carbon Diosxide Emissions of Office Buildings at Embodied Stage. J. Civ. Environ. Eng. 2014, 36, 37–43. [Google Scholar]
  26. Wang, Z.R. Study and Optimization of Life Cycle CO2 Emission Performance of Exterior Wall Insulation System in Cold Area. Ph.D. Thesis, Harbin Institute of Technology, Harbin, China, 2020. [Google Scholar]
  27. Taborianski, V.M.; Prado, R.T. Methodology of CO2 emission evaluation in the life cycle of office building façades. Environ. Impact Assess. Rev. 2012, 33, 41–47. [Google Scholar] [CrossRef]
  28. Tettey, U.Y.A.; Dodoo, A.; Gustavsson, L. Effects of different insulation materials on primary energy and CO2 emission of a multi-storey residential building. Energy Build. 2014, 82, 369–377. [Google Scholar] [CrossRef]
  29. Syngros, G.; Balaras, C.A.; Koubogiannis, D.G. Embodied CO2 emissions in building construction materials of hellenic dwellings. Procedia Environ. Sci. 2017, 38, 500–508. [Google Scholar] [CrossRef]
  30. Sharif, S.A.; Hammad, A. Simulation-based multi-objective optimization of institutional building renovation considering energy consumption, life-cycle cost and life-cycle assessment. J. Build. Eng. 2019, 21, 429–445. [Google Scholar] [CrossRef]
  31. Zhang, C.; Hu, M.; Laclau, B.; Garnesson, T.; Yang, X.; Tukker, A. Energy-carbon-investment payback analysis of prefabricated envelope-cladding system for building energy renovation: Cases in Spain, the Netherlands, and Sweden. Renew. Sustain. Energy Rev. 2021, 145, 111077. [Google Scholar] [CrossRef]
  32. Almeida, M.; Ferreira, M. Ten questions concerning cost-effective energy and carbon emissions optimization in building renovation. Build. Environ. 2018, 143, 15–23. [Google Scholar] [CrossRef]
  33. Zhang, X.; Wang, F. Life-cycle assessment and control measures for carbon emissions of typical buildings in China. Build. Environ. 2015, 86, 89–97. [Google Scholar] [CrossRef]
  34. Eggleston, H.S.; Buendia, L.; Miwa, K.; Ngara, T.; Tanabe, K. 2006 IPCC Guidelines for National Greenhouse Gas Inventories; Institute for Global Environmental Strategies: Hayama, Japan, 2006. [Google Scholar]
  35. Cellura, M.; Cusenza, M.A.; Longo, S. Energy-related GHG emissions balances: IPCC versus LCA. Sci. Total Environ. 2018, 628, 1328–1339. [Google Scholar] [CrossRef]
  36. Talberg, A.; Nielson, L. The Kyoto Protocol’s Clean Development Mechanism. 2009. Available online: https://core.ac.uk/download/pdf/30685381.pdf (accessed on 18 December 2022).
  37. GB/T 51366-2019; Standard for Building Carbon Emission Calculation. Ministry of Housing and Urban-Rural Development of the People’s Republic of China: Beijing, China, 2019.
  38. Sim, J.; Lee, H.; Jeong, J.H. Optimal design of variable-path heat exchanger for energy efficiency improvement of air-source heat pump system. Appl. Energy 2021, 290, 116741. [Google Scholar] [CrossRef]
  39. Zhu, Z.H.; Song, Y.M.; Tian, G.S. Analysis of Heat Consumption Indexes for Buildings and Heat Loss of Heat-supply Network in Jinan City. GASHEAT 2011, 31, 10–13. [Google Scholar] [CrossRef]
  40. DB37/5026-2014; Design Standard for Energy Efficiency of Residential Buildings. Housing and Urban-Rural Development of Shandong Province and Shandong Administration for Market Regulation: Jinan, China, 2014.
  41. Yu, H.Y.; Zeng, J.; Hu, X.Z. Carbon emission of chemical building materials production based on LCA. New Chem. Mater. 2015, 43, 218–221. [Google Scholar]
  42. Yang, Y.; Hong-bo, L.; Jian-hua, C. ChongQing’s Practice and Revelation of the Development of Low-Carbon Product Standards for LED Fluorescent Lamp. Stand. Sci. 2013, 33–35. [Google Scholar] [CrossRef]
  43. Jian, X. Study on the method of changing roof from flat to slope of old residential buildings. Master’s Thesis, Tsing Hua University, Beijing, China, 2019. [Google Scholar]
  44. Qiu, Y. How to improve the thermal efficiency of central heating. Eng. Technol. 2016, 12, 00284. [Google Scholar]
  45. Dodoo, A.; Gustaysson, L.; Tettey, U. Final energy savings and cost-effectiveness of deep energy renovation of a multi-storey residential building. Energy 2017, 135, 563–576. [Google Scholar] [CrossRef]
  46. Anderson, J.E.; Wulfhorst, G.; Lang, W. Expanding the use of life-cycle assessment to capture induced impacts in the built environment. Build. Environ. 2015, 94, 403–416. [Google Scholar] [CrossRef]
  47. Cang, Y.J.; Luo, Z.X.; Yang, L. A study on carbon emissions of building materials in materialization phase of urban residential buildings. Urban. Archit. 2018, 5, 17. [Google Scholar] [CrossRef]
  48. Bull, J.; Gupta, A.; Mumovic, D.; Kimpian, J. Life cycle cost and carbon footprint of energy efficient refurbishments to 20th century UK school buildings. Int. J. Sustain. Built Environ. 2014, 3, 1–17. [Google Scholar] [CrossRef]
Figure 1. Technical roadmap for carbon emissions research of building renovations in old residential areas.
Sustainability 15 03018 g001
Figure 2. The floor plan of the case study building.
Sustainability 15 03018 g002
Figure 3. Reconstruction measures for existing buildings.
Sustainability 15 03018 g003
Figure 4. Comparison of carbon emissions before and after the renovation.
Sustainability 15 03018 g004
Figure 5. Carbon emissions pie chart. (a) Proportion of carbon emissions during the materialization stage. (b) Proportion of carbon emissions from renovation measures during the materialization stages.
Sustainability 15 03018 g005
Figure 6. Carbon emissions from transformation measures and the static payback period for carbon increments.
Sustainability 15 03018 g006
Table 1. Basic design parameters of the existing building envelope.
EnvelopeMaterials and ConstructionU-Value
External WallLime Mortar 20 mm + Clay Solid Brick 370 mm + Cement 20 mm2.24 W/(m2·K)
Interior WallsLime Mortar 20 mm + Clay Solid Brick 240 mm + Cement 20 mm1.94 W/(m2·K)
RoofCement 20 mm + Cement Perlite 120 mm + Cement Coke 30 mm + Reinforced Concrete 130 mm1.14 W/(m2·K)
External WindowSingle-pane Aluminum Windows4.70 W/(m2·K)
Table 2. Annual carbon emissions from refrigeration, heating, and public lighting before the transformation.
ProjectLoadEfficiencyEnergy ConsumptionCarbon Emissions FactorAnnual Carbon Emissions/(t CO2/a)
Cooling57,499.85 kWh4.0014,374.96 kWh, electricity0.5810 t CO2/MWh8.35
Heating759,214.73 MJ75%1,012,286.31 MJ, heating0.11 t CO2/GJ111.35
Public Lighting492.75 kWh——492.75 kWh, electricity0.5810 t CO2/MWh0.29
Sum119.99
Table 3. Parameters of the existing building envelope after renovation.
EnvelopeMaterials and ConstructionU-Value
External WallLime Mortar 20 mm + Clay Solid Brick 370 mm + Cement 20 mm + EPS 80 mm0.40 W/(m2·K)
RoofCement 20 mm + Cement Perlite 120 mm + Cement Coke 30 mm + Reinforced Concrete 130 mm + XPS 30 mm + Slope 30°0.35 W/(m2·K)
External WindowAluminum–Plastic Co-Extruded Double-Glazed Windows2.30 W/(m2·K)
Table 4. List of building materials’ production stages and carbon emissions.
Renovation ProjectsMaterialsQuantitiesCarbon Emissions Factor [37]Carbon Emissions
/(t CO2)
Carbon Emissions per Unit Area/(kg CO2/m2)
Roof InsulationBrick, 30 mm500.45 m219.5 kg CO2 e/m29.765.42
Cement Mortar Screed, 20 mm13.01 t735 kg CO2e/t9.565.31
XPS, 35 mm17.52 m3669 kg CO2e/m311.726.51
Subtotal31.0417.24
Roof WaterproofingSBS Modified Asphalt Waterproof Coil [41]500.45 m24.01 kg CO2/m22.011.12
Subtotal2.011.12
Slope RoofSquare Steel, 120 mm × 2.5 mm0.62 t2190 kg CO2e/t1.360.76
Square Steel, 60 mm × 2.0 mm0.26 t2190 kg CO2e/t0.570.32
Shaped Steel,
C140 × 50 × 20 × 2.5 mm
3.99 t2190 kg CO2e/t8.744.85
Roof Tiles4.98 t2190 kg CO2e/t10.916.06
Subtotal21.5811.98
EPS External Insulation SystemCement Mortar, 8 mm12.85 t274 kg CO2e/t3.521.95
EPS Board, 80 mm114.23 m3534 kg CO2e/m261.0033.88
Mortar, 8 mm12.85 t242 kg CO2e/t3.111.73
Anchor Bolt0.26 t2190 kg CO2e/t0.570.32
Glass Fiber Mesh0.28 t574 kg CO2e/t0.160.09
Coating0.28 t2410 kg CO2e/t0.670.37
Subtotal69.0338.33
External WindowAluminum–Plastic Co-Extruded Double-Glazed Windows371.25 m2129.5 kg CO2e/m248.0826.70
Subtotal48.0826.70
StairwellDouble-Glazed Windows18.96 m2129.5 kg CO2e/m22.461.37
Subtotal2.461.37
Public LightsLED, 7 W105 W0.067 kg CO2e/W [42]0.010.056
Subtotal0.010.0056
Heating PipeSteel Pipe, φ159, 100 m3.67 t3150 kg CO2e/t11.566.42
Polyurethane, 32.5 mm,100 m0.40 t5220 kg CO2e/t2.101.17
Subtotal13.667.59
Sum187.86104.32
Table 5. Carbon emissions during building materials’ transportation.
MaterialsQuantities
/t
Carbon Emissions Factor
/[kge/(t·km)]
Type of TransportationDistanceCarbon Emissions
/t CO2
Cement38.710.057Truck (46 t)40 km0.09
Steel10.390.129Truck (18 t)500 km0.67
Coating0.280.344Truck (2 t)0.05
Brick100.162Truck (10 t)0.81
Heat-Preservation Material3.950.344Truck (2 t)0.68
Waterproof Material10.344Truck (2 t)0.17
Doors and Windows40.344Truck (2 t)0.69
Heating Pipes4.070.179Truck (8 t)0.36
Sum3.52
Table 6. Carbon emissions during construction.
MachineShifts [43]Energy ConsumptionCarbon Emissions FactorCarbon Emissions
/t CO2
Automobile Crane (8 t)5Diesel, 28.43 kg72.59 t CO2/TJ0.45
Semi-Automatic Cutting Machine30Electricity, 98.00 kWh0.6101 t CO2/MWh0.003
Electroslag Welder (1000 A)30Electricity, 147 kWh0.004
Truck (5 t)30Gasoline, 31.34 kg67.91 t CO2/TJ6.82
Sum7.28
Table 7. Sum of carbon emissions during materialization stage.
ProjectsProduction StageTransportation StageConstruction StageCarbon Emissions/t CO2Rate
Roof Insulation31.040.581.2032.8216.52%
Roof Waterproofing2.010.040.082.131.07%
Slope Roof21.580.400.8422.8211.49%
EPS External Insulation System69.031.292.6873.0036.75%
External Window48.080.901.8650.8425.59%
Stairwell2.460.050.102.601.31%
Public lights0.010.000.000.010.01%
Heating Pipe13.660.260.5314.457.27%
Sum198.66100%
Table 8. Annual carbon emissions during cooling, heating, and public lighting after transformation.
ProjectLoadEfficiencyEnergy ConsumptionCarbon Emissions FactorAnnual Carbon Emissions/(t CO2/a)
Cooling43,157.97 kWh4.0010,789.49 kWh, Electricity0.5810 t CO2/MWh5.89
Heating138,451.70 MJ90%153,835.22 MJ, Heating0.11 t CO2/GJ16.92
Public Lighting76.65 kWh——76.65 kWh, Electricity0.5810 t CO2/MWh0.04
Sum23.24
Table 9. Carbon emissions during the life cycle after the transformation.
StagesCarbon Emissions during Life Cycle/t CO2Carbon Emissions per Unit Area during Life Cycle/
(kg CO2/m2)
Rates
Materialization Stage198.66110.3232.20%
Operation Stage418.32232.3167.80%
Sum616.98342.63100%
Table 10. List of carbon increments.
StagesCarbon Emissions/t CO2Carbon Increments per Unit Area/(kg CO2/m2)Rate
Production187.86104.3296.04%
Transportation3.521.951.77%
Construction7.284.043.66%
Sum198.66110.32100%
Table 11. Carbon saving during the life cycle.
ProjectAnnual Carbon Saving/(t CO2/a)Annual Carbon Saving per Unit Area/[kg CO2/(m2·a)]Carbon Saving RateCarbon Saving during Life Cycle/t CO2
Cooing2.081.1624.94%37.50
Heating94.4352.4484.80%1699.73
Public Lighting0.240.1384.45%4.35
Sum96.7553.7380.64%1741.58
Disclaimer/Publisher’s Note: The statements, opinions and data contained in all publications are solely those of the individual author(s) and contributor(s) and not of MDPI and/or the editor(s). MDPI and/or the editor(s) disclaim responsibility for any injury to people or property resulting from any ideas, methods, instructions or products referred to in the content.

