1. Introduction
The concept of “ecology” was originally defined by the German biologist, Ernst Heinrich Haeckel, marking the official birth of ecology. In 1866, Haeckel pointed out that ecology is the science of studying the relationship between living things and their surrounding environments [
1]. Since the 1970s, many ecological problems related to human survival and development have become increasingly prominent and have gradually received extensive attention from human society; this makes humans living organism participants and an important part of ecological research [
2]. Moreover, to solve these ecological problems, it is necessary to use the principles and methods of ecology. This has led to ecology becoming a discipline that other research fields also pay attention to. In the trends, the discipline of linguistic ecology is thus formed, which is the integration of ecology and linguistics. One of the main goals and tasks of this discipline is to improve the ecological awareness and ecological literacy (ecoliteracy) of human beings [
3,
4]. It means that ecoliteracy has become one of the key issues in the study of linguistic ecology [
5].
Ecoliteracy is an interdisciplinary concept, and scholars from different disciplines will give various definitions and frameworks for ecoliteracy from their own perspectives [
5,
6,
7,
8,
9]. In the study of linguistic ecology, ecoliteracy mainly refers to the ecologically sustainable development of the relationship between humans, humans and society, and humans and nature, which are developed based on the environmental knowledge, values, and actions necessary to respond to the environmental problems of human beings [
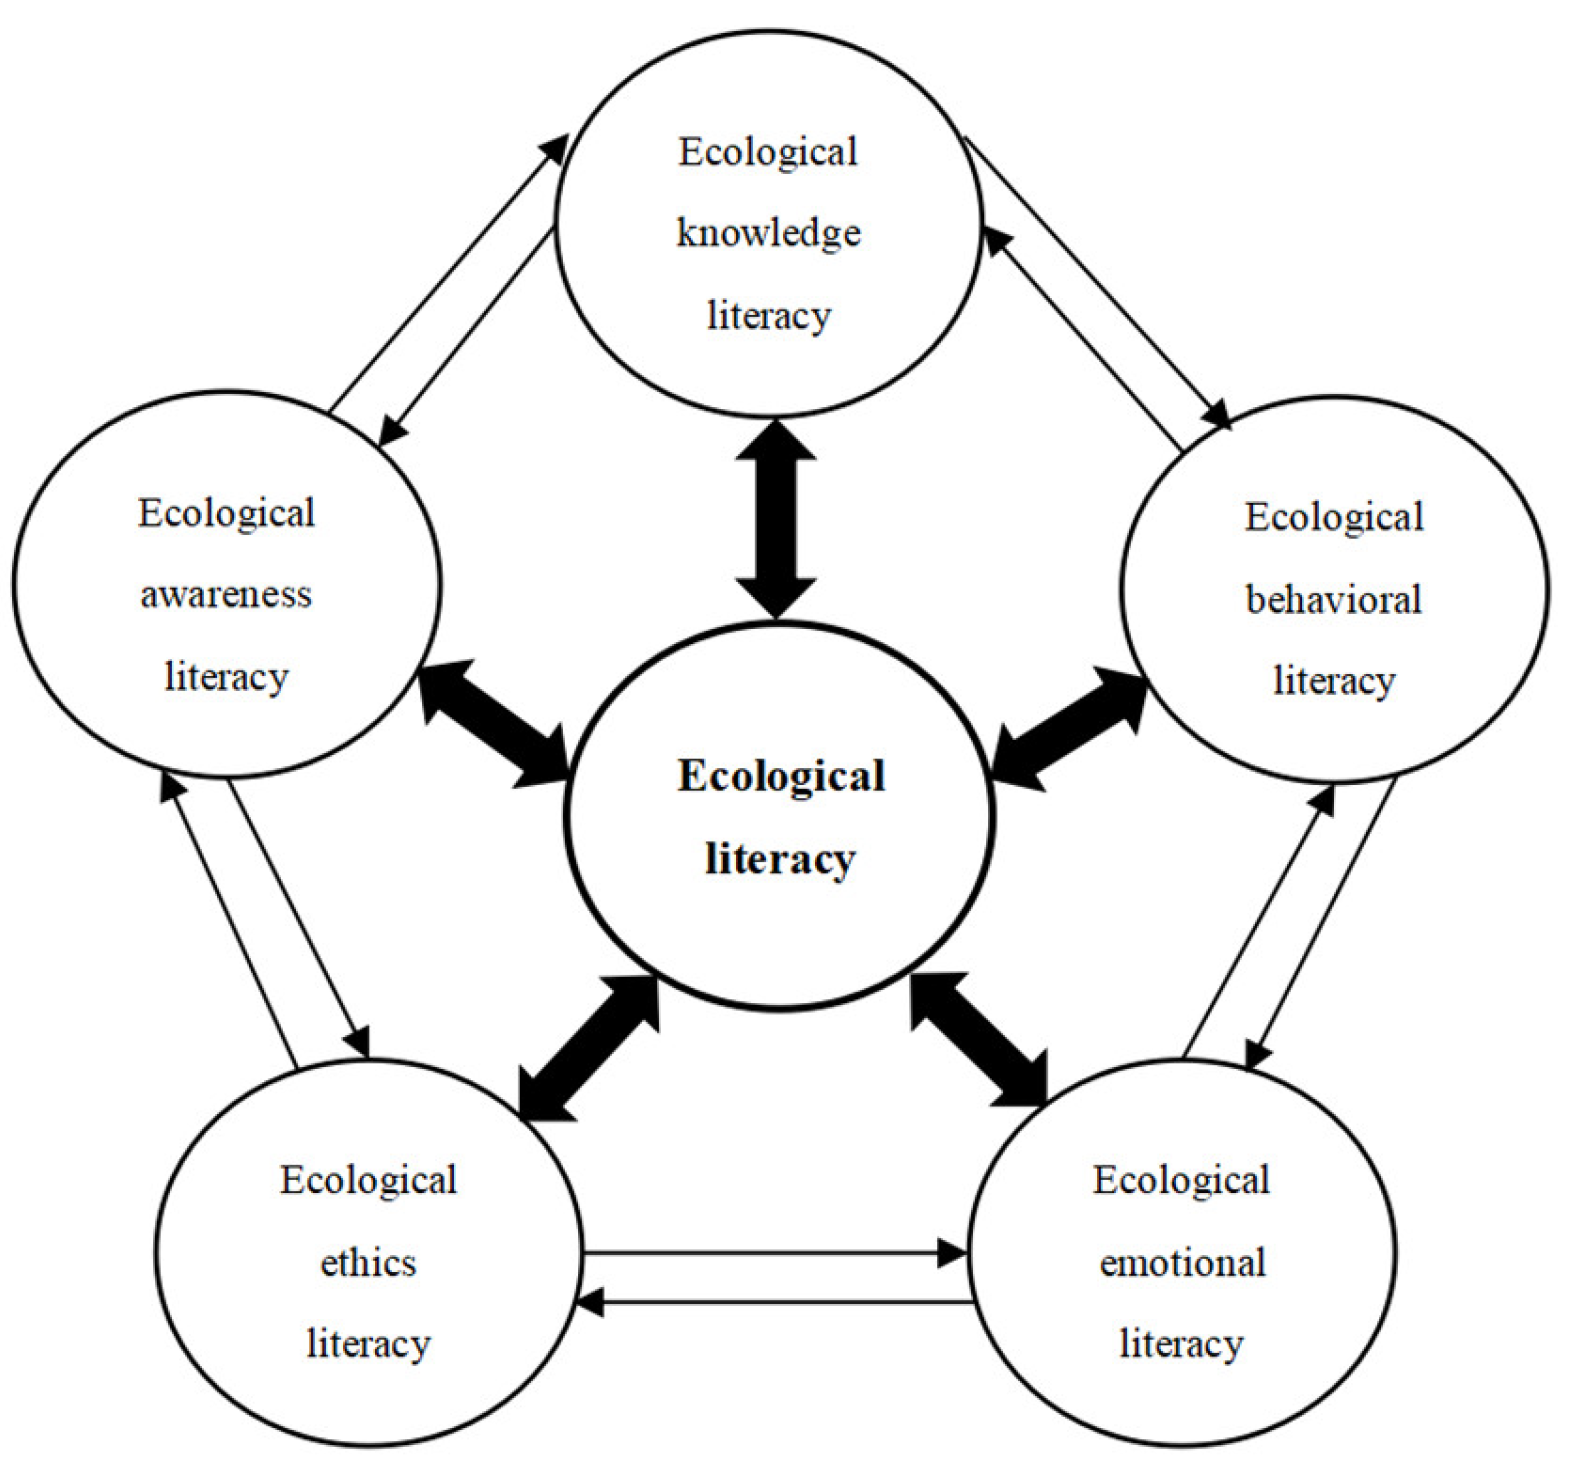
4]. An individual or group with ecoliteracy can show outstanding ability and quality of ecological environmental protection. At the same time, they have to actively maintain great relationships with other countries’ ecosystems on the premise that they have the ability to understand how their own country’s ecosystem works. Specifically, Ha et al. proposed that ecoliteracy includes five dimensions, namely ecological knowledge literacy (EKNL), ecological awareness literacy (EAWL), ecological ethics literacy (EETL), ecological emotional literacy (EEML), and ecological behavioral literacy (EBEL) (
Figure 1) [
4]. Among them, ecological knowledge literacy is foundational; ecological awareness literacy indicates the direction of action; ecological ethics literacy emphasizes moral standards; ecological emotional literacy is the internal driving force; and ecological behavioral literacy is the ultimate goal [
4]. No matter if we approach them at the theoretical or the practical level, each dimension is regarded as an equally important position.
In general, up to now, there are relatively many theoretical studies related to ecoliteracy [
6,
10,
11,
12], but relatively few empirical studies [
4,
13,
14,
15]. At the empirical level, discussions of ecoliteracy in the Chinese context, which is different from the cultural background (the ecological civilization thought of Confucianism and Taoism) of other contexts (i.e., [
4]), or about the inhabitants of ecologically advanced cities are still rare. In the discipline of linguistic ecology, discussing the combination of ecoliteracy level and sociodemographic characteristics (SDCs, see
Section 2.1) is even more lacking [
4,
16]. However, with the development of China’s ecological civilization and the concept of “harmonious coexistence between humans and the natural environment,” inhabitants’ mastery of ecoliteracy has become an important way to strengthen the sustainable development of China’s ecological environment. Therefore, this article focuses on Guiyang City, which is one of China’s top-ten ecologically advanced cities, as the research area, on local inhabitants with different SDCs as the research subjects, and on their ecoliteracy levels as the research focus, using the ecoliteracy level assessment questionnaire we constructed to conduct empirical research [
4]. The two specific research questions guiding this study are: (1) What are the relationships between ecoliteracy and SDCs in the discipline of linguistic ecology? (2) Who are the most ecoliterate inhabitants in the case study of Guiyang City, and why? We analyze and discuss these two research questions in the following three sections.
3. Results
In the results and discussion sections, we first looked at the 11 SDC questions in combination with the overall scores of ecoliteracy and the scores for the five dimensions. However, a careful analysis revealed that Q4–Q6 in the questionnaire were to screen whether the participants met the scope of the investigation. Q10 and Q11 consider family factors, and their influence was not as great as that of personal characteristics. Given the length of this article, we had no room to discuss the results of these two questions in detail. In summary, the six factors discussed in this section are gender, age group, ethnicity, type of living area, educational background, and current main identity.
3.1. Gender
From the results of the independent sample t-test shown in
Table 1 below, it can be seen that there were slightly more male participants (n = 503, 50.91%) than female participants (n = 485, 49.09%). There were significant differences in the OEL scores of Guiyang inhabitants of different genders (
p = 0.003). Further combined with the data, the average score of male participants was higher than that of female participants (male: 161.38 ± 16.822, 80.69%; female: 158.39 ± 15.079, 79.20%). The specific significant differences were mainly reflected in the dimensional scores of EKNL (
p = 0.000) and EBEL (
p = 0.000) of the inhabitants of Guiyang City. Male inhabitants of Guiyang City achieved higher average scores than female inhabitants, both in terms of EKNL (male: 30.75 ± 5.162, 76.88%; female: 28.80 ± 5.160, 72.00%) and EBEL (male: 26.50 ± 5.378, 66.25%; female: 25.17 ± 4.805, 62.93%). The difference in the average scores of EKNL among inhabitants of different genders (1.950) was slightly higher than the difference in the average scores of EBEL (1.328), and the average difference between the two was smaller than the average difference between OEL (2.992).
3.2. Age Group
After comparing the gender differences, this study obtained statistics on the average scores of Guiyang City inhabitants’ ecoliteracy levels among different age groups, mainly to understand the overall role of age factors in the differences in ecoliteracy levels. Then, this study conducted a one-way ANOVA on OEL levels and FDs of inhabitants of different age groups. The specific analysis results were as follows (
Table 2): According to the analysis results shown in
Table 2, there were significant differences in the OEL levels among different age groups (
p = 0.000). Among them, Guiyang inhabitants aged 25–34 years old (165.76 ± 15.433, 82.88%) had the highest OEL scores, and inhabitants under the age of 13 had the lowest scores (147.69 ± 12.163, 73.85%).
There were also significant differences in the levels shown in the five internal dimensions. The significance coefficients of all five dimensions were p = 0.000. Among them, the average scores of Guiyang City inhabitants under the age of 13 for these five dimensions were lower than those of other age groups. Inhabitants aged 35–44 achieved the highest average scores for EKNL and EBEL, and inhabitants aged 25–34 achieved the highest levels of ecoliteracy on the other three dimensions.
At the level of age differences, we also performed post-hoc tests on all factors that we performed the one-way ANOVA on. The test results showed that, regardless of the OEL level or the FDs, there were significant differences between two groups of multiple age groups. We only listed the post-test results that had significant differences in OEL so as to grasp the inhabitants’ ecoliteracy level from an overall perspective.
Specifically, the OEL levels of inhabitants under the age of 13 were significantly lower than those of inhabitants aged 13–18 (p = 0.000), 19–24 (p = 0.000), 25–34 (p = 0.000), 35–44 (p = 0.000), and 45–54 (p = 0.000) years old. The gap among inhabitants 25–34 years old was the largest (18.065), and the gap among inhabitants aged 13–18 was the smallest (10.914). Inhabitants aged 13–18 scored significantly lower than those aged 19–24 (p = 0.033), 25–34 (p = 0.000), 35–44 (p = 0.001), and 55 years old and above (p = 0.000). Inhabitants aged 19–24 scored significantly lower than those aged 25–34 (p = 0.021) but significantly higher than inhabitants aged 55 and above (p = 0.000). Inhabitants aged 25–34 scored significantly higher than those aged 45–54 (p = 0.000) and those aged 55 and above (p = 0.000). The gap between inhabitants aged 55 and above was greater (14.817) than the gap between inhabitants aged 45–54 (6.503). Inhabitants aged 35–44 scored significantly higher than those aged 45–54 (p = 0.006) and inhabitants aged 55 and above (p = 0.000). Finally, the OEL levels of inhabitants aged 45–54 were also significantly higher than those of inhabitants aged 55 and above (p = 0.000).
3.3. Ethnicity
This part of the research mainly explored whether there were significant differences in the OEL levels and the five dimensions among Guiyang City inhabitants of different ethnic groups. First of all, we obtained statistics on the OEL levels of each ethnic group and the average score percentage of the FDs to understand the macroscopic situation of the ecoliteracy levels of different ethnic groups. Then, the inhabitants of Guiyang City were further classified according to ethnicity as factors, and the corresponding OEL and FDs were used as dependent variables to perform a one-way ANOVA. The results show that there were significant differences in the OEL (p = 0.045) among Guiyang City inhabitants of different ethnic groups, which was significantly reflected in the level of EAWL (p = 0.001).
It can be seen from
Table 3 that the OEL levels of Guiyang City inhabitants of different ethnic groups are, from high to low: Buyi (163.77 ± 16.894, 81.89%), Tujia (160.80 ± 16.806, 80.40%), Han (160.41 ± 16.011, 80.21%), Dong (159.31 ± 14.689, 79.66%), other ethnic groups (157.26 ± 18.554, 78.63%), Miao (157.10 ± 14.013, 78.55%), and Yi (155.39 ± 14.731, 77.70%). The ethnic group with the highest score in the EAWL level (Buyi, 34.48 ± 4.073, 86.20%) and the ethnic group with the lowest score (Yi, 31.61 ± 3.500, 79.03%) were consistent with the OEL, but there were some differences among the other ethnic groups.
We also conducted post-hoc tests on inhabitants with the OEL and EAWL levels of ethnic factors. The results regarding the OEL showed that there were only significant differences in the pairwise comparisons between four ethnic groups, and most of the ethnic groups showed no significant differences in the post-hoc tests. Furthermore, the OEL level of the inhabitants of Han ethnicity in Guiyang City was significantly higher than that of the Guiyang City inhabitants of Miao ethnicity (p = 0.044), with an average score difference of 3.314. The Miao inhabitants scored significantly lower than the Buyi inhabitants on their OEL level (p = 0.005), and the average difference between the two was 6.674. The OEL level of the Buyi ethnicity residents of Guiyang City was significantly higher than that of the Yi residents (p = 0.017) and those belonging to other ethnic groups (p = 0.015); the average score difference of the Yi was even greater (8.379), and the average score difference among other ethnic groups was relatively small (6.515).
3.4. Type of Living Area
This subsection mainly discusses whether there were significant differences in the OEL levels and FDs among the inhabitants of Guiyang City from different types of living areas. At the end of 2018, the urban population of Guiyang City was 3,682,400, accounting for 75.43% of the total population. Therefore, in this part of the data, the number of participants belonging to the urban population (n = 653) was greater than the number of participants belonging to the rural population (n = 335), which was basically in line with the actual situation of Guiyang City. Before the independent-sample t-test, this study first created statistics on the average score percentage of this data set and found that the Guiyang inhabitants from different types of living areas had relatively small differences in their OEL levels and FDs. The OEL level of urban inhabitants (160.46 ± 14.548, 80.23%) was slightly higher than that of rural inhabitants (158.85 ± 18.616, 79.43%).
It can be further seen from
Table 4 that inhabitants of different types of living areas in Guiyang City only differed significantly in their levels of EAWL (
p = 0.031), EETL (
p = 0.017), and EEML (
p = 0.037). The levels of these three dimensions among urban inhabitants in Guiyang City were significantly higher than those of rural inhabitants, with the average score differences being 0.630, 0.697, and 0.589, respectively.
3.5. Educational Background
This subsection details the research that mainly explored the differences in the OEL levels and FDs of Guiyang inhabitants who had different educational degrees. First, we obtained a preliminary grasp of the differences through the average score percentage for each factor. Then, a one-way ANOVA was used for a more specific statistical analysis. The analysis results showed that the differences in education levels among the inhabitants of Guiyang City led to significant differences in the OEL levels and the levels of the five dimensions (
Table 5). Their significance coefficients were all
p = 0.000. In terms of the OEL level, the average score of Guiyang inhabitants with primary school or below was the lowest (146.64 ± 14.234, 73.32%), and the average score of Guiyang inhabitants with a doctorate was the highest (178.67 ± 12.567, 89.34%). With an increase in academic qualifications, the OEL level also gradually increased.
With regard to the FDs, Guiyang inhabitants with primary school or below also obtained the lowest average scores. The inhabitants of Guiyang City with a doctorate obtained the highest average scores. However, for the other levels of academic qualifications, the performance of each dimension level fluctuated slightly within a reasonable range of scores. Generally speaking, with an increase in academic qualifications, there was an increasing trend. Only the inhabitants with a master’s degree showed a decline in their levels of EKNL and EBEL, but the decline was small.
After discovering that different educational backgrounds led to significant differences in the OEL levels and FDs, we continued to conduct post-hoc tests on the data on these aspects. The results showed that there were significant differences between the pairwise comparisons of multiple sets of data. We list only the results of OEL levels to understand the overall situation of the ecoliteracy level of the inhabitants in Guiyang City. Among them, the OEL literacy of Guiyang inhabitants with primary school or below was significantly lower than that of inhabitants with the other six education levels, and the gap between inhabitants with a junior high school education was the smallest (3.506), while the gap between inhabitants with a doctorate was the largest (32.029). The OEL level of Guiyang inhabitants with a junior high school education was significantly lower than that of those with a senior high school education (p = 0.000), junior college (p = 0.000), a bachelor’s degree (p = 0.000), a master’s degree (p = 0.000), and a doctorate (p = 0.000). The gap between inhabitants with a senior high school education was the smallest (4.425), and the gap between inhabitants with a doctorate was the largest (28.523). The OEL levels of Guiyang inhabitants with a senior high school education was significantly lower than that of inhabitants with junior college education (p = 0.006), a bachelor’s degree (p = 0.000), a master’s degree (p = 0.000), and a doctorate (p = 0.000). The difference between inhabitants with a junior college education was the smallest (4.453), and the difference between inhabitants with a doctorate was the largest (24.098). The OEL level of Guiyang inhabitants with a junior college education was also significantly lower than that of inhabitants with a bachelor’s degree (p = 0.000), a master’s degree (p = 0.000), and a doctorate (p = 0.000). The level gap between inhabitants with a bachelor’s degree was the smallest (8.183), and the level gap between inhabitants with a doctorate was the largest (19.645). Finally, Guiyang inhabitants with a bachelor’s degree (p = 0.000) or a master’s degree (p = 0.001) had significantly lower levels than those with a doctorate in terms of OEL.
3.6. Current Main Identity
This part first provides a preliminary understanding of the different identities of current Guiyang inhabitants in terms of their OEL levels and average score percentages for the five dimensions. Immediately afterward, it focuses on whether the differences among the different identities of Guiyang inhabitants are significant for OEL levels and FDs. The results of the one-way ANOVA showed that there were significant differences in the OEL levels and FDs of Guiyang inhabitants with different identities (
Table 6). These significance coefficients were all
p = 0.000. Among them, the average scores of the OEL of personnel in the Chinese system (inhabitants who work for the governments or institutions, named government personnel) were the highest (167.00 ± 13.920, 83.50%); the average scores of farmers regarding OEL levels were the lowest (148.11 ± 14.509, 74.06%). At the internal dimension levels, government personnel of Guiyang City obtained the highest average scores on all five dimensions. The farmers of Guiyang City achieved the lowest average scores on the dimensions of EKNL, EETL, EEML, and EBEL; the self-employed achieved the lowest average scores in the level of EAWL. The average scores of several other identities also differed to varying degrees.
After finding that there were significant differences among individuals of different identities, we continued to conduct a post-hoc test on the OEL levels and FDs of Guiyang inhabitants, classified according to their current main identities. Our purpose in doing so was to discover the specific differences between each of the two factors. Here, we only elaborate on the inspection of the OEL level. The results point out that the OEL level of government personnel was significantly higher than that of the other six identity groups, including students (p = 0.000), farmers (p = 0.000), self-employed individuals (p = 0.000), freelancers (p = 0.000), retired employees (p = 0.000), and inhabitants of other identities (p = 0.025). The difference between government personnel and students was the smallest (7.977), and the difference between government personnel and farmers was the largest (18.881). There were also significant differences between the OEL levels of enterprise personnel and students (p = 0.000), farmers (p = 0.000), self-employed individuals (p = 0.000), freelancers (p = 0.000), and retired employees (p = 0.000). The gap between enterprise personnel and students was the smallest (5.121), and the gap between enterprise personnel and farmers was the largest (16.025). The OEL levels of students were significantly higher than those of farmers (p = 0.000), self-employed individuals (p = 0.008), freelancers (p = 0.003), and retired employees (p = 0.001). The difference between students and freelancers was the smallest (5.439), and the difference between students and farmers was the largest (10.904). The OEL levels of farmers were significantly lower than those of freelancers (p = 0.030) and inhabitants of other identities (p = 0.023). The average difference between farmers and these two identities was 5.465 and 9.885, respectively.
4. Discussion
From the results in the previous section, it can be seen that there are significant differences regarding various aspects of multiple SDCs and ecoliteracy levels. Even if there is no statistically significant difference between the factors, there are subtle differences between them. Moreover, the data results clearly show the inhabitants of Guiyang City with the highest level of ecoliteracy and those with the lowest level of ecoliteracy. In this section, we discuss the reasons behind the results detailed in the previous section, focusing on sociodemographic groups with relatively low levels of ecoliteracy and learning from the groups with relatively high SDCs. Finally, we provide suggestions and strategies to improve the ecoliteracy of lower-level inhabitants.
4.1. Gender
The data on the ecoliteracy levels of inhabitants of different genders in Guiyang City presented in this article are consistent with many other related studies [
14,
17,
23]. The difference in the levels of ecoliteracy between genders is relatively complicated, which is related to the difference in the degree of participation of male and female individuals in the natural sciences. Men usually have more opportunities in natural science fields and activities related to science and technology, and the proportion of male inhabitants who actively participate in these studies is generally higher than that of female inhabitants. Women are more involved in the humanities and social sciences and have a greater interest in them; therefore, in the process of studying or working, they usually understand the ecological content indirectly, which has apparent disadvantages compared with directly participating in the discussion of ecological issues.
At the same time, this difference is also related to one’s life background during childhood. Influenced by the traditional culture of China, boys usually gain greater environmental freedom during their growth and receive more encouragement to participate in outdoor activities, while the growth process of girls is restricted in more ways by their parents. Such views have been affirmed to some extent by scholars from other cultural backgrounds, too. Wridt stated that boys are more inclined to go to outdoor entertainment venues or natural scenic spots, while girls are more inclined to go to commercial or living areas [
17,
24]. This makes them gradually different in their acquisition and mastery of ecological knowledge and has a potential impact on their ecological awareness, ecological ethics, ecological emotions, ecological behaviors, and further differences affecting their level of ecoliteracy.
Therefore, the results of this part of the data show that males’ OEL levels are significantly higher than those of females. This is mainly reflected in the EKNL and EBEL levels. In our daily study or work, we should pay greater attention to the levels of ecoliteracy among female inhabitants in Guiyang City, enhance females’ sensitivity to ecological issues, and increase and guide their interests and actions toward participating in ecological activities. Over time, females’ ecological knowledge will increase, and through the combination of ecological awareness and ecological emotions, it will affect their ecological behavior and achieve the improvement of the ecoliteracy levels of female inhabitants of the city.
4.2. Age Group
The results of the data on age groups show that Guiyang inhabitants under the age of 13 have the lowest average scores on OEL, which is quite different from other age groups, but inhabitants aged 55 and above also have relatively low average OEL scores. With the gradual increase in age, the OEL levels of the inhabitants of Guiyang City first increased and then decreased, reaching a peak among inhabitants aged 25–34. This shows that inhabitants under the age of 13 have a limited understanding of the natural world for the time being, and that they are in the initial stage of developing ecoliteracy. Their OEL continuously improves and reaches a better state when they are 25–34 years old. At the same time, inhabitants aged 25–34, as well as other young groups, can also acquire ecological knowledge through various channels, such as school education, outdoor activities, work and life, news media, etc., so as to understand ecological content and continuously deepen their ecoliteracy level. However, everyone’s ecoliteracy is constantly changing. If the cultivation of ecoliteracy is neglected, levels will be reduced. Therefore, after the age of 34 years, attention to ecoliteracy is reduced among inhabitants of Guiyang City due to the increase in life pressure, reduction of free time, unskilled use of the Internet, etc. As a result, they have relatively little understanding of ecoliteracy, so that there is a downward trend in all dimensions regarding the level of ecoliteracy.
Through the cause analysis of age differences, this study found that we must strengthen the emphasis on the ecoliteracy level of the elderly and continue to optimize the ecoliteracy levels of children and adolescents. Among them, special attention should be paid to the learning processes of ecological knowledge among the elderly; their learning channels, such as community activities, presentations of ecological knowledge on bulletin boards, etc., should be broadened, so that they can strengthen their EKNL level in multiple ways. However, this does not mean we should ignore the ecological knowledge of other age groups, especially children and adolescents. Parents should take time to pay attention to their children’s ecological knowledge learning, cooperate with school education, and improve their children’s EKNL levels. When guiding the ecological knowledge of these two age groups, it is necessary to strengthen the transmission of ecological ethics and always remind them to implement internalized ecological knowledge, ecological awareness, ecological ethics, and ecological emotions in real actions. It is worth noting that, theoretically speaking, guides will continue to strengthen their own ecoliteracy in this process and further improve their ecoliteracy level. However, because they are also responsible for managing the ecoliteracy levels of other inhabitants, they have less time to pay attention to themselves. Therefore, the management of the ecoliteracy levels of this segment of the population must not be taken lightly, so that the ecoliteracy of Guiyang City inhabitants of all ages can be steadily moved on the right track.
4.3. Ethnicity
In Guiyang City, a multi-ethnic, ecologically advanced city, inhabitants of different ethnic groups have their own language systems, which are different from Mandarin, and local dialects that are common in Guiyang City. The choice of language reflects people’s cognition of the world. Language actively constructs reality and influences people’s behaviors [
25]. For each ethnic group, their language system and their respective cultural systems work together so that there are differences in the OEL levels among ethnic groups, which is mainly reflected in their EAWL levels.
From a fundamental point of view, the phonetic intonation, syntactic structure, and semantic characteristics of each ethnic language are different. Inhabitants of different ethnic groups have inherent thinking in language expression, which is difficult to change. This largely affects the formation of ecological awareness among inhabitants of different ethnic groups. In the end, their OEL levels are significantly different. For example, through their unique architectural style and farming culture, the Buyi have formed unique ecological thoughts and demonstrated a high level of EAWL. In contrast, the traditional culture of the Tujia also contains ecological phenomena, such as nature worship and totem worship. In these activities, the ecological consciousness of human beings and nature coexisting on an equal footing, as well as their mutual assistance and mutual benefit, are emphasized, and the ecological balance is maintained. They also formed the unique thinking consciousness of Tujia culture and showed a high level of ecoliteracy.
The above example is a manifestation of the language and cultural differences between different ethnic groups in Guiyang City. It can also be seen that the language and cultural background of the local Buyi inhabitants is more conducive to the formation of a high level of ecoliteracy (their average score for OEL level was the highest, with 81.89%). The culture of the local Tujia inhabitants is also conducive to putting their own unique ecological awareness into action and forming a higher level of ecoliteracy (their average score for OEL level was second only to the Buyi inhabitants, with 80.40%). We must use this as a basis when developing local minority cultures, learn from the methods of high-level ecoliteracy inhabitants, and pay greater attention to the Yi and Miao inhabitants, who have relatively low levels of OEL. However, because they live together in an ecologically advanced city, they enjoy the same natural scenery and receive the same education. That is, most of the time, their living environment is similar. This causes the originally completely different ethnic groups to no longer have significant differences in their levels of EKNL, EETL, EEML, and EBEL.
4.4. Type of Living Area
The difference in the OEL levels of Guiyang inhabitants is not obvious between different types of living areas. The reason for this is that, with the acceleration of urbanization, the integration of urban and rural areas in Guiyang City has gradually advanced, which has narrowed the living gap between different types of living areas. Moreover, as a typical mountain city, Guiyang City has unique and diverse natural landscapes, and urban inhabitants still have the opportunity to get close to nature. At the same time, compared with rural areas, urban inhabitants have a better educational environment and have more opportunities to discuss ecological issues. Therefore, the levels of EAWL, EETL, and EEML among urban inhabitants in Guiyang City are higher than those of rural inhabitants, and they have reached a significant level. This situation has also contributed to the relatively high average scores for OEL levels of urban inhabitants, but it has not reached a significant level. In the results of this study, the average scores of urban inhabitants for EKNL (74.35%) and EBEL (64.45%) are slightly lower than those of rural inhabitants (EKNL: 74.68%; EBEL: 64.90%). The main reason for this is the neglect of ecological knowledge and ecological actions by urban inhabitants. Although the difference between EKNL and EBEL levels is not significant, it also shows that the implementation of actions in urban areas of Guiyang City still needs to be improved.
In the process of urban and rural development in Guiyang City, the ecoliteracy of inhabitants can be coordinated. We do not need to separate the ecoliteracy improvement of urban and rural inhabitants but instead need to achieve integration. We should strive to balance the subtle differences between these inhabitant types. While focusing on further implementation of the EKNL and EBEL among urban inhabitants, the EAWL, EETL, and EEML among rural inhabitants should also be taken into consideration, so that the OEL levels of urban and rural inhabitants in Guiyang City can be steadily improved.
4.5. Educational Background
With the improvement of the education levels of Guiyang City inhabitants, their OEL levels and FDs have shown a steady upward trend. There is only a small gap between the average scores of inhabitants with bachelor’s and master’s degrees, and there is a decline in scores at the level of EKNL and EBEL. This really shows the powerful role of education, which affects the level of ecoliteracy of the educated. Guiyang inhabitants with doctorate degrees have the highest OEL levels and FDs, not only because of their high education, but also because of their independent thinking abilities cultivated in the process of scientific research. They usually have strong thinking skills and relatively independent judgments about what they do and think. At present, because of the increase in enrollment in master’s programs, bachelor-educated inhabitants have more opportunities to enter higher education than before in order to receive a master’s-level education. So, there has been a phenomenon in which the average scores of the two situations are not very different, and the difference is not significant in terms of statistical significance. Therefore, when we pay attention to the ecoliteracy levels of inhabitants, we should pay special attention to the strengthening of ecological knowledge and ecological action factors in the education process of master’s programs. These kinds of inhabitants should be encouraged to take their own good ecological knowledge, ecological awareness, ecological ethics, and ecological emotions into action in real life.
From the overall situation of the education level, we should focus on low-educated inhabitants in the cultivation of ecoliteracy. For children and young inhabitants who are receiving school education, they can gradually form a better level of ecoliteracy through classroom education, parental guidance, school environment, and the natural environment through outdoor activities. In this way, they can continue to improve with the increase in their academic qualifications. So, for the low-educated inhabitants who have entered a work position, greater attention should be paid to the cultivation of ecoliteracy. They no longer have the intensive professional education of a school, and their busy work schedules lead them to not have a lot of time to learn about ecological issues. At this time, the publicity of the Internet and community education is particularly important. If we can use a convenient and easy-to-understand method to allow them to coincidentally notice the harm of ecological damage in a very small amount of time or communicate the importance of ecoliteracy to individuals, it will arouse their enthusiasm for their own ecoliteracy management. This improvement process requires the cooperation of the inhabitants of Guiyang City. It is a long-term process that requires us to continue to practice. In addition to managing our own ecoliteracy levels, we strive to contribute to the overall improvement of the population’s ecoliteracy level.
4.6. Current Main Identity
Among the current main identities of Guiyang inhabitants, the reason for the significant differences in the levels of ecoliteracy is the differences in work content. Government personnel obtained the highest scores in the assessment of the OEL level and FDs. Such results are mainly affected by the nature of the industry. In their daily work, they often come into contact with China’s major policies, as well as various laws and regulations. At the same time, they also participate in various social activities. This contains many aspects of ecological civilization, which affects their OEL levels and the content of each dimension. Taking a closer look, the OEL levels and FDs of government personnel are significantly higher than those of student inhabitants. Almost all government personnel have also experienced student time. Students can systematically acquire ecological knowledge and practice ecological behaviors in school, but, after all, there is a lot of pressure to study, so only certain disciplines will pay special attention to ecological issues in a targeted manner, and the implementation of practical behaviors is limited. However, after government personnel and enterprise personnel walk out of campus to work, with the passage of time, their work content is diversified. They pay greater attention to the formation and further accumulation of all aspects of their ecoliteracy, making it significantly different from their previous student time.
Farmers’ levels of OEL, EKNL, EETL, EEML, and EBEL are affected by their education levels, so they lack a sense of the importance of ecoliteracy. They achieved the lowest scores in these parts of ecoliteracy. This means that although they have an ecologically sound living environment, this has not greatly impacted their level of ecoliteracy. The level of EAWL of self-employed inhabitants was lower than that of farmers, and they obtained the lowest scores of any current identity. This group is not only affected by their level of education but also, to a certain extent, by their interests, which affect their level of ecoliteracy, especially the EAWL level.
On the whole, from the perspective of current main identity, we have to pay special attention to the ecoliteracy level of farmers in Guiyang City. It is necessary to enable them to acquire ecological knowledge through publicity and gradually lead them to realize the importance of ecoliteracy. In addition, they must be urged to realize the ecological value of the rural living environment itself and then put it into practice. Secondly, with regard to the ecoliteracy of self-employed inhabitants, it is necessary to appropriately adjust their interests, so that while paying attention to their interests, they can take the ecological environment into account, care about their own ecoliteracy levels, and consciously improve themselves.
5. Conclusions
There are many ways to organize ecological concepts and basic principles [
2,
26,
27]. Research on ecoliteracy reflects the ecological concepts that are fundamental to it and attempts to improve ecoliteracy through these concepts. In a previous study, we developed an effective way to quantitatively assess ecoliteracy from the interdisciplinary perspective of linguistic ecology and conducted an empirical study using Guiyang inhabitants as an example [
4]. However, among Guiyang inhabitants, different SDCs affect their own objective conditions, study or life experiences, work content, etc., which have a significant effect on their levels of ecoliteracy. Therefore, in this research, we focus on the differences in the levels of ecoliteracy among inhabitants of Guiyang City with different SDCs.
Our research results emphasize that the levels of ecoliteracy among Guiyang inhabitants show significant differences for multiple SDCs. In response to all of the above differences, we have proposed ways to improve low levels of ecoliteracy among certain groups of inhabitants. In summarizing this research, it is found that the promotion strategy that affects each sociodemographic factor is inseparable from education in the final analysis. The education we emphasize here is not only education in the narrow sense of education received in school, it is, rather, education in a broader sense, based on the discipline of linguistic ecology [
28]. This also includes outdoor practice education, network publicity education, family education, and other aspects of ecology-related education activities.
Here, this article considers an example from Chapter One of
Silent Spring [
29] to briefly illustrate the above conclusion. Carson responded to the damage caused by the release of chemicals into the environment. She used a series of linguistic expressions (i.e., “strange blight crept”, “mysterious maladies”, “a spring without voices”) to arouse people’s attention and reflection on environmental issues [
5]. This example reflects the ecological significance of language. Such textual materials can be obtained in schools, families, and even online media. It allows us to reflect on humans’ ecological behavior and gradually internalize them into our own ecoliteracy.
In addition, for a city, the ultimate goal of improving inhabitants’ ecoliteracy level is to promote the sustainable development of the city. He et al. integrated the measures of sustainable development of different cities and advocated that they should pay attention to the long-term evolution, technical guidelines/standards, governmental support, extensive implementation, and good popularity of cities [
30]. We encourage each of the above-mentioned aspects to take into account the inhabitants’ ecoliteracy level in this process, for example, to achieve sustainable urban development through incentives for low-carbon behavior and strengthening cooperation with ecologically advanced cities.
Although this study combines a number of SDCs for discussion, it cannot cover all factors, such as family environmental factors, social environmental factors, etc. It hints at the inherent limitations of this study. In the next stage of research, we will continue to focus on other SDCs of Guiyang inhabitants and extend the study further to focus on other types of factors (i.e., lifestyle characteristics) to explore their differences. It is worth mentioning that this study is an effective way to assess individuals’ levels of ecoliteracy, but it is not the only way. If we approach the topic from other aspects of linguistic ecology, or even other branches of ecology, we may obtain different results. This is what we need to gradually improve.


