Abstract
Whether environmental impacts, natural capital depreciation, and effective governance have impacted progress in emerging market and developing economies (EMDEs) to achieving the 17 Sustainable Development Goals (SDGs) of the UN Agenda 2030 has become a significant policy topic. We determine estimates of the changes in net welfare that indicate progress over 2000–2019 in terms of meeting the 17 SDGs for 99 EMDEs. We compare these estimates with the environmental impacts associated with SDGs 11–15, natural resource depletion as a share of national income, and average institutional quality. Net SDG welfare gains over 2000–2019 were often accompanied by adverse environmental impacts, natural capital depletion, and poor-quality institutions. This is especially the case for low- and lower-middle-income economies. Higher net SDG welfare gains are correlated with reduced losses associated with SDGS 11–15, and larger welfare gains from attaining SDG 1 No Poverty are associated with better governance. These results suggest that long-term progress towards the SDGs in EMDEs hinges on improved management of natural capital and the environment, as well as more effective governance. Three policies can be implemented to achieve these objectives without additional financing or imposing fiscal burdens: fossil fuel subsidy swaps, tropical carbon taxes, and improved management and distribution of resource revenues.
1. Introduction
An increasingly important issue for policy makers is whether progress in emerging market and developing economies in terms of achieving the 17 Sustainable Development Goals (SDGs) of the UN Agenda 2030 requires better management of natural capital and the environment as well as good institutions and governance.
In recent decades, global economic development has adversely impacted the biosphere. Since 1970, trends in bioenergy production, freshwater withdrawals, agricultural production, fish harvesting, and the extraction of materials have risen, in response to increasing demand from population and income growth [1,2,3]. During this time, the human population worldwide has more than doubled (from 3.7 to 7.6 billion), and gross domestic product per capita is four times greater. This has served to magnify the environmental impact of consumption and production worldwide [3]. The growth of carbon dioxide emissions, energy use, and fisheries production has been even greater than the doubling of global population [1].
Such environmental impacts have been especially prevalent in emerging market and developing economies, many of which are in tropical zones. The primary drivers of tropical land use change, habitat destruction, and biodiversity loss are the ongoing demand for agricultural production, mining, and timber in these regions [1,2]. Consequently, natural forests in tropical regions have declined by 15% since 1990 [4]. During this period, we have also experienced a decrease of 70% in the populations of mammals, fish, birds, amphibians, and reptiles [5]. Fisheries production has nearly tripled over the past several decades, which is a major reason why marine life is so highly threatened. Over 33% of fish stocks are now overfished, up to 50% of vulnerable marine habitats have been lost, and a significant portion of the coastal ocean is degraded by pollution, eutrophication, oxygen depletion, and is stressed by ocean warming [6].
Economic studies have shown that good institutions and governance are important to long-run economic development [7,8,9,10,11,12,13,14,15,16,17,18]. Although it has been difficult to establish the causality of the relationship between strong institutions and long-run economic development [8], the premise that economic progress and effective institutions and governance go hand-in-hand is rarely questioned. However, to date, little attention has been paid to whether better institutional quality has helped or hindered overall progress towards the 17 SDGs of UN Agenda 2030.
The concept of institutional quality is broad. It refers to law, the provision of government regulation and services, and the rights of individuals. A decline or collapse in these attributes undermines and reduces the effectiveness of the institutional framework that supports economic development. Recent evidence also shows that well established and functioning institutions and governance are critical to achieving the sustainable development goals that are important to emerging market and developing economies, in particular reducing extreme poverty [19]. Yet, institutional attributes are not well-represented in the 17 SDGs. Only one of the goals, SDG 16 Peace, Justice, and Strong Institutions, relates to institutional quality. Furthermore, the 23 indicators identified by the by the UN to track progress towards SDG 16 focus less on broader measures of institutional quality and governance, but instead focus on more specific targets such as reducing violence, conflict, and political instability [20]. Clearly, peace and political stability are essential to sustainable development in emerging market and developing economies, but progress towards all 17 SDGs will also require effective government, enforcing the rule of law, reducing unnecessary regulation, establishing accountability, and controlling and voicing against corruption [21].
To explore these issues further, we estimate the changes in net welfare that reflect progress from 2000 to 2019 towards the 17 SDGs for 99 emerging market and developing economies (EMDEs). These overall net SDG impacts are then compared with two different measures of environmental and natural capital changes for these economies, the net environmental impacts associated with SDGs 11–15, and natural resource depletion as a share of national income, and with one institutional quality measure derived from the World Bank’s Worldwide Governance Indicators (WGI) [22].
The welfare analysis of progress towards the 17 SDGs is based on the approach that we have developed previously [23,24]. Applying this method for a new and updated analysis of our sample of 99 EMDEs reveals that over 2000 to 2019 there were per capita welfare gains in most economies in line with SDG 1 No Poverty. In addition, welfare gains exceeded losses for most other goals, so overall net SDG welfare gains were generally even larger. However, several of the largest losses in per capital welfare over 2000–2019 occurred from the lack of progress in achieving the five environmental goals, SDGs 11–15. These goals cover a broad range of environmental targets, such as controlling greenhouse gas emissions, particulate matter and other pollutants, managing forests and other terrestrial ecosystems, and improving ocean and coastal habitats. This failure to make progress on the environmental goals raises concerns about the environmentally harmful nature of global development during this period.
Since 2000, development in the 99 EMDEs has also been accompanied by significant depletion of natural capital. Natural resource depletion as a share of national income measures how much natural capital is used up to produce the total value of goods and services of an economy. Averaged over 2000–2019, this rate of depletion was also considerable in the 99 EMDEs. On average, it is much higher for low-income economies than middle-income countries.
The measure of institutional quality based on the World Bank’s Worldwide Governance Indicators (WGI) includes an indicator representing political stability and absence of violence, as well as indicators for rule of law, government effectiveness, control of corruption, regulatory quality, voice, and accountability. We use the WGI to construct an overall indicator of institutional quality. For the 99 EMDEs, we find that the average level of institutional quality over 2000–2019 is less in low-income compared to middle-income countries. In addition, in the entire sample, institutional quality is positively correlated with the per capita welfare gains associated with SDG 1 No Poverty.
The results of this new and innovative contribution to the existing literature suggest that long-term progress towards the SDGs will hinge on better management of natural capital and the environment in emerging market and developing economies. Ineffective institutions are also associated with a lack of progress towards the SDGs in poorer economies. An important implication is that the failure to improve both governance and environmental management may be constraining the progress on sustainable development and long-term welfare improvements in many EMDEs. More policies need to be targeted directly towards overcoming such constraints if we are to make progress on achieving sustainable development, especially in poorer economies.
2. Materials and Methods
Our analysis is applied to 99 emerging market and developing economies (EMDEs) over 2000–2019. The term “emerging market and developing economies” refers to low- and middle-income countries and is based on the World Bank’s classification of countries by income [25]. The World Bank categorizes economies among income groups using 2021 gross national income (GNI) per capita. The groups are divided into low-income economies, USD 1085 per capita or less; lower-middle-income economies, USD 1086 to 4255 per capita; and upper-middle-income economies, USD 4256 to 13,205 per capita.
Our assessment of progress towards the 17 SDGs over 2000–2019 for the 99 EMDEs is based on the approach previously developed by Barbier and Burgess (2019 and 2021). The overall objective is to estimate the welfare gains from achieving one SDG while also taking into account interactions in achieving other SDGs. The approach uses standard economic methods applied to measuring the welfare effects that occur from changes in imposed quantities [26,27]. This allows estimation, in dollar terms, of the “willingness to pay” by a representative individual for an improvement in one SDG indicator, at the same time as considering any positive or negative changes in other SDG indicators. The rationale for such an approach is that several assessments have shown that there has been considerable country level variation in attaining the SDGs, and that progress in attaining any individual goal may have contributed to the reduction (or increase) of progress in other goals [23,24,28,29,30,31,32,33].
To conduct the welfare analysis, we chose a representative indicator for which reliable data is available for each of the 17 SDGs. As far as possible, we have selected the primary indicator recommended by the United Nations in their tier classification of the global SDG indicators [34]. One important requirement of the chosen indicators is that the data is broadly available for all 99 EMDEs and over the period 2000 to 2019. Therefore, when there is insufficient data for the preferred primary indicator, we chose the next best indicator for which data is available as recommended by the United Nations tier classification [34]. All indicators are sourced from [35], except for political stability and absence of violence/terrorism, which is from [22]. In Table 1, we summarize the 17 SDGs and the indicators that have been selected to measure progress towards each goal. For the purposes of the analysis, SDG 1 No Poverty is chosen as the benchmark indicator.

Table 1.
The 17 SDGs and their indicators for assessing progress.
The analysis involves estimating the change in per capita welfare that results from any reduction in poverty rates between 2000 to 2019. This change in per capita welfare is then adjusting to take account of any gains (or losses) that may arise at the same time from progress towards (or retreat from) achieving the other 16 SDGs. Full information on the underlying methodology can be found in [23,24]. Here, the main steps are briefly outlined.
Using the indicators listed in Table 1, the initial step is to assess the change in each indicator level associated with a goal for the 99 EMDEs. The actual changes in value of each indicator’s original units over the period from 2000 to 2019 are translated into percentage change in these values over this period. The percentage change is constructed so that a positive value represents an improvement (gain) in attaining an SDG whereas a negative value represents a decline (loss). For example, in Colombia, the poverty rate in the population declined from 17.5% in 2000 to 5.3% in 2019. As this represents a fall of −69.7% in the poverty rate, it is a positive improvement in achieving SDG 1 No Poverty. In the quantitative assessment, this translates to a gain of 69.7% in the indicator level to show improved progress over 2000–2019 in attaining SDG 1. Note that for two indicators averages over the period are used to show changes: for SDG 8, the average annual % growth over 2000–2019 in adjusted net national income (ANNI) per capita, and for SDG 12, the average over 2000–2019 of adjusted net savings as a % of GNI. For Colombia, ANNI per capita growth averaged 2.8% and adjusted net savings averaged 3.3% of GNI over 2000–2019; consequently, there was a 2.8% and 3.3% gain towards SDG 8 and SDG 12, respectively, over this period.
The second step is to transform the indicator changes into a measure of willingness to pay for any improvement or decline using a numeraire measure of income for the average individual in each country. The numeraire chosen is the adjusted net national income (ANNI) per capita (constant USD 2015 ) in 2000, which is available from [35]. ANNI per capita serves as a proxy for the (Hicksian) income that is necessary to compensate the average individual in a EMDE for a change in the level of an indicator for any SDG. As shown by [36], a measure of the sustainable income generated each year by the economy is given by the national income after accounting for the net depreciation of an economy’s natural, human, and produced capital. Using ANNI per capita in 2000 as the numeraire essentially assumes that an individual would be willing to pay USD 1 of this sustainable income to benefit from a 1% improvement in the indicator for any SDG, or alternatively willing to accept USD 1 of sustainable income to compensate for a 1% decline in an SDG indicator.
For each of the 99 EMDEs, this two-step approach is used to estimate the welfare gain or loss of progress over 2000–2019 in achieving SDG 1 No Poverty (henceforth called SDG 1 welfare impact), the net welfare gains or loss in achieving all 17 SDGs (net SDG welfare impact). For example, for Colombia, we estimate that there is a positive SDG 1 welfare impact from 2000–2019 of USD 2103 per person, and a net SDG welfare impact of USD 10,858 (Table A1).
Next, we compare the measures of SDG 1 and net welfare impacts with two different measures of environmental and natural capital changes for the 99 EMDEs over 2000 to 2019.
The first measure is the net welfare gain or loss associated with the environmental goals SDGs 11–15 (Table 1) for each country over 2000–2019. We henceforth refer to this outcome as the net environmental impact.
The second measure is the average rate of natural resource depletion over 2000–2019 for each EMDE, which is available from the World Development Indicators [35]. The World Bank’s rate of natural resource depletion is expressed as a percentage share of the gross national income (GNI) of an economy. It is an attempt to measure the depreciation, in value terms, of key mainly marketed natural resources used in production. Thus, the World Bank’s measure of natural resources depletion is the sum of mineral depletion, energy depletion and net forest depletion. Mineral depletion is given as the ratio of the value of the stock of mineral resources to the remaining reserve lifetime (which is capped at 25 years). This measure covers gold, tin, zinc, lead, copper, iron, silver, nickel, bauxite, and phosphate. Energy depletion is given as the ratio of the value of the stock of energy resources to the remaining reserve lifetime (which is capped at 25 years). This measure covers coal, crude oil, and natural gas. Net forest depletion is given as the unit resource rents multiplied by the excess of roundwood harvest over natural growth. Averaged over 2000–2019, the rate of natural resources depletion gives an indication of how quickly an economy is depleting its key natural resources relative to the GNI produced each year over this period.
In addition, we compare the measures of SDG 1 and net welfare impacts with an indicator of institutional quality for the 99 EMDEs averaged over 2000 to 2019. We construct this indicator from the World Bank’s Worldwide Governance Indicators (WGI) [22]. There are six measures of institutional quality and governance in the WGI. The first measure includes political stability and the absence of violence and terrorism. This reflects perceptions of the likelihood of politically motivated violence, including terrorism, and political instability. The second measure focusses on the control of corruption. This reflects perceptions of the extent to which public power is used for private gain, which includes grand and petty forms of corruption, and also reflects the “capture” of the state by elites and private interests. The third measure reflects government effectiveness. This indicates perceptions of the quality of the civil service, the quality of public services, and the degree of its independence from political pressures, the quality of policy designs and implementation, and the commitment of the government to enforcing such policies. The fourth measure covers regulatory quality. This reflects perceptions of the ability of the government to formulate and implement sound policies, including policies that permit and promote private sector development. The fifth measure looks at rule of law. This captures perceptions of the extent to which individuals have confidence in and abide by the rules of society. This particularly applies to the quality of enforcement of contracts, property rights, the police, the courts, and the likelihood of violence and crime. The sixth measure covers voice and accountability. This reflects perceptions of the extent to which a country’s citizens can participate in choosing their government, in addition to having freedom of expression and association, and a free media [22].
Each of the six institutional and governance measures in the WGI are scaled, with the highest value at 2.5 and the lowest value at −2.5. The database includes over 200 countries and covers the period from 1996 to 2021. In order to derive our measure of institutional quality, we determine an average of the six measures in the WGI (rescaled from the lowest value 0 to highest value 5) from 2000 to 2019 for the 99 EMDEs.
3. Results
Table A1 reports our estimates off the SDG 1 welfare impact, the net SDG welfare impact, the net environmental impact, average rate of natural resource depletion, and the average institutional quality over 2000–2019 for each of the 99 EMDEs. Table 2 summarizes these outcomes averaged for all 99 EMDEs, the 21 low-income economies, the 45 lower-middle-income countries and the 33 upper-middle-income economies.
Table 2.
Summary of SDG welfare, environmental, natural capital and institutional quality outcomes, 2000–2019.
3.1. SDG Welfare Impacts
Table 2 indicates that, on average across all 99 EMDEs over 2000–2019, there was a significant welfare gain of USD 1258 per person associated with poverty reduction (i.e., progress towards achieving SDG 1). All upper-middle-income countries reduced poverty and attained positive SDG 1 welfare impacts, which amounted to USD 2863 per capita on average for these economies. In lower-middle-income countries, the gain was just USD 624 per person, and in low-income economies, USD 96 per capita. Four low-income economies (Madagascar, Malawi, South Sudan, and Zambia) and six lower middle-income economies (Angola, Comoros, Egypt, Indonesia, Iran, and Zimbabwe) failed to reduce poverty over 2000–2019, thus yielding welfare losses associated with progress towards SDG 1 (Table A1).
The net SDG welfare impact measures the overall welfare gain or loss in achieving all 17 SDGs over 2000–2019. As Table 2 indicates, this impact also varies by income group among the 99 EMDEs. On average across these economies, the estimated per capita net welfare benefit from making progress towards the 17 SDGs amounted to USD 2707 per person. The per capita net welfare gain was USD 4565 on average for the 33 upper-middle-income economies, but only USD 1710 for the 45 lower-middle-income countries and USD 1923 for the 21 low-income countries. Thus, as a group, over 2000–2019 upper-middle-income economies achieved almost three times the welfare gains through progress towards the 17 SDGs compared to low and lower-middle-income economies. However, within these income groupings, 7 low-income countries, 15 lower-middle-income countries, and 10 upper-middle-income countries experienced negative net SDG welfare changes, reflecting negative progress overall towards the 17 SDGs (Table A1).
3.2. Net Environmental Impacts
The net environmental impact measures the welfare gain or loss of progress towards achieving the five environmental goals SDGs 11–15 listed in Table 1. Over 2000–2019, only 12 of the 99 EMDEs registered positive net environmental impacts (Table A1). These include eight upper-middle-income economies (Argentina, Colombia, Costa Rica, Gabon, Jamaica, South Africa, Tonga, and Thailand), and four lower-middle-income countries (Indonesia, Mongolia, Ukraine, and Vanuatu). All 21 low-income economies have negative net environmental impacts (Table A1).
The average estimates for all countries and income groups summarized in Table 2 suggest that net environmental impacts have a significant influence on the net SDG welfare impacts. To see this influence more clearly, Figure 1 compares the average SDG 1 and net SDG welfare impacts with net environmental impacts for all countries and income groups.
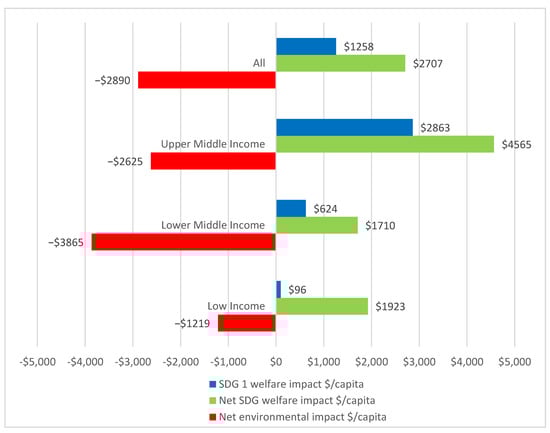
Figure 1.
This figure compares the average SDG 1 welfare impacts, the net SDG welfare impacts and the net environmental impacts over 2000–2019 from Table 2 for all 99 EMDEs, the 21 low-income countries, the 45 lower-middle-income countries, and the 33 upper-middle-income countries.
Over the period of 2000 to 2019, the net environmental impacts per capita were USD −2890 on average for all 99 economies, USD −2625 for upper-middle-income economies, USD −3865 for lower-middle-income countries, and USD −1219 for low-income countries (Figure 1). These environmental losses are more than half the overall net SDG welfare gains from progress towards the 17 SDGs for upper-middle-income economies, over 60% of the welfare gains for low-income countries, and more than two times the net SDG welfare gains for lower-middle-income economies. Averaged across all 99 EMDEs, negative net environmental impacts (USD −2890/person) match net SDG welfare gains (USD 2707/person), which suggests that if these environmental losses were eliminated, then overall net SDG welfare gains from progress towards the 17 SDGs would have doubled over 2000–2019.
Figure 2 depicts the pairwise comparison between net environmental and SDG welfare impacts over 2000 to 2019 for the 99 EMDEs. The figure shows that net SDG welfare impacts are correlated (r = 0.51) with net environmental impacts. In our analysis, we provide the Pearson correlation coefficient, r, which reflects the extent of a linear relationship between two continuous variables and is based on the raw data. This is preferred to the Spearman correlation which evaluates the monotonic relationship based on the ranked values for each variable. Countries with lower environmental losses over this period tended to have higher SDG welfare gains. Among the 12 EMDEs with positive net environmental impacts, only Indonesia, Jamaica, and Vanuatu also have net SDG welfare losses from 2000 to 2019.
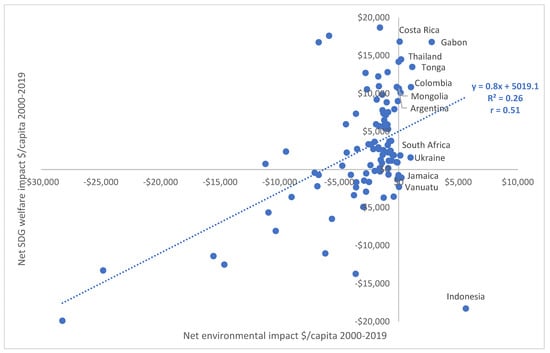
Figure 2.
This figure plots the pairwise estimates of net environmental impact and net SDG welfare impact over 2000–2019 for each of the 99 EMDEs (Table A1). The dotted line is the regression across these estimates, with the estimated equation and its goodness of fit (R2) depicted. These estimates have a positive correlation of 0.51. The 12 countries with positive net environmental impacts are also indicated.
In sum, for most EMDEs, it appears that any overall welfare gains from progress towards the SDGs over 2000–2019 are overshadowed by the considerable losses associated with SDGs 11–15. These goals cover a broad range of environmental targets, such as controlling greenhouse gas emissions, particulate matter and other pollutants, managing forests and other terrestrial ecosystems and improving ocean and coastal habitats. Thus, progress for many EMDEs over the past two decades in fulfilling Agenda 2030 has come largely at the expense of the environment. Moreover, those EMDEs that experienced overall net SDG welfare losses over 2000–2019 display some of the highest losses with respect to SDGs 11–15 (Figure 1 and Table A1). That is, environmental impacts are becoming so large and widespread in some EMDEs that their populations are becoming significantly worse off, not better off, from economic development. Long-term progress towards the SDGs will depend on improved management of the environment in these economies.
3.3. Natural Capital Depreciation
Many of the adverse environmental impacts experienced by a country, such as greenhouse gas emissions, air pollution, forest and biodiversity loss, and deteriorating marine environments, are related to the depletion of key natural resources used up by economic activities. These include depletion of energy, mineral, and forest resources. Consequently, average natural resource depletion (% GNI) over 2000–2019 gives an indication of how quickly each of the 99 EMDEs is depleting its key natural resources relative to the gross national income produced each year over this period.
Among the 99 EMDEs, poorer countries display the highest rates of natural resource depletion (Table 2). Over 2000–2019 average natural resource depletion as a share of GNI was 9.9% in low-income countries, 4.8% in lower middle-income economies, and 2.8% in upper middle-income countries. Across all 99 EMDEs, the average was 4.0%.
In addition, four countries with a positive net SDG welfare impact over 2000–2019 had average rates of natural resource depletion greater than 10% of GNI. These countries are Ethiopia, Ghana, Kazakhstan, and Uganda (Table A1). Another four countries have positive net SDG and SDG 1 welfare impacts but also experience average rates of natural resource depletion greater than 20%. These countries are Angola, Burundi, Gabon, and Timor-Leste (Table A1).
In sum, high rates of natural resource depletion should be a concern for many EMDEs. The substantial rate of natural capital depreciation in low-income and lower middle-income economies is especially worrisome, given that many of them depend significantly on natural resources for development and have scarce human and produced capital. However, it is also disconcerting that many EMDEs that appear to have a positive net SDG welfare impact over 2000–2019, including gains in attaining SDG1 No Poverty, have done so through substantial natural capital depreciation.
3.4. Institutional Quality
Our indicator of institutional quality is the average of the six Worldwide Governance Indicators (WGI) (i.e., control of corruption, political stability and absence of violence/terrorism, government effectiveness, rule of law, regulatory quality, and voice and accountability) during the period from 2000–2019 [22]. These indicators and average institutional quality have been rescaled from 0 (which reflects lowest quality) to 5 (which reflects highest quality).
Table 2 shows that, among the 99 EMDEs, poor countries tend to have lower institutional quality. Over 2000–2019, average institutional quality was 1.6 for low-income countries, 1.9 in lower middle-income economies, and 2.3 in upper-income countries. Across all 99 EMDEs, the average was 2.0.
In addition, there appears to be an association between our indicator of institutional quality and the welfare gains associated with attaining SDG 1 No Poverty. Figure 3 depicts the pairwise comparison between institutional quality and SDG 1 welfare impacts over 2000 to 2019 for the 99 EMDEs. The figure shows that SDG 1 welfare impacts are correlated (r = 0.51) with institutional quality. Countries with better institutions and governance over this period tended to have higher SDG welfare gains. Only three countries with institutional quality greater than 2.0 (the mean across all 99 EMDEs) failed to have a positive SDG welfare impact over 2000–2019. These countries are Indonesia, Malawi, and Zambia (Table A1).
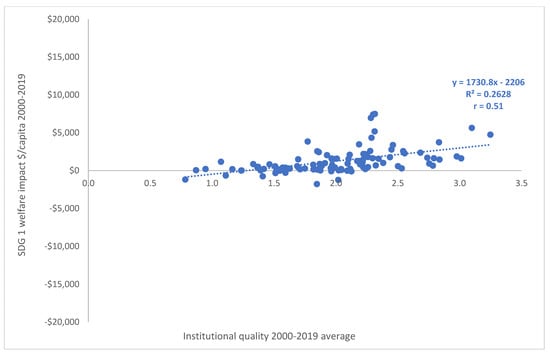
Figure 3.
This figure plots the pairwise estimates of average institutional quality and SDG 1 welfare impact over 2000–2019 for each of the 99 EMDEs (Table A1). The dotted line is the regression across these estimates, with the estimated equation and its goodness of fit (R2) depicted. These estimates have a positive correlation of 0.51.
In sum, progress towards thee 17 Sustainable Development Goals, and especially SDG 1 No Poverty, appears to be associated with better institutions and governance across the emerging market and developing economies. Particularly worrisome is that low- and lower- middle-income countries as a group appear to have both lower levels of institutional quality as well as lower per capita welfare gains from progress towards SDG 1 and the other goals (Table 2).
4. Discussion
These results suggest that the inability to improve environmental management, natural capital use and institutions and governance may be constraining the sustainable development and long-term welfare improvements of many EMDEs, especially low- and lower-middle-income economies.
For most EMDEs, it appears that the overall welfare gains from progress towards the SDGs over 2000–2019 are overshadowed by the considerable losses associated with the failure to control greenhouse gas emissions, reduce particulate matter and other pollutants, manage forests and other terrestrial ecosystems, and improve ocean and coastal habitats. For some EMDEs, the welfare losses associated with various environmental impacts are becoming so large and widespread that their populations are becoming significantly worse off, not better off, from economic development. Other assessments have also found similar tradeoffs between the environmental goals (SDGs 11–15) and other SDGs [23,24,28,29,30,31,32,33].
Many EMDEs are also experiencing high rates of natural resource depletion, which is especially the case for low-income and lower-middle-income countries. In addition to this, many EMDEs that appear to have a positive net SDG welfare impact over 2000–2019, including gains in attaining SDG1 No Poverty, have done so through substantial natural capital depreciation. Long-term progress towards the SDGs in EMDEs will depend both on improved management of its key sources of natural capital essential for development, such as energy, mineral, and forest resources.
In addition, there could be a problem for economies that are experiencing rapid declines in their natural capital, regardless of whether their net SDG welfare impact is positive. In contrast to human capital and produced capital that can be enhanced by investment activity over time, an economy’s endowment of natural resources is often depleted more quickly than it is replenished, either through human efforts or natural regeneration. Consequently, whilst human capital and produced capital may be rising over time, the stock of natural capital typically falls. Furthermore, some types of natural capital may be uncertain in value, irreversible if lost, and have an essential role. Therefore, for economies experiencing significant depreciation in natural capital, attaining the sustainability criterion of non-declining per capita welfare may be put at risk. High rates of natural capital depletion may undermine long-term progress towards the SDGs as poorer economies may have difficulty in accumulating sufficient human and produced capital to keep their overall inclusive wealth from declining.
However, there is another concern. Average rates of depletion based solely on energy, mineral, and forest resources are likely to underestimate considerably the depreciation of natural capital, as it excludes ecological capital, such as marine and terrestrial ecosystem loss and damages, and other significant environmental impacts. Changes in land use, the destruction of habitat, the decline of oceans and coasts, and the loss of biodiversity are mainly caused by the increasing demand for mining, agricultural production, ocean extraction, and timber harvesting in EMDEs, especially in tropical regions [1,2,3,4,5,6]. Thus, the true natural and ecological depreciation costs of progress towards the SDGs in the 99 EMDEs are likely to be even larger than estimated here.
Our results also provide important evidence that supports the perspective that institutional effectiveness and good governance are critical for successful sustainable development in the long term [7,8,9,10,11,12,13,14,15,16,17,18,19,21]. Economic progress, sustainability, and enhancements in institutional quality appear to go hand-in-hand in a beneficial synergistic relationship. However, there may be a time lag until the impacts of investments in improved institutional quality and environmental management are reflected in the SDGs performance. For example, the benefits of adopting, implementing, and acquiring certification from the International Organization for Standardization (ISO) 9001 quality management system (QMS) may take time to materialize [37]. Unfortunately, low and lower middle-income economies appear to be experiencing both low levels of institutional quality and a lack of progress towards attaining the 17 SDGs. For these poorer countries, the failure to make significant progress towards environmental sustainability and the strengthening of governance may create a chronic problem that undermines sustainable development and improvements in economic welfare in the future. As our results show, even progress towards SDG 1 No Poverty seem to hinge on better institutions and governance in EMDEs.
Although our study provides evidence in support of the argument that long-term progress towards the SDGs may be associated with improved institutional quality, this association does not necessarily imply that “the causality runs from institutions to economic development, ignoring the important possibility that economic development changes institutions” [8], p. 476. Additional country-level data and more studies are required to statistically analyze the relationship between changes in net welfare and the quality of institutions. Such research can help to determine whether improved institutions and governance can induce better progress towards sustainability, as reflected in the 17 SDGs, especially in poorer countries. As our study shows, this is a rich and important topic that is worthy of further research.
5. Conclusions
Emerging market and developing economies face two significant challenges. First, as the evidence presented in this article has shown, long-term progress towards the SDGs will hinge on improved management of natural capital and the environment, as well as developing more effective institutions and governance in EMDEs. Second, in the short to medium term, these economies must also cope with increasing fiscal constraints, rising debt, and considerable economic uncertainty.
These unique challenges require EMDEs to formulate a strategy that translates into immediate progress on both development and sustainability objectives. Such a strategy must prioritize making development more environmentally sustainably without sacrificing other key SDGs. Given likely fiscal and spending constraints, EMDEs need to design innovative policy mechanisms to achieve sustainability and development objectives in a cost-effective manner. This requires establishing policies that can provide immediate progress towards several SDGs simultaneously and also align economic incentives for sustainable development in the longer term [38]. In addition, to ensure effective adoption and implementation, policies should also raise or save revenue, generate the funding required for any additional investments, and be well established.
There are a range of policy innovations that satisfy these criteria. Examples include “subsidy swaps”, sustainable intensification in agriculture, investment in natural capital, social protection and safety nets, and skills and job training [20]. There are three major policies that EMDEs can adopt immediately that meet can achieve these policy objectives without significant additional financial support from the international community or increasing fiscal burdens, in addition to being impactful and creating synergies with other SDGs.
First, a proven strategy that could be implemented relatively easily in EMDEs is a fossil fuel subsidy swap, whereby the savings from a partial and limited reduction of subsidies for coal, oil and natural gas consumption are reallocated to fund investments in clean energy [39,40,41]. As argued by the International Energy Agency [42], the post-pandemic recovery period is an ideal time to reduce fossil fuel subsidies, as their continuation contributes to excessive fossil fuel use, pollution problems, illnesses and deaths, and in EMDEs they remain a serious constraint to the adoption of clean energy. For example, a subsidy swap of 10–30% from fossil fuel consumption to investments in energy efficiency and generation of renewable energy electricity could “tip the balance” and encourage a switch from fossil fuels to cleaner sources of energy [40]. A study of 26 countries, which includes many EMDEs, finds that such a policy could substantially reduce greenhouse gas emissions by 2030 [43].
In addition, a fossil fuel subsidy swap could be used to enable an improvement in energy efficiency technologies and better dissemination and adoption of renewable energy in rural areas, which has already been achieved through several different programs in EMDEs worldwide [44,45,46,47]. One possibility is the expansion of solar energy “safety nets” aimed especially at the millions of poor rural households that are located in remote areas and have little, if any, access to energy [44,47]. Such programs include targeted social assistance to provide solar power as an off-grid solution for the lack of energy access for poor rural households in remote locations. The provision of off-grid solar energy can directly improve the livelihoods and welfare of the rural poor. In addition, it improves their resilience to adverse economic and environmental shocks, including the ongoing COVID-19 pandemic and similar outbreaks. For example, India and Bangladesh have piloted such programs which provide free distribution of solar home systems and solar lamps that enable access to clean energy sources by remote rural households [47].
Another policy benefit are the important gains in equity that can be achieved by a fossil fuel subsidy swap to support energy efficiency and renewable energy in rural areas. In EMDEs, it is often the wealthier, urban households that receive the benefit from subsidies to fossil fuel consumptions, whereas the rural households that increasingly comprise the extreme poor benefit little from fossil fuel consumption subsidies [48,49]. For example, across twenty EMDEs, the poorest fifth of the population on average received just 7% of the overall benefit of fossil fuel subsidies. In contrast, the richest fifth received almost 43% of the overall benefit of fossil fuel subsidies [49].
A second policy is a tropical carbon tax [50]. The tropical carbon tax consists of a levy placed on the importation and consumption of fossil fuel in tropical countries. Some of the proceeds of this tax are allocated to expanding investments in natural climate solutions (NCS) which are aimed at mitigating carbon emissions as well as restoring, conserving, and improving the management of land to protect ecosystem services and biodiversity. NCS can be a relatively inexpensive way of lowering tropical land use change, which is a major source of the emission of greenhouse gases. For example, tropical NCS can mitigate as much as 6560 106 tons of CO2e in the coming decades in a cost-effective manner. That is, at less than USD 100 per 103 tons of CO2e. This amounts to about 25% of emissions from all tropical countries [51].
Such a policy has already proven to be effective in Costa Rica and Colombia—two countries that have reduced net environmental impacts over 2000–2019 (Table A1). In Colombia, the policy is equivalent to an effective carbon tax of USD 5 per tCO2 on all fossil fuels. This policy yielded revenues of USD 148 million in 2017 and USD 91 million in 2018. A quarter of this revenue is used to reduce and monitor deforestation, manage coastal erosion, protect strategic ecosystems, conserve water sources, and combat climate change. A further 5% of the revenues collected is invested in strengthening Colombia’s national system of protected areas. In Costa Rica, the carbon tax policy also funds a payment for ecosystem services scheme targeted to districts with high levels of poverty. In addition, it supports smallholder farmers and indigenous peoples in submitting requests for funds. Given that as much as 40% of beneficiaries in Costa Rica are communities that live below the poverty line, this policy also has important equity implications [50].
If 12 other major tropical EMDEs adopt a carbon tax policy similar to that in Colombia, between them they could raise USD 1.8 billion each year in tax revenues to invest in conservation and sustainable management of natural habitats that benefit the climate through carbon mitigation [50]. A more ambitious policy of carbon taxation and revenue allocation could yield nearly USD 13 billion each year for natural climate solutions.
This policy approach does not have to be confined to tropical countries. EMDEs in more temperate regions can also adopt a similar policy. For example, for the EMDEs in Europe and Central Asia, two important priorities are landscape protection and restoration, especially in ecological fragile mountain zones, and nature-based solutions to reduce disaster and climate risks, especially from floods and droughts [52,53,54]. Such investments also have the potential to improve rural livelihoods through boosting employment and income opportunities, reducing health risks and enhancing beneficial ecosystem services, such as watershed protection, control of flooding, and prevention of land degradation and topsoil loss. Both priorities could be easily funded in the same way that Costa Rica and Colombia have done—placing a small carbon levy on fossil fuel consumption and imports, with some of the revenue raised dedicated to increase investments in protecting and restoring mountain landscapes and in nature-based solutions.
A third policy is improved management and distribution of resource revenues. Investing the savings of resource revenues is considered critical to the long-term sustainability and development success of EMDEs with abundant natural capital [39,55,56]. Equally important is to develop a sound fiscal strategy for managing resource revenues, as fluctuations in these revenues often translate directly into changes in public spending and capital investments [57]. Volatility of resource revenues, especially through commodity price “booms” and “busts”, may also undermine the economy and public sector priorities through impacting the financial sector of resource-rich economies. This type of commodity price shock often leads to fragility in the financial sector, and may even instigate crises, by affecting loans and credit, reducing bank liquidity, and lowering bank profits. Such effects can, in turn, lead to lower growth rates, government revenue, and savings while increasing unemployment, debt in foreign currency, and fiscal deficits [58,59].
Especially in EMDEs facing fiscal constraints and rising debt due to the COVID-19 pandemic, such impacts can seriously undermine the ability of a country with abundant natural capital to adopt a post-pandemic green recovery strategy. To avoid such a possibility, improved fiscal management of resource revenues needs to be included as an additional element of such a strategy. A key aim would be to shield or delink green recovery public spending and investments from volatility in resource revenues through ensuring that there are sufficient revenues for these priorities during periods of commodity price “busts” while saving revenue during price “booms” for the future expenditures need in the later stages of the recovery [57].
In addition, economies might consider additional policy actions to improve more equitable distribution of resource revenues. One ambitious and novel distributional policy is oil for cash [60]. This involves redistributing any windfall resource revenues directly to the general population through a regular, universal, and rule-based cash payment. Implementing the policy requires creating a separate fund to receive windfall revenues, establishing allocation rules for dividing revenue income between the dividend payments and the public budget, and establishing rules for paying transparent, universal, and regular dividends to citizens directly. Alaska and the Canadian province of Alberta already have such a redistribution scheme for their resource revenues, and some EMDEs, notably Mexico and Brazil, have been experimenting with cash transfer payments to households. Other policies, such as digital transformation and updated business models that encompass innovation strategies, can also provide important opportunities for achieving progress towards environmental sustainability [61,62,63,64,65,66].
Whether such policies can also help poorer economies build more effective governance and institutions remain to be seen. One of the limitations of our analysis is the reliability of the SDG indicators, and improvements in the consistency and scope of the SDG target data will help inform analysts of the progress towards the economics, environmental, and social objectives. What is clear is that successful implementation of the above policies requires complementary adoption of effective administrative capacity, monitoring and enforcing them to make them work. That can, in turn, be the beginning of creating the economy-wide institutional and governance structure necessary for more sustainable development in EMDEs.
Our study has demonstrated that policy efforts to improve environmental management, incentivize more sustainable natural capital use, and strengthen institutions and governance can have significant synergies (and trade-offs) and enable EMDEs to make long-term progress towards the SDGs. Other studies have also shown that there are several SDG targets that exhibit strong, positive correlations, such as SDG7 (Affordable and clean energy) and SDG2 (Zero hunger), SDG3 (Good health and well-being), SDG4 (Quality education), and SDG9 (Industry, innovation, and infrastructure) [67]. Together, this research suggests that exploring the synergies and trade-offs between the SDGs provides an important opportunity for decision-makers to consider the multiple benefits (and costs) of alternative policy choices, rather than just focusing on a single objective, such as economic growth.
Certainly, better environmental and natural capital management appear to go together with improved institutional quality, resulting in economy-wide development and welfare gains [68,69,70,71,72]. By providing the building blocks for more effective governance and institutions, it is possible that the policies suggested here may be the start of this process in EMDEs.
Author Contributions
Conceptualization, E.B.B. and J.C.B.; methodology, E.B.B.; formal analysis, E.B.B.; writing—original draft preparation, E.B.B. and J.C.B.; writing—review and editing, E.B.B. and J.C.B. All authors have read and agreed to the published version of the manuscript.
Funding
This research received no external funding.
Institutional Review Board Statement
Not applicable.
Informed Consent Statement
Not applicable.
Data Availability Statement
Not applicable.
Conflicts of Interest
The authors declare no conflict of interest.
Appendix A
The following table lists the SDG 1 welfare impact, the net SDG welfare impact, the net environmental impact, average rate of natural resource depletion, and the average institutional quality over 2000–2019 for 99 emerging market and developing economies
Table A1.
SDG welfare, environmental, natural capital, and institutional quality outcomes by country, 2000–2019.
Table A1.
SDG welfare, environmental, natural capital, and institutional quality outcomes by country, 2000–2019.
| Country | SDG 1 Welfare Impact ($/Capita) | Net SDG Welfare Impact ($/Capita) | Net Environmental Impact ($/per Capita) | Average Natural Resource Depletion (% GNI) | Average Institutional Quality (0 to 5) |
|---|---|---|---|---|---|
| Burkina Faso | $237 | $2916 | −$1703 | 1.7% | 2.1 |
| Burundi | $31 | $930 | −$109 | 22.9% | 1.2 |
| Chad | $199 | −$254 | −$1566 | 16.8% | 1.2 |
| Congo, Dem. Rep. | $56 | $8999 | −$66 | 21.2% | 0.9 |
| Ethiopia | $171 | $2701 | −$1672 | 17.2% | 1.5 |
| Gambia | $420 | $181 | −$877 | 4.1% | 2.0 |
| Guinea | $389 | $3649 | −$2025 | 9.7% | 1.4 |
| Guinea-Bissau | $233 | −$2331 | −$3581 | 15.0% | 1.4 |
| Liberia | $188 | −$3568 | −$418 | 22.4% | 1.5 |
| Madagascar | −$78 | $974 | −$174 | 6.0% | 2.0 |
| Malawi | −$5 | −$667 | −$858 | 7.8% | 2.1 |
| Mali | $337 | $1170 | −$595 | 6.4% | 2.0 |
| Mozambique | $45 | −$508 | −$2727 | 2.1% | 2.0 |
| Niger | $152 | $1148 | −$829 | 0.8% | 1.8 |
| Rwanda | $91 | $3224 | −$923 | 5.8% | 2.0 |
| Sierra Leone | $176 | $3698 | −$778 | 9.4% | 1.7 |
| South Sudan | −$1171 | −$3702 | −$1261 | 7.6% | 0.8 |
| Sudan | $210 | $10,968 | −$1662 | 4.0% | 0.9 |
| Togo | $265 | $10,866 | −$162 | 8.0% | 1.6 |
| Uganda | $159 | $175 | −$1592 | 12.4% | 1.9 |
| Zambia | −$96 | −$183 | −$2012 | 7.0% | 2.1 |
| Low Income | $96 | $1923 | −$1129 | 9.9% | 1.6 |
| Angola | −$748 | $8846 | −$1012 | 28.0% | 1.4 |
| Bangladesh | $383 | $576 | −$2373 | 0.7% | 1.6 |
| Benin | $435 | $3334 | −$2531 | 0.3% | 2.2 |
| Bhutan | $931 | $2230 | −$4366 | 3.4% | 2.8 |
| Cabo Verde | $1881 | −$3375 | −$3756 | 1.0% | 3.0 |
| Cameroon | $0 | $1274 | −$1513 | 6.4% | 1.5 |
| Comoros | −282 | $12,257 | −$1720 | 1.7% | 1.6 |
| Congo, Rep. | $44 | −$1217 | −$104 | 36.8% | 1.4 |
| Cote d’Ivoire | $568 | $2264 | −$911 | 1.9% | 1.5 |
| Djibouti | $280 | $12,726 | −$2783 | 0.6% | 1.7 |
| Egypt, Arab Rep. | −$1769 | −$6493 | −$5604 | 6.7% | 1.8 |
| El Salvador | $2602 | −$11,382 | −$15,551 | 0.7% | 2.3 |
| Eswatini | $734 | $5924 | −$945 | 2.3% | 2.0 |
| Ghana | $596 | $5825 | −$1214 | 10.9% | 2.5 |
| Honduras | $602 | −$1678 | −$3561 | 0.9% | 1.9 |
| India | $474 | $1942 | −$1343 | 1.6% | 2.3 |
| Indonesia | −$1228 | −$18,280 | $5640 | 4.3% | 2.0 |
| Iran, Islamic Rep. | −$313 | −$429 | −$7055 | 6.9% | 1.5 |
| Kenya | $169 | $7941 | −$362 | 3.2% | 1.8 |
| Kiribati | $1641 | $2373 | −$9461 | 0.0% | 2.8 |
| Kyrgyz Republic | $599 | −$12,508 | −$14,634 | 3.5% | 1.7 |
| Lao PDR | $400 | −$3625 | −$8990 | 6.5% | 1.6 |
| Mauritania | $775 | −$2204 | −$6828 | 5.6% | 1.8 |
| Mongolia | $1771 | $10,115 | $157 | 8.9% | 2.4 |
| Morocco | $1282 | $5715 | −$1650 | 0.3% | 2.2 |
| Myanmar | $1181 | $16,759 | −$6722 | 2.2% | 1.1 |
| Nepal | $454 | $3297 | −$2319 | 0.2% | 1.7 |
| Nicaragua | $989 | $2696 | −$2129 | 0.4% | 1.9 |
| Nigeria | $509 | $18,695 | −$1573 | 6.3% | 1.4 |
| Pakistan | $832 | $1882 | −$407 | 1.2% | 1.5 |
| Philippines | $1530 | $5446 | −$1144 | 0.6% | 2.1 |
| Samoa | $1615 | −$702 | −$4014 | 0.4% | 3.0 |
| Sao Tome & Principe | $206 | $7177 | −$1085 | 3.2% | 2.2 |
| Senegal | $691 | $3765 | −$633 | 0.4% | 2.3 |
| Solomon Islands | $838 | $502 | −$4729 | 0.6% | 2.2 |
| Sri Lanka | $1434 | $7805 | −$1352 | 0.1% | 2.2 |
| Tajikistan | $874 | −$5659 | −$10,934 | 1.1% | 1.3 |
| Tanzania | $215 | $5319 | −$889 | 1.0% | 2.0 |
| Timor-Leste | $833 | $5952 | −$4429 | 27.7% | 1.9 |
| Tunisia | $1566 | $2463 | −$683 | 3.4% | 2.3 |
| Ukraine | $886 | $1579 | $994 | 1.2% | 1.9 |
| Uzbekistan | $3 | −$19,889 | −$28,232 | 14.4% | 1.2 |
| Vanuatu | $659 | −$2283 | $24 | 0.8% | 2.8 |
| Vietnam | $1580 | $734 | −$11,180 | 3.6% | 2.0 |
| Zimbabwe | −$637 | −$748 | −$15 | 6.1% | 1.1 |
| Lower Middle Income | $624 | $1710 | −$3865 | 4.8% | 1.9 |
| Albania | $1805 | −$717 | −$6716 | 0.9% | 2.3 |
| Argentina | $6971 | $10,674 | $16 | 2.8% | 2.3 |
| Armenia | $1089 | −$8080 | −$10,328 | 0.5% | 2.2 |
| Belarus | $1502 | $1955 | −$544 | 0.8% | 1.7 |
| Brazil | $3379 | $10,559 | −$2664 | 1.7% | 2.5 |
| Bulgaria | $2377 | −$1464 | −$2899 | 0.4% | 2.7 |
| China | $1538 | $2718 | −$3493 | 2.3% | 2.0 |
| Colombia | $2103 | $10,858 | $1026 | 4.8% | 2.1 |
| Costa Rica | $5642 | $16,851 | $85 | 0.0% | 3.1 |
| Dominican Republic | $3478 | $6486 | −$1218 | 0.6% | 2.2 |
| Ecuador | $2438 | $7349 | −$3595 | 7.4% | 1.9 |
| Fiji | $1018 | $862 | −$1398 | 1.1% | 2.4 |
| Gabon | $1604 | $16,784 | $2777 | 23.2% | 2.0 |
| Guatemala | $31 | $5953 | −$1903 | 0.7% | 1.9 |
| Jamaica | $2285 | −$1070 | $238 | 0.3% | 2.6 |
| Jordan | $2789 | −$2921 | −$2742 | 0.2% | 2.4 |
| Kazakhstan | $2054 | $7439 | −$1292 | 12.3% | 1.9 |
| Malaysia | $3737 | −$1627 | −$2486 | 8.4% | 2.8 |
| Maldives | $7416 | −$4914 | −$2966 | 0.0% | 2.3 |
| Mauritius | $4764 | −$13,279 | −$24,815 | 0.0% | 3.2 |
| Mexico | $5189 | $9855 | −$1376 | 3.3% | 2.3 |
| Moldova | $929 | −$11,050 | −$6163 | 0.0% | 2.1 |
| Montenegro | $299 | −$13,723 | −$3617 | 0.3% | 2.5 |
| Namibia | $1471 | $7549 | −$884 | 1.4% | 2.8 |
| North Macedonia | $1633 | $7315 | −$1226 | 0.8% | 2.3 |
| Paraguay | $2563 | $9220 | −$1846 | 1.7% | 1.8 |
| Peru | $2200 | $14,195 | −$9 | 4.7% | 2.2 |
| Russian Federation | $3849 | $12,825 | −$931 | 8.0% | 1.8 |
| Serbia | $2180 | $2556 | −$1291 | 0.7% | 2.2 |
| South Africa | $1701 | $1858 | $141 | 2.2% | 2.7 |
| Thailand | $4351 | $14,499 | $202 | 1.7% | 2.3 |
| Tonga | $2580 | $13,503 | $1142 | 0.0% | 2.5 |
| Turkey | $7499 | $17,621 | −$5845 | 0.2% | 2.3 |
| Upper Middle Income | $2863 | $4565 | −$2625 | 2.8% | 2.3 |
| All Countries | $1258 | $2707 | −$2890 | 5.3% | 2.0 |
Indicator changes are for part, or the entire period, indicated. Income group classification is based on the World Bank’s Country and Lending Groups classification [31]. The World Bank divides economies among income groups according to 2021 gross national income (GNI) per capita. The groups are low income, USD 1085 per capita or less; lower middle income, USD 1086 to USD 4255 per capita; and upper middle income, USD 4256 to USD 13,205 per capita. The average for each income group, that is low income, lower middle income, upper middle income and all countries, is presented in bold. Estimation of SDG 1 welfare impacts, net SDG welfare impacts and net environmental impacts are based on methods in Barbier and Burgess (2019 and 2021) and is applied to the indicators and sources of data from Table 1. Natural resources depletion is the sum of net forest depletion, energy depletion, and mineral depletion. Net forest depletion is unit resource rents times the excess of roundwood harvest over natural growth. Energy depletion is the ratio of the value of the stock of energy resources to the remaining reserve lifetime (capped at 25 years). It covers coal, crude oil, and natural gas. Mineral depletion is the ratio of the value of the stock of mineral resources to the remaining reserve lifetime (capped at 25 years). It covers tin, gold, lead, zinc, iron, copper, nickel, silver, bauxite, and phosphate. The source of this indicator is the World Bank’s World Development Indictors [32]. Institutional quality is the average of the 2000–2019 indicators for control of corruption, government effectiveness, political stability and absence of violence/terrorism, regulatory quality, rule of law, and voice and accountability of the Worldwide Governance Indicators [23]. These indicators and average institutional quality have been rescaled from 0 (lowest quality) to 5 (highest quality).
References
- Barbier, E. Economics for a Fragile Planet; Cambridge University Press: Cambridge, UK; New York, NY, USA, 2022. [Google Scholar]
- Dasgupta, P. The Economics of Biodiversity: The Dasgupta Review; HM Treasury: London, UK, 2021.
- Intergovernmental Science-Policy Platform on Global Biodiversity and Ecosystem Services (IPBES). Global Assessment Report on Biodiversity and Ecosystem Services; Brondizio, E., Settele, J., Díaz, S., Ngo, H., Eds.; IPBES Secretariat: Bonn, Germany, 2019.
- Food and Agriculture Organization of the United Nations (FAO). Forest Resources Assessment (FRA) 2020; FAO: Rome, Italy, 2020.
- WWF. Living Planet Report 2020—Bending the Curve of Biodiversity Loss; Almond, R.E.A., Grooten, M., Petersen, T., Eds.; WWF: Gland, Switzerland, 2020. [Google Scholar]
- Duarte, C.M.; Agusti, S.; Barbier, E.; Britten, G.L.; Castilla, J.C.; Gattuso, J.-P.; Fulweiler, R.W.; Hughes, T.P.; Knowlton, N.; Lovelock, C.E.; et al. Rebuilding marine life. Nature 2020, 580, 39–51. [Google Scholar]
- Acemoglu, D.; Johnson, S.; Robinson, J.A. Institutions as the Fundamental Cause of Long-Run Growth. In Handbook of Economic Growth; Aghion, P., Durlauf, S., Eds.; North-Holland: Amsterdam, The Netherlands, 2005; pp. 385–472. [Google Scholar]
- Chang, H.-J. Institutions and economic development: Theory, policy and history. J. Inst. Econ. 2011, 7, 473–498. [Google Scholar] [CrossRef]
- Easterly, W. Institutions: Top down or bottom up? AEA Pap. Proc. 2008, 98, 95–99. [Google Scholar] [CrossRef]
- Glaeser, E.; La Porta, R. Do institutions cause growth? J. Econ. Growth 2004, 9, 271–303. [Google Scholar] [CrossRef]
- Gradstein, M. Governance and growth. J. Dev. Econ. 2004, 73, 505–518. [Google Scholar] [CrossRef]
- Rodrik, D.; Subramanian, A.; Trebbi, F. Institutions rule: The primacy of institutions over geography and economic integration in economic development. J. Econ. Growth 2004, 9, 131–165. [Google Scholar] [CrossRef]
- Acemoglu, D.; Robinson, J.A. The Role of Institutions in Growth and Development; World Bank: Washington, DC, USA, 2008; Volume 10. [Google Scholar]
- Acemoglu, D.; Robinson, J.A. Why Nations Fail: The Origins of Power, Prosperity, and Poverty; Crown Publishing Group: New York, NY, USA, 2012. [Google Scholar]
- Lehne, J.; Mo, J.; Plekhanov, A. What Determines the Quality of Economic Institutions? Cross-Country Evidence. European Bank for Reconstruction and Development, Working Paper 171. 2014. Available online: https://papers.ssrn.com/sol3/papers.cfm?abstract_id=3121122 (accessed on 28 November 2022).
- Kaufmann, D.; Kraay, A. Growth without Governance; Policy Research Working Paper 2002; No. 2928; World Bank: Washington, DC, USA, 2002. [Google Scholar]
- Kaufmann, D.; Kraay, A.; Mastruzzi, M. Worldwide Governance Indicators Project: Answering the Critics; Policy Research Working Paper 2007; No. 4149; World Bank: Washington, DC, USA, 2007. [Google Scholar]
- Wilson, R. Does governance cause growth? Evidence from China. World Dev. 2016, 79, 138–151. [Google Scholar] [CrossRef]
- Asadullah, M.N.; Savoia, A. Poverty reduction during 1990–2013: Did millennium development goals adoption and state capacity matter? World Dev. 2018, 105, 70–82. [Google Scholar] [CrossRef]
- United Nations. Global Indicator Framework for the Sustainable Development Goals and Targets of the 2030 Agenda for Sustainable Development; United Nations: New York, NY, USA, 2020.
- World Bank. Data, Digitalization, and Governance; Europe and Central Asia Economic Update, Office of the Chief Economist, Spring 2021; World Bank: Washington, DC, USA, 2021. [Google Scholar]
- Worldwide Governance Indicators; World Bank: Washington, DC, USA, 2022; Available online: https://databank.worldbank.org/source/worldwide-governance-indicators (accessed on 5 December 2022).
- Barbier, E.B.; Burgess, J.C. Sustainable development goal indicators: Analyzing trade-offs and complementarities. World Dev. 2019, 122, 295–305. [Google Scholar] [CrossRef]
- Barbier, E.B.; Burgess, J.C. Economics of the SDGs: Putting the Sustainable Development Goals into Practice; Palgrave Macmillan: London, UK; New York, NY, USA.
- World Bank Country and Lending Groups; World Bank: Washington, DC, USA, 2022; Available online: https://datahelpdesk.worldbank.org/knowledgebase/articles/906519-world-bank-country-and-lending-groups (accessed on 28 November 2022).
- Freeman, A.M. III. The Measurement of Environmental Values: Theory and Methods, 2nd ed.; Resources for the Future: Washington, DC, USA, 2003. [Google Scholar]
- Lankford, R.H. Measuring Welfare Changes in Settings with Imposed Quantities. J. Environ. Econ. Manag. 1988, 15, 45–63. [Google Scholar] [CrossRef]
- Nilsson, M.; Griggs, D.; Visbeck, M. Map the interactions between Sustainable Development Goals. Nature 2016, 534, 320–322. [Google Scholar]
- Pradhan, P.; Costa, L.; Rybski, D.; Lucht, W.; Kropp, J.P. A systematic study of sustainable development goal (SDG) interactions. Earth’s Future 2017, 5, 1169–1179. [Google Scholar]
- Sachs, J.; Schmidt-Traub, G.; Kroll, C.; Lafortune, G.; Fuller, G.; Woelm, F. The Sustainable Development Goals and COVID-19, Sustainable Development Report 2020; Cambridge University Press: Cambridge, UK, 2020. [Google Scholar]
- Sachs, J.; Kroll, C.; Lafortune, G.; Fuller, G.; Woelm, F. Sustainable Development Report 2021; Cambridge University Press: Cambridge, UK, 2021. [Google Scholar]
- United Nations (UN). The Sustainable Development Goals Report 2021; UN: New York, NY, USA, 2021.
- von Stechow, C.; Minx, J.; Riahi, K.; Jewell, J.; MCollum, D.; Callaghan, M.; Bertram, C.; Luderer, G.; Baiocchi, G. 2 °C and SDGs: United they stand, divided they fall? Environ. Res. Lett. 2016, 11, 034022. [Google Scholar]
- United Nations. Tier Classification for Global SDG Indicators; United Nations: New York, NY, USA, 2019.
- World Development Indicators; World Bank: Washington, DC, USA, 2022; Available online: https://databank.worldbank.org/source/world-development-indicators (accessed on 28 November 2022).
- Arrow, K.; Dasgupta, P.; Goulder, L.; Mumford, K.; Oleson, K. Sustainability and the measurement of wealth. Environ. Dev. Econ. 2012, 17, 317–353. [Google Scholar] [CrossRef]
- Fonseca, L.M.; Cardoso, M.C.; Nóvoa, M.H. Motivations for ISO 9001 quality management system implementation and certification–mapping the territory with a novel classification proposal. Int. J. Qual. Serv. Sci. 2022, 14, 18–36. [Google Scholar] [CrossRef]
- Barbier, E.; Burgess, J. Sustainability and development after COVID-19. World Dev. 2020, 135, 105082. [Google Scholar] [CrossRef]
- Barbier, E. Is green rural transformation possible in developing countries? World Development 2020, 131, 104955. [Google Scholar]
- Bridle, R.; Sharma, S.; Mostafa, M.; Geddes, A. Fossil Fuel to Clean Energy Subsidy Swaps: How to Pay for and Energy Revolution; Global Subsidy Initiative and International Institute for Sustainable Development: Winnipeg, MB, Canada, 2020. [Google Scholar]
- Sanchez, L.; Wooders, P.; Bechauf, R. 53 Ways to Reform Fossil Fuel Consumer Subsidies and Pricing. International Institute for Sustainable Development. August 18, 2020. 2020. Available online: https://www.iisd.org/articles/53-ways-reform-fossil-fuel-consumer-subsidies-and-pricing (accessed on 28 November 2022).
- International Energy Agency (IEA). Consumption Subsidies for Fossil Fuels Remain a Roadblock on the Way to a Clean Energy Future; IEA: Paris, France, 2021.
- Global Subsidy Initiative (GSI). Raising Ambition through Fossil Fuel Subsidy Reform: Greenhouse Gas Emissions Modelling Results from 26 Countries; Global Subsidies Initiative of the International Institute for Sustainable Development: Geneva, Switzerland, 2019. [Google Scholar]
- Barbier, E. The policy challenges of green rural transformation for Asia-Pacific emerging and developing economies in a post-COVID world. Econ. Anal. Policy 2022, 75, 689–704. [Google Scholar]
- Pahle, M.; Pachauri, S.; Steinbacher, K. Can the green economy deliver it all? Experiences of renewable energy policies with socio-economic objectives. Appl. Energy 2016, 179, 1331–1341. [Google Scholar]
- Suriyankietkaew, S.; Nimsai, S. COVID-19 impacts and sustainability strategies for regional recovery in Southeast Asia: Challenges and opportunities. Sustainability 2021, 13, 8907. [Google Scholar] [CrossRef]
- Zaman, R.; van Vliet, O.; Posch, A. Energy access and pandemic-resilient livelihoods: The role of solar energy safety nets. Energy Res. Soc. Sci. 2021, 71, 101805. [Google Scholar] [CrossRef] [PubMed]
- Castañeda, A.; Doan, D.; Newhouse, D.; Nguyen, M.; Uematsu, H.; Azvedo, J.; World Bank Data for Goals Group. A new profile of the global poor. World Dev. 2018, 101, 250–267. [Google Scholar] [CrossRef]
- Arze del Granado, F.; Coady, D.; Gillingham, R. The unequal benefits of fuel subsidies: A review of evidence from developing countries. World Dev. 2012, 40, 2234–2248. [Google Scholar] [CrossRef]
- Barbier, E.; Lozano, R.; Rodriguez, C.; Troeng, S. Adopt a carbon tax to protect tropical countries. Nature 2020, 578, 213–216. [Google Scholar] [CrossRef] [PubMed]
- Griscom, B.W.; Busch, J.; Cook-Patton, S.C.; Ellis, P.W.; Funk, J.; Leavitt, S.M.; Lomax, G.; Turner, W.R.; Chapman, M.; Engelmann, J.; et al. National mitigation potential from natural climate solutions in the tropics. Philos. Trans. R. Soc. B 2020, 375, 20190126. [Google Scholar]
- Agostini, P.; Kull. Protecting Central Asia’s Mountains and Landscapes to Transform People’s Lives and Livelihoods; World Bank Blogs: Washington, DC, USA, 2020; Available online: https://blogs.worldbank.org/europeandcentralasia/protecting-central-asias-mountains-and-landscapes-to-transform-peoples-lives (accessed on 28 November 2022).
- Baeumler, A.; Kerblat, Y.; Ionascu, A. Investing in Climate and Disaster Resilience to Help Moldova’s at-Risk Communities Weather the Next Shock; World Bank Blogs: Washington, DC, USA, 2021; Available online: https://blogs.worldbank.org/europeandcentralasia/investing-climate-and-disaster-resilience-help-moldovas-risk-communities (accessed on 28 November 2022).
- Lvovsky, K.; Abate, N. From the Alps to the Pamirs: Investing in Mountain Economies to Make People and Places More Resilient; World Bank Blogs: Washington, DC, USA, 2021; Available online: https://blogs.worldbank.org/europeandcentralasia/investing-in-mountain-economies-to-make-people-and-places-more-resilient (accessed on 28 November 2022).
- Lashitew, A.; Ross, M.; Werker, E. What drives successful economic diversification in resource-rich countries? World Bank Res. Obs. 2021, 36, 164–196. [Google Scholar]
- Venables, A. Using natural resources for development: Why has it proven so difficult? J. Econ. Perspect. 2016, 30, 161–184. [Google Scholar]
- Basevant, O.; Hooley, J.; Iamamoglu, E. How to Design a Fiscal Strategy in a Resource-Rich Country; Fiscal Affairs Department, International Monetary Fund: Washington, DC, USA, 2021. [Google Scholar]
- Kinda, T.; Mlachila, M.; Ouedraogo, R. Commodity Price Shocks and Financial Sector Fragility; IMF Working Paper WP/16/12; International Monetary Fund: Washington, DC, USA, 2016. [Google Scholar]
- Mlachila, M.; Ouedraogo, R. Financial Development Resource Curse in Resource-RICH Countries: The Role of Commodity Price Shocks; IMF Working Paper WP/17/163; International Monetary Fund: Washington, DC, USA, 2017. [Google Scholar]
- Moss, T.; Lambert, C.; Majerowicz, S. Oil to Cash: Fighting the Resource Curse through Cash Transfers; Center for Global Development: Washington, DC, USA, 2015. [Google Scholar]
- Ghobakhloo, M. Industry 4.0, digitization, and opportunities for sustainability. J. Clean. Prod. 2020, 252, 119869. [Google Scholar]
- Fonseca, L.; Amaral, A.; Oliveira, J. Quality 4.0: The EFQM 2020 model and industry 4.0 relationships and implications. Sustainability 2021, 13, 3107. [Google Scholar]
- Ejsmont, K.; Gladysz, B.; Kluczek, A. Impact of industry 4.0 on sustainability—Bibliometric literature review. Sustainability 2020, 12, 5650. [Google Scholar] [CrossRef]
- Fonseca, L.M.; Domingues, J.P.; Pereira, M.T.; Martins, F.F.; Zimon, D. Assessment of circular economy within Portuguese organizations. Sustainability 2018, 10, 2521. [Google Scholar]
- Panchal, R.; Singh, A.; Diwan, H. Does circular economy performance lead to sustainable development? A systematic literature review. J. Environ. Manag. 2021, 293, 112811. [Google Scholar]
- dos Santos LC, T.; Giannetti, B.F.; Agostinho, F.; Almeida, C.M. Using the five sectors sustainability model to verify the relationship between circularity and sustainability. J. Clean. Prod. 2022, 366, 132890. [Google Scholar] [CrossRef]
- Fonseca, L.M.; Domingues, J.P.; Dima, A.M. Mapping the sustainable development goals relationships. Sustainability 2020, 12, 3359. [Google Scholar]
- Mehlum, H.; Moene, K.; Torvik, R. Institutions and the resource curse. Econ. J. 2006, 116, 1–20. [Google Scholar]
- van der Ploeg, F. Natural resources: Curse or blessing? J. Econ. Lit. 2011, 49, 366–420. [Google Scholar]
- Havranek, T.; Hovrath, R.; Zeynalov, A. Natural resources and economic growth: A meta-analysis. World Dev. 2016, 88, 134–151. [Google Scholar]
- Papyrakis, E. The resource curse—what have learned from two decades of intensive research: Introduction to the special issue. J. Dev. Stud. 2017, 53, 175–185. [Google Scholar] [CrossRef]
- Barbier, E. Natural Resources and Economic Development, 2nd ed.; Cambridge University Press: Cambridge, UK; New York, NY, USA, 2019. [Google Scholar]


Disclaimer/Publisher’s Note: The statements, opinions and data contained in all publications are solely those of the individual author(s) and contributor(s) and not of MDPI and/or the editor(s). MDPI and/or the editor(s) disclaim responsibility for any injury to people or property resulting from any ideas, methods, instructions or products referred to in the content. |
© 2023 by the authors. Licensee MDPI, Basel, Switzerland. This article is an open access article distributed under the terms and conditions of the Creative Commons Attribution (CC BY) license (https://creativecommons.org/licenses/by/4.0/).