
Global Leaf Area Index Research over the Past 75 Years: A Comprehensive Review and Bibliometric Analysis
 , ,
, ,
Abstract
:1. Introduction
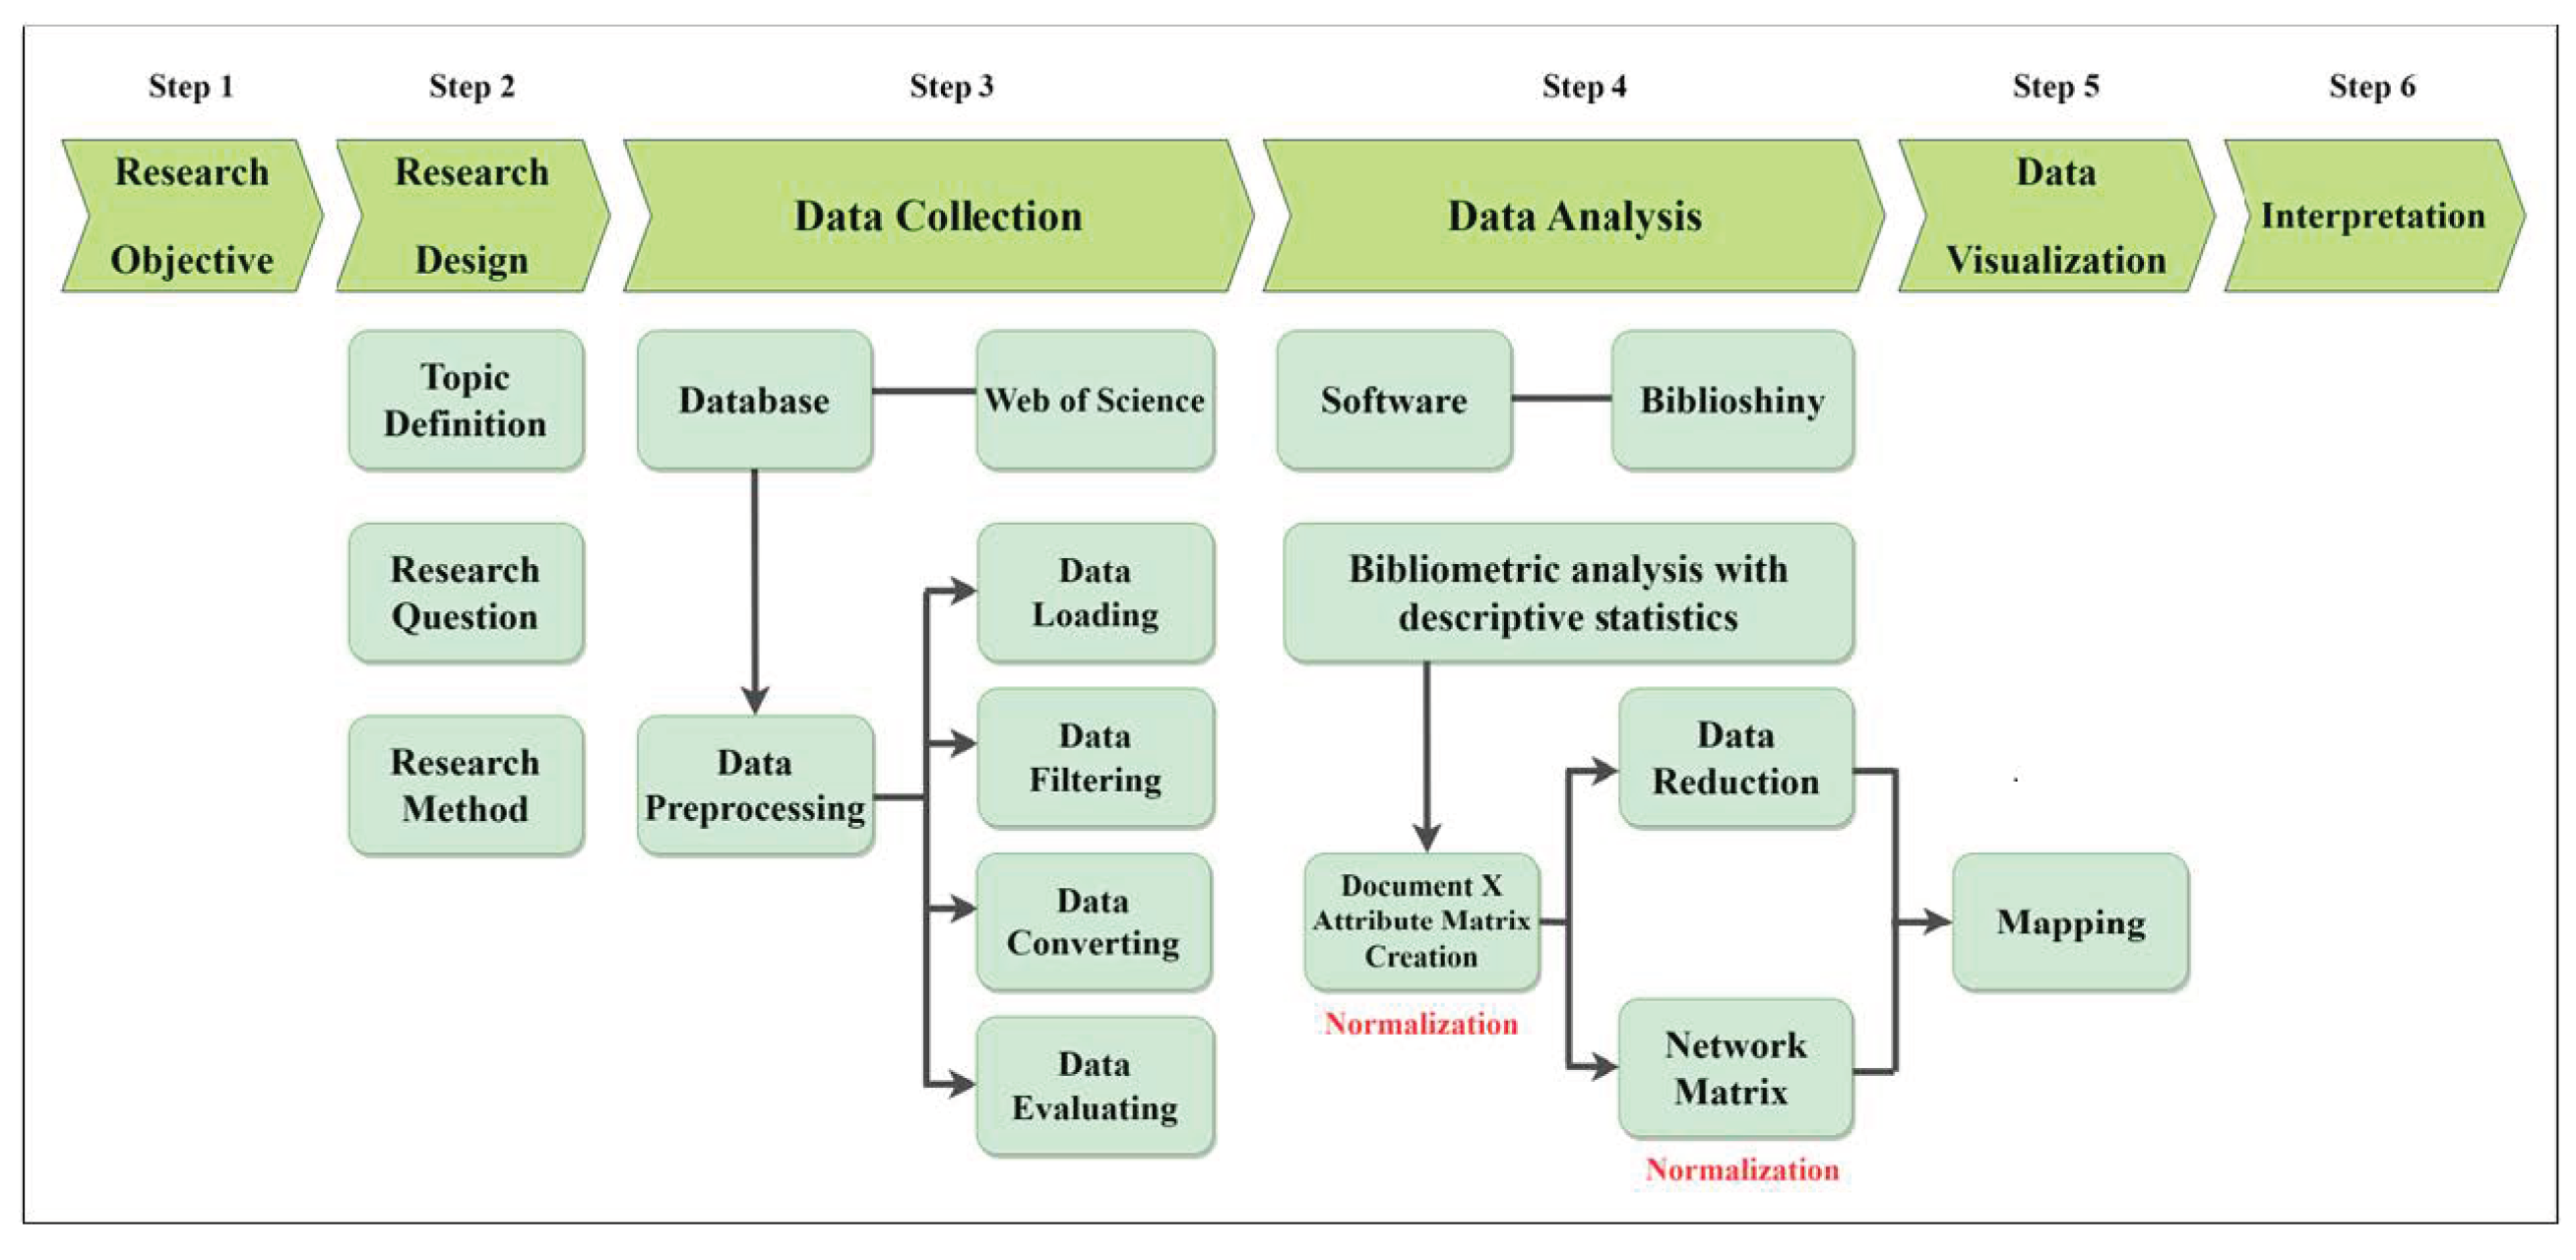
2. Data and Methods
2.1. Literature Search Strategy
2.2. Bibliometric Analysis Methods
3. Results and Discussion
3.1. Descriptive Bibliometric Analysis
3.2. Published Volume Analysis
3.2.1. Overall Development Trend of the Leaf Area Index
3.2.2. Country and Institutional Distribution
3.2.3. Disciplines and Periodical Distribution
3.3. Author Analysis
3.4. Paper Influence Analysis
3.5. Keyword Analysis
4. Conclusions and Prospects
4.1. Conclusions
- (1)
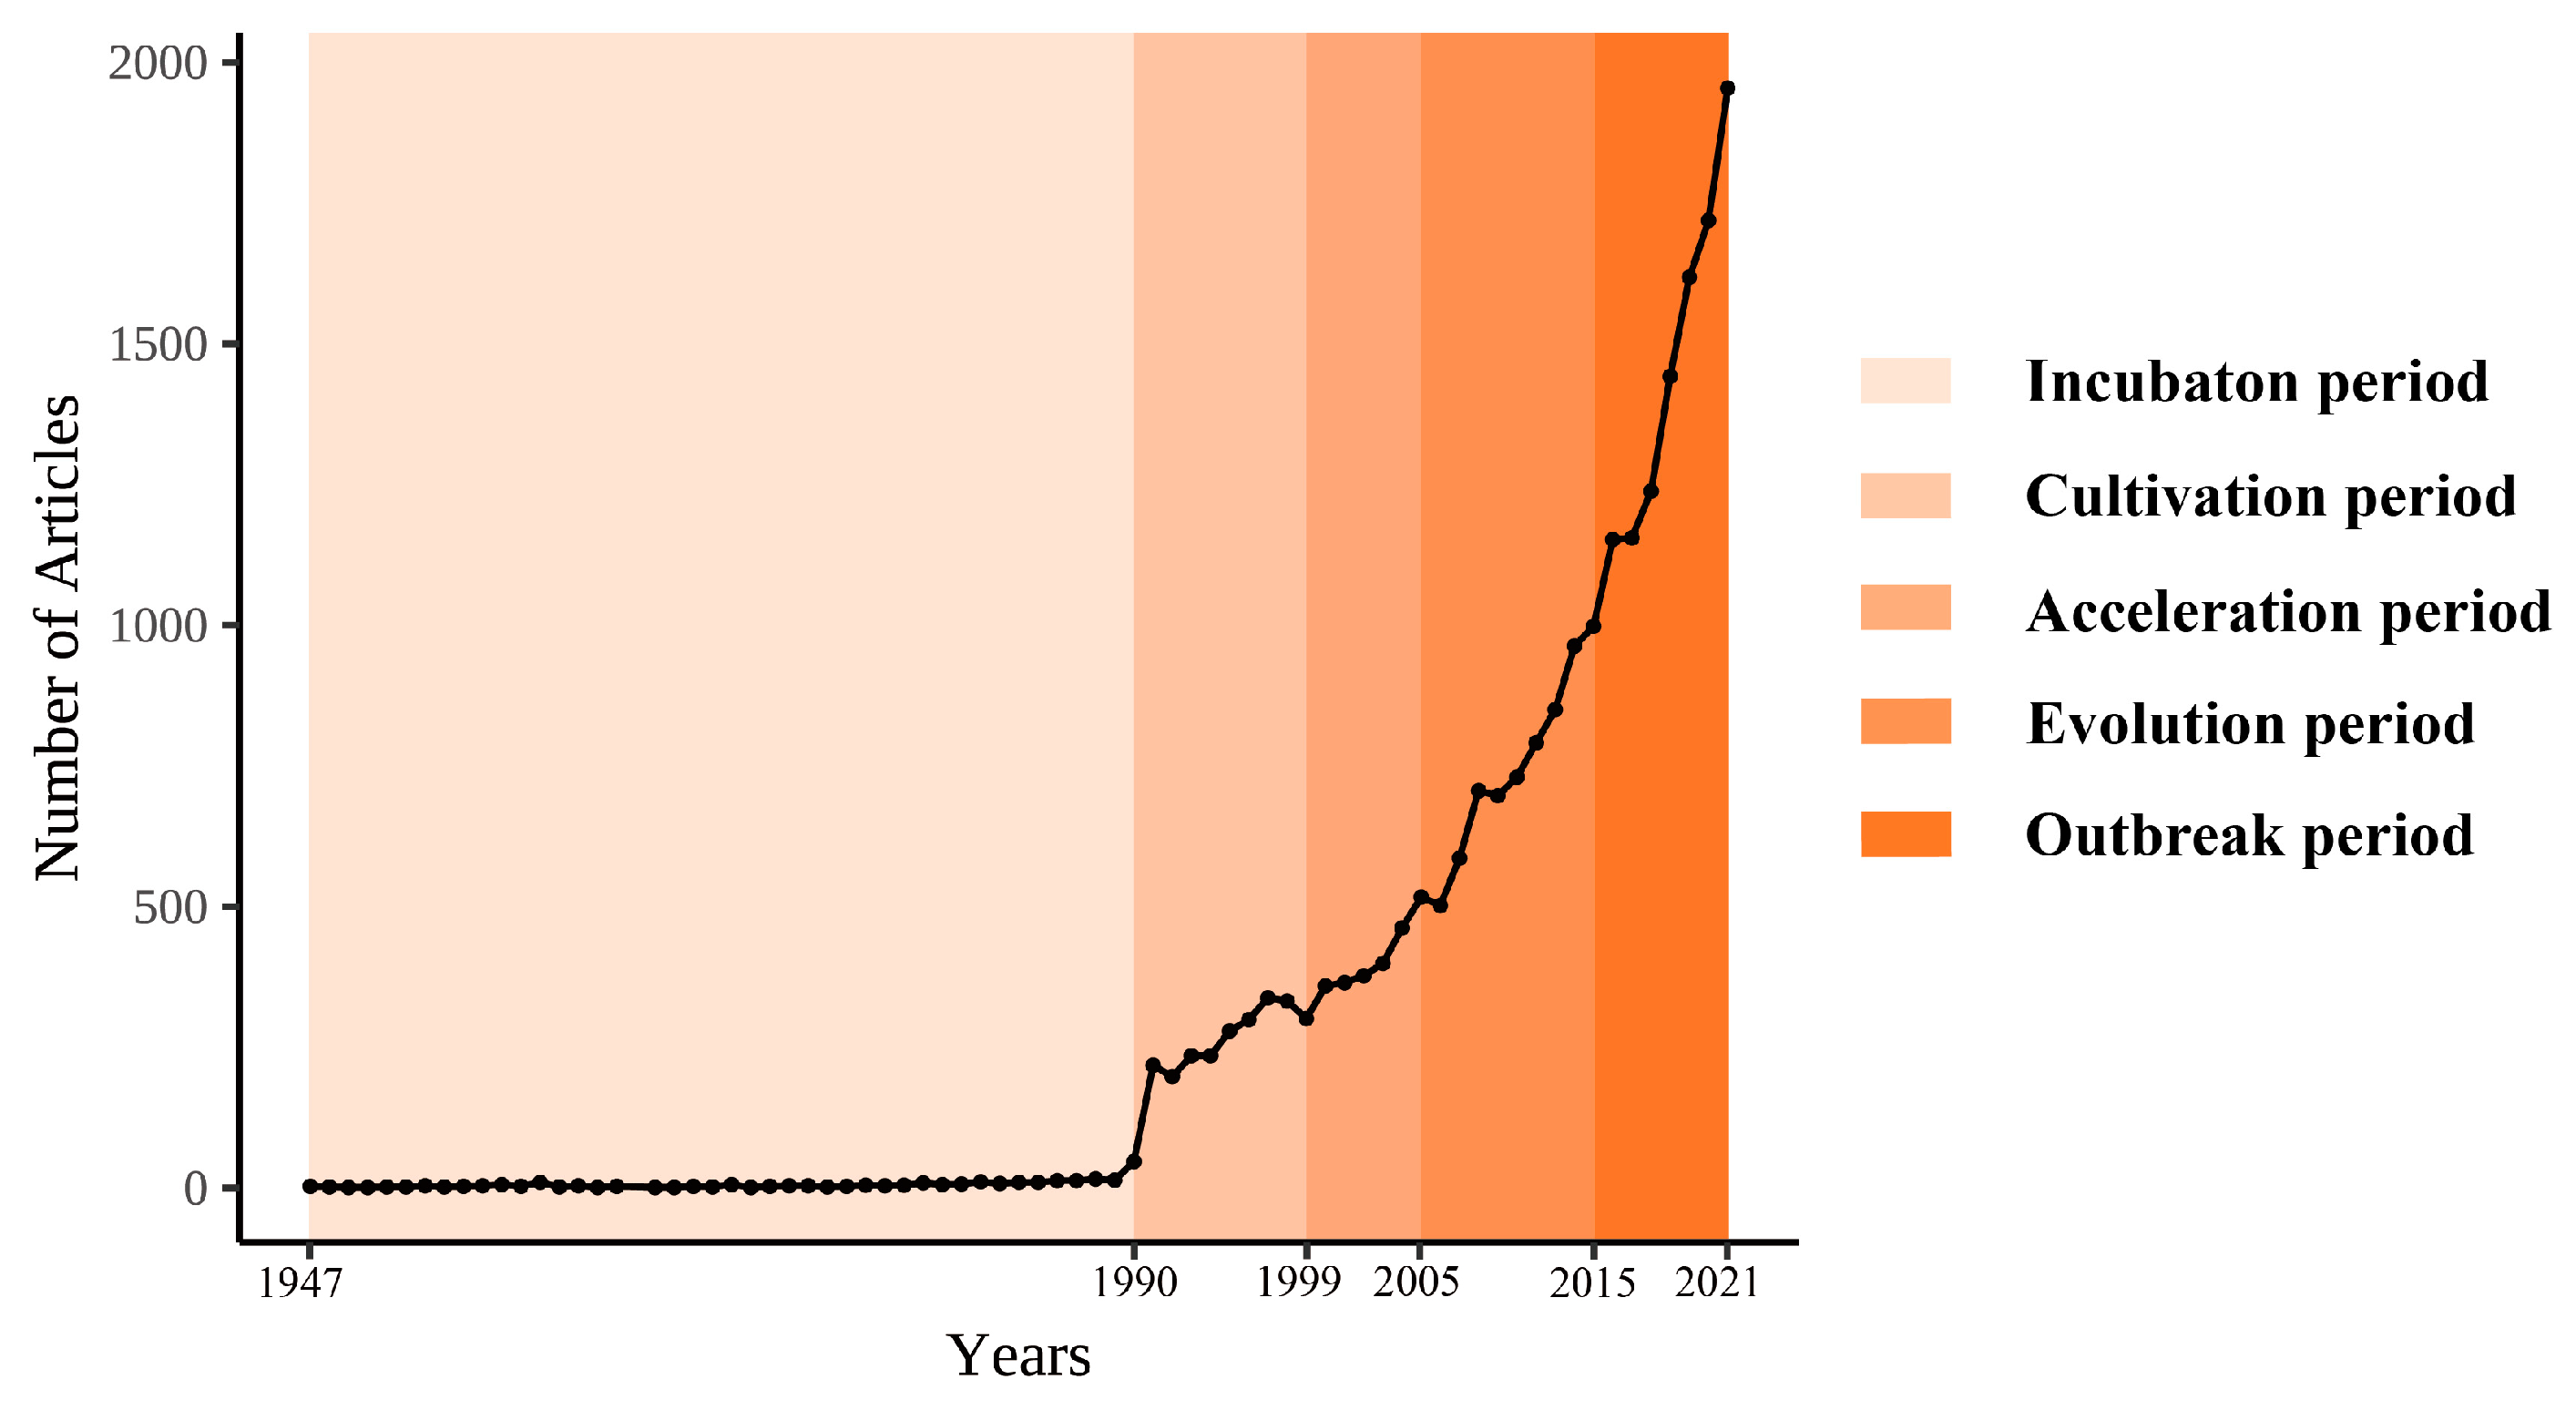
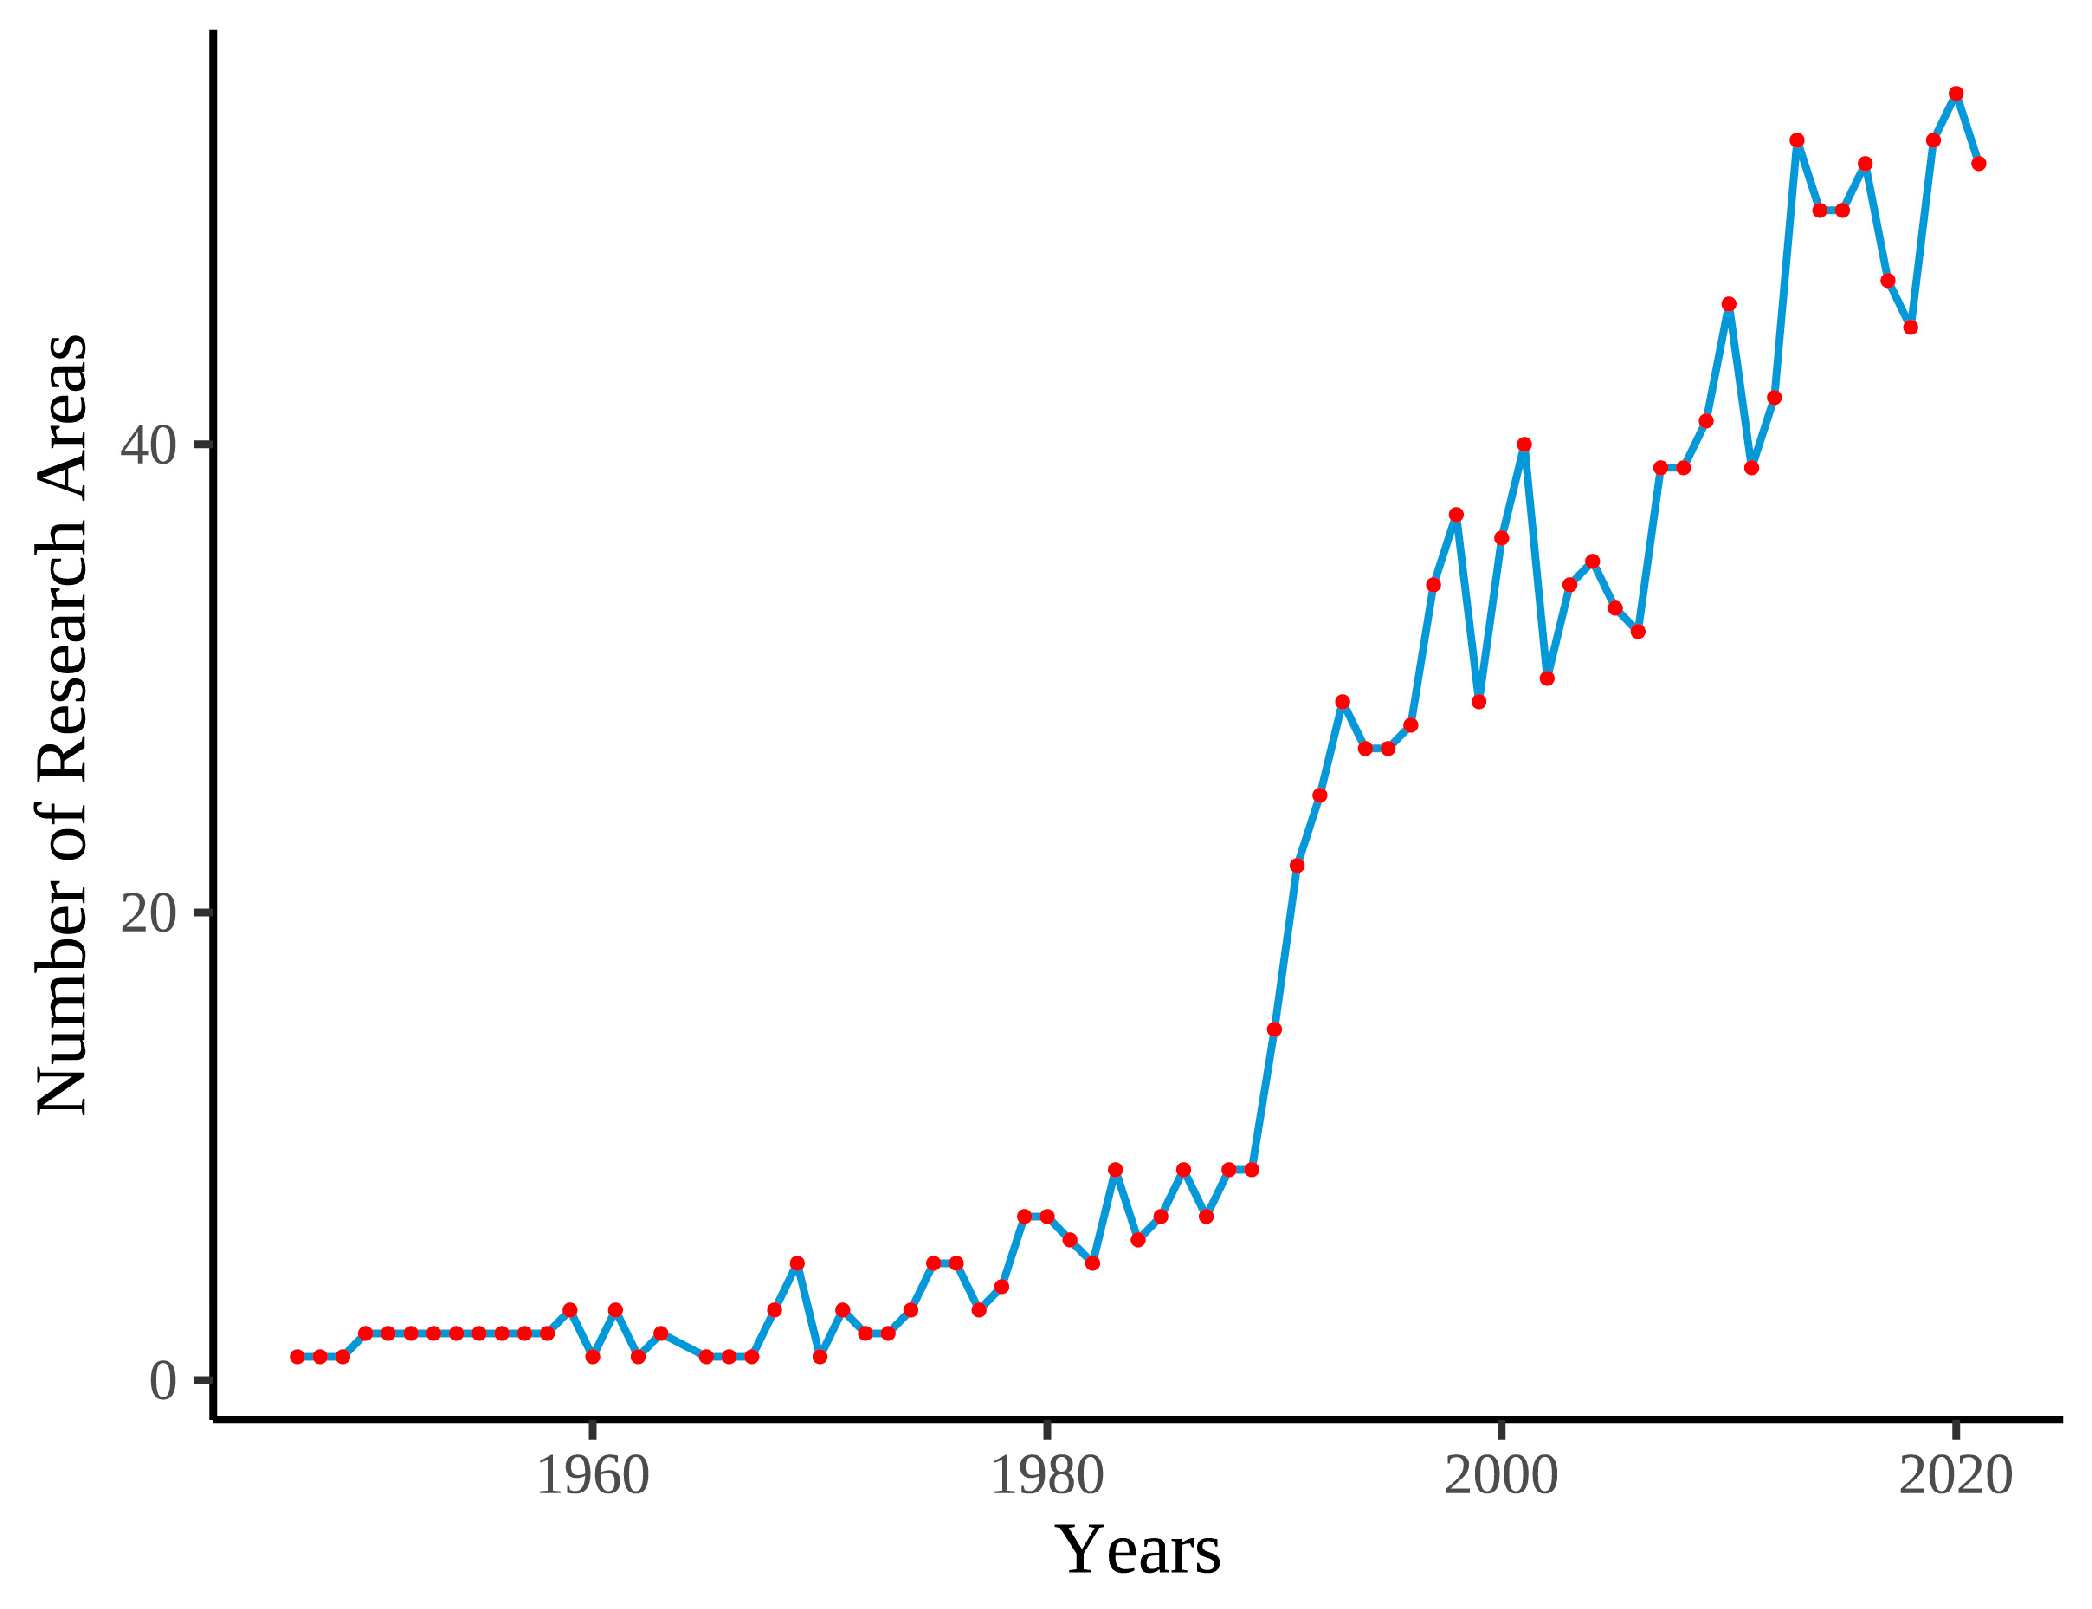
- In terms of the overall development trend, global LAI research has shown a sharp increase since the early 1990s, and it is still very active. The number of publications increased exponentially, from one article in 1947 to 1954 in 2021. For literature growth over time, the 75-year time window was divided into five stages: the incubation, cultivation, acceleration, evolution, and outbreak periods.
- (2)
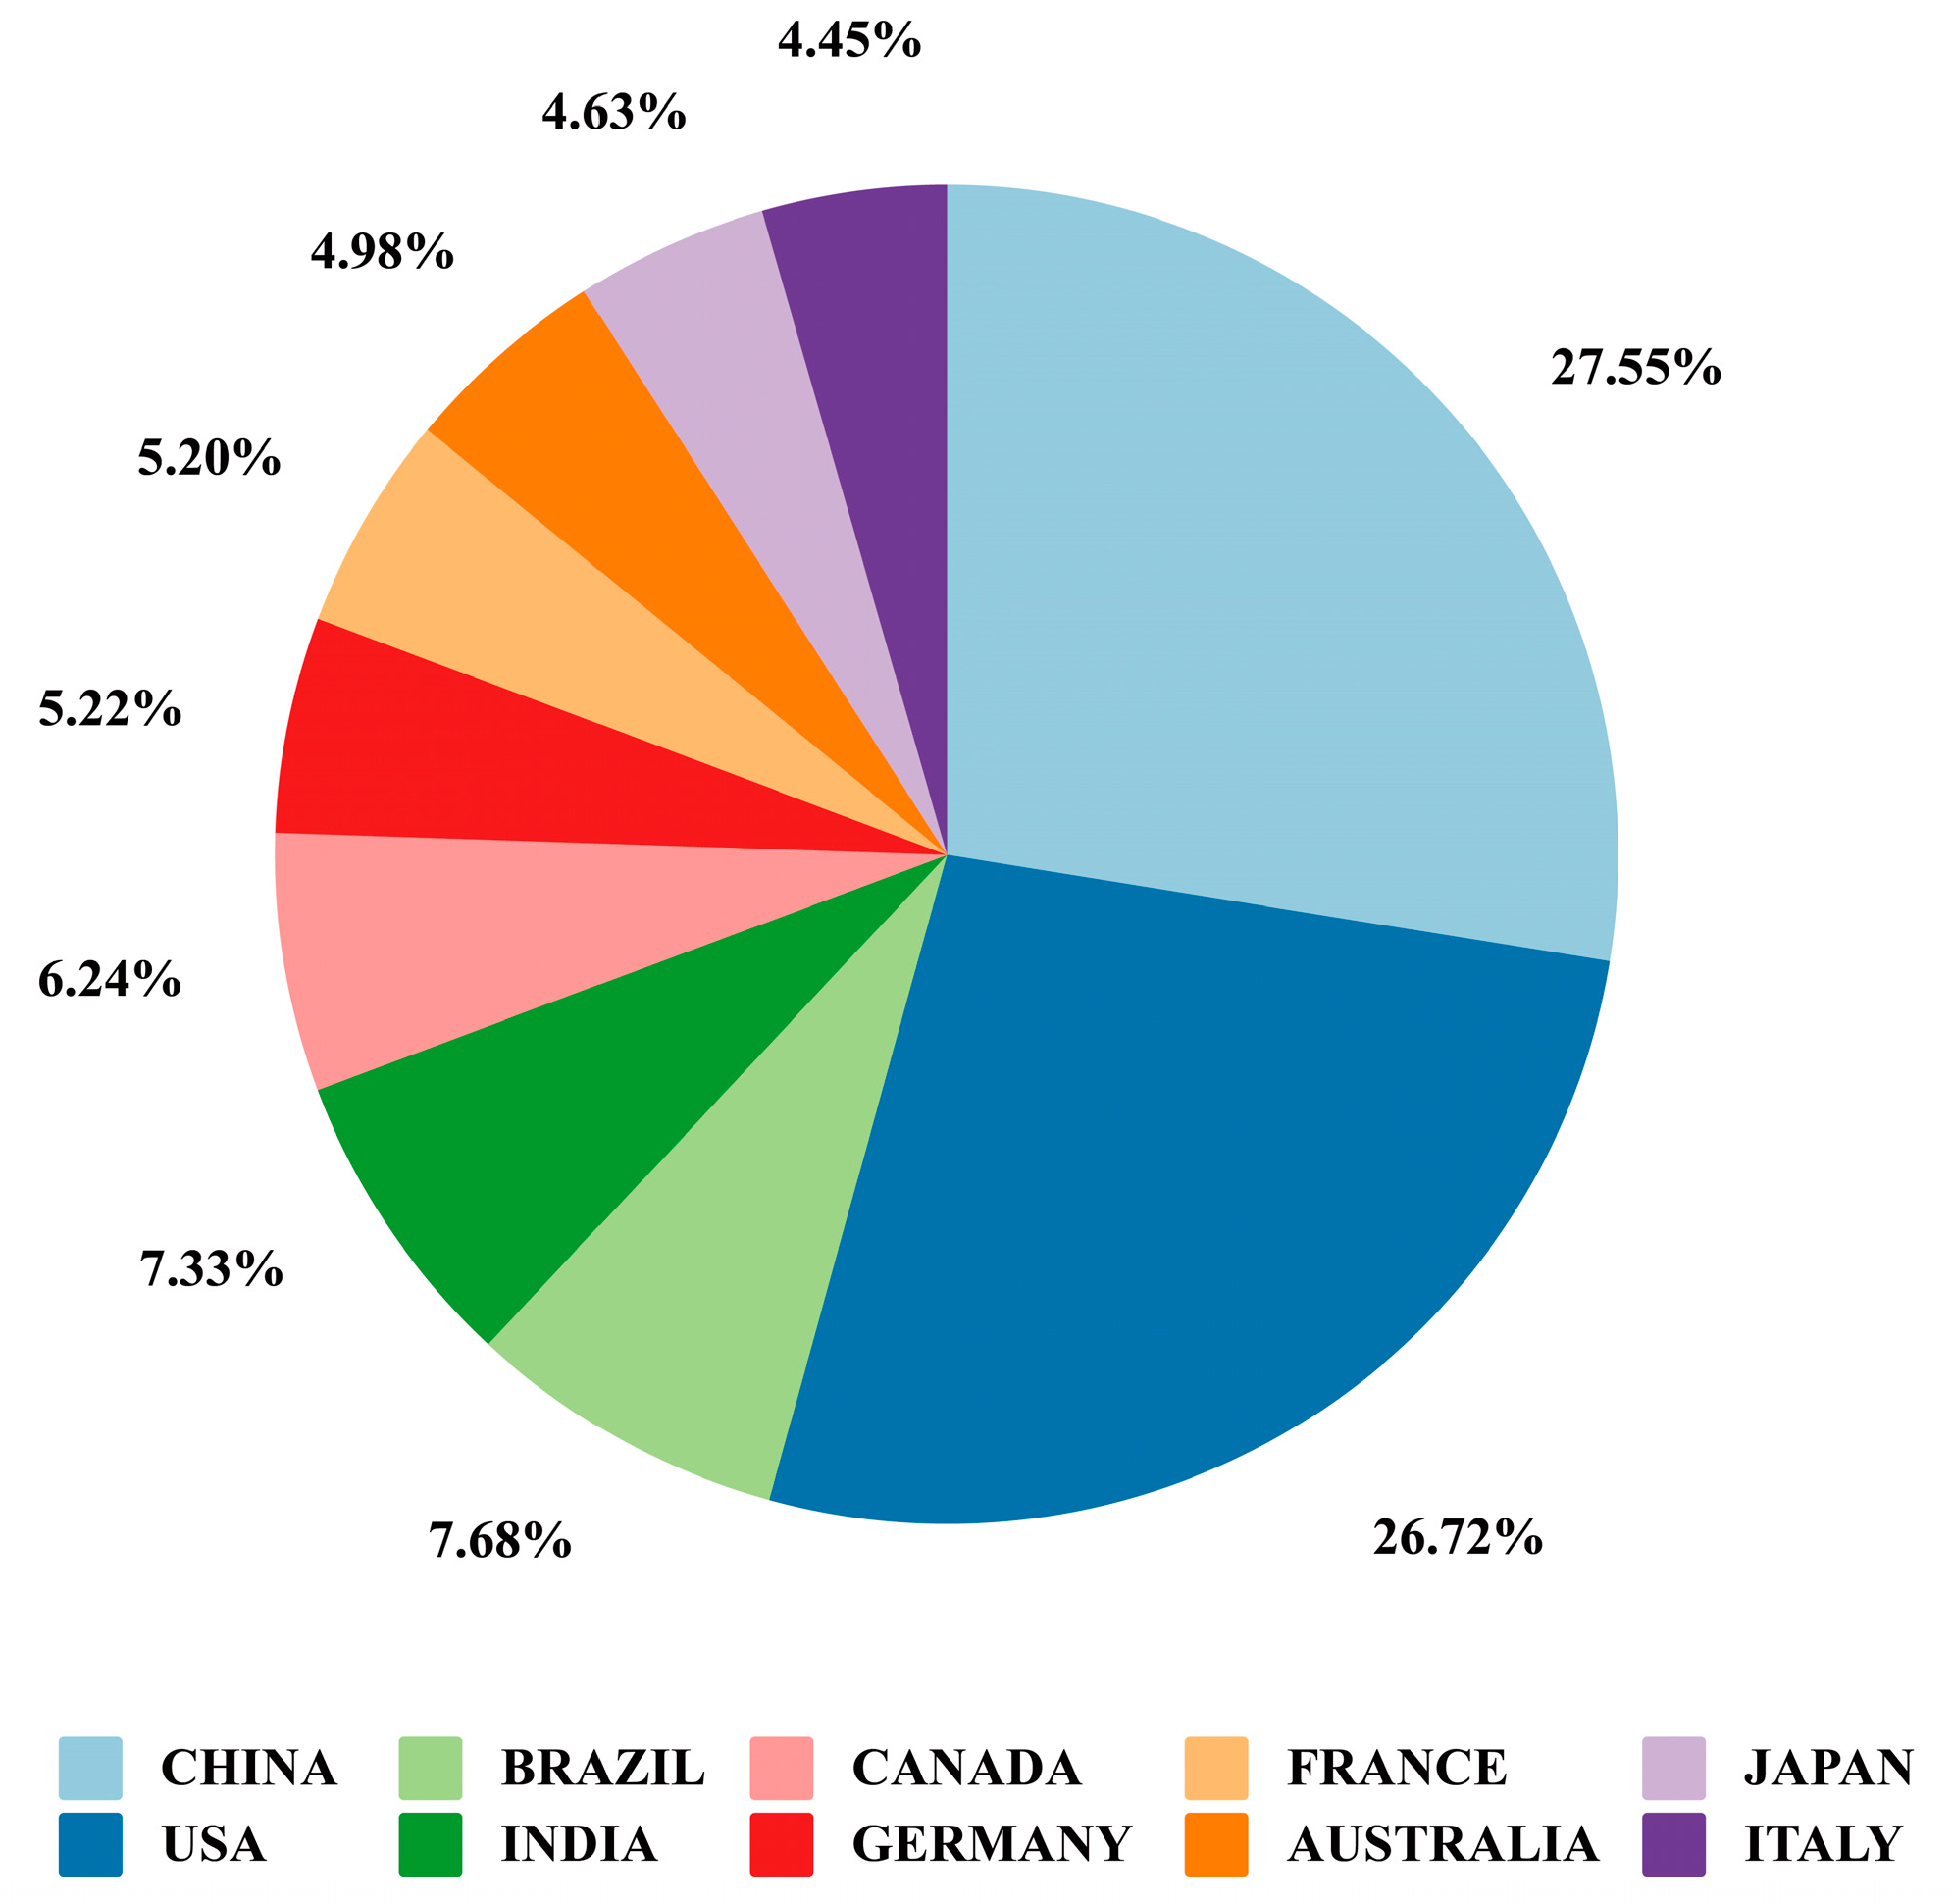
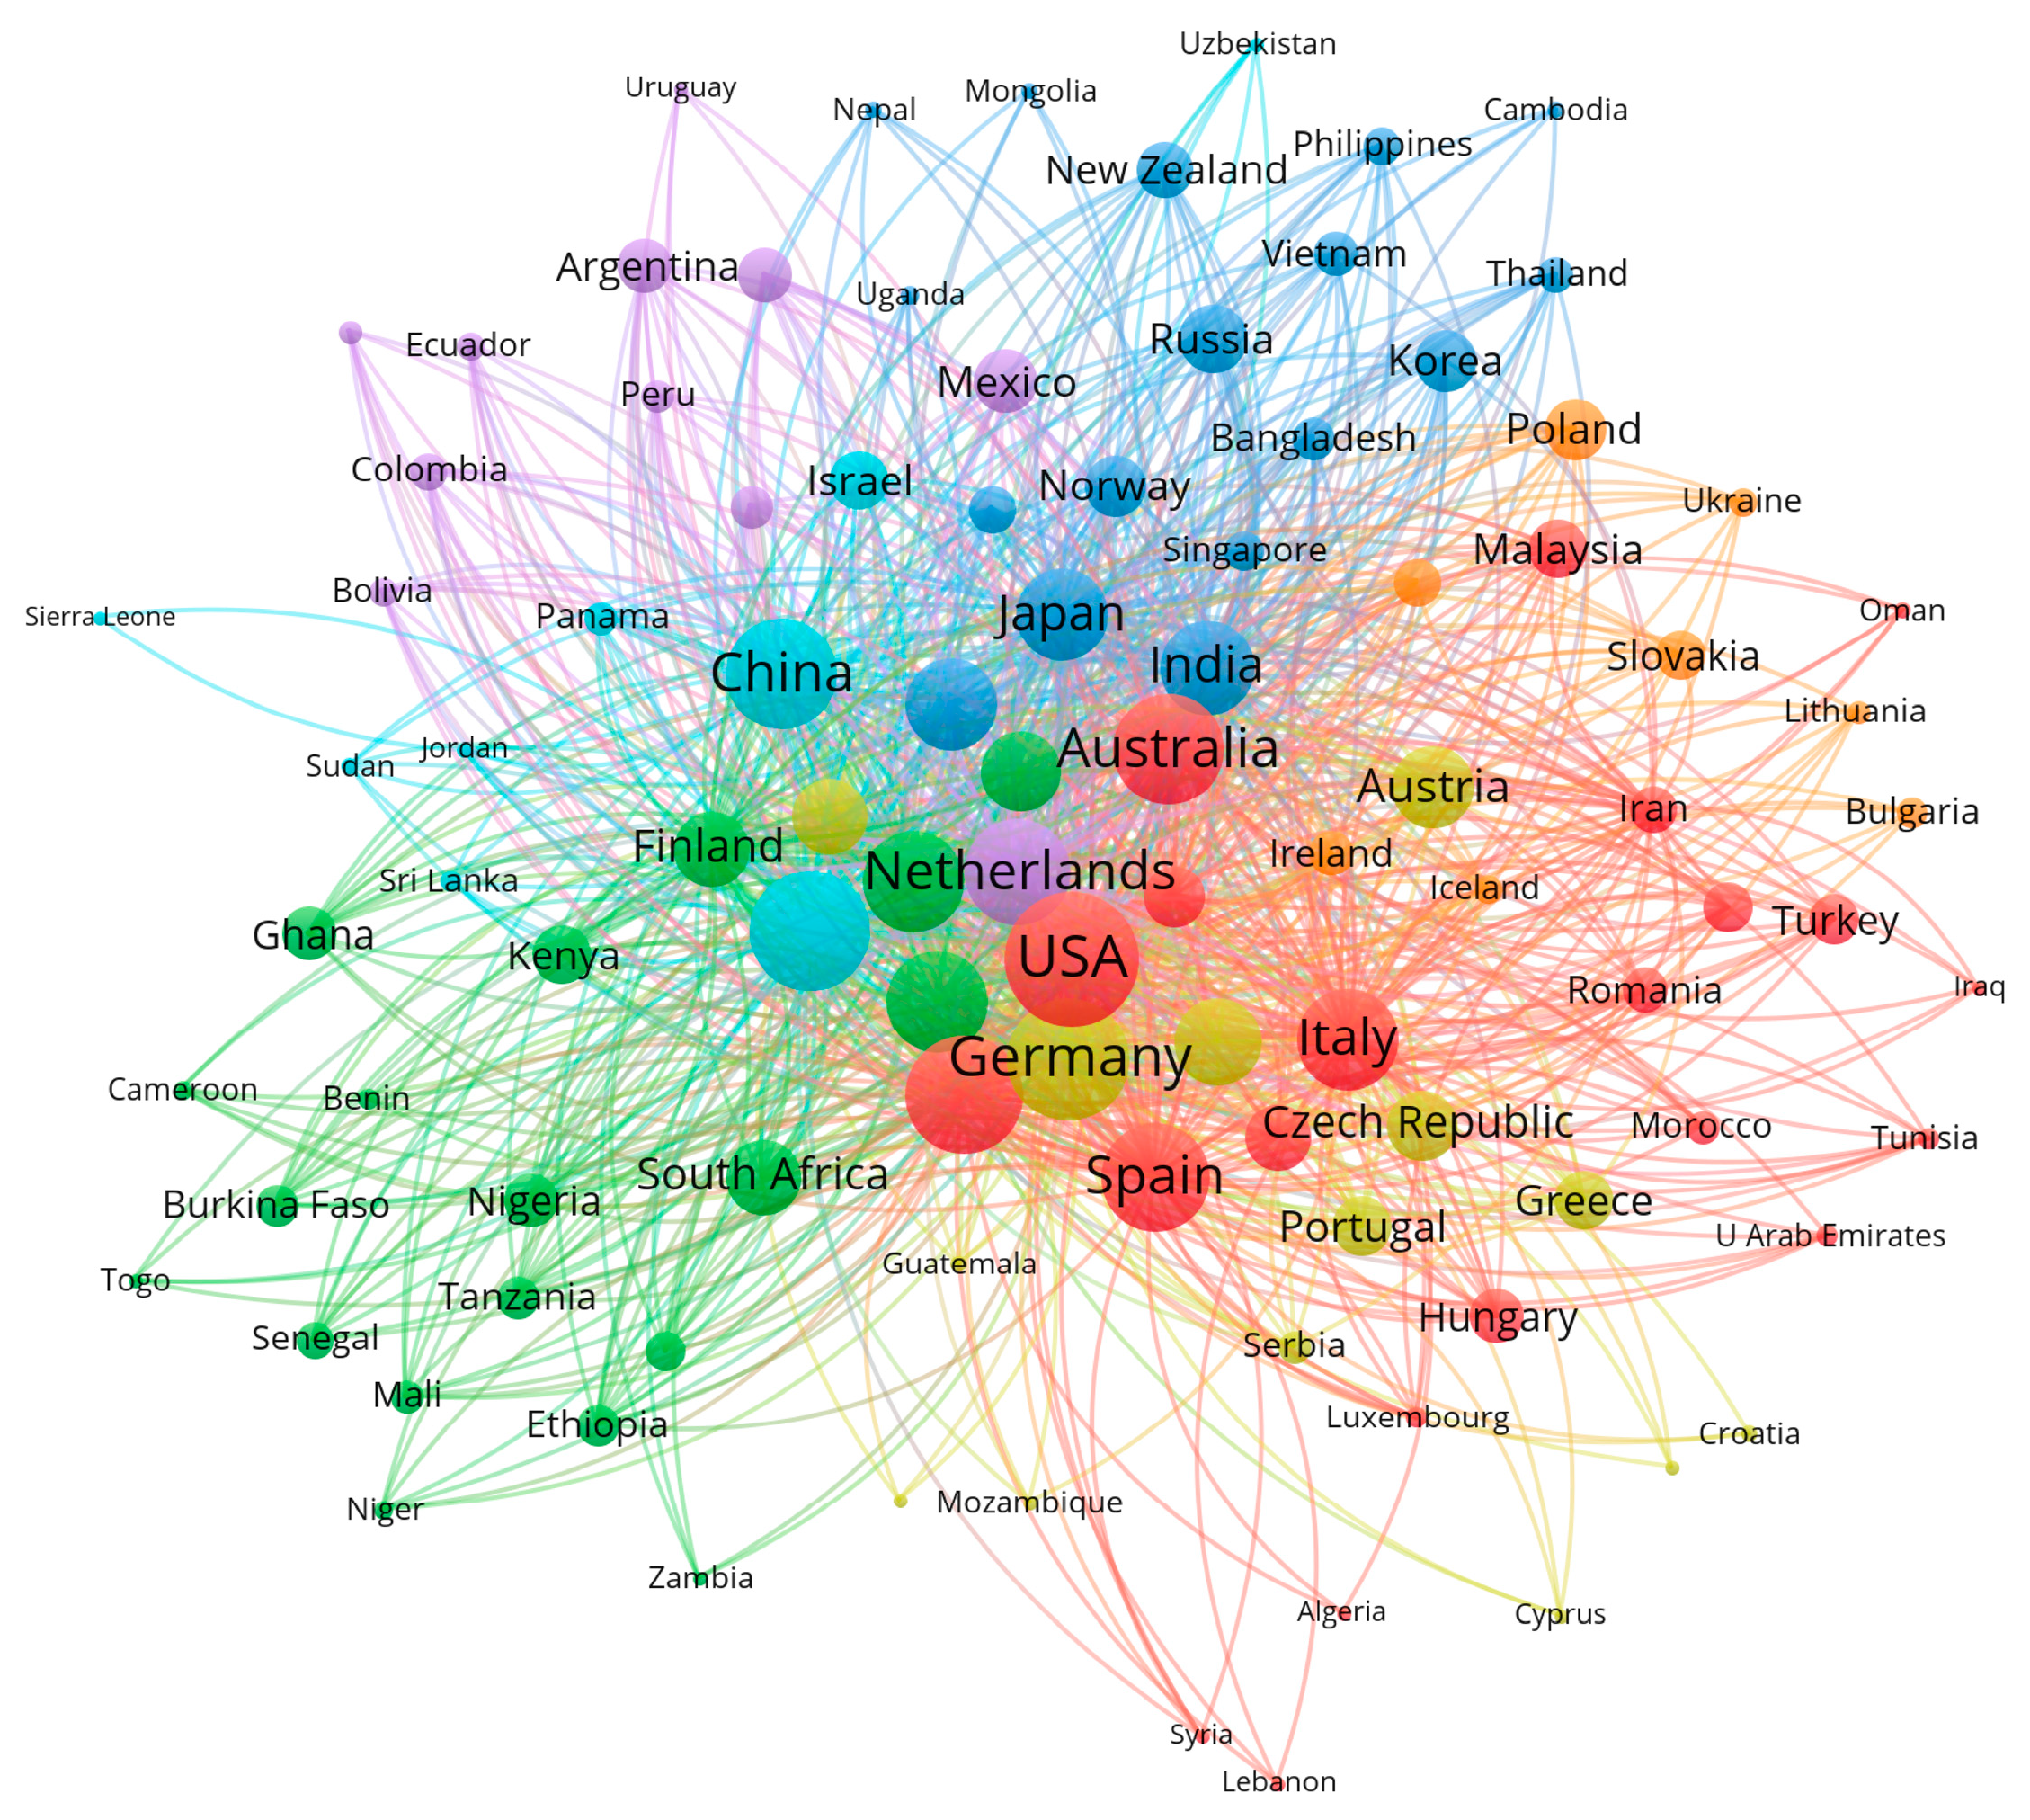
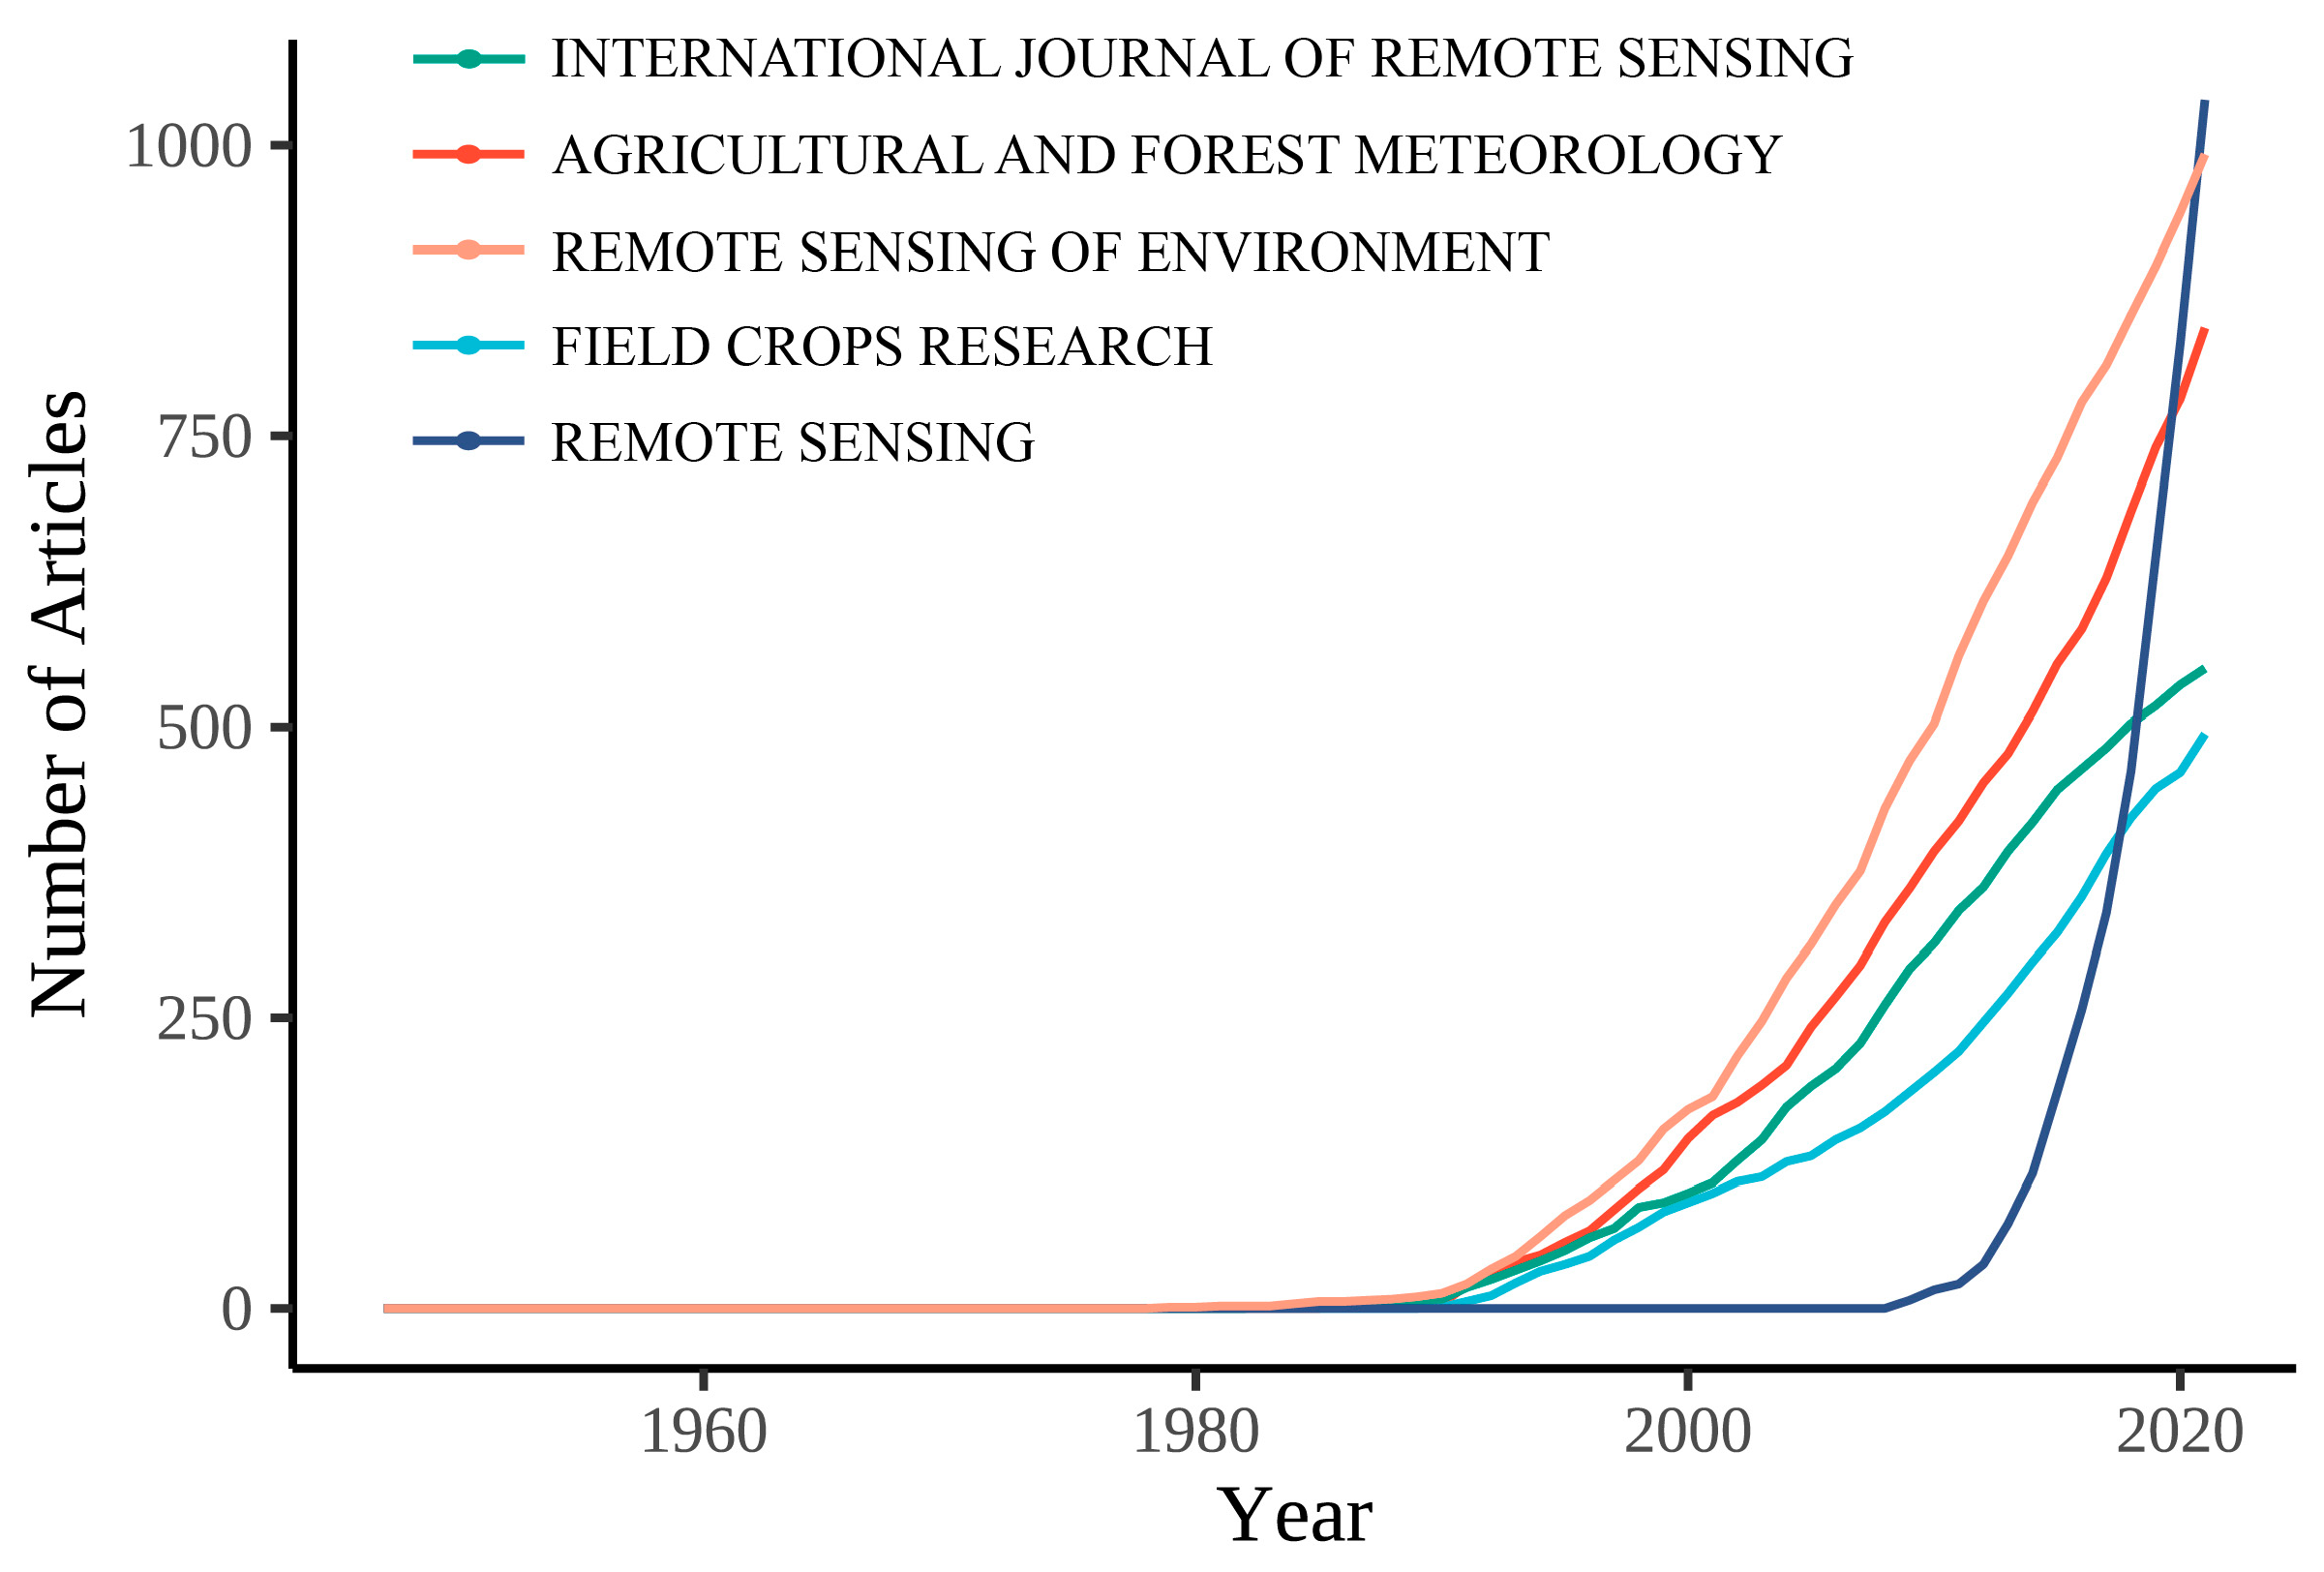
- In terms of the main force of the research, the United States ranked 1st in the paper output in each period, and the University of Arizona and the University of Wisconsin formed the main force in leading and promoting LAI research. For international scientific research cooperation, large-, medium-, and small-scale cooperation networks were formed among different countries. The United States occupied a dominant position in the scientific research cooperation network and established close cooperative relationships with many countries. China, the United States, Brazil, and India were the major countries of LAI research. The most influential journals included Remote Sensing of Environment, Global Change Biology, and IEEE Transactions on Geoscience and Remote Sensing. Chen J.M., Baret F., and Myneni R.B. were the foremost researchers.
- (3)
- In terms of research disciplines and application fields, LAI research involved many disciplines. Agriculture, forestry, vegetation, environmental science and ecology, and remote sensing science are the first significant fields to receive attention. Due to in-depth research and interdisciplinary integration, LAI has gradually expanded to imaging science, photography technology, meteorologies, and atmospheric sciences, such as science, hydrology, and engineering. With the rapid development of satellite remote sensing technology and high-precision sensors, the research fields and research methods involving the LAI are also increasing yearly. Due to scientific research cooperation, geography and landforms, and other factors, different countries have commonalities in selecting research topics, regional differences, and distinctive features.
- (4)
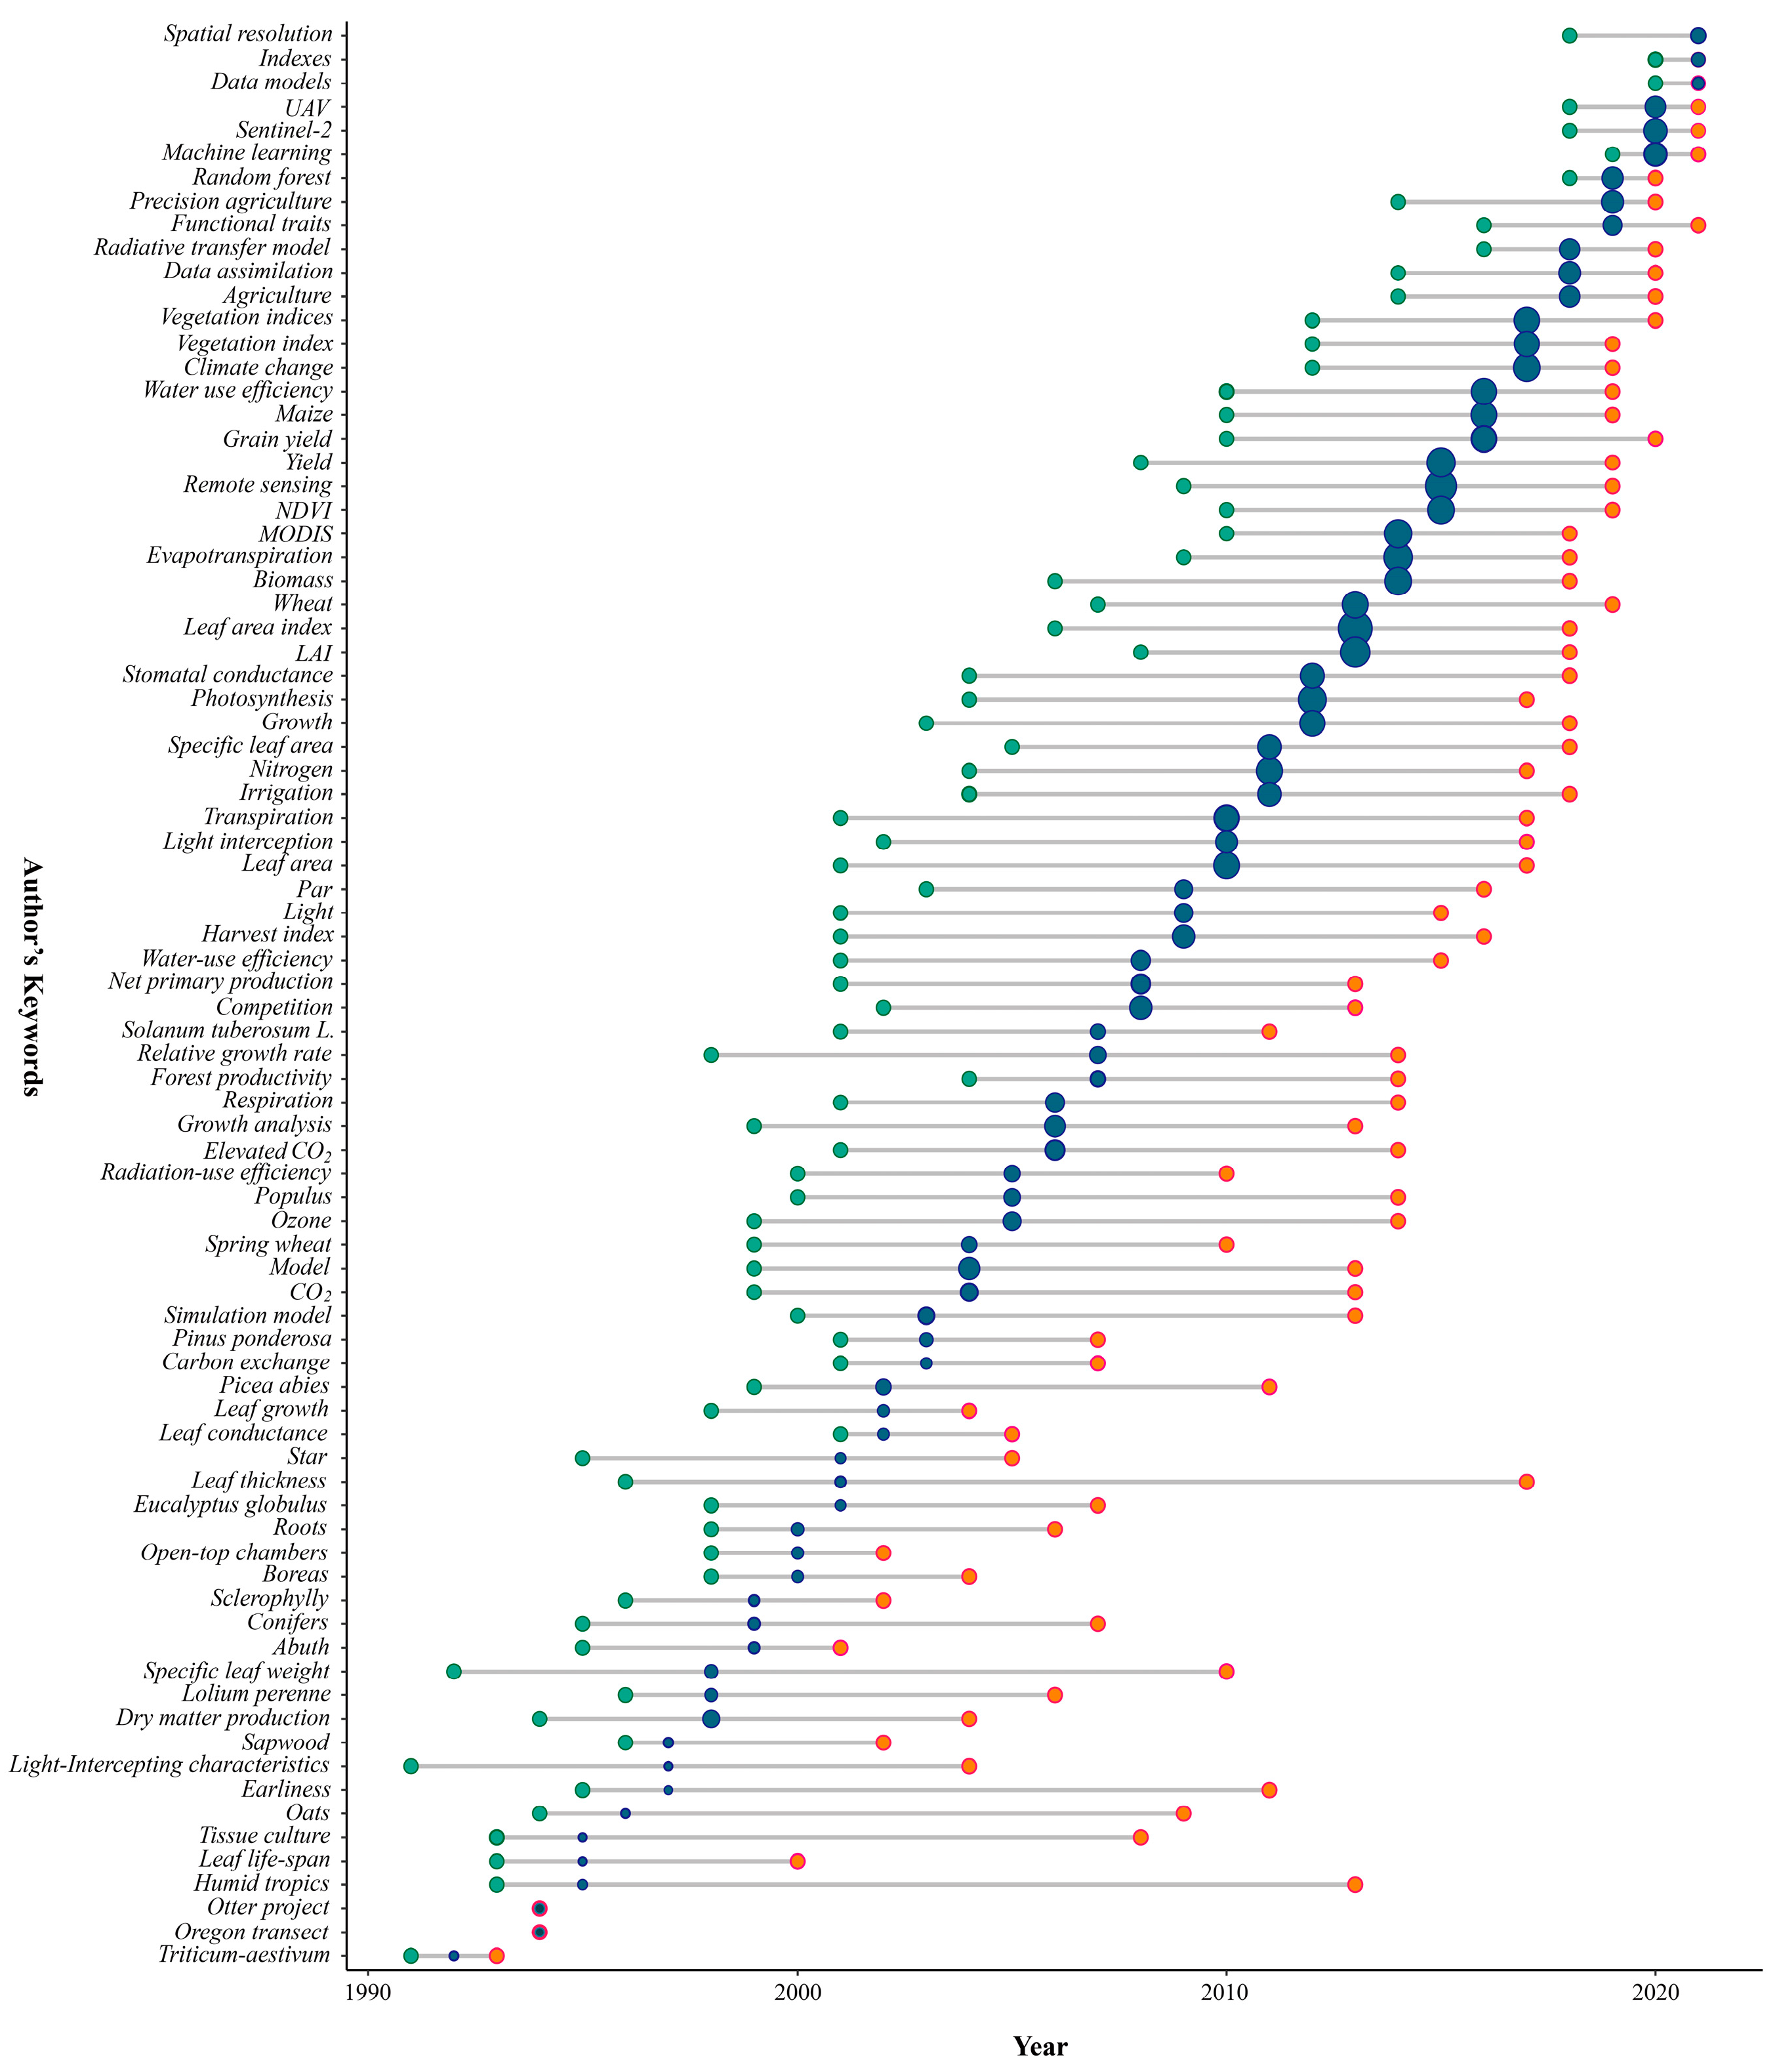
- The LAI research themes showed a substantial stage and ecological development dependence for the evolution of high-frequency words and high-cited papers. Relevant research started from early research on fundamental issues such as “growth”, “yield” and “canopy” and gradually changed to the complex physiological characteristics and essential physiological processes of vegetation, the material cycle and energy flow of ecosystems, global climate change and its ecological effects, and other macro issues. There has also been a focus on global climate change, biodiversity, and other issues in the 21st century. These trends reflect that in the context of social, ecological, and technological development and global change, the scientific issues of LAI research tend to be in-depth and complex, and scientific research tends to cover greater depth and become more integrated.
4.2. Prospects
Supplementary Materials
Author Contributions
Funding
Institutional Review Board Statement
Informed Consent Statement
Data Availability Statement
Acknowledgments
Conflicts of Interest
References
- Seddon, A.W.R.; Macias-Fauria, M.; Long, P.R.; Benz, D.; Willis, K.J. Sensitivity of Global Terrestrial Ecosystems to Climate Variability. Nature 2016, 531, 229–232. [Google Scholar] [CrossRef] [PubMed]
- Heimann, M.; Reichstein, M. Terrestrial Ecosystem Carbon Dynamics and Climate Feedbacks. Nature 2008, 451, 289–292. [Google Scholar] [CrossRef] [PubMed]
- Gerten, D.; Schaphoff, S.; Haberlandt, U.; Lucht, W.; Sitch, S. Terrestrial Vegetation and Water Balance—Hydrological Evaluation of a Dynamic Global Vegetation Model. J. Hydrol. 2004, 286, 249–270. [Google Scholar] [CrossRef]
- Asner, G.P.; Scurlock, J.M.O.; Hicke, J.A. Global Synthesis of Leaf Area Index Observations: Implications for Ecological and Remote Sensing Studies. Glob. Ecol. Biogeogr. 2003, 12, 191–205. [Google Scholar] [CrossRef]
- Chen, J.M.; Rich, P.M.; Gower, S.T.; Norman, J.M.; Plummer, S. Leaf Area Index of Boreal Forests: Theory, Techniques, and Measurements. J. Geophys. Res. Atmos. 1997, 102, 29429–29443. [Google Scholar] [CrossRef]
- Watson, D.J. Comparative Physiological Studies on the Growth of Field Crops: I. Variation in Net Assimilation Rate and Leaf Area between Species and Varieties, and within and between Years. Ann. Bot. 1947, 11, 41–76. [Google Scholar] [CrossRef]
- Chen, J.M.; Black, T.A. Defining Leaf Area Index for Non-Flat Leaves. Plant Cell Environ. 1992, 15, 421–429. [Google Scholar] [CrossRef]
- Fang, H.; Baret, F.; Plummer, S.; Schaepman-Strub, G. An Overview of Global Leaf Area Index (LAI): Methods, Products, Validation, and Applications. Rev. Geophys. 2019, 57, 739–799. [Google Scholar] [CrossRef]
- Garrigues, S.; Lacaze, R.; Baret, F.; Morisette, J.T.; Weiss, M.; Nickeson, J.E.; Fernandes, R.; Plummer, S.; Shabanov, N.V.; Myneni, R.B.; et al. Validation and Intercomparison of Global Leaf Area Index Products Derived from Remote Sensing Data. J. Geophys. Res. Biogeosci. 2008, 113, 20080701. [Google Scholar] [CrossRef]
- Valderrama-Landeros, L.H.; España-Boquera, M.L.; Baret, F. Deforestation in Michoacan, Mexico, From CYCLOPES-LAI Time Series (2000–2006). IEEE J. Sel. Top. Appl. Earth Obs. Remote Sens. 2016, 9, 5398–5405. [Google Scholar] [CrossRef]
- Verger, A.; Filella, I.; Baret, F.; Peñuelas, J. Vegetation Baseline Phenology from Kilometric Global LAI Satellite Products. Remote Sens. Environ. 2016, 178, 1–14. [Google Scholar] [CrossRef]
- Clevers, J.G.P.W. Application of a Weighted Infrared-Red Vegetation Index for Estimating Leaf Area Index by Correcting for Soil Moisture. Remote Sens. Environ. 1989, 29, 25–37. [Google Scholar] [CrossRef]
- Di Bella, C.; Faivre, R.; Ruget, F.; Seguin, B. Using VEGETATION Satellite Data and the Crop Model STICS-Prairie to Estimate Pasture Production at the National Level in France. Phys. Chem. Earth 2005, 30, 3–9. [Google Scholar] [CrossRef]
- Casa, R.; Varella, H.; Buis, S.; Guérif, M.; De Solan, B.; Baret, F. Forcing a Wheat Crop Model with LAI Data to Access Agronomic Variables: Evaluation of the Impact of Model and LAI Uncertainties and Comparison with an Empirical Approach. Eur. J. Agron. 2012, 37, 1–10. [Google Scholar] [CrossRef]
- Delécolle, R.; Maas, S.J.; Guérif, M.; Baret, F. Remote Sensing and Crop Production Models: Present Trends. ISPRS J. Photogramm. Remote Sens. 1992, 47, 145–161. [Google Scholar] [CrossRef]
- Doraiswamy, P.C.; Sinclair, T.R.; Hollinger, S.; Akhmedov, B.; Stern, A.; Prueger, J. Application of MODIS Derived Parameters for Regional Crop Yield Assessment. Remote Sens. Environ. 2005, 97, 192–202. [Google Scholar] [CrossRef]
- Jégo, G.; Pattey, E.; Liu, J. Using Leaf Area Index, Retrieved from Optical Imagery, in the STICS Crop Model for Predicting Yield and Biomass of Field Crops. Field Crops Res. 2012, 131, 63–74. [Google Scholar] [CrossRef]
- Chase, T.N.; Pielke, R.A.; Kittel, T.G.F.; Nemani, R.; Running, S.W. Sensitivity of a General Circulation Model to Global Changes in Leaf Area Index. J. Geophys. Res. Atmos. 1996, 101, 7393–7408. [Google Scholar] [CrossRef]
- van den Hurk, B.J.J.M.; Viterbo, P.; Los, S.O. Impact of Leaf Area Index Seasonality on the Annual Land Surface Evaporation in a Global Circulation Model. J. Geophys. Res. Atmos. 2003, 108, 4191. [Google Scholar] [CrossRef]
- Zeng, Z.; Zhu, Z.; Lian, X.; Li, L.Z.X.; Chen, A.; He, X.; Piao, S. Responses of Land Evapotranspiration to Earth’s Greening in CMIP5 Earth System Models. Environ. Res. Lett. 2016, 11, 104006. [Google Scholar] [CrossRef]
- Boussetta, S.; Balsamo, G.; Dutra, E.; Beljaars, A.; Albergel, C. Assimilation of Surface Albedo and Vegetation States from Satellite Observations and Their Impact on Numerical Weather Prediction. Remote Sens. Environ. 2015, 163, 111–126. [Google Scholar] [CrossRef]
- Buermann, W.; Anderson, B.; Tucker, C.J.; Dickinson, R.E.; Lucht, W.; Potter, C.S.; Myneni, R.B. Interannual Covariability in Northern Hemisphere Air Temperatures and Greenness Associated with El Niño-Southern Oscillation and the Arctic Oscillation. J. Geophys. Res. Atmos. 2003, 108, 4396. [Google Scholar] [CrossRef]
- Guillevic, P.; Koster, R.D.; Suarez, M.J.; Bounoua, L.; Collatz, G.J.; Los, S.O.; Mahanama, S.P.P. Influence of the Interannual Variability of Vegetation on the Surface Energy Balance—A Global Sensitivity Study. J. Hydrometeorol. 2002, 3, 617–629. [Google Scholar] [CrossRef]
- Jarlan, L.; Balsamo, G.; Lafont, S.; Beljaars, A.; Calvet, J.C.; Mougin, E. Analysis of Leaf Area Index in the ECMWF Land Surface Model and Impact on Latent Heat and Carbon Fluxes: Application to West Africa. J. Geophys. Res. Atmos. 2008, 113, 24117. [Google Scholar] [CrossRef]
- Gregoire, T.G.; Valentine, H.T.; Furnival, G.M. Sampling Methods to Estimate Foliage and Other Characteristics of Individual Trees. Ecology 1995, 76, 1181–1194. [Google Scholar] [CrossRef]
- Turner, D.P.; Acker, S.A.; Means, J.E.; Garman, S.L. Assessing Alternative Allometric Algorithms for Estimating Leaf Area of Douglas-Fir Trees and Stands. For. Ecol. Manag. 2000, 126, 61–76. [Google Scholar] [CrossRef]
- Reinhardt, E.; Scott, J.; Gray, K.; Keane, R. Estimating Canopy Fuel Characteristics in Five Conifer Stands in the Western United States Using Tree and Stand Measurements. Can. J. For. Res. 2006, 36, 2803–2814. [Google Scholar] [CrossRef]
- Stenberg, P.; Linder, S.; Smolander, H.; Flower-Ellis, J. Performance of the LAI-2000 Plant Canopy Analyzer in Estimating Leaf Area Index of Some Scots Pine Stands. Tree Physiol. 1994, 14, 981–995. [Google Scholar] [CrossRef]
- Peper, P.J.; McPherson, E.G. Comparison of Five Methods for Estimating Leaf Area Index of Open-Grown Deciduous Trees. J. Arboric. 1998, 24, 98–111. [Google Scholar] [CrossRef]
- Yu, Y.; Wang, J.; Liu, G.; Cheng, F. Forest Leaf Area Index Inversion Based on Landsat OLI Data in the Shangri-La City. J. Indian Soc. Remote Sens. 2019, 47, 967–976. [Google Scholar] [CrossRef]
- Bunnik, N.J.J. The Multispectral Reflectance of Shortwave Radiation by Agricultural Crops in Relation with Their Morphological and Optical Properties; Veenman: Wageningen, The Netherlands, 1978. [Google Scholar]
- Nemani, R.R.; Running, S.W.; Pielke, R.A.; Chase, T.N. Global Vegetation Cover Changes from Coarse Resolution Satellite Data. J. Geophys. Res. Atmos. 1996, 101, 7157–7162. [Google Scholar] [CrossRef]
- Ganguly, S.; Nemani, R.R.; Zhang, G.; Hashimoto, H.; Milesi, C.; Michaelis, A.; Wang, W.; Votava, P.; Samanta, A.; Melton, F.; et al. Generating Global Leaf Area Index from Landsat: Algorithm Formulation and Demonstration. Remote Sens. Environ. 2012, 122, 185–202. [Google Scholar] [CrossRef]
- Dusseux, P.; Gong, X.; Hubert-Moy, L.; Corpetti, T. Identification of Grassland Management Practices from Leaf Area Index Time Series. JARS 2014, 8, 083559. [Google Scholar] [CrossRef]
- Gitelson, A.A.; Kaufman, Y.J.; Merzlyak, M.N. Use of a Green Channel in Remote Sensing of Global Vegetation from EOS-MODIS. Remote Sens. Environ. 1996, 58, 289–298. [Google Scholar] [CrossRef]
- Córcoles, J.I.; Ortega, J.F.; Hernández, D.; Moreno, M.A. Estimation of Leaf Area Index in Onion (Allium Cepa L.) Using an Unmanned Aerial Vehicle. Biosyst. Eng. 2013, 115, 31–42. [Google Scholar] [CrossRef]
- Kessler, M.M. Bibliographic Coupling between Scientific Papers. J. Assoc. Inf. Sci. Technol. 1963, 14, 10–25. [Google Scholar] [CrossRef]
- Small, H. Co-Citation in the Scientific Literature: A New Measure of the Relationship between Two Documents. J. Am. Soc. Inf. Sci. 1973, 24, 265–269. [Google Scholar] [CrossRef]
- Pritchard, A. Statistical Bibliography or Bibliometrics. J. Doc. 1969, 25, 348. [Google Scholar]
- Zupic, I.; Čater, T. Bibliometric Methods in Management and Organization. Organ. Res. Methods 2015, 18, 429–472. [Google Scholar] [CrossRef]
- Zyoud, S.H.; Zyoud, A.H. Coronavirus Disease-19 in Environmental Fields: A Bibliometric and Visualization Mapping Analysis. Environ. Dev. Sustain. 2021, 23, 8895–8923. [Google Scholar] [CrossRef]
- Chen, C.M. CiteSpace II: Detecting and visualizing emerging trends and transient patterns in scientific literature. J. Am. Soc. Inf. Sci. Technol. 2006, 57, 359–377. [Google Scholar] [CrossRef] [Green Version]
- Derviş, H. Bibliometric analysis using Bibliometrix an R Package. J. Scientom. Res. 2019, 8, 156–160. [Google Scholar] [CrossRef]
- Olle, P.; Danell, R.; Schneider, J.W. How to use Bibexcel for various types of bibliometric analysis. In Celebrating Scholarly Communication Studies: A Festschrift for Olle Persson at his 60th Birthday; ISSI: Leuven, Belgium, 2009; Volume 5, pp. 9–24. [Google Scholar]
- Kumar, S.; Tiwari, C.; Deepu, M. Contribution to Indian Sociology: A Bibliometric Study. Lang. India 2012, 12, 650–674. [Google Scholar]
- Hérubel, J.P.V.M. Historical Bibliometrics: Its Purpose and Significance to the History of Disciplines. Libr. Cult. 1999, 34, 380–388. [Google Scholar]
- Xuemei, W.; Mingguo, M.; Xin, L.; Zhiqiang, Z. Applications and Researches of Geographic Information System Technologies in Bibliometrics. Earth Sci. Inform. 2014, 7, 147–152. [Google Scholar] [CrossRef]
- Romanelli, J.P.; Fujimoto, J.T.; Ferreira, M.D.; Milanez, D.H. Assessing Ecological Restoration as a Research Topic Using Bibliometric Indicators. Ecol. Eng. 2018, 120, 311–320. [Google Scholar] [CrossRef]
- Xu, Y.; Yang, Y.; Chen, X.; Liu, Y. Bibliometric Analysis of Global NDVI Research Trends from 1985 to 2021. Remote Sens. 2022, 14, 3967. [Google Scholar] [CrossRef]
- Zhang, H.; Huang, M.; Qing, X.; Li, G.; Tian, C. Bibliometric Analysis of Global Remote Sensing Research during 2010–2015. ISPRS Int. J. Geoinf. 2017, 6, 332. [Google Scholar] [CrossRef]
- Zhang, Y.; Chen, Y. Research Trends and Areas of Focus on the Chinese Loess Plateau: A Bibliometric Analysis during 1991–2018. Catena 2020, 194, 104798. [Google Scholar] [CrossRef]
- Li, T.; Cui, L.; Xu, Z.; Hu, R.; Joshi, P.K.; Song, X.; Tang, L.; Xia, A.; Wang, Y.; Guo, D.; et al. Quantitative Analysis of the Research Trends and Areas in Grassland Remote Sensing: A Scientometrics Analysis of Web of Science from 1980 to 2020. Remote Sens. 2021, 13, 1279. [Google Scholar] [CrossRef]
- Tamiminia, H.; Salehi, B.; Mahdianpari, M.; Quackenbush, L.; Adeli, S.; Brisco, B. Google Earth Engine for Geo-Big Data Applications: A Meta-Analysis and Systematic Review. ISPRS J. Photogramm. Remote Sens. 2020, 164, 152–170. [Google Scholar] [CrossRef]
- Zhao, Q.; Yu, L.; Du, Z.; Peng, D.; Hao, P.; Zhang, Y.; Gong, P. An Overview of the Applications of Earth Observation Satellite Data: Impacts and Future Trends. Remote Sens. 2022, 14, 1863. [Google Scholar] [CrossRef]
- Raan, T. Advances in Bibliometric Analysis: Research Performance Assessment and Science Mapping. In Bibliometrics: Use and Abuse in the Review of Research Performance; Portland Press Ltd.: London, UK, 2014; Volume 87, pp. 17–28. ISBN 978-1-85578-195-5. [Google Scholar]
- Vickery, B.C. Bradford’s Law of Scattering. J. Doc. 1948, 4, 198–203. [Google Scholar] [CrossRef]
- Nicholls, P.T. Bibliometric Modeling Processes and the Empirical Validity of Lotka’s Law. J. Am. Soc. Inf. Sci. 1989, 40, 379–385. [Google Scholar] [CrossRef]
- Adamic, L.; Huberman, B. Zipfs Law and the Internet. Glottometrics 2002, 3, 143–150. [Google Scholar]
- Aria, M.; Cuccurullo, C. Bibliometrix: An R-Tool for Comprehensive Science Mapping Analysis. J. Informetr. 2017, 11, 959–975. [Google Scholar] [CrossRef]
- Tranfield, D.; Denyer, D.; Smart, P. Towards a Methodology for Developing Evidence-Informed Management Knowledge by Means of Systematic Review. Brit. J. Manag. 2003, 14, 207–222. [Google Scholar] [CrossRef]
- Price, D.D.S. A General Theory of Bibliometric and Other Cumulative Advantage Processes. J. Am. Soc. Inf. Sci. 1976, 27, 292–306. [Google Scholar] [CrossRef]
- Read, K.L.; Ashford, J.R. A System of Models for the Life Cycle of a Biological Organism. Biometrika 1968, 55, 211–221. [Google Scholar] [CrossRef]
- Kinder, D.R. Politics and the Life Cycle. Science 2006, 312, 1905–1908. [Google Scholar] [CrossRef]
- Mateos-Planas, X. Demographics and the Politics of Capital Taxation in a Life-Cycle Economy. Am. Econ. Rev. 2010, 100, 337–363. [Google Scholar] [CrossRef]
- Hobson, K.; Lynch, N. Ecological Modernization, Techno-Politics and Social Life Cycle Assessment: A View from Human Geography. Int. J. Life Cycle Assess. 2018, 23, 456–463. [Google Scholar] [CrossRef]
- Val, D.V.; Stewart, M.G. Life-Cycle Cost Analysis of Reinforced Concrete Structures in Marine Environments. Struct. Saf. 2003, 25, 343–362. [Google Scholar] [CrossRef]
- Ciroth, A. ICT for Environment in Life Cycle Applications OpenLCA—A New Open-Source Software for Life Cycle Assessment. Int. J. Life Cycle Assess. 2007, 12, 209. [Google Scholar] [CrossRef]
- Alting, L. Life Cycle Engineering and Design. CIRP Ann. 1995, 44, 569–580. [Google Scholar] [CrossRef]
- Guinée, J.B.; Heijungs, R.; Huppes, G.; Zamagni, A.; Masoni, P.; Buonamici, R.; Ekvall, T.; Rydberg, T. Life Cycle Assessment: Past, Present, and Future. Environ. Sci. Technol. 2011, 45, 90–96. [Google Scholar] [CrossRef]
- Kasavan, S.; Yusoff, S.; Guan, N.C.; Zaman, N.S.K.; Fakri, M.F.R. Global Trends of Textile Waste Research from 2005 to 2020 Using Bibliometric Analysis. Environ. Sci. Pollut. Res. 2021, 28, 44780–44794. [Google Scholar] [CrossRef]
- Lomazzi, M.; Borisch, B.; Laaser, U. The Millennium Development Goals: Experiences, Achievements and What’s Next. Glob. Health Action 2014, 7, 23695. [Google Scholar] [CrossRef]
- Wang, Q.; Adiku, S.; Tenhunen, J.; Granier, A. On the Relationship of NDVI with Leaf Area Index in a Deciduous Forest Site. Remote Sens. Environ. 2005, 94, 244–255. [Google Scholar] [CrossRef]
- Davi, H.; Soudani, K.; Deckx, T.; Dufrene, E.; Le Dantec, V.; FranÇois, C. Estimation of Forest Leaf Area Index from SPOT Imagery Using NDVI Distribution over Forest Stands. Int. J. Remote Sens. 2006, 27, 885–902. [Google Scholar] [CrossRef]
- Pontailler, J.Y.; Hymus, G.J.; Drake, B.G. Estimation of Leaf Area Index Using Ground-Based Remote Sensed NDVI Measurements: Validation and Comparison with Two Indirect Techniques. Can. J. Remote Sens. 2003, 29, 381–387. [Google Scholar] [CrossRef]
- Darvishzadeh, R.; Atzberger, C.; Skidmore, A.K.; Abkar, A.A. Leaf Area Index Derivation from Hyperspectral Vegetation Indicesand the Red Edge Position. Int. J. Remote Sens. 2009, 30, 6199–6218. [Google Scholar] [CrossRef]
- Danson, F.M.; Plummer, S.E. Red-Edge Response to Forest Leaf Area Index. Int. J. Remote Sens. 1995, 16, 183–188. [Google Scholar] [CrossRef]
- Campoy, J.; Campos, I.; Plaza, C.; Calera, M.; Bodas, V.; Calera, A. Estimation of Harvest Index in Wheat Crops Using a Remote Sensing-Based Approach. Field Crops Res. 2020, 256, 107910. [Google Scholar] [CrossRef]
- Ren, J.; Zhang, N.; Liu, X.; Wu, S.; Li, D. Dynamic Harvest Index Estimation of Winter Wheat Based on UAV Hyperspectral Remote Sensing Considering Crop Aboveground Biomass Change and the Grain Filling Process. Remote Sens. 2022, 14, 1955. [Google Scholar] [CrossRef]
- Zhao, F.; Yang, X.; Schull, M.A.; Román-Colón, M.O.; Yao, T.; Wang, Z.; Zhang, Q.; Jupp, D.L.B.; Lovell, J.L.; Culvenor, D.S.; et al. Measuring Effective Leaf Area Index, Foliage Profile, and Stand Height in New England Forest Stands Using a Full-Waveform Ground-Based Lidar. Remote Sens. Environ. 2011, 115, 2954–2964. [Google Scholar] [CrossRef]
- Alexandridis, T.K.; Ovakoglou, G.; Clevers, J.G.P.W. Relationship between MODIS EVI and LAI across Time and Space. Geocarto Int. 2020, 35, 1385–1399. [Google Scholar] [CrossRef]
- Turner, D.P.; Cohen, W.B.; Kennedy, R.E.; Fassnacht, K.S.; Briggs, J.M. Relationships between Leaf Area Index and Landsat TM Spectral Vegetation Indices across Three Temperate Zone Sites. Remote Sens. Environ. 1999, 70, 52–68. [Google Scholar] [CrossRef]
- Xavier, A.C.; Vettorazzi, C.A. Mapping Leaf Area Index through Spectral Vegetation Indices in a Subtropical Watershed. Int. J. Remote Sens. 2004, 25, 1661–1672. [Google Scholar] [CrossRef]
- Hirsch, J.E. An Index to Quantify an Individual’s Scientific Research Output That Takes into Account the Effect of Multiple Coauthorship. Scientometrics 2010, 85, 741–754. [Google Scholar] [CrossRef]
- Pérez-Hornero, P.; Arias-Nicolás, J.P.; Pulgarín, A.A.; Pulgarín, A. An Annual JCR Impact Factor Calculation Based on Bayesian Credibility Formulas. J. Informetr. 2013, 7, 1–9. [Google Scholar] [CrossRef]
- Huete, A.; Didan, K.; Miura, T.; Rodriguez, E.P.; Gao, X.; Ferreira, L.G. Overview of the Radiometric and Biophysical Performance of the MODIS Vegetation Indices. Remote Sens. Environ. 2002, 83, 195–213. [Google Scholar] [CrossRef]
- Myneni, R.B.; Hoffman, S.; Knyazikhin, Y.; Privette, J.L.; Glassy, J.; Tian, Y.; Wang, Y.; Song, X.; Zhang, Y.; Smith, G.R.; et al. Global Products of Vegetation Leaf Area and Fraction Absorbed PAR from Year One of MODIS Data. Remote Sens. Environ. 2002, 83, 214–231. [Google Scholar] [CrossRef]
- Jonckheere, I.; Fleck, S.; Nackaerts, K.; Muys, B.; Coppin, P.; Weiss, M.; Baret, F. Review of Methods for in Situ Leaf Area Index Determination: Part I. Theories, Sensors and Hemispherical Photography. Agric. For. Meteorol. 2004, 121, 19–35. [Google Scholar] [CrossRef]
- Haboudane, D.; Miller, J.R.; Pattey, E.; Zarco-Tejada, P.J.; Strachan, I.B. Hyperspectral Vegetation Indices and Novel Algorithms for Predicting Green LAI of Crop Canopies: Modeling and Validation in the Context of Precision Agriculture. Remote Sens. Environ. 2004, 90, 337–352. [Google Scholar] [CrossRef]
- Jordan, C.F. Derivation of Leaf-Area Index from Quality of Light on the Forest Floor. Ecology 1969, 50, 663–666. [Google Scholar] [CrossRef]
- Bréda, N.J.J. Ground-based Measurements of Leaf Area Index: A Review of Methods, Instruments and Current Controversies. J. Exp. Bot. 2003, 54, 2403–2417. [Google Scholar] [CrossRef]
- Gower, S.T.; Kucharik, C.J.; Norman, J.M. Direct and Indirect Estimation of Leaf Area Index, FAPAR, and Net Primary Production of Terrestrial Ecosystems. Remote Sens. Environ. 1999, 70, 29–51. [Google Scholar] [CrossRef]
- Daughtry, C.S.T.; Walthall, C.L.; Kim, M.S.; de Colstoun, E.B.; McMurtrey, J.E. Estimating Corn Leaf Chlorophyll Concentration from Leaf and Canopy Reflectance. Remote Sens. Environ. 2000, 74, 229–239. [Google Scholar] [CrossRef]
- Baldocchi, D.; Falge, E.; Gu, L.; Olson, R.; Hollinger, D.; Running, S.; Anthoni, P.; Bernhofer, C.; Davis, K.; Evans, R.; et al. FLUXNET: A New Tool to Study the Temporal and Spatial Variability of Ecosystem-Scale Carbon Dioxide, Water Vapor, and Energy Flux Densities. Bull. Am. Meteorol. Soc. 2001, 82, 2415–2434. [Google Scholar] [CrossRef]
- Jackson, R.B.; Canadell, J.; Ehleringer, J.R.; Mooney, H.A.; Sala, O.E.; Schulze, E.D. A Global Analysis of Root Distributions for Terrestrial Biomes. Oecologia 1996, 108, 389–411. [Google Scholar] [CrossRef]
- Carlson, T.N.; Ripley, D.A. On the Relation between NDVI, Fractional Vegetation Cover, and Leaf Area Index. Remote Sens. Environ. 1997, 62, 241–252. [Google Scholar] [CrossRef]
- Drusch, M.; Del Bello, U.; Carlier, S.; Colin, O.; Fernandez, V.; Gascon, F.; Hoersch, B.; Isola, C.; Laberinti, P.; Martimort, P.; et al. Sentinel-2: ESA’s Optical High-Resolution Mission for GMES Operational Services. Remote Sens. Environ. 2012, 120, 25–36. [Google Scholar] [CrossRef]
- Shabanov, N.V.; Huang, D.; Yang, W.; Tan, B.; Knyazikhin, Y.; Myneni, R.B.; Ahl, D.E.; Gower, S.T.; Huete, A.R.; Aragao, L.E.O.C.; et al. Analysis and Optimization of the MODIS Leaf Area Index Algorithm Retrievals over Broadleaf Forests. IEEE Trans. Geosci. Remote Sens. 2005, 43, 1855–1865. [Google Scholar] [CrossRef] [Green Version]
- Knyazikhin, Y.; Martonchik, J.V.; Myneni, R.B.; Diner, D.J.; Running, S.W. Synergistic Algorithm for Estimating Vegetation Canopy Leaf Area Index and Fraction of Absorbed Photosynthetically Active Radiation from MODIS and MISR Data. J. Geophys. Res. Atmos. 1998, 103, 32257–32275. [Google Scholar] [CrossRef]
- Demarty, J.; Chevallier, F.; Friend, A.D.; Viovy, N.; Piao, S.; Ciais, P. Assimilation of Global MODIS Leaf Area Index Retrievals within a Terrestrial Biosphere Model. Geophys. Res. Lett. 2007, 34, 15402. [Google Scholar] [CrossRef]
- Pasolli, L.; Asam, S.; Castelli, M.; Bruzzone, L.; Wohlfahrt, G.; Zebisch, M.; Notarnicola, C. Retrieval of Leaf Area Index in Mountain Grasslands in the Alps from MODIS Satellite Imagery. Remote Sens. Environ. 2015, 165, 159–174. [Google Scholar] [CrossRef]
- Duchemin, B.; Hadria, R.; Erraki, S.; Boulet, G.; Maisongrande, P.; Chehbouni, A.; Escadafal, R.; Ezzahar, J.; Hoedjes, J.C.B.; Kharrou, M.H.; et al. Monitoring Wheat Phenology and Irrigation in Central Morocco: On the Use of Relationships between Evapotranspiration, Crops Coefficients, Leaf Area Index and Remotely-Sensed Vegetation Indices. Agric. Water Manag. 2006, 79, 1–27. [Google Scholar] [CrossRef]
- Mailhol, J.C.; Olufayo, A.A.; Ruelle, P. Sorghum and Sunflower Evapotranspiration and Yield from Simulated Leaf Area Index. Agric. Water Manag. 1997, 35, 167–182. [Google Scholar] [CrossRef]
- Steduto, P.; Hsiao, T.C. Maize Canopies under Two Soil Water Regimes: II. Seasonal Trends of Evapotranspiration, Carbon Dioxide Assimilation and Canopy Conductance, and as Related to Leaf Area Index. Agric. For. Meteorol. 1998, 89, 185–200. [Google Scholar] [CrossRef]
- Baez-Gonzalez, A.D.; Kiniry, J.R.; Maas, S.J.; Tiscareno, M.L.; Macias, C.J.; Mendoza, J.L.; Richardson, C.W.; Salinas, G.J.; Manjarrez, J.R. Large-Area Maize Yield Forecasting Using Leaf Area Index Based Yield Model. Agron. J. 2005, 97, 418–425. [Google Scholar] [CrossRef]
- Dente, L.; Satalino, G.; Mattia, F.; Rinaldi, M. Assimilation of Leaf Area Index Derived from ASAR and MERIS Data into CERES-Wheat Model to Map Wheat Yield. Remote Sens. Environ. 2008, 112, 1395–1407. [Google Scholar] [CrossRef]
- Watson, D.J. The Dependence of Net Assimilation Rate on Leaf-Area Index. Ann. Bot. 1958, 22, 37–54. [Google Scholar] [CrossRef]
- Boegh, E.; Soegaard, H.; Broge, N.; Hasager, C.B.; Jensen, N.O.; Schelde, K.; Thomsen, A. Airborne Multispectral Data for Quantifying Leaf Area Index, Nitrogen Concentration, and Photosynthetic Efficiency in Agriculture. Remote Sens. Environ. 2002, 81, 179–193. [Google Scholar] [CrossRef]
- Knyazikhin, Y.; Martonchik, J.V.; Diner, D.J.; Myneni, R.B.; Verstraete, M.; Pinty, B.; Gobron, N. Estimation of Vegetation Canopy Leaf Area Index and Fraction of Absorbed Photosynthetically Active Radiation from Atmosphere-Corrected MISR Data. J. Geophys. Res. Atmos. 1998, 103, 32239–32256. [Google Scholar] [CrossRef]
- Gitelson, A.A.; Viña, A.; Arkebauer, T.J.; Rundquist, D.C.; Keydan, G.; Leavitt, B. Remote Estimation of Leaf Area Index and Green Leaf Biomass in Maize Canopies. Geophys. Res. Lett. 2003, 30, 1248. [Google Scholar] [CrossRef]
- Le Maire, G.; François, C.; Soudani, K.; Berveiller, D.; Pontailler, J.Y.; Bréda, N.; Genet, H.; Davi, H.; Dufrêne, E. Calibration and Validation of Hyperspectral Indices for the Estimation of Broadleaved Forest Leaf Chlorophyll Content, Leaf Mass per Area, Leaf Area Index and Leaf Canopy Biomass. Remote Sens. Environ. 2008, 112, 3846–3864. [Google Scholar] [CrossRef]
- Kross, A.; McNairn, H.; Lapen, D.; Sunohara, M.; Champagne, C. Assessment of RapidEye Vegetation Indices for Estimation of Leaf Area Index and Biomass in Corn and Soybean Crops. Int. J. Appl. Earth Obs. Geoinf. 2015, 34, 235–248. [Google Scholar] [CrossRef]
- Cristiano, P.M.; Madanes, N.; Campanello, P.I.; Di Francescantonio, D.; Rodríguez, S.A.; Zhang, Y.J.; Carrasco, L.O.; Goldstein, G. High NDVI and Potential Canopy Photosynthesis of South American Subtropical Forests despite Seasonal Changes in Leaf Area Index and Air Temperature. Forests 2014, 5, 287–308. [Google Scholar] [CrossRef]
- Fan, L.; Gao, Y.; Brück, H.; Bernhofer, C. Investigating the Relationship between NDVI and LAI in Semi-Arid Grassland in Inner Mongolia Using in-Situ Measurements. Theor. Appl. Climatol. 2009, 95, 151–156. [Google Scholar] [CrossRef]
- Zhu, Z.; Piao, S.; Myneni, R.B.; Huang, M.; Zeng, Z.; Canadell, J.G.; Ciais, P.; Sitch, S.; Friedlingstein, P.; Arneth, A.; et al. Greening of the Earth and Its Drivers. Nat. Clim. Chang. 2016, 6, 791–795. [Google Scholar] [CrossRef]
- Iio, A.; Hikosaka, K.; Anten, N.P.R.; Nakagawa, Y.; Ito, A. Global Dependence of Field-Observed Leaf Area Index in Woody Species on Climate: A Systematic Review. Glob. Ecol. Biogeogr. 2014, 23, 274–285. [Google Scholar] [CrossRef]
- Alkama, R.; Kageyama, M.; Ramstein, G. Relative Contributions of Climate Change, Stomatal Closure, and Leaf Area Index Changes to 20th and 21st Century Runoff Change: A Modelling Approach Using the Organizing Carbon and Hydrology in Dynamic Ecosystems (ORCHIDEE) Land Surface Model. J. Geophys. Res. Atmos. 2010, 115, 17112. [Google Scholar] [CrossRef]
- Paloscia, S. An Empirical Approach to Estimating Leaf Area Index from Multifrequency SAR Data. Int. J. Remote Sens. 1998, 19, 359–364. [Google Scholar] [CrossRef]
- Bouriaud, O.; Soudani, K.; Bréda, N. Leaf Area Index from Litter Collection: Impact of Specific Leaf Area Variability within a Beech Stand. Can. J. Remote Sens. 2003, 29, 371–380. [Google Scholar] [CrossRef]
- Konôpka, B.; Pajtík, J.; Marušák, R.; Bošeľa, M.; Lukac, M. Specific Leaf Area and Leaf Area Index in Developing Stands of Fagus Sylvatica, L. and Picea Abies Karst. For. Ecol. Manag. 2016, 364, 52–59. [Google Scholar] [CrossRef]
- Simioni, G.; Gignoux, J.; Le Roux, X.; Appé, R.; Benest, D. Spatial and Temporal Variations in Leaf Area Index, Specific Leaf Area and Leaf Nitrogen of Two Co-Occurring Savanna Tree Species. Tree Physiol. 2004, 24, 205–216. [Google Scholar] [CrossRef]
- White, J.D.; Scott, N.A. Specific Leaf Area and Nitrogen Distribution in New Zealand Forests: Species Independently Respond to Intercepted Light. For. Ecol. Manag. 2006, 226, 319–329. [Google Scholar] [CrossRef]
- Bréda, N.; Granier, A. Intra- and Interannual Variations of Transpiration, Leaf Area Index and Radial Growth of a Sessile Oak Stand (Quercus Petraea). Ann. For. Sci. 1996, 53, 521–536. [Google Scholar] [CrossRef]
- Ben-Asher, J.; Tsuyuki, I.; Bravdo, B.A.; Sagih, M. Irrigation of Grapevines with Saline Water: I. Leaf Area Index, Stomatal Conductance, Transpiration and Photosynthesis. Agric. Water Manag. 2006, 83, 13–21. [Google Scholar] [CrossRef]
- Ta, T.H.; Shin, J.H.; Ahn, T.I.; Son, J.E. Modeling of Transpiration of Paprika (Capsicum Annuum L.) Plants Based on Radiation and Leaf Area Index in Soilless Culture. Hortic. Environ. Biotechnol. 2011, 52, 265. [Google Scholar] [CrossRef]
- Kooman, P.L.; Rabbinge, R. An Analysis of the Relation between Dry Matter Allocation to the Tuber and Earliness of a Potato Crop. Ann. Bot. 1996, 77, 235–242. [Google Scholar] [CrossRef]
- Blancon, J.; Dutartre, D.; Tixier, M.H.; Weiss, M.; Comar, A.; Praud, S.; Baret, F. A High-Throughput Model-Assisted Method for Phenotyping Maize Green Leaf Area Index Dynamics Using Unmanned Aerial Vehicle Imagery. Front. Plant Sci. 2019, 10, 685. [Google Scholar] [CrossRef] [PubMed]
- Nigam, S.N.; Upadhyaya, H.D.; Chandra, S.; Rao, R.C.N.; Wright, G.C.; Reddy, A.G.S. Gene Effects for Specific Leaf Area and Harvest Index in Three Crosses of Groundnut (Arachis Hypogaea). Ann. Appl. Biol. 2001, 139, 301–306. [Google Scholar] [CrossRef] [Green Version]
- Tollenaar, M.; Deen, W.; Echarte, L.; Liu, W. Effect of Crowding Stress on Dry Matter Accumulation and Harvest Index in Maize. Agron. J. 2006, 98, 930–937. [Google Scholar] [CrossRef]
- Berrocal-Ibarra, S.; Ortiz-Cereceres, J.; Peña-Valdivia, C.B. Yield Components, Harvest Index and Leaf Area Efficiency of a Sample of a Wild Population and a Domesticated Variant of the Common Bean Phaseolus Vulgaris. S. Afr. J. Bot. 2002, 68, 205–211. [Google Scholar] [CrossRef]
- Hardwick, S.R.; Toumi, R.; Pfeifer, M.; Turner, E.C.; Nilus, R.; Ewers, R.M. The Relationship between Leaf Area Index and Microclimate in Tropical Forest and Oil Palm Plantation: Forest Disturbance Drives Changes in Microclimate. Agric. For. Meteorol. 2015, 201, 187–195. [Google Scholar] [CrossRef]
- Budelman, A. Leaf Dry Matter Productivity of Three Selected Perennial Leguminous Species in Humid Tropical Ivory Coast. Agroforest Syst. 1988, 7, 47–62. [Google Scholar] [CrossRef]
- Lelong, C.C.D.; Burger, P.; Jubelin, G.; Roux, B.; Labbé, S.; Baret, F. Assessment of Unmanned Aerial Vehicles Imagery for Quantitative Monitoring of Wheat Crop in Small Plots. Sensors 2008, 8, 3557–3585. [Google Scholar] [CrossRef]
- Lu, B.; He, Y.; Liu, H.H.T. Mapping Vegetation Biophysical and Biochemical Properties Using Unmanned Aerial Vehicles-Acquired Imagery. Int. J. Remote Sens. 2018, 39, 5265–5287. [Google Scholar] [CrossRef]
- Kalisperakis, I.; Stentoumis, C.; Grammatikopoulos, L.; Karantzalos, K. Leaf area index estimation in vineyards from Uav hyperspectral data, 2D image mosaics and 3D canopy surface models. Int. Arch. Photogramm. Remote Sens. Spat. Inf. Sci. 2015, XL-1/W4, 299–303. [Google Scholar] [CrossRef]
- Tian, J.; Wang, L.; Li, X.; Gong, H.; Shi, C.; Zhong, R.; Liu, X. Comparison of UAV and WorldView-2 Imagery for Mapping Leaf Area Index of Mangrove Forest. Int. J. Appl. Earth Obs. Geoinf. 2017, 61, 22–31. [Google Scholar] [CrossRef]
- Berni, J.A.J.; Zarco-Tejada, P.J.; Suarez, L.; Fereres, E. Thermal and Narrowband Multispectral Remote Sensing for Vegetation Monitoring from an Unmanned Aerial Vehicle. IEEE Trans. Geosci. Remote Sens. 2009, 47, 722–738. [Google Scholar] [CrossRef]
- Yan, G.; Li, L.; Coy, A.; Mu, X.; Chen, S.; Xie, D.; Zhang, W.; Shen, Q.; Zhou, H. Improving the Estimation of Fractional Vegetation Cover from UAV RGB Imagery by Colour Unmixing. ISPRS J. Photogramm. Remote Sens. 2019, 158, 23–34. [Google Scholar] [CrossRef]
- Li, L.; Mu, X.; Macfarlane, C.; Song, W.; Chen, J.; Yan, K.; Yan, G. A Half-Gaussian Fitting Method for Estimating Fractional Vegetation Cover of Corn Crops Using Unmanned Aerial Vehicle Images. Agric. For. Meteorol. 2018, 262, 379–390. [Google Scholar] [CrossRef]
- Chapman, S.C.; Merz, T.; Chan, A.; Jackway, P.; Hrabar, S.; Dreccer, M.F.; Holland, E.; Zheng, B.; Ling, T.J.; Jimenez-Berni, J. Pheno-Copter: A Low-Altitude, Autonomous Remote-Sensing Robotic Helicopter for High-Throughput Field-Based Phenotyping. Agronomy 2014, 4, 279–301. [Google Scholar] [CrossRef]
- Ballester, C.; Hornbuckle, J.; Brinkhoff, J.; Smith, J.; Quayle, W. Assessment of In-Season Cotton Nitrogen Status and Lint Yield Prediction from Unmanned Aerial System Imagery. Remote Sens. 2017, 9, 1149. [Google Scholar] [CrossRef]
- Vega, F.A.; Ramírez, F.C.; Saiz, M.P.; Rosúa, F.O. Multi-Temporal Imaging Using an Unmanned Aerial Vehicle for Monitoring a Sunflower Crop. Biosyst. Eng. 2015, 132, 19–27. [Google Scholar] [CrossRef]
- Duan, T.; Chapman, S.C.; Guo, Y.; Zheng, B. Dynamic Monitoring of NDVI in Wheat Agronomy and Breeding Trials Using an Unmanned Aerial Vehicle. Field Crops Res. 2017, 210, 71–80. [Google Scholar] [CrossRef]
- Fassnacht, F.E.; Latifi, H.; Stereńczak, K.; Modzelewska, A.; Lefsky, M.; Waser, L.T.; Straub, C.; Ghosh, A. Review of Studies on Tree Species Classification from Remotely Sensed Data. Remote Sens. Environ. 2016, 186, 64–87. [Google Scholar] [CrossRef]
- Tetila, E.C.; Machado, B.B.; Astolfi, G.; de Souza Belete, N.A.; Amorim, W.P.; Roel, A.R.; Pistori, H. Detection and Classification of Soybean Pests Using Deep Learning with UAV Images. Comput. Electron. Agric. 2020, 179, 105836. [Google Scholar] [CrossRef]
- López-Granados, F.; Torres-Sánchez, J.; Serrano-Pérez, A.; de Castro, A.I.; Mesas-Carrascosa, F.J.; Peña, J.M. Early Season Weed Mapping in Sunflower Using UAV Technology: Variability of Herbicide Treatment Maps against Weed Thresholds. Precis. Agric. 2016, 17, 183–199. [Google Scholar] [CrossRef]
- Watanabe, K.; Guo, W.; Arai, K.; Takanashi, H.; Kajiya-Kanegae, H.; Kobayashi, M.; Yano, K.; Tokunaga, T.; Fujiwara, T.; Tsutsumi, N.; et al. High-Throughput Phenotyping of Sorghum Plant Height Using an Unmanned Aerial Vehicle and Its Application to Genomic Prediction Modeling. Front. Plant Sci. 2017, 8, 421. [Google Scholar] [CrossRef] [PubMed]
- Zaman-Allah, M.; Vergara, O.; Araus, J.L.; Tarekegne, A.; Magorokosho, C.; Zarco-Tejada, P.J.; Hornero, A.; Albà, A.H.; Das, B.; Craufurd, P.; et al. Unmanned Aerial Platform-Based Multi-Spectral Imaging for Field Phenotyping of Maize. Plant Methods 2015, 11, 35. [Google Scholar] [CrossRef] [Green Version]
- Delegido, J.; Verrelst, J.; Alonso, L.; Moreno, J. Evaluation of Sentinel-2 Red-Edge Bands for Empirical Estimation of Green LAI and Chlorophyll Content. Sensors 2011, 11, 7063–7081. [Google Scholar] [CrossRef]
- Gao, F.; Masek, J.; Schwaller, M.; Hall, F. On the Blending of the Landsat and MODIS Surface Reflectance: Predicting Daily Landsat Surface Reflectance. IEEE Trans. Geosci. Remote Sens. 2006, 44, 2207–2218. [Google Scholar] [CrossRef]
- Korhonen, L.; Hadi; Packalen, P.; Rautiainen, M. Comparison of Sentinel-2 and Landsat 8 in the Estimation of Boreal Forest Canopy Cover and Leaf Area Index. Remote Sens. Environ. 2017, 195, 259–274. [Google Scholar] [CrossRef]
- Herrmann, I.; Pimstein, A.; Karnieli, A.; Cohen, Y.; Alchanatis, V.; Bonfil, D.J. LAI Assessment of Wheat and Potato Crops by VENμS and Sentinel-2 Bands. Remote Sens. Environ. 2011, 115, 2141–2151. [Google Scholar] [CrossRef]
- Mazzia, V.; Khaliq, A.; Chiaberge, M. Improvement in Land Cover and Crop Classification Based on Temporal Features Learning from Sentinel-2 Data Using Recurrent-Convolutional Neural Network (R-CNN). Appl. Sci. 2020, 10, 238. [Google Scholar] [CrossRef]
- Lebourgeois, V.; Dupuy, S.; Vintrou, É.; Ameline, M.; Butler, S.; Bégué, A. A Combined Random Forest and OBIA Classification Scheme for Mapping Smallholder Agriculture at Different Nomenclature Levels Using Multisource Data (Simulated Sentinel-2 Time Series, VHRS and DEM). Remote Sens. 2017, 9, 259. [Google Scholar] [CrossRef]
- Vafaei, S.; Soosani, J.; Adeli, K.; Fadaei, H.; Naghavi, H.; Pham, T.D.; Bui, D.T. Improving Accuracy Estimation of Forest Aboveground Biomass Based on Incorporation of ALOS-2 PALSAR-2 and Sentinel-2A Imagery and Machine Learning: A Case Study of the Hyrcanian Forest Area (Iran). Remote Sens. 2018, 10, 172. [Google Scholar] [CrossRef]
- Chen, Y.; Li, L.; Lu, D.; Li, D. Exploring Bamboo Forest Aboveground Biomass Estimation Using Sentinel-2 Data. Remote Sens. 2019, 11, 7. [Google Scholar] [CrossRef]
- Clevers, J.G.P.W.; Kooistra, L.; Van den Brande, M.M.M. Using Sentinel-2 Data for Retrieving LAI and Leaf and Canopy Chlorophyll Content of a Potato Crop. Remote Sens. 2017, 9, 405. [Google Scholar] [CrossRef]
- Frampton, W.J.; Dash, J.; Watmough, G.; Milton, E.J. Evaluating the Capabilities of Sentinel-2 for Quantitative Estimation of Biophysical Variables in Vegetation. ISPRS J. Photogramm. Remote Sens. 2013, 82, 83–92. [Google Scholar] [CrossRef] [Green Version]
- Rozenstein, O.; Haymann, N.; Kaplan, G.; Tanny, J. Estimating Cotton Water Consumption Using a Time Series of Sentinel-2 Imagery. Agric. Water Manag. 2018, 207, 44–52. [Google Scholar] [CrossRef]
- Han, D.; Liu, S.; Du, Y.; Xie, X.; Fan, L.; Lei, L.; Li, Z.; Yang, H.; Yang, G. Crop Water Content of Winter Wheat Revealed with Sentinel-1 and Sentinel-2 Imagery. Sensors 2019, 19, 4013. [Google Scholar] [CrossRef]
- Zhang, C.; Pattey, E.; Liu, J.; Cai, H.; Shang, J.; Dong, T. Retrieving Leaf and Canopy Water Content of Winter Wheat Using Vegetation Water Indices. IEEE J. Sel. Top. Appl. Earth Obs. Remote Sens. 2018, 11, 112–126. [Google Scholar] [CrossRef]
- Houborg, R.; McCabe, M.F. A Hybrid Training Approach for Leaf Area Index Estimation via Cubist and Random Forests Machine-Learning. ISPRS J. Photogramm. Remote Sens. 2018, 135, 173–188. [Google Scholar] [CrossRef]
- Karimi, S.; Sadraddini, A.A.; Nazemi, A.H.; Xu, T.; Fard, A.F. Generalizability of Gene Expression Programming and Random Forest Methodologies in Estimating Cropland and Grassland Leaf Area Index. Comput. Electron. Agric. 2018, 144, 232–240. [Google Scholar] [CrossRef]
- Srinet, R.; Nandy, S.; Patel, N.R. Estimating Leaf Area Index and Light Extinction Coefficient Using Random Forest Regression Algorithm in a Tropical Moist Deciduous Forest, India. Ecol. Inform. 2019, 52, 94–102. [Google Scholar] [CrossRef]
- Yuan, H.; Yang, G.; Li, C.; Wang, Y.; Liu, J.; Yu, H.; Feng, H.; Xu, B.; Zhao, X.; Yang, X. Retrieving Soybean Leaf Area Index from Unmanned Aerial Vehicle Hyperspectral Remote Sensing: Analysis of RF, ANN, and SVM Regression Models. Remote Sens. 2017, 9, 309. [Google Scholar] [CrossRef]
- Zhang, J.; Cheng, T.; Guo, W.; Xu, X.; Qiao, H.; Xie, Y.; Ma, X. Leaf Area Index Estimation Model for UAV Image Hyperspectral Data Based on Wavelength Variable Selection and Machine Learning Methods. Plant Methods 2021, 17, 49. [Google Scholar] [CrossRef] [PubMed]
- Gahrouei, O.R.; McNairn, H.; Hosseini, M.; Homayouni, S. Estimation of Crop Biomass and Leaf Area Index from Multitemporal and Multispectral Imagery Using Machine Learning Approaches. Can. J. Remote Sens. 2020, 46, 84–99. [Google Scholar] [CrossRef]
- Colombo, R.; Bellingeri, D.; Fasolini, D.; Marino, C.M. Retrieval of Leaf Area Index in Different Vegetation Types Using High Resolution Satellite Data. Remote Sens. Environ. 2003, 86, 120–131. [Google Scholar] [CrossRef]
- Mulla, D.J. Twenty-Five Years of Remote Sensing in Precision Agriculture: Key Advances and Remaining Knowledge Gaps. Biosyst. Eng. 2013, 114, 358–371. [Google Scholar] [CrossRef]
- Haboudane, D.; Miller, J.R.; Tremblay, N.; Zarco-Tejada, P.J.; Dextraze, L. Integrated Narrow-Band Vegetation Indices for Prediction of Crop Chlorophyll Content for Application to Precision Agriculture. Remote Sens. Environ. 2002, 81, 416–426. [Google Scholar] [CrossRef]
- Ewert, F. Modelling Plant Responses to Elevated CO2: How Important Is Leaf Area Index? Ann. Bot. 2004, 93, 619–627. [Google Scholar] [CrossRef]
- Lazauskas, S.; Povilaitis, V.; Antanaitis, S.; Miliauskienė, J.; Sakalauskienė, S.; Pšibišauskienė, G.; Auskalniene, O.; Raudonius, S.; Duchovskis, P. Winter Wheat Leaf Area Index under Low and Moderate Input Management and Climate Change. J. Food Agric. Environ. 2012, 10, 588–593. [Google Scholar]
- Tesemma, Z.K.; Wei, Y.; Peel, M.C.; Western, A.W. Including the Dynamic Relationship between Climatic Variables and Leaf Area Index in a Hydrological Model to Improve Streamflow Prediction under a Changing Climate. Hydrol. Earth Syst. Sci. 2015, 19, 2821–2836. [Google Scholar] [CrossRef] [Green Version]


| Reference | Fields |
|---|---|
| (Zhang et al., 2017, pp. 2010–2015) [50] | Remote sensing |
| (Zhang and Chen, 2020, pp. 1991–2018) [51] | Chinese Loess Plateau |
| (Tamiminia et al., 2020) [53] | Google Earth engine |
| (Li et al., 2021) [52] | Grassland remote sensing |
| (Zhao et al., 2022) [54] | Earth observation satellite data |
| (Xu et al., 2022) [49] | NDVI |
| This paper | LAI |
| Type | Description | Value/Number |
|---|---|---|
| Time span | Time of publication | 1947–2021 |
| Documents | Number of documents | 22,276 |
| Authors | Number of authors | 51,324 |
| Sources | The frequency distribution of sources as journals, books, etc. | 1502 |
| References | Number of references | 479,572 |
| Keywords plus (ID) | Number of phrases that frequently appear in the title of an article’s references | 22,542 |
| Authors’ keywords (DE) | Number of authors’ keywords | 35,612 |
| Authors’ appearances | The authors’ frequency distribution | 108,514 |
| Documents per author | Average number of authors in each document | 0.434 |
| Co-authors per document | Average number of co-authors in each document | 4.87 |
| Authors of single-authored documents | Number of single authors per articles | 785 |
| Average citations per documents | Average number of citations in each document | 35.50 |
| Annual growth rate | Average annual growth rate of documents | 9.15 |
| Institution | Country | TC | TA |
|---|---|---|---|
| University of Arizona | USA | 12,903 | 64 |
| University of Wisconsin | USA | 11,780 | 101 |
| GSFC | USA | 9167 | 90 |
| Boston University | USA | 8074 | 58 |
| University of Nebraska | USA | 7653 | 121 |
| Oregon State University | USA | 7579 | 82 |
| University of California, Berkeley | USA | 7560 | 69 |
| University of Maryland | USA | 7162 | 91 |
| University of Montana | USA | 7037 | 44 |
| NCAR | USA | 6128 | 24 |
| CCRS | CANADA | 6041 | 49 |
| University of Toronto | CANADA | 5489 | 92 |
| University of British Columbia | CANADA | 5423 | 65 |
| Beijing Normal University | CHINA | 5302 | 180 |
| IGSNRR, CAS | CHINA | 5197 | 150 |
| Universitat de València | SPAIN | 4777 | 70 |
| University of New Hampshire | USA | 4614 | 33 |
| China Agricultural University | CHINA | 4449 | 152 |
| University of Florida | USA | 4304 | 116 |
| Nanjing Agricultural University | CHINA | 4157 | 106 |
| Rank | WOS Subject Category | Number of Articles | Proportion /% |
|---|---|---|---|
| 1 | Agriculture | 7541 | 33.85 |
| 2 | Environmental sciences and ecology | 6378 | 28.63 |
| 3 | Remote sensing | 3912 | 17.56 |
| 4 | Imaging science and photographic technology | 3402 | 15.27 |
| 5 | Plant sciences | 3003 | 13.48 |
| 6 | Forestry | 2654 | 11.91 |
| 7 | Geology | 2544 | 11.42 |
| 8 | Meteorology and atmospheric sciences | 2038 | 9.15 |
| 9 | Water resources | 1457 | 6.54 |
| 10 | Engineering | 1229 | 5.52 |
| Sources | H Index | N. LC | ND | IF | Country of Origin |
|---|---|---|---|---|---|
| Remote Sensing of Environment | 238 | 79,324 | 992 | 13.85 | USA |
| Global Change Biology | 217 | 15,267 | 216 | 13.21 | UK |
| IEEE Transactions on Geoscience and Remote Sensing | 216 | 15,515 | 213 | 8.125 | USA |
| Forest Ecology and Management | 152 | 12,920 | 383 | 4.384 | The Netherlands |
| International Journal of Remote Sensing | 151 | 21,247 | 550 | 3.531 | UK |
| Agricultural and Forest Meteorology | 144 | 35,725 | 843 | 6.424 | The Netherlands |
| Field Crops Research | 127 | 14,438 | 494 | 6.145 | The Netherlands |
| Agronomy Journal | 113 | 14,532 | 350 | 2.65 | USA |
| Journal of Geophysical Research: Atmospheres | 106 | 13,428 | 224 | 5.217 | USA |
| Remote Sensing | 81 | 13,804 | 1039 | 5.349 | Switzerland |
| Author | H Index | G Index | M Index | TC | NP | PY_start | Country |
|---|---|---|---|---|---|---|---|
| Chen J.M. | 59 | 118 | 1.844 | 14,645 | 179 | 1991 | Chian |
| Baret F. | 56 | 105 | 1.75 | 11,892 | 105 | 1991 | France |
| Myneni R.B. | 56 | 100 | 1.806 | 14,679 | 100 | 1992 | USA |
| Running S.W. | 47 | 63 | 1.306 | 13,004 | 63 | 1987 | USA |
| Black T.A. | 46 | 82 | 1.438 | 7619 | 82 | 1991 | Canada |
| Gower S.T. | 45 | 54 | 1.364 | 9450 | 54 | 1990 | USA |
| Weiss M. | 40 | 59 | 1.667 | 7538 | 59 | 1999 | France |
| Knyazikhin Y. | 39 | 60 | 1.5 | 7077 | 60 | 1997 | USA |
| Coops N.C. | 36 | 64 | 1.636 | 4186 | 68 | 2001 | Canada |
| Ciais P. | 35 | 61 | 1.842 | 8375 | 61 | 2004 | France |
| Title | Senior Author | Journal | Year | LC | GC |
|---|---|---|---|---|---|
| Overview of the radiometric and biophysical performance of the MODIS vegetation indices [85] | Huete A. | Remote Sensing of Environment | 2002 | 794 | 5136 |
| Global products of vegetation leaf area and fraction absorbed PAR from year one of MODIS data [86] | Myneni R. B | Remote Sensing of Environment | 2002 | 711 | 1359 |
| Review of methods for in situ leaf area index determination: Part I. Theories, sensors and hemispherical photography [87] | Jonckheere I. | Agricultural and Forest Meteorology | 2004 | 708 | 1021 |
| Hyperspectral vegetation indices and novel algorithms for predicting green LAI of crop canopies: Modeling and validation in the context of precision agriculture [88] | Haboudane D. | Remote Sensing of Environment | 2004 | 631 | 1448 |
| Defining leaf area index for non-flat leaves [7] | Chen J.M | Plant, Cell & Environment | 1992 | 620 | 863 |
| Derivation of Leaf-Area Index from Quality of Light on the Forest Floor [89] | Jordan C. F | Ecology | 1969 | 610 | 1415 |
| Ground-based measurements of leaf area index: a review of methods, instruments and current controversies [90] | Breda N.J. J | Journal of Experimental Botany | 2003 | 596 | 895 |
| Direct and Indirect Estimation of Leaf Area Index, fAPAR, and Net Primary Production of Terrestrial Ecosystems [91] | Gower S. T | Remote Sensing of Environment | 1999 | 546 | 837 |
| Estimating Corn Leaf Chlorophyll Concentration from Leaf and Canopy Reflectance [92] | Daughtry C.S. T | Remote Sensing of Environment | 2000 | 494 | 1335 |
| Leaf area index of boreal forests: Theory, techniques, and measurements [5] | Chen J.M | Journal of Geophysical Research | 1997 | 492 | 673 |
| Title | Senior Author | Journal | Year | LC | GC |
|---|---|---|---|---|---|
| Overview of the radiometric and biophysical performance of the MODIS vegetation indices [85] | Huete A. | Remote Sensing of Environment | 2002 | 794 | 5136 |
| Estimates of global terrestrial isoprene emissions using MEGAN (Model of Emissions of Gases and Aerosols from Nature) [91] | Guenther A. | Atmospheric Chemistry and Physics | 2006 | 49 | 2684 |
| FLUXNET: A New Tool to Study the Temporal and Spatial Variability of Ecosystem-Scale Carbon Dioxide, Water Vapor, and Energy Flux Densities [93] | Baldocchi D. | Bulletin of the American Meteorological Society | 2001 | 0 | 2594 |
| A global analysis of root distributions for terrestrial biomes [94] | Jackson R. B | Oecologia | 1996 | 94 | 1897 |
| On the relation between NDVI, fractional vegetation cover, and leaf area index [95] | Carlson T. N | Remote Sensing of Environment | 1997 | 334 | 1754 |
| Sentinel-2: ESA’s Optical High-Resolution Mission for GMES Operational Services [96] | Drusch M. | Remote Sensing of Environment | 2012 | 163 | 1693 |
| Hyperspectral vegetation indices and novel algorithms for predicting green LAI of crop canopies: Modeling and validation in the context of precision agriculture [88] | Haboudane D. | Remote Sensing of Environment | 2004 | 631 | 1448 |
| Derivation of Leaf-Area Index from Quality of Light on the Forest Floor [89] | Jordan C. F | Ecology | 1969 | 610 | 1415 |
| Global products of vegetation leaf area and fraction absorbed PAR from year one of MODIS data [86] | Myneni R. B | Remote Sensing of Environment | 2002 | 711 | 1359 |
| Estimating Corn Leaf Chlorophyll Concentration from Leaf and Canopy Reflectance [92] | Daughtry C.S. T | Remote Sensing of Environment | 2000 | 494 | 1335 |
| Stage | High Frequency Words (Partial) | Characteristics of Distribution |
|---|---|---|
| Incubation period (1947–1990) | Leaf area, leaf area index, growth, yield, harvest index, canopy, biomass, evaporation, grain yield, and soil | The high-frequency hot topic words are more dispersed and have not formed obvious rules. Harvest index, biomass, evaporation and so on have developed earlier and have strong research continuity; |
| Cultivation period (1991–1999) | Yield, photosynthesis, carbon dioxide, seedling, water stress, climate change, hemispherical photography, net primary production, vegetation canopy, and forest ecosystem | Compared with the previous period, the research topics have both continuations (such as yield, vegetation canopy) and new growth (such as photosynthesis, water stress, climate change and net primary production, etc.), and climate change has attracted attention; |
| Acceleration period (2000–2005) | Temperature, nitrogen, water balance, variability, classification, spectral reflectance, long term, precipitation, nutrition, and deforestation | The high-frequency hot topics are relatively concentrated, and the popularity growth, change, and continuity are more significant. Classification, spectral reflectance, and precipitation nutrition suddenly become new hot topics at the end of this stage. |
| Evolution period (2006–2015) | Growth, retrieval, remote sensing data, time series, regression, remote estimation, global product, identification, mechanism, and MODIS LAI | The high-frequency hot topics began to form a heat stability and growth law. The research heat of remote sensing data, remote estimation, global product, MODIS LAI, and other remote sensing methods and products continued to grow. Time series, regression, identification and other research topics and methods maintained a high degree of attention |
| Outbreak period (2016–2021) | Climate change, nitrogen use efficiency, leaf chlorophyll content, machine learning, induced chlorophyll fluorescence, UAV, Sentinel-2, vegetation mapping, health, and Gaussian processes | The research hotspots are more abundant, and the research on different high-frequency topics is more in-depth, lasting, and stable. The overall heat of climate change, machine learning, UAV and Sentinel-2 as research hotspots continues to rise. Themes such as use efficiency, leaf chlorophyll content, induced chlorophyll fluorescence, vegetation mapping and gaussian nitrogen processes remained steady and increased. |
Disclaimer/Publisher’s Note: The statements, opinions and data contained in all publications are solely those of the individual author(s) and contributor(s) and not of MDPI and/or the editor(s). MDPI and/or the editor(s) disclaim responsibility for any injury to people or property resulting from any ideas, methods, instructions or products referred to in the content. |
© 2023 by the authors. Licensee MDPI, Basel, Switzerland. This article is an open access article distributed under the terms and conditions of the Creative Commons Attribution (CC BY) license (https://creativecommons.org/licenses/by/4.0/).
Share and Cite
Ma, J.; Zhang, J.; Wang, J.; Khromykh, V.; Li, J.; Zhong, X. Global Leaf Area Index Research over the Past 75 Years: A Comprehensive Review and Bibliometric Analysis. Sustainability 2023, 15, 3072. https://doi.org/10.3390/su15043072
Ma J, Zhang J, Wang J, Khromykh V, Li J, Zhong X. Global Leaf Area Index Research over the Past 75 Years: A Comprehensive Review and Bibliometric Analysis. Sustainability. 2023; 15(4):3072. https://doi.org/10.3390/su15043072
Chicago/Turabian StyleMa, Jun, Jianpeng Zhang, Jinliang Wang, Vadim Khromykh, Jie Li, and Xuzheng Zhong. 2023. "Global Leaf Area Index Research over the Past 75 Years: A Comprehensive Review and Bibliometric Analysis" Sustainability 15, no. 4: 3072. https://doi.org/10.3390/su15043072