Abstract
Both transport development and poverty alleviation are vital for sustainable development. However, due to the lack of long-term, comparable, county-level transport accessibility and poverty incidence data, the spatiotemporal patterns of these factors have rarely been accurately revealed in the poverty-stricken regions of China, causing the impacts of transport accessibility on poverty alleviation to be difficult to quantify. Taking Guizhou Province in China as the study area, this study revealed the spatiotemporal patterns of transport accessibility and poverty alleviation in 88 counties from 2000 to 2018 based on multisource data, including nighttime light data, LandScan population data, and transport network data. It was found that the transport accessibility decreased from 4.9 h to 3.3 h, and the poverty index decreased from 0.75 to 0.29 on average. All these factors exhibited a “core–periphery” spatial pattern. Furthermore, the panel data regression analysis suggested that transport accessibility has played a dominant role in poverty alleviation, with an elasticity coefficient of 0.839. In the future, policies concerned to integrate transport development with rural industries such as agriculture, e-commence, and tourism are recommended for poverty alleviation and rural revitalization, which are especially significant for promoting sustainable development, securing a win–win of economic growth and social equity.
1. Introduction
Poverty alleviation has been one of the greatest challenges faced by countries worldwide, and the United Nations listed “no poverty” as the first goal of 17 global sustainable development goals (SDGs) by 2030 [1]. During recent decades, significant progress has been made in eliminating global poverty, with the population living in extreme poverty decreasing from 1.895 billion in 1990 to 650 million in 2019 and the corresponding proportion decreasing from 36% in 1990 to 8.4% in 2019 [2]. In particular, China has contributed more than 70% to global poverty eradication. Based on the current poverty standards, 98.99 million people living in rural poverty in China have been lifted out of poverty since 2012, and 832 poor counties have shaken off poverty, successfully achieving the target of eliminating absolute poverty by 2020 [3]. From the perspective of spatial distribution, the poverty-stricken population in China was concentrated mainly in 14 poverty-stricken areas, most of which were located in the plateau, mountainous, or hilly areas. Due to terrain and investment limitations, these areas were usually isolated from other places without adequate transport infrastructure, and the lack of population, capital, and information interactions with outside areas exacerbated poverty. Thus, transport development has played a fundamental role in the poverty alleviation process in China, supporting the proverb “Want to be rich? Build roads first!”. According to statistics from China’s Ministry of Transport, the mileage of rural roads in China has increased from 137.1 km in 2003 to 404 km in 2018. The access rates of townships and administrative villages to roads reached 99.6% and 99.5%, respectively, and 99.1% of townships and 96.5% of administrative villages were connected to public buses systems by 2018. The rapid development of road transport has greatly improved interregional accessibility and provided strong support for alleviating regional poverty. Thus, it is necessary to reveal the spatiotemporal patterns of transport accessibility and poverty alleviation as well as the impact of transport accessibility on poverty alleviation to guide further poverty alleviation strategies and transport development planning in poverty-stricken areas of both China and other developing countries.
The concept of accessibility is essential to revealing the spatiotemporal development of transport infrastructure and interregional communication in poverty-stricken areas. This concept was first proposed by Hansen (1959) to characterize the spatial interaction opportunities between different nodes in transport networks [4]. Based on the gravity model, space syntax, network analysis of geography information system (GIS), and vector–grid integration analysis techniques [4,5], multiple indicators have been developed for analyzing accessibility, including the shortest spatial distance, average shortest travel time (ASTT), weighted average travel time, opportunity accessibility, and daily accessibility [6,7,8]. Among the extensive studies on the accessibility effects of transport infrastructure, most have focused on urban regions, while accessibility in rural areas and the travel demand of rural residents have long been overlooked, especially in developing countries [9,10]. At the regional level, the influence of highways [11,12,13] or high-speed railways [14,15] on inter-city accessibility has attracted much attention from scholars. At the city level, the accessibility effects of public transportation systems inside cities, such as buses [16], metros [17,18], bicycle-sharing [19], or multimode accessibility [20], have also been studied extensively in both developed and developing countries. However, in rural areas with low population densities, due to the lack of public transport provision and sparsely located public services, transport accessibility is quite low for rural residents compared to their urban counterparts, especially in developing countries with underdeveloped transport infrastructure and low car ownership. Thus, it has been argued that the fundamental problems of poverty and decline in rural areas are associated with the lack of transport accessibility [21]. Before effective strategies can be found to improve transport conditions and alleviate regional poverty in rural areas, it is necessary to evaluate transport accessibility in these areas.
However, due to the lack of transport network data in poverty-stricken areas and long-term, comparable, county-level poverty incidence data, the spatiotemporal patterns of transport accessibility and poverty alleviation in the poverty-stricken areas of China and the impact of transport accessibility on poverty alleviation lack extensive research. Generally, the impact of transport infrastructure on poverty alleviation can be divided into direct and indirect impacts [22]. The direct impacts refer mainly to the increased income of the poverty-stricken population [23], efficient use of regional natural resources [24,25], and nonfarm employment opportunities generated during the construction of transport infrastructure [23], all of which may directly lead to poverty alleviation. The indirect impacts refer to the trickle-down effects from developed areas to poverty-stricken areas resulting from transport connections, such impacts promote the economic development of poverty-stricken areas and lead to poverty alleviation. Based on these theories, numerous empirical studies have explored the impacts of transport development on poverty alleviation. Table 1 has summarized the main methods and findings of empirical studies about the effects of transport development on poverty alleviation in both China and other countries. Most of them were based on production functions such as the Cobb—Douglas production function [26,27,28,29], the aggregate production function [30,31,32], the cost function [33,34], and the constant elasticity of substitution (CES) production function [35] for the analysis. For the estimation techniques, regression analyses based on time series data or panel data were generally adopted, including the fixed-effects model [29,36,37], the random-effects model [36], the ordinary least squares (OLS) regression model [26,30,31,33], the simultaneous equations model [36,38,39], the generalized least squares (GLS) regression model, the Granger test [28,32], the vector autoregressive (VAR) model [40], the dynamic panel model [23,41], and the threshold effect model [24]. However, most of these studies were concentrated at the national or provincial level, and few focused on county-level poverty-stricken areas due to limited data availability. Additionally, due to the lack of long-term transport network data, most studies were based on the road density indicator instead of transport accessibility. Furthermore, most studies used proxy variables such as economic growth and productivity improvement as the measurement of poverty alleviation, and few have used poverty incidence to directly reflect the reduction of the poverty level. To fill these research gaps, in this study, we took Guizhou Province in China as the study area, estimated transport accessibility at the county level based on GIS spatial analysis data, and analyzed spatiotemporal patterns based on statistical methods. Moreover, we constructed a poverty index based on nighttime light data and LandScan population raster data to measure the county-level poverty conditions. Furthermore, we used the panel data regression model to quantitatively analyze the impact of transport accessibility on poverty alleviation. By revealing the spatiotemporal evolution patterns of transport accessibility and poverty alleviation in Guizhou from 2000 to 2018 and analyzing the poverty-reduction effects of transport accessibility, this study can provide references for transport-development and poverty-reduction strategies in the poverty-stricken areas of China and other developing countries.

Table 1.
Main methods and findings for estimating the poverty alleviation effects of transport development in previous studies.
The structure of this study is as follows. The next section describes the data and methodology adopted in this study. Then, the spatiotemporal patterns of transport accessibility, economic potential, and poverty alleviation, as well as the impacts of transport accessibility on poverty alleviation in all counties of Guizhou between 2000 and 2018, are analyzed in Section 3. After that, the influencing mechanism of transport accessibility on poverty alleviation and the related policy implications are discussed in Section 4. The last section summarizes the main findings of this study.
2. Data and Methods
2.1. Study Area
Guizhou Province is located in southwestern China, ranging in latitude from 24°37′–29°13′ N and in longitude from 103°36′–109°35′ E. This region covers 176.2 thousand km2 and contains 6 prefecture-level cities, including Guiyang, Zunyi, Liupanshui, Anshun, Bijie, and Tongren, and 3 autonomous prefectures, including Qiandongnan, Qiannan, and Qianxinan, comprising 88 county-level administrative regions. As part of the Yunnan-Guizhou Plateau, the average elevation of Guizhou is approximately 1100 m, and the region is higher in the west and lower in the east, sloping from the center to the north, east, and south. According to China’s third national land survey, 61.01% of the land in Guizhou has slopes greater than 25°, and 16.91% of the land has slopes between 15° and 25°. Thus, this region is dominated by plateaus and mountains, and karst landforms are widely distributed, leading to long-term transportation inconveniences and poverty conditions for the rural residents living in Guizhou. Accordingly, poverty alleviation through transport improvement has been a major strategy for reducing regional poverty in Guizhou. Since the beginning of the 21st century, the road network density increased from 0.19 km/km2 in 2000 to 1.12 km/km2 in 2018, with every county connected to expressways and every village connected to roads (Figure 1). In particular, 251 high bridges were built in Guizhou as fixed facilities bridging the road network among mountains since 2000, and half of the 100 highest bridges in the world are located in Guizhou. Moreover, the poverty conditions in Guizhou have been greatly improved with this transport infrastructure construction, with the rural poverty population decreasing from 3.13 million in 2000 [44] to 1.73 million in 2018 [45].
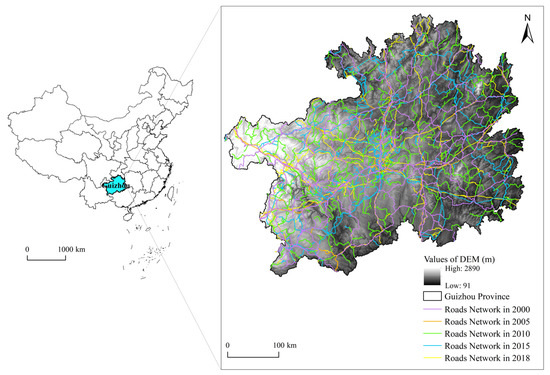
Figure 1.
Evolution of the road network in Guizhou Province, China (2000–2018).
2.2. Data Sources
This study was based on four types of data collected in Guizhou Province from 2000 to 2018, including road network data, nighttime light data, digital elevation model (DEM) data, and socioeconomic data. First, road network data with a scale of 1: 250,000 in 2000, 2005, 2010, 2015, and 2018 were obtained from the National Earth System Science Data Center, National Science & Technology Infrastructure of China (http://www.geodata.cn (accessed on 13 January 2022)). Second, nighttime light data from 2000 to 2018 were adapted from Zhong et al. (2022), who constructed a long-time-series nighttime light dataset of China with a spatial resolution of 1 km based on annual DMSP-OLS (2000–2013) nighttime light data and monthly NPP-VIIRS (April 2012-December 2020) nighttime light data [46]. Third, the DEM data were based on Global Digital Elevation Model Version 2 (GDEMV2) with a resolution of 30 m, downloaded from the Geospatial Data Cloud website (http://www.giscloud.cn (accessed on 6 February 2022)). Finally, the socioeconomic data, including county-level population, gross domestic product (GDP), urbanization rate, and fixed-asset investment data from 2000 to 2018, were attained from the statistical yearbook of Guizhou Province over the years, and 1 km-resolution LandScan population data (https://landscan.ornl.gov/ (accessed on 25 May 2022)) were used to estimate the poverty-stricken population and poverty index.
2.3. Data Analysis
2.3.1. Measurement of Transport Accessibility
Accessibility is an important indicator used to measure the interaction opportunities between each node and all other nodes in the transport network; this indicator can reflect the external connectivity of each node [47]. In this study, we chose the ASTT indicator to measure the county-level transport accessibility; the higher the ASTT is, the lower the transport accessibility of the county is. Due to the mountainous terrain in Guizhou, the travel speed may be limited by the slope and undulating terrain, and the ASTT should be estimated in consideration of the terrain. In this study, we tried to evaluate the transport accessibility of each county in Guizhou based on the ASTT calculated by the cost distance raster in the GIS spatial analysis platform. The detailed data analysis process is described as follows.
First, the vector data of the road network in Guizhou were rasterized and converted into a raster of 1-km × 1-km grids. For grids containing different road categories, the travel speed differed according to the technical road engineering standards in China (JTGB 01-2014), which were assumed to be 120 km/h, 100 km/h, 80 km/h, 60 km/h, and 120 km/h, on highways, national roads, provincial roads, and railways, respectively. For grids without roads, the speed was determined from the average elevation and slope (Table 2). After masking areas in which the speed assignment did not need to be modified, the “Raster Calculator” tool in ArcGIS was used to set the speed assignment based on the reclassification results, and the process was repeated until the speed assignments of all grids without the roads were completed.
Table 2.
Speed assignments of grids without roads based on the average elevation and slope.
Based on the speed assignment of each grid, reclassification was performed to convert the speed cost raster to the time cost raster for all the 1-km × 1-km grids. Then, taking the government locations of 88 counties in Guizhou as the nodes of the transport network, the minimum travel accumulation time between each county and all other counties was calculated through ArcGIS cost distance analysis, and the travel-time unit was converted to “hours”. After that, the shortest travel time between each county and all other counties were calculated, and finally, the ASTT of each county was extracted and summarized. The specific calculation formula for estimating the ASTT was as follows:
where Ti is the ASTT of node i; tij is the shortest travel time between node i and node j; and n is the total number of nodes in the study area.
To analyze the spatiotemporal pattern of transport accessibility in Guizhou, we further calculated the dispersion index of transport accessibility at the county level. The smaller the accessibility dispersion index is, the more balanced the accessibility among different counties in the region and the stronger the regional synergy are. This index was calculated as follows:
where AD is the dispersion index of transport accessibility of the whole region; Pi is the resident population of node i; Ti is the ASTT of node i; STi is the standard deviation of Ti values; and n is the number of nodes in the study area.
2.3.2. Measurement of Economic Potential
The economic potential model can also be used to measure the interaction opportunities between different nodes, representing the attractiveness and emissivity of each node. Based on the traditional gravity model, in this study, we incorporated economic indicators and transport accessibility indicators to evaluate the economic potential of each county in Guizhou. These indicators were calculated as follows:
where Ei is the economic potential of node i; n is the number of nodes in the study area; Mj is the mass of node j; Gj is the GDP of node j, which was converted to constant price with 2000 as the base year; Pj is the resident population of node j; Tij is the shortest travel time between node i and j; and a is the distance friction coefficient between node i and j, which has a value of 1.
2.3.3. Measurement of the Poverty Index
Due to changes in the statistical caliber of the poverty-stricken population in China since 2000, it was difficult to obtain data about poverty incidence in Guizhou over the years. We tried to estimate the poverty-stricken population and poverty index of 88 counties in Guizhou based on the poverty index model proposed by Elvidge et al. [50]. Both nighttime light data and LandScan demographic data in Guizhou from 2000 to 2018 were collected for the estimation.
Firstly, the grids without nighttime light were identified based on the nighttime light data.
where Lk is the night light identification of the grid k according to the nighttime light data. When the Dk value is greater than 0, grid k is not identified as a grid without nighttime light and Lk is 0; when the Dk value is 0, the grid is identified as a grid with nighttime light, and Lk is 1.
Then, the populations in the grids without nighttime light were identified as poverty-stricken populations based on LandScan demographic data.
where Rk is the number of poverty-stricken people in the grid k. When the Lk value is 0, the population in poverty is assumed to be 0; when the Lk value is 1, the population in grid k is identified as the population in poverty. In the above equation, Sk is the population in grid k of the LandScan demographic data.
Finally, the poverty index of each county was measured based on the proportion of the total poverty population in the total population in the county to measure the poverty level of the county.
where Fi is the poverty index of the county i; Ui is the total poverty-stricken population in county i; Pi is the total resident population in county i; k is the grid; and z is the total number of grids in county i.
2.3.4. Panel Data Regression Model
Panel data regression analysis was first introduced into econometrics by Mundlak (1961) and Balestra and Nerlove (1966) [51,52]. Then, Wallace (1969) improved the panel data regression model by deriving a two-dimensional error decomposition model with time and individual effects based on panel data [53]. Accordingly, the application of the panel data model has gradually changed from microlevel research to macrolevel economic research and has become a widely used statistical model [54]. Compared to other models, the panel data regression analysis method has the advantage of solving the problem of insufficient sample sizes and significantly reducing the problems caused by variables that are difficult to observe or measure. According to the correlations between the unobserved effects and explanatory variables in the panel data, panel data regression analyses can be divided into fixed-effect models and random-effect models.
Based on data from 88 counties in Guizhou from 2000 to 2018, a panel data regression model was established. Table 3 lists all the variables in the model. The poverty index (POV) was the dependent variable and was measured by the proportion of the poverty-stricken population in the total residential population in each county over the years of study, as determined based on the nighttime light data and the LandScan demographic data. To explore the impact of transport development on poverty reduction in Guizhou, transport accessibility (ASTT) was the core explanatory variable. This variable is an inverse index, meaning that the larger the ASTT is, the lower the transport accessibility of the county is. The selection of control variables was performed mainly in reference to the study of Kang et al. (2014), taking the data availability and stability of Guizhou into account [22]. Accordingly, four control factors were selected, including the urbanization development, industrial structure, social development, and infrastructure investment. In particular, urbanization development (BUI) was measured using the ratio of construction land area to the total area in each county, determined based on the land use surface data in the land use and land cover dataset. The industrial structure (INS) was measured from the ratio of the tertiary industry in the GDP of each county. Social development (RAT) was measured by the annual growth rate of per-capita GDP in each county. Infrastructural investment (INV) was measured by fixed-asset investment in each county.
Table 3.
Summary of variables in the panel data regression analysis.
All indicators in Table 3 were logarithmically transformed to reduce the heteroscedasticity of the data and achieve a more symmetrical variable distribution and smoother variables. The smoothness of the indicators was verified by the unit root test. Stepwise regression was used to sequentially add all explanatory variables, and no multicollinearity was found among the variables obtained from the screening process. The model equations were developed as follows:
where POVit is the poverty index of county i in year t; ASTTit is the transport accessibility of county i in year t; BUIit is the urbanization development; INSit is the industrial structure; RATit is the social development speed; INVit is the infrastructure investment; and β1, β2, β3, β4, and β5 are estimated coefficients; β0 is a constant item; and is the error term.
3. Results
3.1. Spatiotemporal Pattern of Transport Accessibility
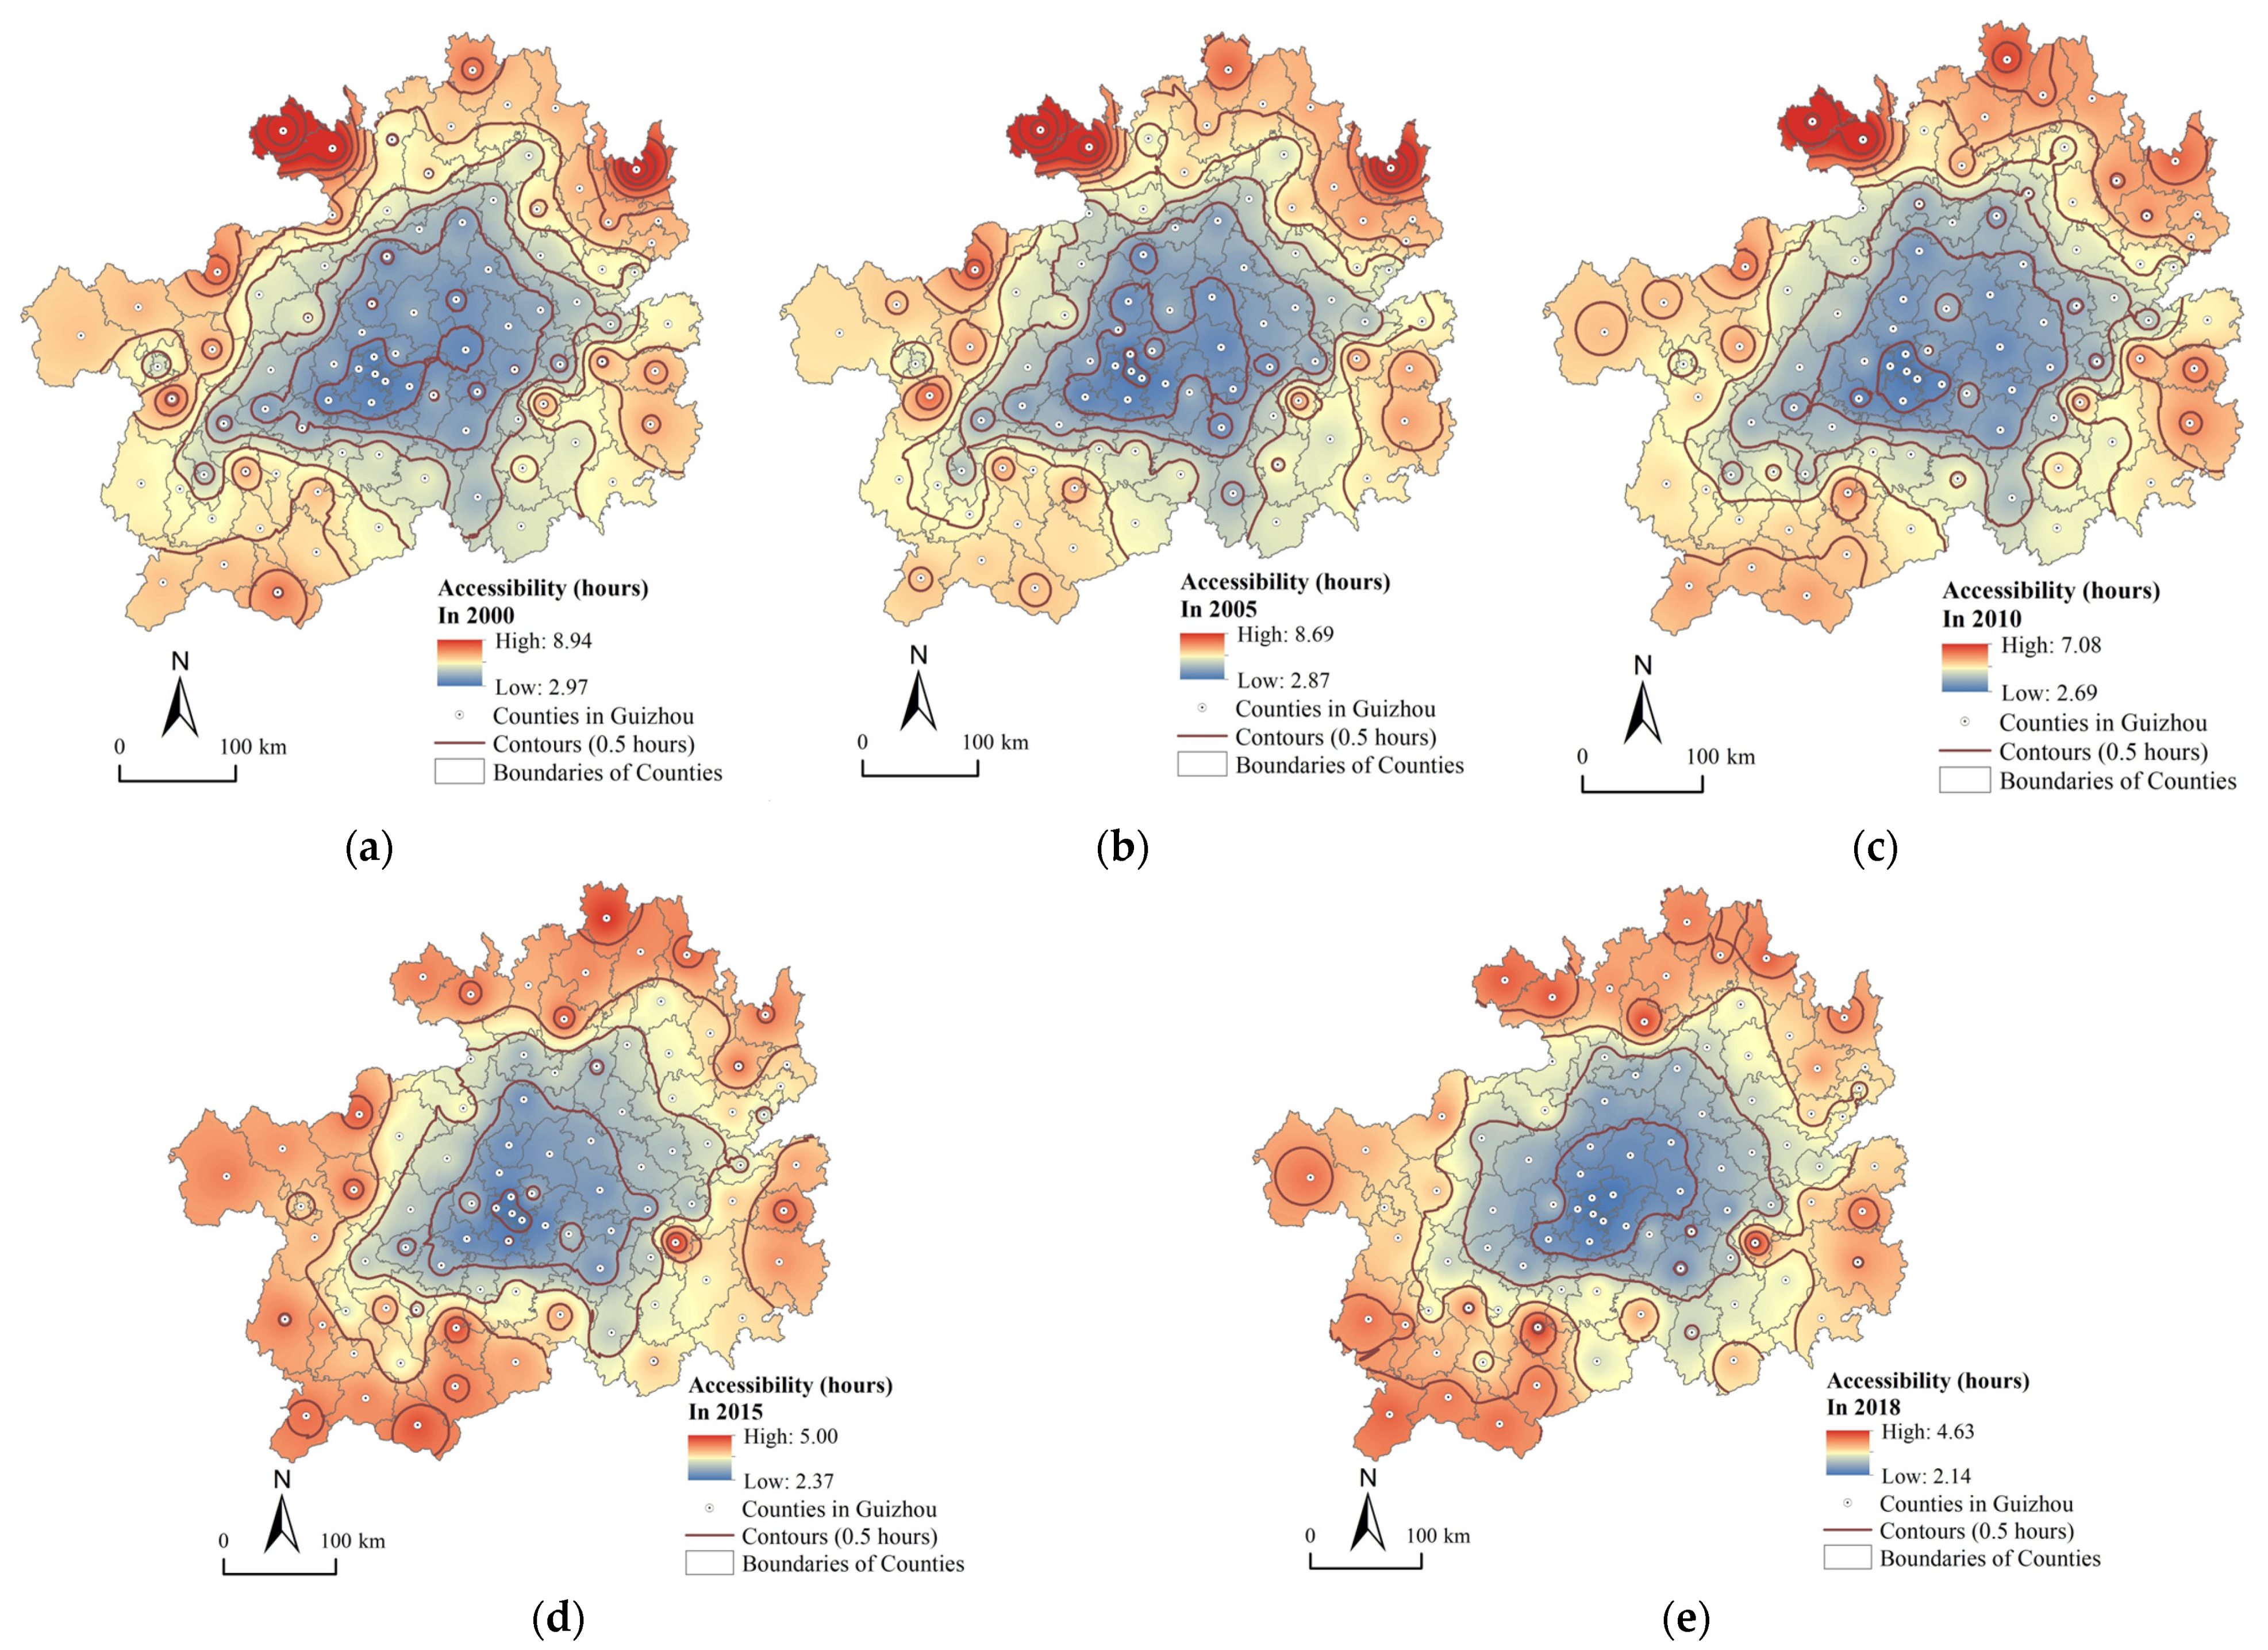
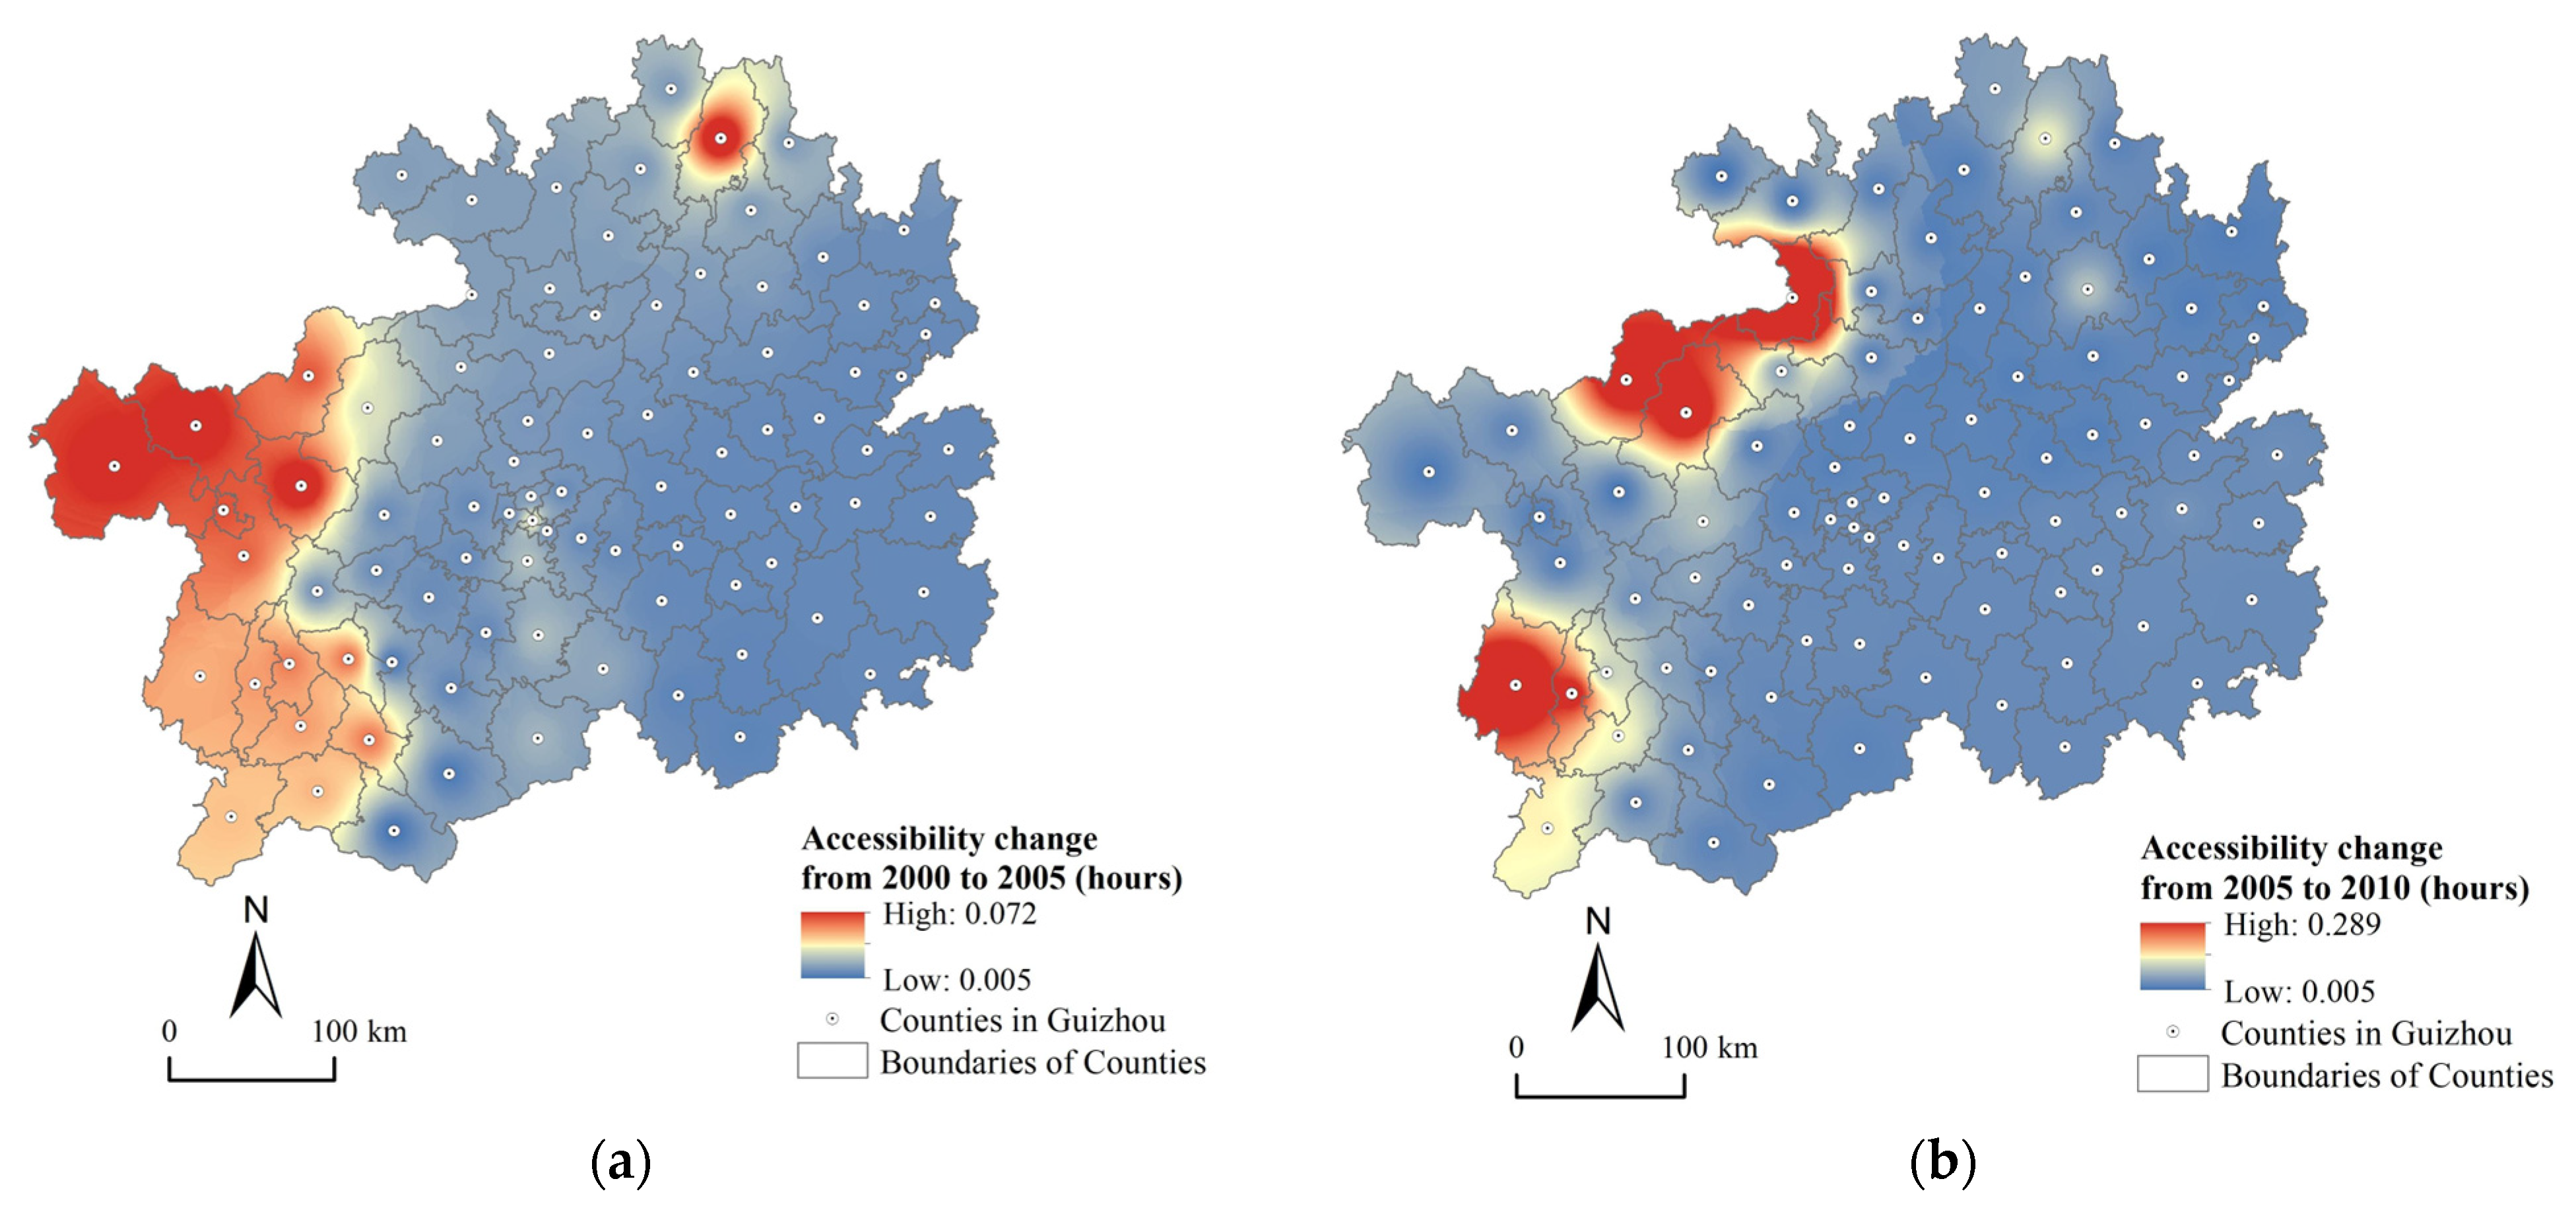
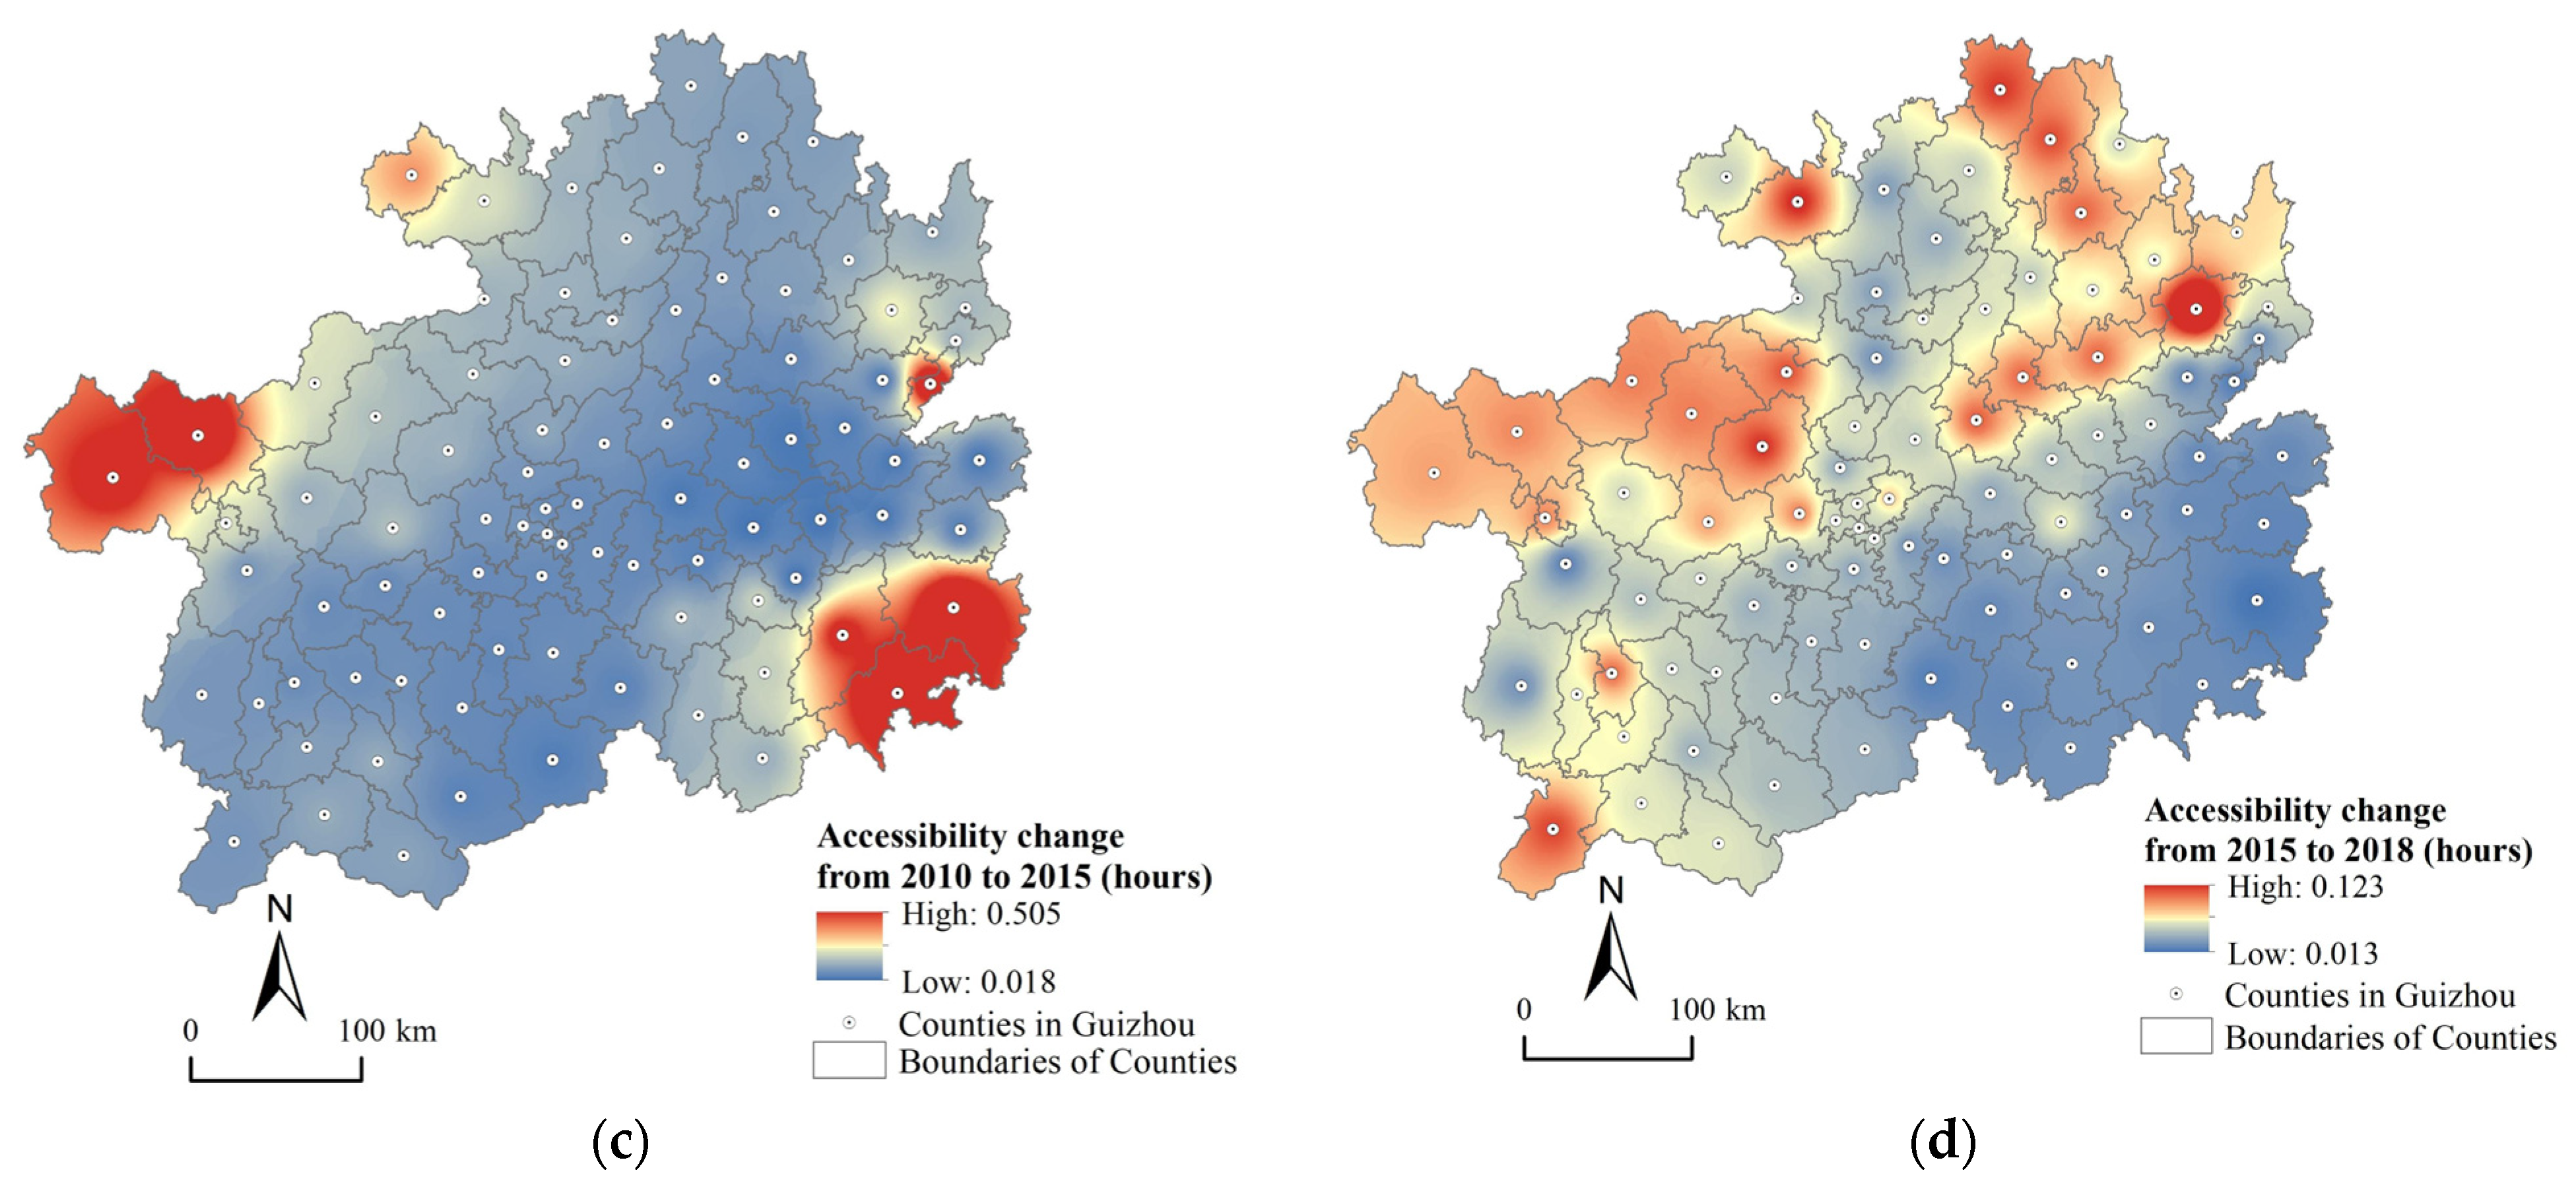
Based on the inverse distance weight (IDW) method in the ArcGIS platform, the ASTT of each county in Guizhou Province, considered an independent node, was interpolated to obtain the spatial transport accessibility distribution patterns in Guizhou Province in 2000, 2005, 2010, 2015, and 2018. As Figure 2 shows, the accessibility contours changed from dense to sparse, indicating transport accessibility improvements in the counties of Guizhou. In particular, transport accessibility improved the most after 2010. The improvement rates of transport accessibility were 15.44% from 2010–2015 and 9.83% from 2015–2018, much higher than those of 4.11% during 2000–2005 and 7.88% from 2005–2010. These results were closely related to transport infrastructure construction, which connected all counties to expressways by 2015. Moreover, the spatial pattern of transport accessibility in Guizhou has exhibited a typical “core–periphery” pattern during the study period, with the highest transport accessibility found in central Guizhou, such as in the districts of Guiyang city, and the transport accessibility decreasing from the center to the peripheral areas. As Table 3 shows, in 2000, the highest transport accessibility was found in Yunyan district, located in central Guizhou, with the shortest ASTT (2.97 h), while the lowest transport accessibility was found in Chishui city, located in northwestern Guizhou, with the longest ASTT (8.94 h); the gap between counties with the highest and lowest transport accessibilities was nearly 6 h. In 2018, the highest transport accessibility was still found in Yunyan District, with the shortest ASTT among all the counties of Guizhou Province (2.13 h), while the lowest transport accessibility was found in Leisan County, with the longest ASTT of 4.63 h. Accordingly, the gap between the counties with the highest and lowest transport accessibility was reduced to 2.5 h, indicating that the transport connectivity in Guizhou province had greatly improved, especially for the remote, mountainous counties. From 2000–2018, the average ASTT reduction in all counties of Guizhou exceeded 2 h, varying among different counties. As Figure 3 shows, 24% of the counties in Guizhou experienced ASTT reductions greater than 2 h, 58% of counties experienced ASTT reductions between 1 and 2 h, and 18% of counties experienced ASTT reductions below 1 h. The county with the most significant improvement in transport accessibility was Chishui city, where the ASTT decreased from 8.94 h in 2000 to 4.34 h in 2018.

Figure 2.
Spatial distribution of transport accessibility in the counties of Guizhou, China, from 2000–2018. (a) The spatial distribution of transport accessibility in 2000; (b) the spatial distribution of transport accessibility in 2005; (c) the spatial distribution of transport accessibility in 2010; (d) the spatial distribution of transport accessibility in 2015; and (e) the spatial distribution of transport accessibility in 2018.


Figure 3.
Changes in transport accessibility in Guizhou, China, from 2000–2018. (a) Accessibility change from 2000 to 2005; (b) accessibility change from 2005 to 2010; (c) accessibility change from 2010 to 2015; and (d) accessibility change from 2015 to 2018.
With improvements to transport infrastructure, and especially with the construction of expressways and high bridges in remote areas, the areas with low ATSS values and high transport accessibility were broadened, suggesting that the regional transport accessibility tended to become more balanced. The dispersion index of transport accessibility was further used to estimate the regional disparity of transport accessibility in Guizhou. Our estimated transport accessibility dispersion index values in 2000, 2005, 2010, 2015, and 2018 were 0.242, 0.248, 0.229, 0.198, and 0.212, respectively. Thus, this index showed a downward trend throughout the study period, especially from 2005–2015, indicating that the accessibility in Guizhou tended to be balanced and that the regional synergy and sustainability increased over the years of study. However, the gap between the core cities and peripheral counties of Guizhou was still large, at nearly 2.5 h, and the counties in the northern and southwestern regions adjacent to other provinces had the lowest transport accessibilities, thus emphasizing the areas where further transport developments are needed to support poverty alleviation and rural revitalization.
3.2. Spatiotemporal Pattern of Economic Potential
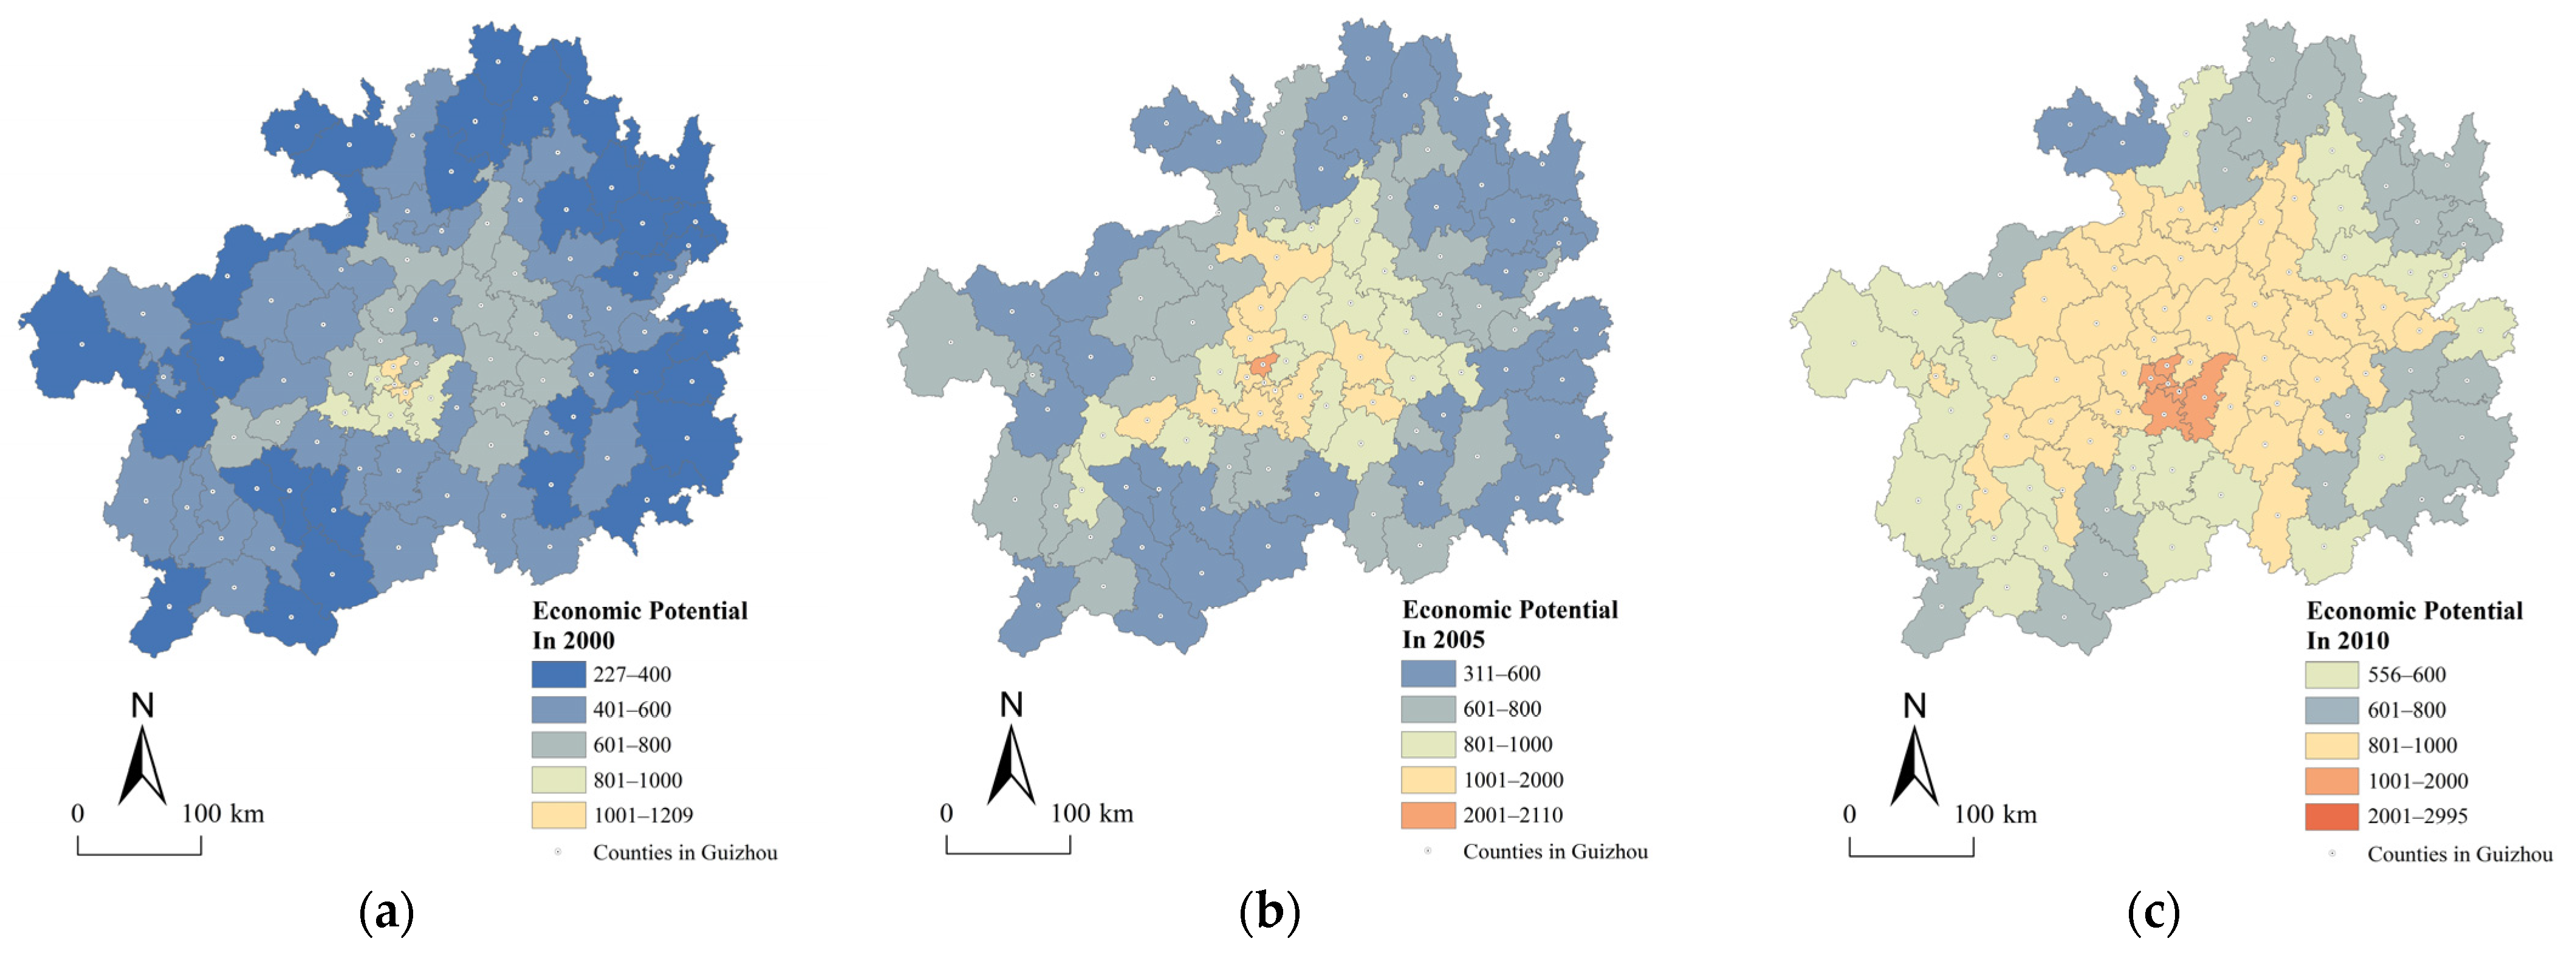
Figure 4 shows the spatiotemporal patterns of economic potential in the counties of Guizhou. In terms of temporal evolution, the economic potential of counties in Guizhou exhibited a continuous growth trend from 2000 to 2018, with the lowest value increasing from 227 to 1293, the highest value increasing from 1209 to 6257, and the mean value increasing from 510 to 2514. This means that the attractiveness of the central cities increased while the population, capital, and information interactions among different counties intensified; these changes were beneficial for regional development and poverty alleviation. In terms of the spatial pattern, the spatial distribution of the economic potential among counties varied greatly, showing a “core–peripheral” pattern, decreasing from the central core area to the peripheral areas. In particular, the regions with the highest economic potential were distributed mainly in the municipal districts in southern Guiyang, including Baiyun, Nanming, Yunyan, Guanshanhu, and their adjacent counties, including Longli, Huaxi, and Pingba, with the range of high-economic-potential areas expanding from the core of Guiyang to its periphery from 2000–2018. Moreover, the gap between the core area and the peripheral areas gradually decreased, with the coefficient of variation of the economic potential increasing from 0.391 in 2000 to 0.452 in 2005 and then decreasing to 0.419 in 2018, indicating that the overall pattern has approached equilibrium since 2005.


Figure 4.
Spatial distribution of economic potential in the counties of Guizhou, China, from 2000–2018. (a) The spatial distribution of the economic potential in 2000; (b) the spatial distribution of economic potential in 2005; (c) the spatial distribution of economic potential in 2010; (d) the spatial distribution of economic potential in 2015; and (e) the spatial distribution of economic potential in 2018.
3.3. Spatiotemporal Pattern of the Poverty Index
Due to the repeated adjustment of statistical calibration of poverty incidence in China since 2000 and the difficulty of obtaining county-level, long-time poverty incidence data in Guizhou, the available county-level poverty incidence data cannot be directly used for analysis. In this study, therefore, we constructed a poverty index based on nighttime light data and LandScan demographic data to evaluate the poverty conditions in different counties of Guizhou from 2000–2018. To verify the validity of the estimated poverty index, we tested it using comparisons with the officially published poverty incidence data in Guizhou (Figure 5). Poverty incidence data representing Guizhou counties in 2015 were collected from the Guizhou Statistical Yearbook for these comparisons. Based on the linear correlation analysis results obtained between the poverty index estimated in this study and the officially published rural poverty incidence data, we found that the fitting results between the county poverty index and rural poverty incidence in 2015 were good, with a Pearson correlation coefficient of 0.695 (p < 0.001), indicating a strong correlation and supporting the reliability of the poverty index results obtained in this study.

Figure 5.
Linear fitting results between the poverty index and poverty incidence data in Guizhou, China.
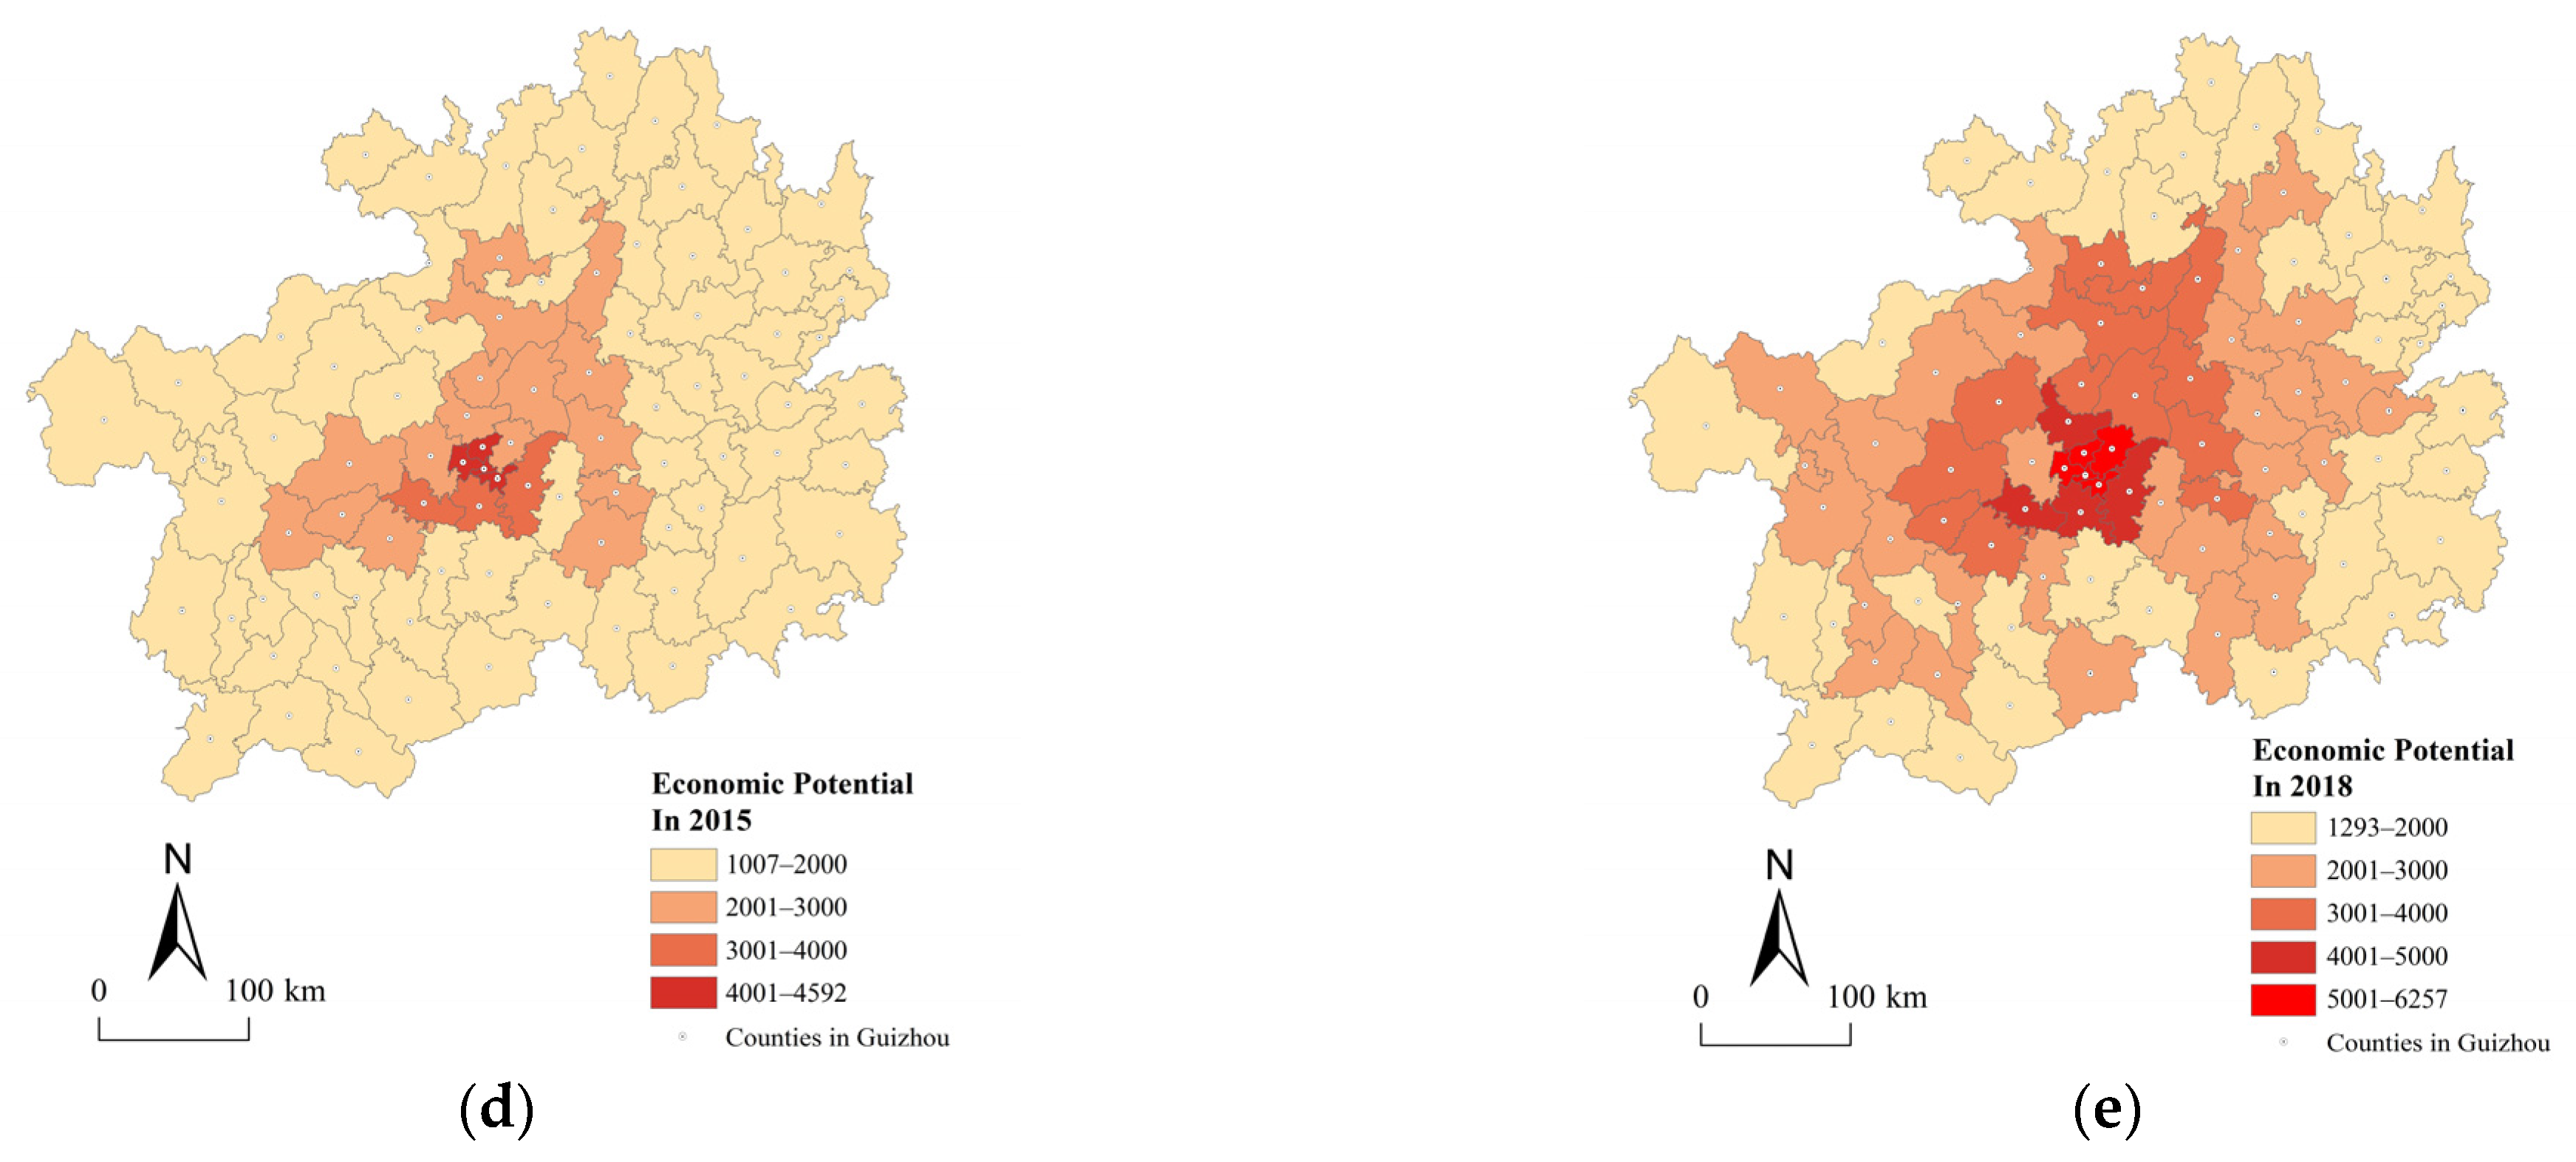
According to the poverty index values estimated in this study, the poverty index values of the counties in Guizhou significantly decreased from 2000 to 2018; the mean poverty index values in different counties decreased from 0.75 to 0.29; and the standard deviation decreased from 0.27 to 0.19, suggesting the effectiveness of regional poverty alleviation (Table 4). In terms of the spatial pattern, the spatial distribution of the poverty index in Guizhou Province showed a “core–peripheral” distribution pattern, with low poverty index values in the districts and counties of Guiyang and high poverty index values in the peripheral areas (Figure 6). In particular, since the implementation of the Targeted Poverty Alleviation Policy in China, the poverty index values in eastern Guizhou was greatly reduced, with the number of counties corresponding to deep poverty being significantly reduced from 2015–2020. By 2018, the areas with relatively high poverty levels were concentrated in a few counties located in southern and southeastern Guizhou, with the highest poverty levels in Liping and Jianhe of Qiandongnan Miao and Dong autonomous prefecture; thus, these areas require further poverty alleviation strategies.
Table 4.
Transport accessibility and poverty index values of counties in Guizhou (2000, 2018).

Figure 6.
Spatial distribution of the poverty index values in the counties of Guizhou, China, from 2000–2018. (a) Poverty index values in 2000; (b) poverty index values in 2005; (c) poverty index values in 2010; (d) poverty index values in 2015; (e) poverty index values in 2018.
3.4. Impact of Transport Accessibility on Regional Poverty Alleviation
Before conducting the panel data regression analysis, the collinearity test of independent variables was conducted by estimating the variance inflation factor (VIF) of each variable, and the unit root test of variables was conducted by applying both the Levin, Lin, and Chu (LLC) test and the Augmented Dickey–Fuller test (ADF) test. As Table 5 shows, the VIF values of all the variables were less than 10 and the p value of each variable was 0.000 (<0.05), indicating that all the variables were stationary without collinearity or unit root. Usually, three types of estimator techniques can be adopted for panel data regression analyses, including the OLS estimator, the fixed-effects model, and the random-effects model. Since the F test suggested that the p value of F = 0.000 was smaller than 5%, the fixed-effects model was selected here instead of the OLS model. By applying the Hausman test, the results (p < 0.001; chi2(5) = 25.761) indicated that the appropriateness of the fixed-effects model was greater than the random-effects model. Considering that the assumptions of the random-effects model were quite strict and that there was a high risk associated with omitted independent variables, the fixed-effects model was selected as the most suitable model.
Table 5.
Results of the collinearity test and unit root tests applied to variables.
Table 6 summarizes the results of the fixed-effects model for the 88 counties of Guizhou from 2000 to 2018. The dependent variable was the poverty index of each county in each specific year. The regression coefficients of transport accessibility and other controlled variables are all presented. This result suggested that transport accessibility, urbanization, social development, and infrastructural investment were significantly correlated with the poverty index. In particular, transport accessibility was positively correlated with the poverty index, with a regression coefficient of 0.839, indicating that the elasticity of improving transport accessibility was approximately 0.839. As transport accessibility was an inverse variable, it reflected that a decrease in the ASTT could positively promote a reduction in the poverty level of each county. When the ASTT was shortened by 100%, the poverty index decreased by 83.9%. Thus, transport accessibility improvements were found to be a significant driving factor for regional poverty alleviation. We also found that urbanization and infrastructure investment had negative effects on the poverty index, and the elasticities of these two indicators were −0.223 and −0.120, respectively, suggesting that the rapid urbanization process represented by urban construction land expansions and high infrastructure investments resulting from fixed-asset investments also contributed to poverty reduction in Guizhou, with the effect of urbanization being larger than that of infrastructure investment. In contrast, the social development (RAT) has a significant positive effect on poverty index with a regression coefficient of 0.230, indicating that the counties with rapid growth of per capita GDP were the counties with high poverty index. This may be attributed to the late-development advantage of poverty-stricken counties and strong anti-poverty policies in Guizhou province. Moreover, the huge imbalance between urban and rural areas can lead to the situation that the high rate of economic growth does not necessarily lead to a reduction in poverty. It means that the sustainability of poverty alleviation depends not only on the economic development, but also the income distribution institution.
Table 6.
Results of the fixed-effects model for all counties in Guizhou, 2000–2018.
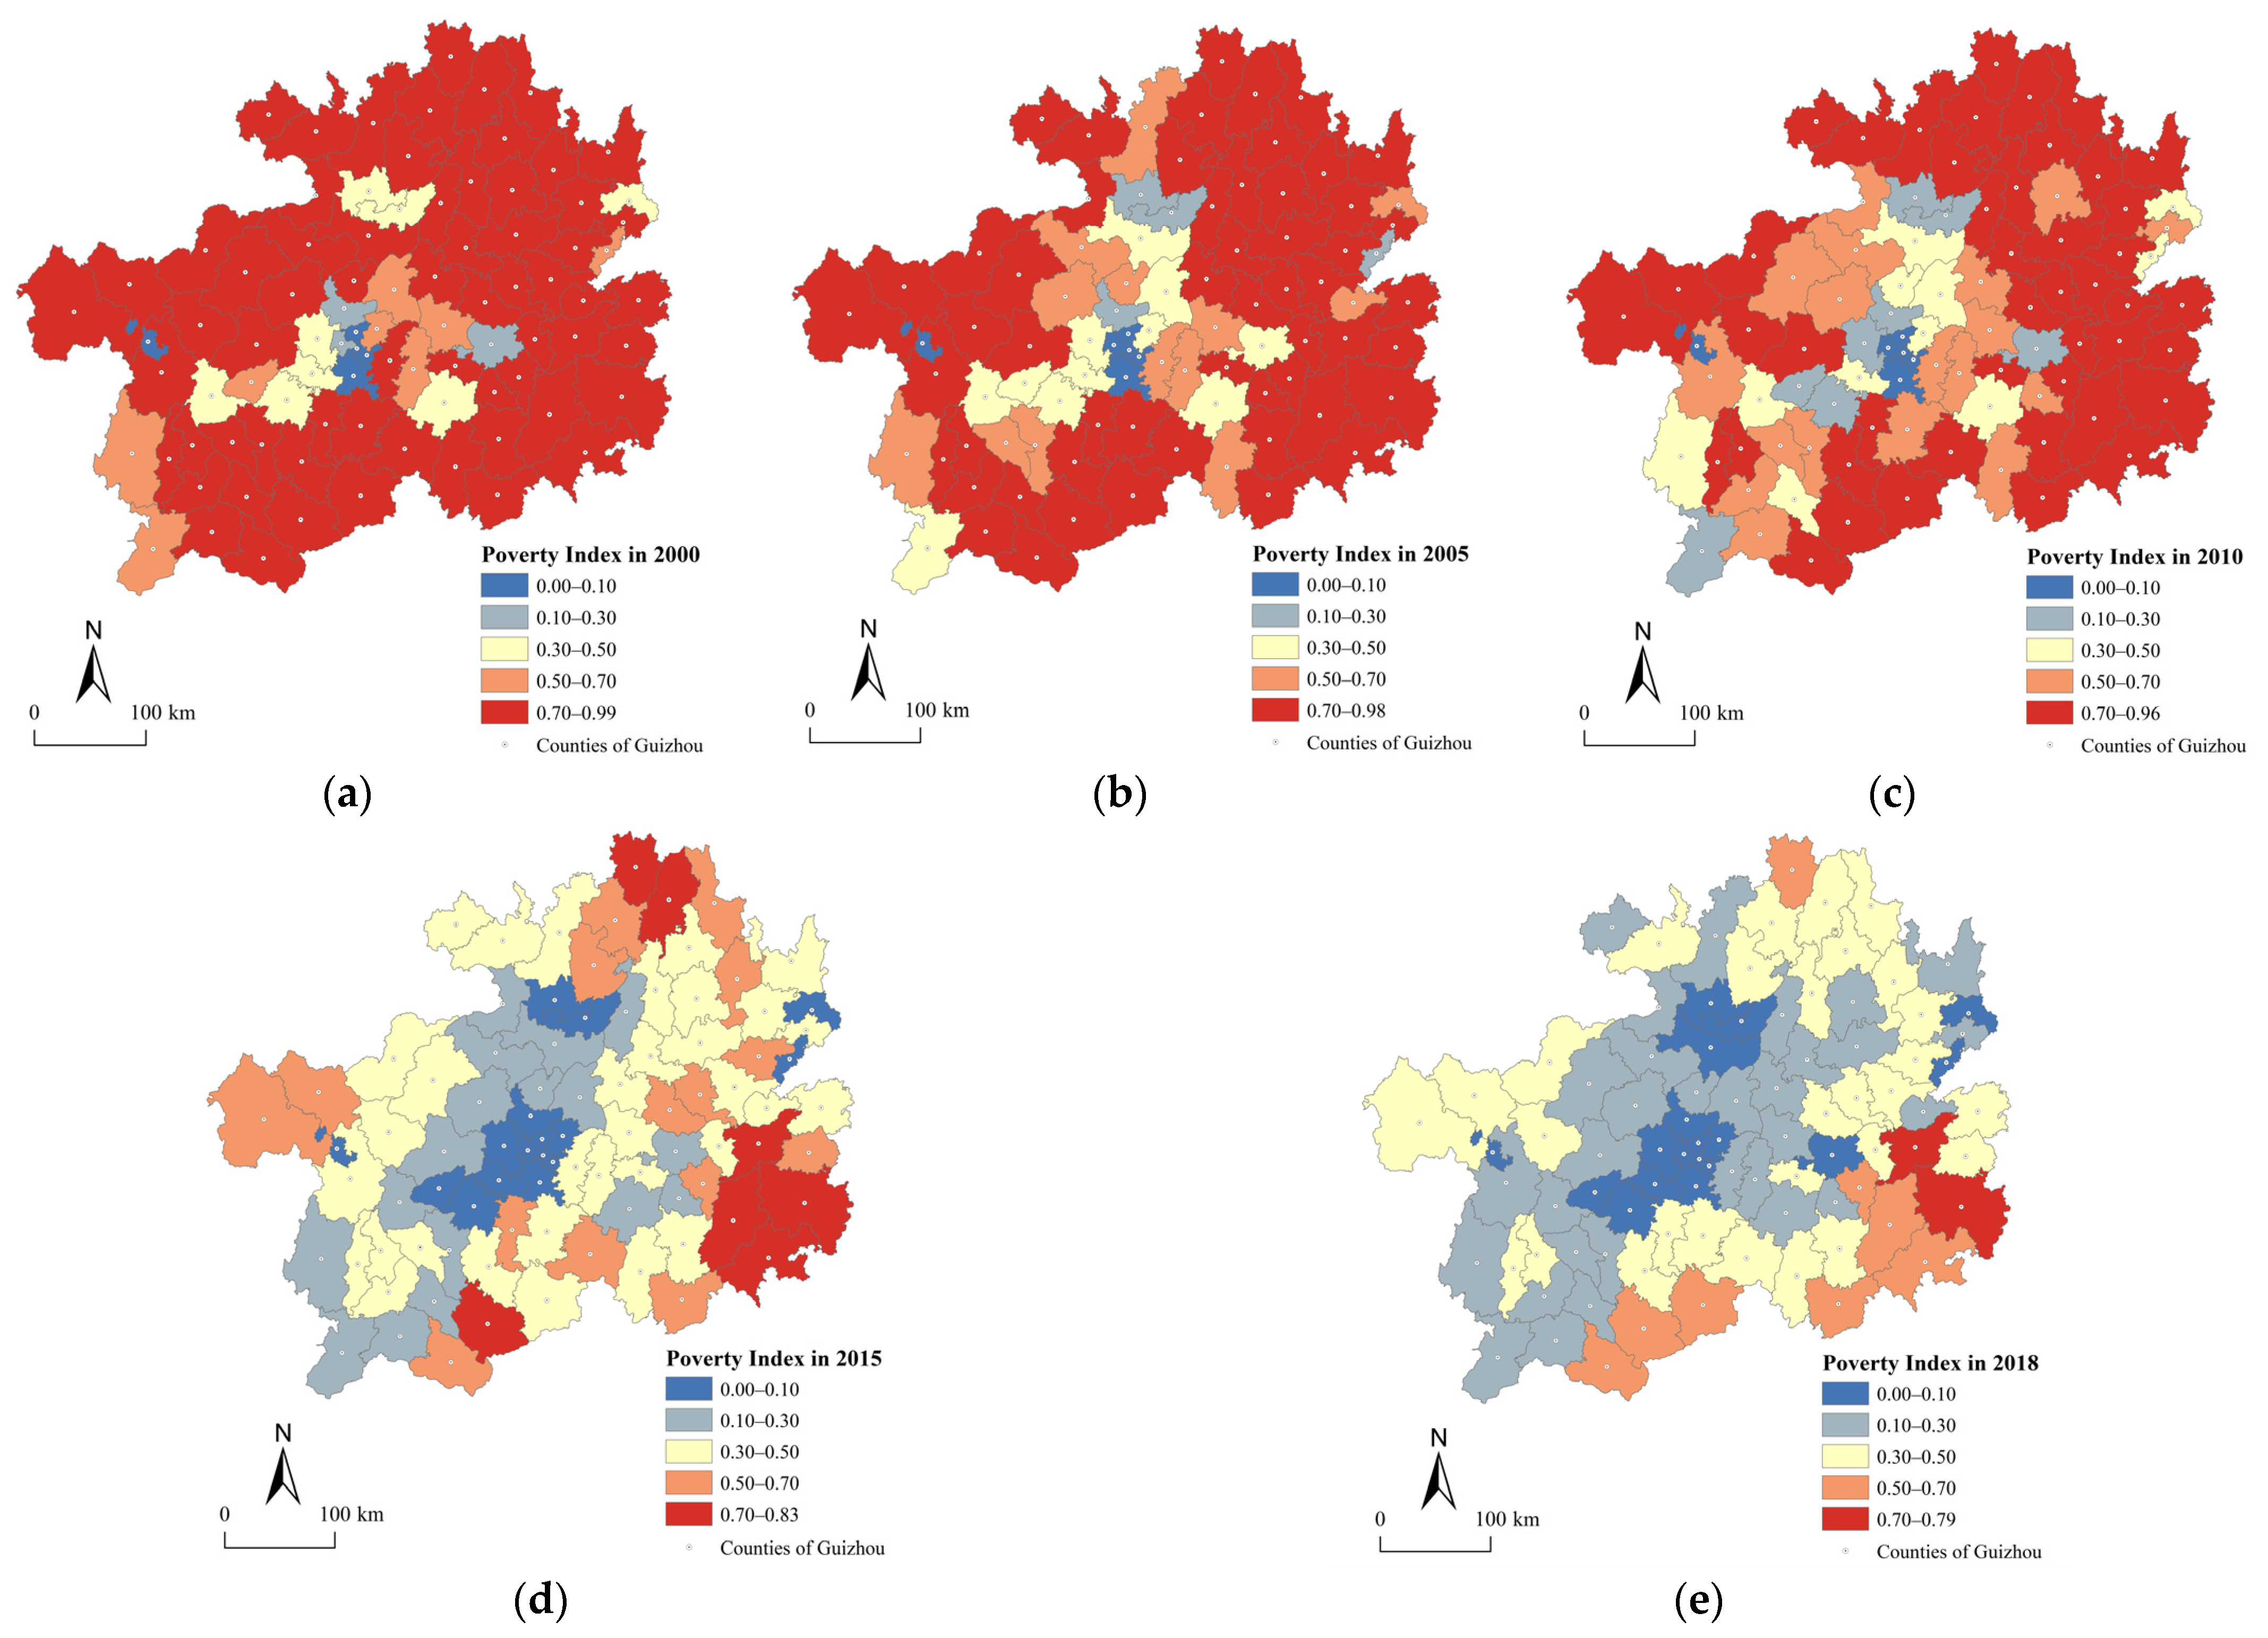
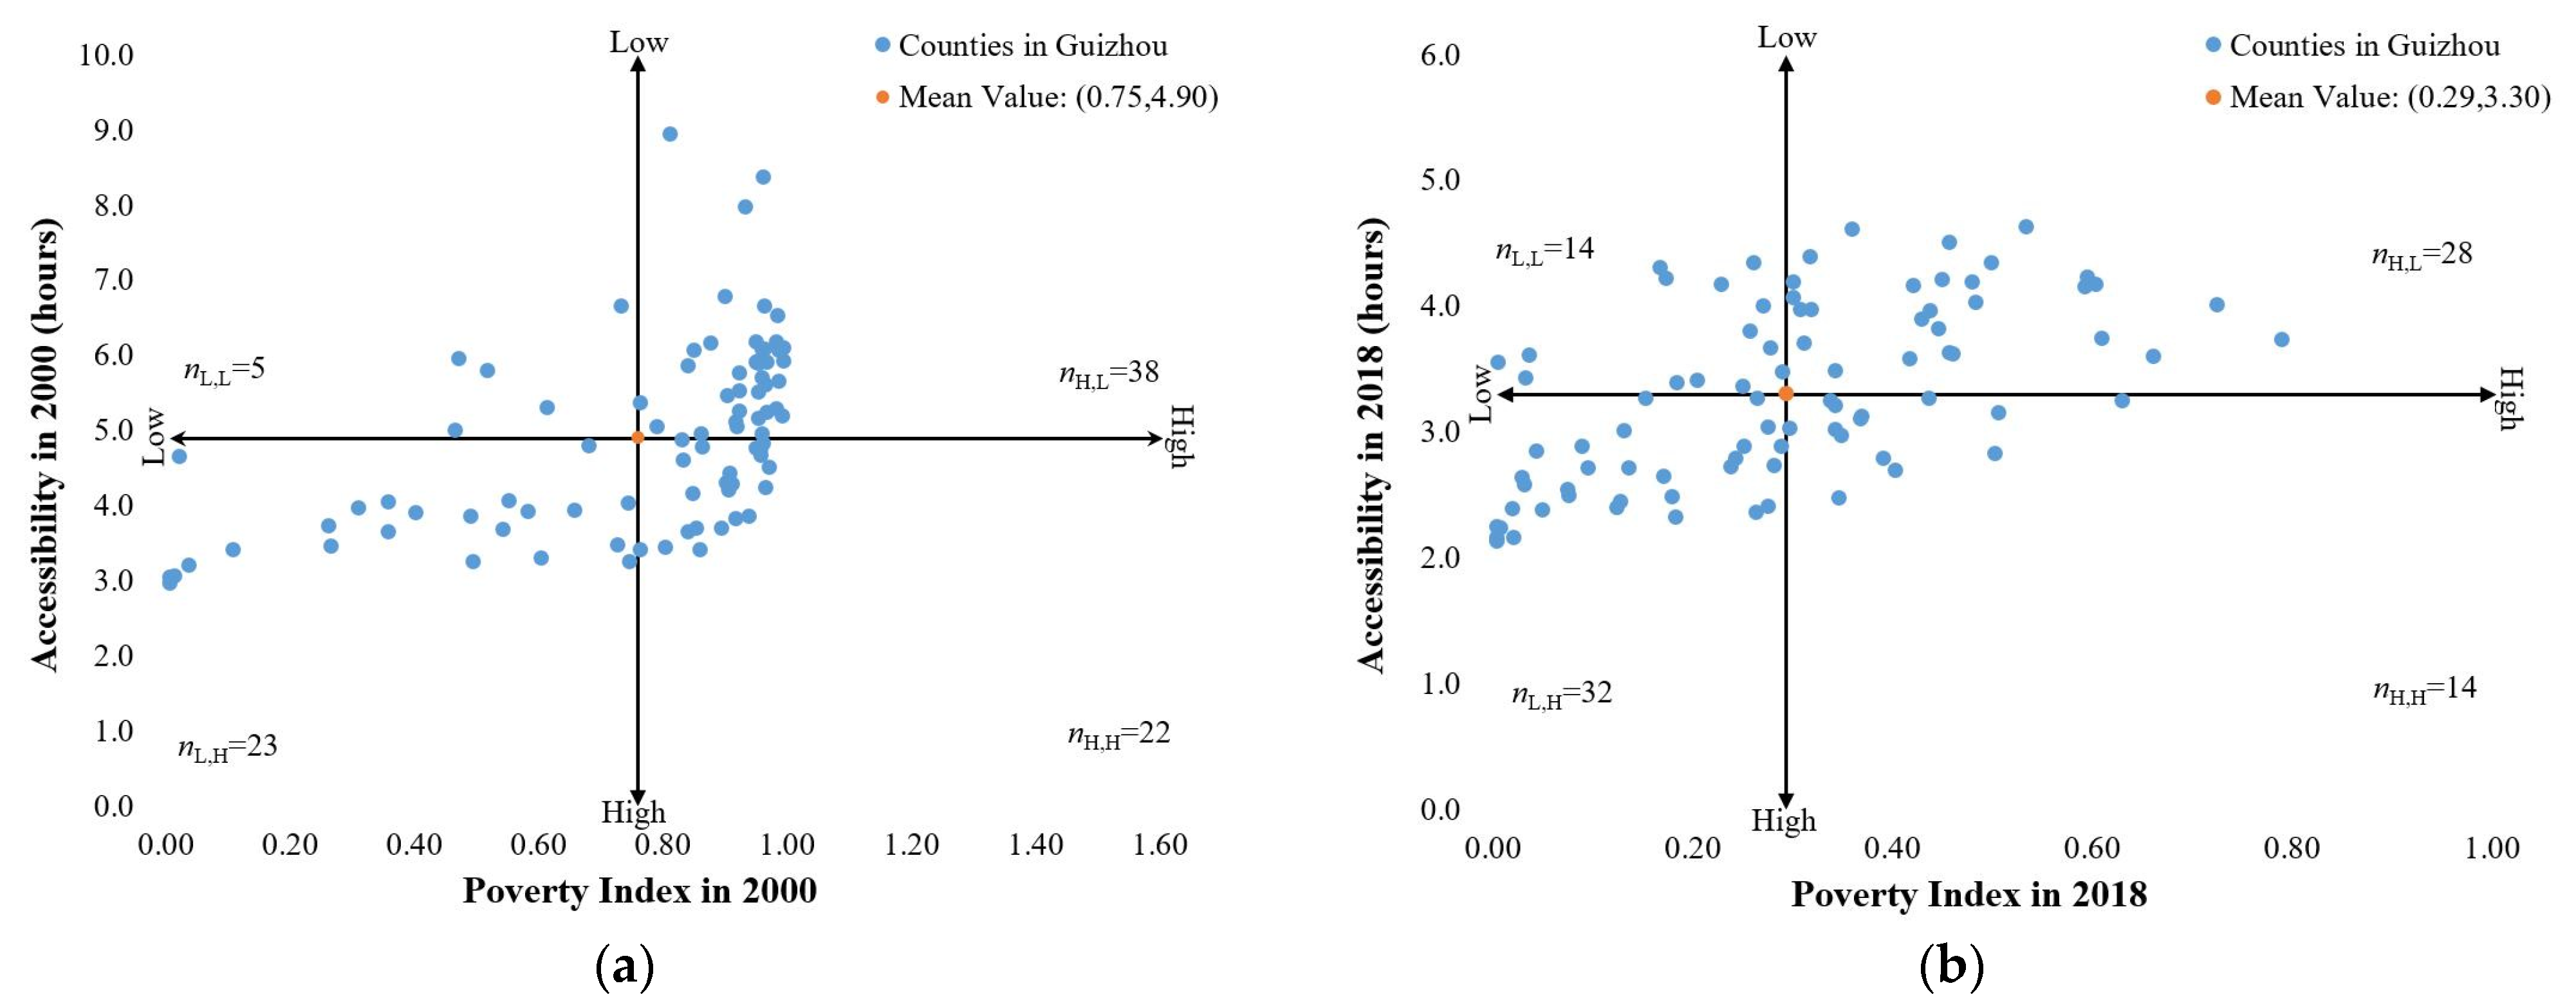
Based on the distribution of transport accessibility and poverty index in each county from 2000 to 2018, in Figure 7, the 88 counties of Guizhou are categorized into four types: counties with low poverty index values and high accessibility levels (L-H), counties with low poverty index values and low accessibility levels (L-L), counties with high poverty index values and high accessibility levels (H-H), and counties with high poverty index values and low accessibility levels (H-L). The division value between the low and high values was determined by the mean of transport accessibility and poverty index. As Figure 7 shows, in 2000, the number of counties with high poverty index values and low accessibility was the largest (nH,L = 38), while the number of counties with low poverty index values and low accessibility was the smallest (nL,L = 5). This means that the poverty usually occurred in counties with low accessibility. In 2018, the number of counties with high poverty index values and low accessibility decreased (nH,L = 28), while the number of counties with low poverty index values and low accessibility increased (nL,L = 14). These results suggested that most counties with low transport accessibility were also counties with high poverty index values, while there were still a few counties with low poverty index values despite high transport accessibility, and there were also a few counties with high transport accessibility but high poverty index values, showing that the development of transport infrastructure did not lead to a poverty reduction effect in all regions.

Figure 7.
Coupling distribution of the accessibility and poverty index of counties in Guizhou Province (2000–2018). (a) The coupling distribution of accessibility and the poverty index in 2000; and (b) the coupling distribution of accessibility and poverty index in 2018.
4. Discussion
4.1. Evolution of Transport Accessibility and Poverty Alleviation
The spatiotemporal evolution results of transport accessibility in the counties of Guizhou Province show that transport accessibility improved significantly during the study period, indicating massive transportation infrastructure construction. This change can be attributed to the increasing transport demands from social and economic development, the strategic requirements of national and regional development, and the planning and layout of transport infrastructure. In this study, we found that the annual reduction rate of average ATSS among all counties was much larger after 2010 than before 2010, meaning that the transport accessibility in Guizhou experienced a shift from slow improvement to rapid improvement. This change was closely related to the transport policies in China geared toward providing all counties with access to expressways and all villages with access to roads since 2010. This change was likely also influenced by a 4-trillion-yuan investment in infrastructure by the Chinese government in 2008 under the background of the global financial crisis. Nevertheless, the terrain in the mountainous areas can make the construction of transport infrastructure more complicated than that in plain areas; thus, mountainous areas require greater investments.
In terms of spatial changes, the transport accessibility of Guizhou Province was generally low in the southwestern and northeastern regions and high in the central part, where the capital city Guiyang is located, showing an obvious “core–periphery” pattern. This pattern is similar to the spatial economic potential pattern, which also shows a gradually decreasing toward the peripheral edge areas according to the irregular-circle shape of the study area. Among the four county types classified by accessibility and poverty index (Figure 7), L-H counties were mainly located in the core area of Guizhou Province, and the core area expanded along the northwest; L-L counties and H-L counties were mainly distributed in the peripheral marginal areas of Guizhou Province, and the number has decreased; and H-H counties were mainly located in the transition area between the core area and the peripheral area. Thus, to expand the radiation range of the central city and narrow the regional gap, more investment in transport infrastructure was required for the peripheral counties. However, due to the mountainous terrain in these peripheral poverty-stricken areas, the construction of transport infrastructure was restricted, and high bridges were needed to connect high mountains and deep valleys. Notably, from 2000 to 2018, a total of 251 high bridges were constructed in Guizhou Province. From 2015–2018, 105 new high bridges were built, more than the total number of high bridges constructed from 2000 to 2015. Most of these high bridges were located at the intersections of expressways or railways and were usually used as fixed facilities to connect road networks between specific areas. Thanks to them, originally fragmented roads could be connected to form regional transport networks, and the interactions between the peripheral counties and the central city of Guizhou could be intensified, thus improving the transport condition of the poverty area and providing a strong guarantee for its poverty reduction and livelihood improvement. Thus, the transport development in Guizhou can improve the regional human–land relationship and promote regional sustainable development.
4.2. Effect of Transport Accessibility on Poverty Alleviation
With the improved transport accessibility and the implementation of other anti-poverty strategies, Guizhou Province of China has changed from a region with the deepest poverty condition and the largest poverty population in China into a region in which all counties have been lifted out of poverty and extreme poverty has been eradicated. Based on the panel data regression model, the elasticity of transport accessibility on poverty alleviation reached 0.839, indicating that every 1 unit of transport accessibility improvement can lead to 0.839-unit reduction in the poverty index. These findings were consistent with the results of most existing studies, suggesting that the construction of transport infrastructure can significantly reduce poverty incidence, increase residents’ income, and drive economic growth [22]. A reduction in the ASTT means that the impoverished population can obtain access to more public services, engage in more nonfarming employment, and receive more information to promote agriculture production and their lifestyle. ASTT increases also lead to reductions in the economic costs of transport, thereby intensifying the freight, capital, and information interactions among counties and broadening the market range. Thus, transport accessibility improvements were beneficial for narrowing the gap between the core study area and the periphery.
Counties with high transport accessibility were not necessarily counties with low poverty index, mainly including Qinglong, Huangping, Shibing, Zhenyuan, Taijiang, and Majiang in the Qiandongnan Miao and Dong Autonomous Prefecture. This finding was consistent with the argument that better rural transport was a necessary but not sufficient condition for alleviating poverty [55]. This suggests that transport poverty alleviation policies should be combined with industry, talent, land and other policies to effectively promote county-level poverty reduction. In addition, the spatial spillover effect of accessibility on poverty reduction was not considered in this study due to constraints associated with the completeness and availability of data. In the future, the poverty-reduction mechanism of transport needs to be explored from the perspective of the spatial spillover effect.
4.3. Policy Implications
Table 7 has summarized the anti-poverty transport policies mainly implemented in China since 2000. In general, China’s transport-related poverty alleviation policy has been continuously implemented from the national level to the provincial level and county levels. The effectiveness and precision of transport poverty alleviation have been continuously improved, with remarkable poverty alleviation results. The specific manifestations are as follows: the area of focus has changed from remote and impoverished areas to all areas with impoverished populations; the policy contents have been continuously refined and systematized; the policy goal has changed from poverty alleviation to rural revitalization; and the policy implementation strategies have continued to diversify. In the future, it will be necessary to promote the integration of transport with rural industries such as agriculture, e-commerce, tourism, and culture, and multiple transport modes, including high-speed railways and aviation, which are required to promote poverty alleviation and rural revitalization in mountainous areas. In addition, strengthening rural road maintenance and constructing parking facilities, gas stations, logistics facilities, and traffic safety facilities are also important for transport development and poverty alleviation in China.
Table 7.
Main anti-poverty transport policies enacted in China since 2000.
5. Conclusions
In this study, we took one of the typical mountainous provinces in China, i.e., Guizhou Province, as the study area, and applied GIS spatial analysis methods to accurately estimate the transport accessibility and poverty conditions in 88 counties of Guizhou from 2000 to 2018, based on multiple data types, including road network data, nighttime light data, and LandScan population data. Then, we used spatial econometric models to quantitatively analyze the effects of transport accessibility on regional poverty alleviation. The main conclusions are summarized as follows.
First, the transport accessibility in all counties of Guizhou has greatly improved from 2000 to 2018, with the average ASTT decreasing from 4.90 h to 3.30 h. The regional disparity of transport accessibility also decreased, with the dispersion index of transport accessibility decreasing from 0.25 to 0.21. The transport accessibility of counties in Guizhou during the study period represented a “core–peripheral” distribution pattern in an irregular ring with the ASTT values being higher in central Guizhou and lower in the northwestern and northeastern regions.
Second, the poverty condition of Guizhou has decreased greatly since 2000, with the estimated poverty index reducing from 0.75 to 0.29 on average. The poverty index values of counties in Guizhou also represented a “core–edge” distribution pattern, with the districts and counties constituting the core of Guiyang city having low poverty index values and the peripheral areas having high poverty index values. Accordingly, the spatiotemporal pattern of poverty alleviation was similar to that of transport accessibility.
Third, transport accessibility was found to play a significant role in the poverty reduction of Guizhou over the years, with an elasticity of 0.839. With the improved transport accessibility and reduced travel costs, the economic interactions between counties and the economic potential of different counties were enhanced, and the gap between the core and the peripheral areas was gradually reduced, leading to regional balanced development and poverty alleviation.
Fourth, poverty alleviation policies in Guizhou were closely related to the construction of regional transport infrastructure, especially the wide implementation of anti-poverty-oriented transport policy after 2010. Both transport accessibility and poverty index in Guizhou showed a significant “core–periphery” distribution pattern. Accordingly, future poverty alleviation policies should emphasize the transport infrastructure in the peripheral areas of Guizhou in order to narrow the poverty gap among counties. In addition, the shift from eliminating absolute poverty to achieving sustainable poverty alleviation in this region was recommended by the integration of transport infrastructure construction and rural industry revitalization to secure a win–win of economic growth and social equity.
In summary, this study discussed the evolution of transport accessibility brought by the construction of transport infrastructure in Guizhou at the county level and used the spatial panel model to estimate the impact of transport accessibility on regional poverty alleviation. The results of this work provide both practical guidance and references for the implementation of regional-scale transport infrastructure planning and poverty alleviation-oriented transport policies.
Author Contributions
Conceptualization, L.L.; Formal analysis, J.C. and C.H.; Funding acquisition, L.L.; Methodology, J.C. and L.L.; Supervision, L.L.; Visualization, J.C. and Z.D.; Writing—original draft, J.C.; Writing—review & editing, J.C., C.H., Z.D. and L.L. All authors have read and agreed to the published version of the manuscript.
Funding
This work was supported by the National Natural Science Foundation of China (42071227, 42293270).
Institutional Review Board Statement
Not applicable.
Informed Consent Statement
Not applicable.
Data Availability Statement
The data presented in this study are available upon request from the corresponding author.
Conflicts of Interest
The authors declare no conflict of interest.
References
- United Nations. Transforming Our World: The 2030 Agenda for Sustainable 637 Development; Division for Sustainable Development Goals: New York, NY, USA, 2015. [Google Scholar]
- United Nations. Sustainable Development Goals 1: End Poverty in All Its Forms Evertwhere. Available online: https://unstats.un.org/sdgs/report/2019/goal-01/html (accessed on 8 January 2023).
- China’s State Council Information Office. White Paper on China’s Practice in Poverty Reduction. Available online: http://www.gov.cn/zhengce/2021-04/06/content_5597952.htm (accessed on 8 January 2023).
- Li, P.; Lu, Y. A Review and Outlook of Reachability Studies. Prog. Geogr. 2005, 24, 69–78. (In Chinese) [Google Scholar]
- Cheng, C.; Zhang, W.; Chen, J.; Cai, J. Evaluation and analysis of subway accessibility based on space syntax: A case study of Beijing Metro Planning Map in 2008. Earth Inf. Sci. 2007, 9, 31–35. (In Chinese) [Google Scholar]
- Axhausen, K.; Froelic, P.; Tschopp, M. Changes in Swiss accessibility since 1850. Res. Transp. Econ. 2011, 31, 72–80. [Google Scholar]
- Huang, X.; Cao, X.; Li, T. Relationship between regional transportation superiority and economic development in Hainan province. Geogr. Res. 2011, 30, 985–999. (In Chinese) [Google Scholar]
- Jin, F.; Jiao, J.; Qi, Y.; Yang, Y. Evolution and geographic effects of high-speed rail in East Asia: An accessibility approach. J. Geogr. Sci. 2017, 27, 515–532. [Google Scholar] [CrossRef]
- Geurs, K.; Wee, B. Accessibility evaluation of land-use and transport strategies: Review and research directions. J. Transp. Geogr. 2004, 12, 127–140. [Google Scholar]
- Rode, P.; Cruz, N. Governing urban accessibility: Moving beyond transport and mobility. Appl. Mobilities 2018, 3, 8–33. [Google Scholar]
- Hamersma, M.; Heinen, E.; Tillema, T.; Arts, J. Residential moving intentions at highway locations: The trade-off between nuisances and accessibility in the Netherlands. Transp. Res. Part D 2015, 35, 130–141. [Google Scholar] [CrossRef]
- Li, S.; Shum, Y. Impacts of the National Trunk Highway System on accessibility in China. J. Transp. Geogr. 2001, 9, 39–48. [Google Scholar] [CrossRef]
- Bian, F.; Yeh, A. Spatial–economic impact of missing national highway links on China’s regional economy. Transp. Res. Part D 2020, 84, 102377. [Google Scholar] [CrossRef]
- Komikado, H.; Morikawa, S.; Bhatt, A.; Kato, H. High-speed rail, inter-regional accessibility, and regional innovation: Evidence from Japan. Technol. Forecast. Soc. Chang. 2021, 167, 120697. [Google Scholar]
- Wang, L. High-speed rail services development and regional accessibility restructuring in megaregions: A case of the Yangtze River Delta, China. Transp. Policy 2018, 72, 34–44. [Google Scholar] [CrossRef]
- Lessa, D.; Lobo, C.; Cardoso, L. Accessibility and urban mobility by bus in Belo Horizonte/Minas Gerais-Brazil. Journal of Transp. Geogr. 2019, 77, 1–10. [Google Scholar]
- Torzewski, M. Public transport accessibility and the prices of nearby properties: The case of the first metro line in Warsaw. Eur. J. Transp. Infrastruct. Res. 2020, 20, 41–59. [Google Scholar]
- Song, Y.; Lee, K.; Anderson, W.P.; Lakshmanan, T.R. Industrial agglomeration and transport accessibility in metropolitan Seoul. J. Geogr. Syst. 2012, 14, 299–318. [Google Scholar]
- Hong, Z.; Mittal, A.; Mahmassani, H. Effect of Bicycle-sharing on Public Transport Accessibility: Application to Chicago Divvy Bicycle-sharing System. In Proceedings of the TRB 95th Annual Meeting Compendium of Papers 2016, Washington, DC, USA, 10–14 January 2016. [Google Scholar]
- Caggiani, L.; Colovic, A.; Ottomanelli, M. An equality-based model for bike-sharing stations location in bicycle-public transport multimodal mobility. Transp. Res. Part A Policy Pract. 2020, 140, 251–265. [Google Scholar] [CrossRef]
- Nutley, S. Rural areas: The accessibility problem. Mod. Transp. Geogr. 1998, 2, 185–215. [Google Scholar]
- Guo, J. Research on Rural Poverty Reduction Effect of Traffic Infrastructure. Guizhou. Agric. Sci. 2013, 41, 213–217. (In Chinese) [Google Scholar]
- Kang, J.; Guo, M.; Fu, Y. To get rich, build roads?—An empirical study on transportation infrastructure construction, transportation industry development and poverty reduction. Inq. Into Econ. Issues 2014, 9, 41–46. (In Chinese) [Google Scholar]
- Chen, Y.; Wang, X.; Zhang, G. The Threshold effect of transport infrastructure on rural poverty reduction. J. China Univ. Geosci. (Soc. Sci. Ed.) 2021, 05, 110–123. (In Chinese) [Google Scholar]
- Hearn, D.H.; Halbrendt, C.K.; Gempesaw, I.C.M.; Conrado, M.; Webb, S.E.H. An Analysis ofTransport Improvements in China’s Corn Sector: A Hybrid Spatial Equilibrium Approach. J. Transp. Researvh Forum 1990, 31, 154–166. [Google Scholar]
- Aschauer, D.A. Is Public Expenditure Productive? J. Monet. Econ. 1989, 23, 177–200. [Google Scholar]
- Kwon, E. Infrastructure, Growth and Poverty Reduction in Indonesia: A Cross-sectional Analysis. In Transport Infrastructure and Poverty Reduction; Asian Development Bank: Manila, Philippines, 2005. [Google Scholar]
- Zhang, X.L. Regional Comparative Analysis on the Relationship between Transport Infrastructure and Economic Growth in China. J. Financ. Eco Nomics 2008, 33, 51–63. (In Chinese) [Google Scholar]
- Mao, Y.Y.; Li, B. Regional comparison of rural transportation infrastructure investment and farmers’ income: Based on the panal data within 30 provinces in China from 1999 to 2008. J. Hunan Agric. Univ. (Soc. Sci.) 2010, 11, 29–34. (In Chinese) [Google Scholar]
- Munnell, A.H. How does public infrastructure affect regional economic performance? N. Engl. Econ. Rev. 1990, 9, 11–32. [Google Scholar]
- Bougheas, S.; Demetriades, P.O.; Mamuneas, T.P. Infrastructure, specialization, and economic growth. Can. J. Econ. 2000, 33, 506–522. [Google Scholar] [CrossRef]
- Banerjee, A.; Duflo, E.; Qian, N. On the road: Access to Transportation Infrastructure and Economic Growth in China. In NBER Working Paper 2012; National Bureau of Economic Research: New York, NY, USA, 2012; pp. 24–33. [Google Scholar]
- Berndt, E.R.; Hansson, B. Measuring the Contribution of Public Infrastructure Capital in Sweden. Scand. J. Econ. 1992, 94, 151–168. [Google Scholar] [CrossRef]
- Juan, P.B.S.; Daniel, R.O.H. Transport accessibility and social inequities: A tool for identification of mobility needs and evaluation of transport investments. J. Transp. Geogr. 2012, 24, 142–154. [Google Scholar]
- Chatterjee, S.; Turnovsky, S.J. Infrastructure and inequality. Eur. Econ. Rev. 2012, 56, 1730–1745. [Google Scholar]
- Demurger, S. Infrastructure development and economic growth: An explanation for regional disparities in Vhina? J. Comp. Econ. 2001, 29, 95–117. [Google Scholar]
- Zou, W.; Zhang, F.; Zhuang, Z.; Song, H. Transport Infrastructure, Growth, and Poverty Alleviation: Empirical Analysis of China. Ann. Econ. Financ. 2008, 9, 345–371. [Google Scholar]
- Fan, S.G.; Zhang, L.X.; Zhang, X.B. Economic Growth, Regional Disparity and Poverty: A Study of Rural Public Investment in China; China Agriculture Press: Beijing, China, 2002; pp. 118–120. (In Chinese) [Google Scholar]
- Balisacan, A.M.; Pernia, E.M. Probing beneath crossnational averages: Poverty, inequality, and growth in the Philippines. Econ. Res. Depaetment Work. Pap. Ser. 2002, 7, 1–20. [Google Scholar]
- Li, H.L.; Xu, Y. Transport Infrastructure, Industrial Structure and Effect of Reducing Poverty: Based on the Panel VAR Model. Tech. Econ. Manag. Res. 2016, 8, 25–30. [Google Scholar]
- Marinho, E.; Campelo, G.; Franca, J.; Araujo, J. Impact of infrastructure expenses in strategic sectors for Brazilian poverty. EconomiA 2017, 3, 244–259. [Google Scholar]
- Li, W. Evaluation of poverty reduction effect of rural road construction by matching method. Agric. Econ. Probl. 2008, 8, 34–39. (In Chinese) [Google Scholar]
- Xie, S.; Liu, S.; Li, Q. Availability of Infrastructure and Rural Poverty Reduction: Empirical Analysis from Micro data in China. Chin. Rural. Econ. 2018, 05, 112–131. (In Chinese) [Google Scholar]
- China’s Department of Comprehensive Statistics of National Bureau of Statistics. China Compendium of Statistics 1949–2008; China Statistics Press: Beijing, China, 2010.
- China’ s Department of Household Surveys National Bureau of Statistics. Poverty Monitoring Report of Rural China; China Statistics Press: Beijing, China, 2020.
- Zhong, X.; Yan, Q.; Li, G. Long Time Series Nighttime Light Dataset of China (2000–2020). Digit. J. Glob. Change Data Repos. 2022, 6. [Google Scholar] [CrossRef]
- Hansen, W. How Accessibility Shapes Land-use. J. Am. Inst. Plan. 1959, 25, 73–76. [Google Scholar] [CrossRef]
- Wu, Q.; Zhang, H.; Ye, Y.; Su, Y. Spatial and temporal compression effect of Hong Kong-Zhuhai-Macao Bridge based on traffic accessibility. J. Geogr. Sci. 2012, 67, 723–732. (In Chinese) [Google Scholar]
- Wu, Q.; Fan, J.; Zhang, H.; Ye, Y. The spatial impacts model of trans-strait fixed links: A case study of the Pearl River Delta, China. J. Transp. Geogr. 2017, 63, 30–39. [Google Scholar]
- Elvidge, C.D.; Sutton, P.C.; Ghosh, T.; Tuttle, B.T.; Baugh, K.E.; Bhaduri, B.; Bright, E. A Global Poverty Map Derived from Satellite Data. Comput. Geosci. 2009, 35, 1652–1660. [Google Scholar]
- Mundlak, Y. Empirical productions free of management bias. J. Farm Econ. 1961, 43, 44–56. [Google Scholar]
- Balestra, P.; Nerlove, M. Pooling cross-section and time-series data in the estimation of a dynamiceconomic model: The demand for natural gas. Econometrica 1966, 34, 585–612. [Google Scholar]
- Wallace, T.D.; Hussain, A. The Use of Error Components Models in Combining Cross Section with Time Series Data. Econometrica 1969, 37, 55–72. [Google Scholar] [CrossRef]
- Zhang, X.; Shi, L. A comparative study of multilevel model and static panel data model. J. Stat. Inf. 2010, 03, 22–26. (In Chinese) [Google Scholar]
- Sieber, N.; Allen, H. Impacts of rural roads on poverty and equity. Transp. Commun. Bull. Asia Pac. 2016, 86, 23–40. [Google Scholar]


Disclaimer/Publisher’s Note: The statements, opinions and data contained in all publications are solely those of the individual author(s) and contributor(s) and not of MDPI and/or the editor(s). MDPI and/or the editor(s) disclaim responsibility for any injury to people or property resulting from any ideas, methods, instructions or products referred to in the content. |
© 2023 by the authors. Licensee MDPI, Basel, Switzerland. This article is an open access article distributed under the terms and conditions of the Creative Commons Attribution (CC BY) license (https://creativecommons.org/licenses/by/4.0/).