Article

Wet Anaerobic Codigestion of Sewage Sludge and OFMSW in Pilot-Scale Continuously Stirred Tank Reactors: Focus on the Reactor Microbial Communities

1
DESTEC—Department of Energy, Systems Territory and Construction Engineering, University of Pisa, Via C.F. Gabba 22, 56122 Pisa, Italy
2
Department of Biology, University of Pisa, Via Luca Ghini 13, 56122 Pisa, Italy
3
Department of Industrial Engineering, University of Florence, Via di Santa Marta 3, 50139 Firenze, Italy
*
Author to whom correspondence should be addressed.
Sustainability 2023, 15(4), 3168; https://doi.org/10.3390/su15043168
Submission received: 12 January 2023 / Revised: 4 February 2023 / Accepted: 7 February 2023 / Published: 9 February 2023

Abstract

:
Dark fermentation (DF) is a simple method for hydrogen (H2) production through the valorization of various organic wastes that can be used as feedstock. In particular, an organic fraction of municipal solid waste (OFMSW) is a fermentation substrate that can easily be gathered and provides high yields in biogas and value-added organic compounds such as volatile fatty acids (VFAs). DF is coupled with a methanogenic reactor to enhance biogas production from the OFMSW. In this study, a two-stage reactor was conducted and monitored to optimize the methane yield by reducing the HRT at the DF reactor. A focus of the functional inference based on a next-generation sequence (NGS) metabarcoding analysis and comparison of microbial communities that populate each reactor stage was performed. Concerning gas quality, the two-stage system observed a hydrogen-rich biogas in the first fermentative reactor (on average 20.2%) and an improvement in the methane content in the second methanogenic digester, which shifted from 61.2% obtained for the one-stage experiment to 73.5%. Such increases were due to the improvement in substrate hydrolysis. As for the specific biogas production, the results showed an overall increase of 50%.

1. Introduction

The organic fraction of municipal solid waste (OFMSW) is the major contributor by weight to waste production in the European Union (EU), where about 88 billion tons of biowaste are produced yearly, with an estimated yearly increase of 10% [1]. The OFMSW has great potential in the bioeconomy model [2]. In the EU, the OFMSW final destination follows the waste hierarchy: prevention is the priority, followed by material and energy recovery (e.g., composting and anaerobic digestion), and finally disposal in landfills [3]. No particular attention is paid to OFMSW destination in low-income countries [4]. For European legislation, valorization for the OFMSW is pursued, as the European Directive 2018/851 [5] prescribes the mandatory segregation of biowastes from 31 December 2023.
Wastewater sludge is the main residue of municipal wastewater treatment plants (WWTPs) with a production of 9.12 million tons/year in 2018 [6]. The disposal of sludges is increasing due to the application of the Directive concerning urban wastewater treatment [7]. Typical characteristics of sludges from WWTPs are total solid (TS) content lower than 6%, high protein content with a total nitrogen ranging from 1 to 6% of TS content, and a carbon-to-nitrogen (C/N) ratio oscillating between 4 and 9.
Among the routes for the valorization of sewage sludges and OFMSW, biorefinery to high-added-value products [8] and the production of sustainable energy [9,10] are the amenable processes [11]. Within the literature, a biorefinery scheme with a high technological readiness level (TRL) is the dark fermentation (DF) model [12]. DF is the first acidogenic step of anaerobic digestion (AD) where, by applying short hydraulic retention times (HRTs), fermentative bacteria break down organic matter into primarily H2, CO2, and soluble metabolic products [13,14]. DF can be implemented in a two-stage process where, in the second step, methanogenic bacteria convert the spent organic effluent from the first stage into CH4 and CO2 gas [12,15]. The multiple advantages of this technology include a better degradation of the organic matter; an overall increase in the energy output by generating two gases that can be used independently, mixed, or as a substrate in subsequent advanced processes to obtain other byproducts such as bioethanol [12] or even polyhydroxybutyrate (PHB) [11]; and the production of high-added-value products such as volatile fatty acids (VFAs) [16]. The interest in these compounds is continuously increasing since they are used as building blocks in the food, textile, pharmaceutical, leather, and plastic industry or can be further utilized in biological process as readily biodegradable substrate to produce bioplastics (i.e., polyhydroxyalkanoates—PHAs) [17].
Researchers initially directed their efforts towards the optimization of DF in a two-stage process considering the sole OFMSW as feedstock [18] and developing automatic control systems to control VFAs production [19]. However, the codigestion of sewage sludge and the OFMSW enhances biogas production due to the synergistic effects of the digestion of complex substrates [20], and it is more environmentally sustainable than aerobic composting [21]. Researchers focused on funding the mixing ratios of sludge and the OFMSW by maximizing biohydrogen and VFAs production. Batch tests at a lab-scale level showed that 85.17% of the OFMSW and 5 days of HRT optimize H2 production, while the maximum VFAs production was found for 79.8% of the OFMSW and 18.7 days of HRT [22,23]. At the pilot-scale level, a long-term semicontinuous operation shifted the VFA composition from short- to long-chain organic acids [24]. Other studies revealed that activated sludge (AS) is the biocatalyst that maximizes the biodegradability of biodegradable waste [25]. A recent study found that a two-stage process where AS and the OFMSW are codigested increase the biogas production and volatile solids removal by 26% and 9%, respectively [26]. An additional advantage of the two-stage process is working at low HRTs, which reduce the reactor working volume and investment costs. Therefore, it is fundamental to assess the HRTs that maximize process performance. However, few data are available in the literature on this topic. Furthermore, it is fundamental to study the interactions between the operating conditions and microorganisms that participate in byproducts production. A recent study found that biohydrogen and VFA production is mainly promoted by Veillonella and Clostridium [26]. The literature lacks such information when long-term experimental tests are conducted and the HRTs are changed.
The novelty of this study is to compare a single-stage process and a two-stage process in which the HRTs of the DF stage are reduced to optimize biohydrogen and VFA production when using sludge and the OFMSW as feedstock. In particular, two different HRT scenarios on the fermentative reactor of 1.5 and 3 days were studied. In addition, the microbial ecology was analyzed to (i) identify the dominant microorganisms responsible for VFA production and (ii) determine the effects of changing the operating conditions on the microbial composition.

2. Materials and Methods

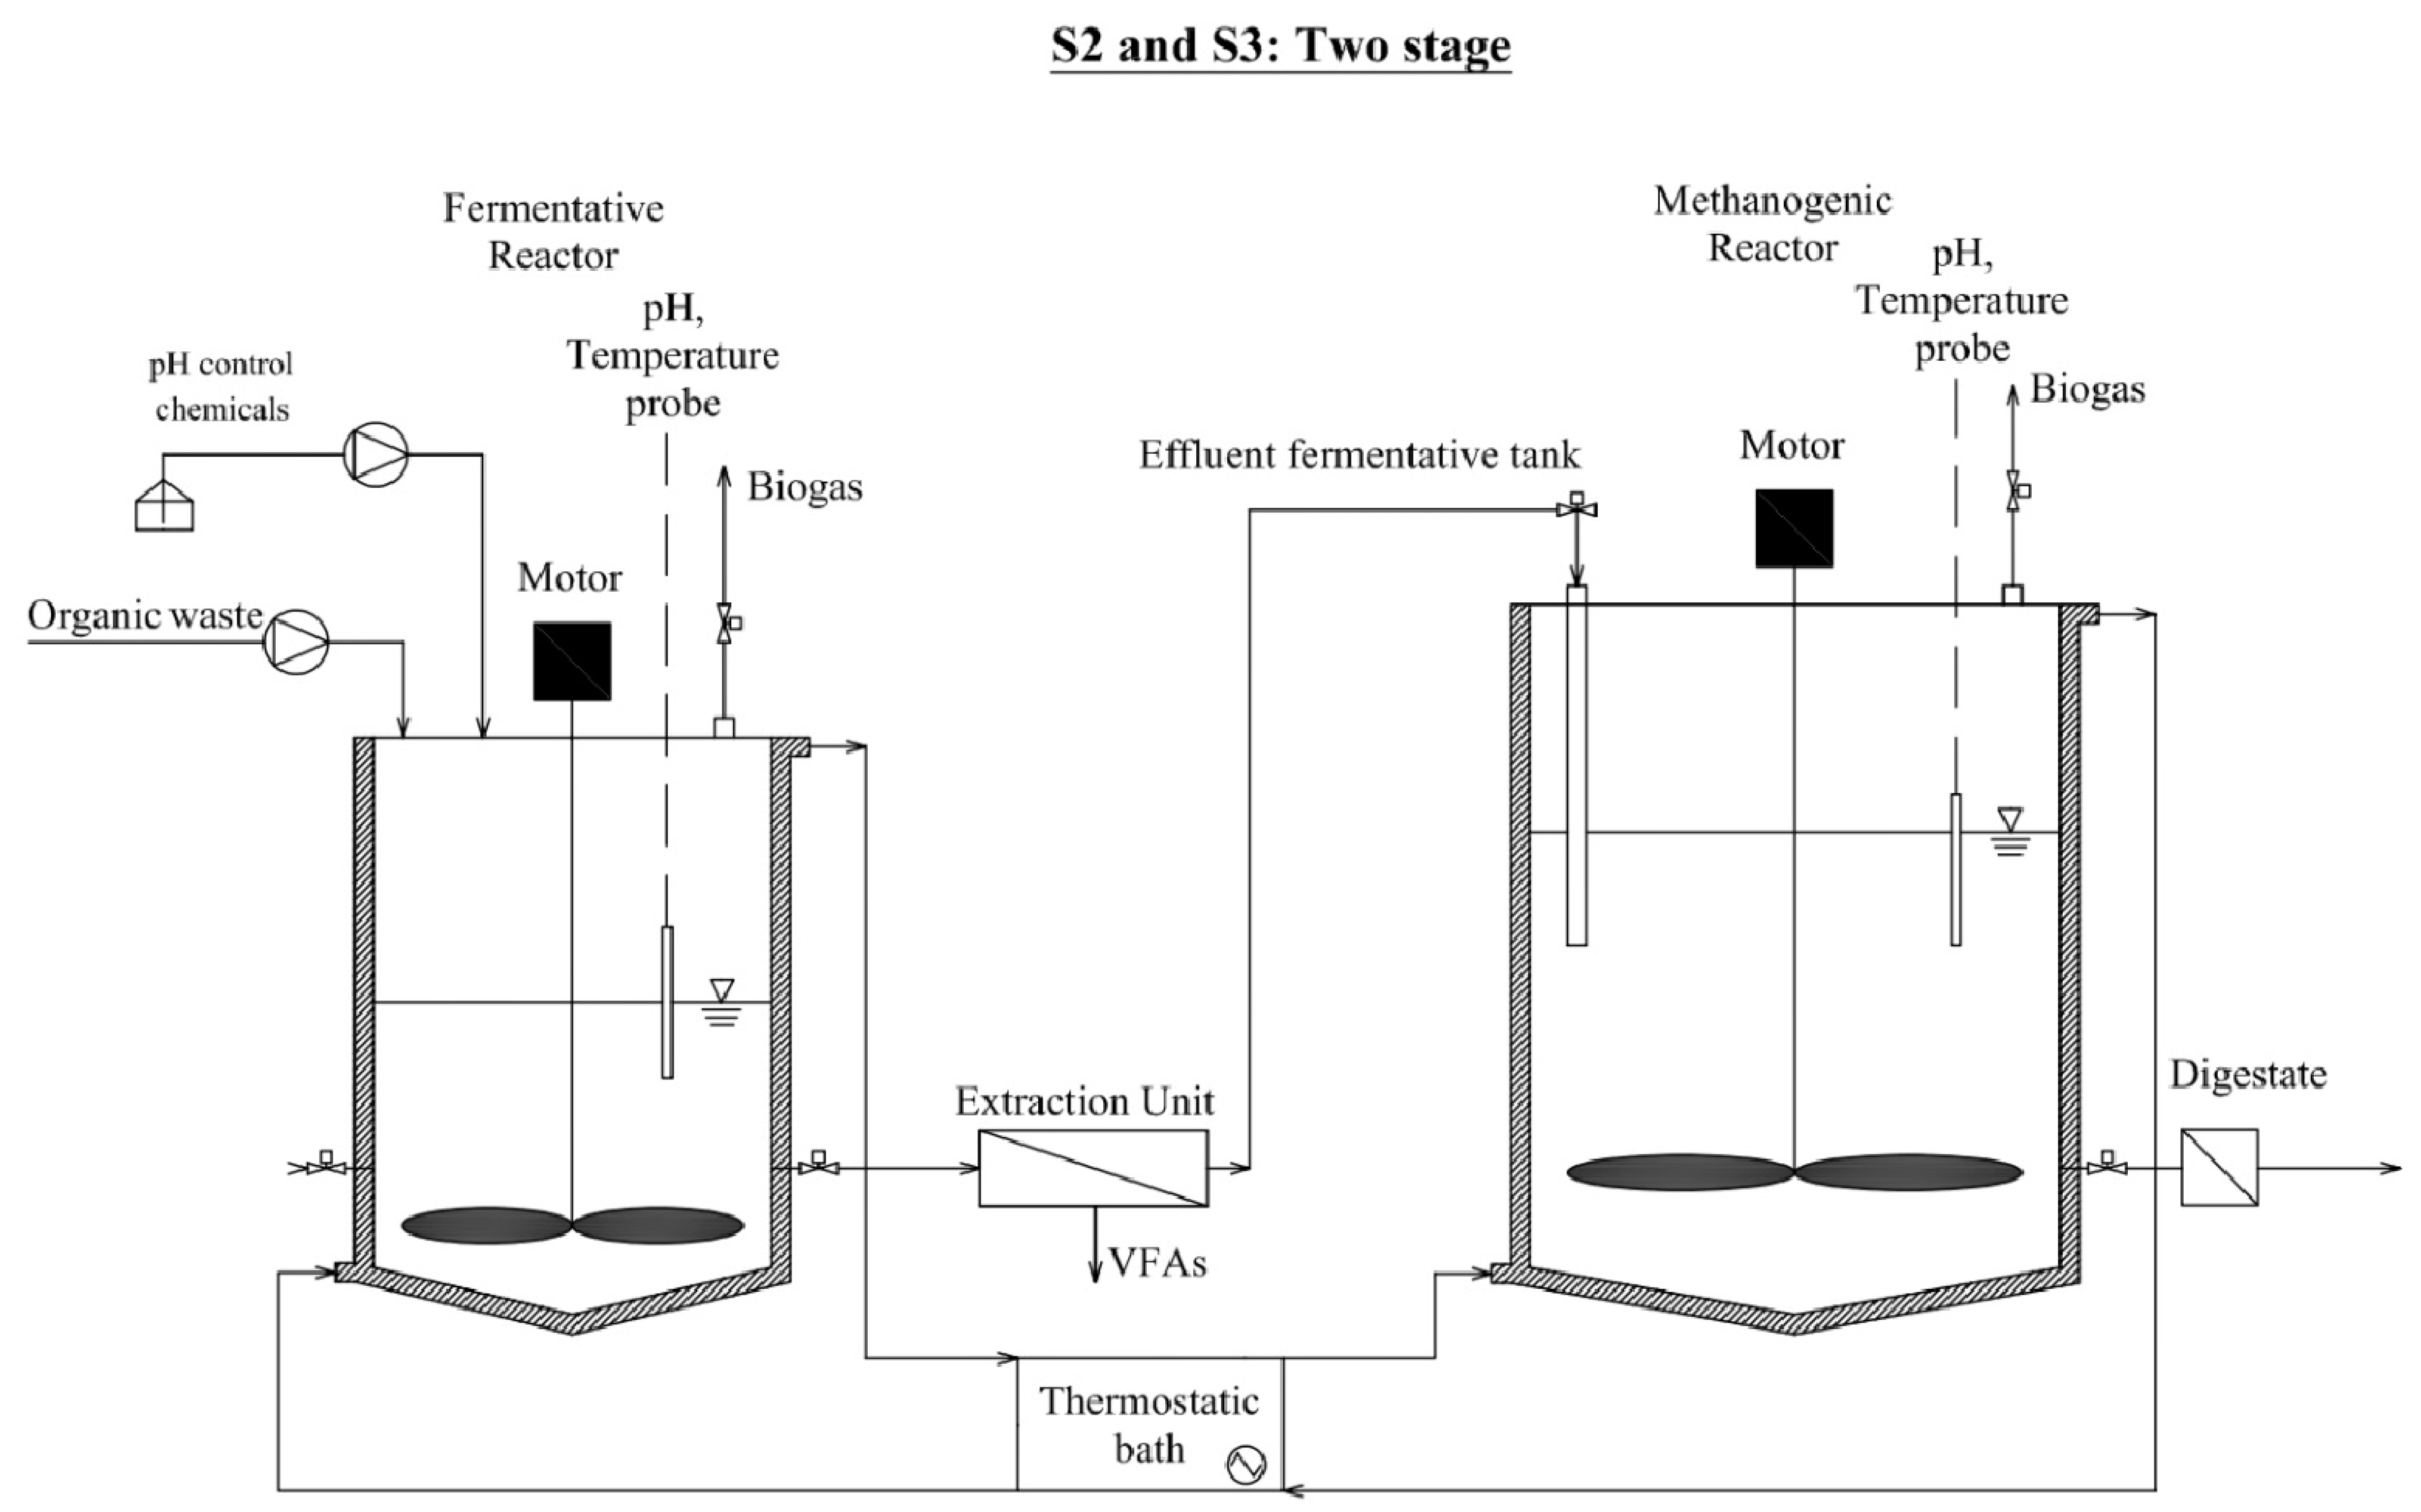
2.1. Reactor Configuration

Figure 1 reports a schematic representation of the two-stage system. Continuously stirred tank reactors (CSTRs) with 3 L of working volume were implemented for the fermentative phase while the methanogenic phase was conducted in a 12 L CSTR. The CSTRs were continuously stirred by blades connected to electric gear motors (COAXMR 615 30Q 1/256, Unitec s.r.l., Calenzano, Italy). Mesophilic conditions (37 ± 0.1 °C) were maintained during the tests with warm water which was heated with a thermostatic bath (FA90, Falc Instruments s.r.l., Treviglio, Italy) and passed through each reactor cladding. pH probes (InPro4260i, Mettler Toledo S.p.A., Milano, Italy) measured the pH in the fermentative and methanogenic reactor. Volumetric counters measured gas production from the reactors, and a 10 L multilayer foil bag (SupelTM, Merck KGaA, Darmstadt, Germany) collected the gas. To convert the gas volume data at normal conditions, a pressure transducer (HD 9908T Baro, Delta Ohm S.r.l., Selvazzano Dentro, Italy) and a T-type thermocouple (PT100, Delta Ohm S.r.l., Selvazzano Dentro, Italy) measured the ambient pressure and temperature, respectively. After filling, the reactors were flushed with nitrogen for a few minutes to ensure anaerobic conditions.
A mixture of food waste (FW) and aerobic sludge (AS) were used as feedstock. The mixture was fed daily to the reactors by means of a syringe. The trials were characterized by a reference scenario and two alternative scenarios (Table 1).
In S1, the methanogenic reactor ran alone to evaluate the performance of the traditional one-stage AD. At the same time, we started the feeding of the fermentative reactor to reach the steady state conditions. In the first alternative scenario (S2), the two CSTRs were coupled to evaluate the two-stage process. An organic loading rate (OLR) of 2.5 kgVS/(m3d) was set at the methanogenic reactor since it is the optimum rate for wet and mesophilic conditions for AD technologies [28]. Similarly to previous studies [29,30], the HRT was set to 17 days for the reference scenario whereas it was set to 12 days for S2 and S3. The HRT of the fermenter (S2) was set to 3.0 d based on previous studies [30,31], and then it was halved to 1.5 d. Each scenario was performed for three HRTs of the methanogenic reactor in order to ensure a significant statistical sample of data [27,32].

2.2. Substrate and Inocula

The FW and AS were used as substrates. The FW was sorted from the OFMSW collected in an Italian municipality by means of a kerbside collection system. The components were mainly pasta, bread, vegetable residues, and citrus peels. The sample was shredded in a food processor (Problend 6, Philips, Amsterdam, The Netherlands), diluted with tap water, and stored in a freezer at −20 °C.
The AS was collected from the aerobic unit of an Italian urban WWTP. The sample was stored in plastic tanks and kept under refrigeration at 4 °C. The AS and FW slurry were removed daily from storage conditions and were mixed in the food processor.
The FW was approximately 20% by weight of the mixture. The final TS content was 5% by weight, suitable for wet digestion technology (Table 2).
The inoculum for the methanogenic reactor came from a wet anaerobic reactor treating the OFMSW and cattle manure at mesophilic conditions whereas the AS was used as inoculum for the fermentative reactor. According to previous studies [33,34], to harvest the hydrogen-producing bacteria and inhibit hydrogenotrophic methanogens, AS was thermal pretreated at 105 °C for 30 min before the experimental tests started. Further details were previously described in [35].

2.3. Analytical Methods

In each scenario and for both of the reactors, digestate was characterized daily in terms of the TS, VS, pH, alkalinity, and VFAs. The TS, TVS, and pH were determined according to standard methods [36]. The alkalinity was measured according to Ripley et al. (1986) [37] by applying a two-end-point titration methodology. The IA/PA ratio was calculated from the measurement of the total alkalinity (TA) and partial alkalinity (PA). The difference between the TA and PA is defined as intermediate alkalinity (IA) and represents the organics acids within the fermentation broth.
Hydrogen, methane, carbon dioxide, nitrogen, oxygen, and hydrogen sulfide contents in biogas were analyzed using a gas chromatograph (3000 Micro GC, INFICON, Bad Ragaz, Switzerland) equipped with a thermal conductivity detector. Carbon dioxide and hydrogen sulfide passed through a PLOTQ column (10 μm/320 μm/8 m) using helium as a gas carrier at a temperature of 55 °C. The other gas passed through a Molsieve column (30 μm/320 μm/10 m) using argon as a gas carrier at a temperature of 50 °C.
VFAs, including acetic, propionic, butyric, isobutyric, valeric, isovaleric, and caproic acids were measured using a gas chromatograph (7890B, Agilent Technology, Santa Clara, CA, USA) with hydrogen as the gas carrier equipped with a CPFFAP column (0.25 mm/0.5 μm/30 m) and with a flame ionization detector (250 °C). The temperature during the analysis started from 60 °C and reached 250 °C with a rate of 20 °C/min. The samples were centrifuged (30 min, 13,500 rpm) and filtrated on a 0.45 μm membrane. A total of 500 μL of filtrate were mixed with isoamyl alcohol (1.00179, Merck KGaA, Darmstadt, Germany) in a volumetric ratio of 1:1, while 200 μL of a phosphate buffer solution (pH 2.1), sodium chloride, and 10 μL of a hexanoic-D11 acid solution (10.000 ppm) were used as an internal standard. The blend was mixed with a Mortexer™ Multi-Head vortexer (Z755613-1 EA, Merck KGaA, Darmstadt, Germany) for 10 min. The liquid suspension of the sample was then inserted in the gas chromatograph by means of an autosampler [27].

2.4. Process Performance

The performances were monitored in terms of stability parameters, biogas productivity, and volatile solids reduction efficiency (REVS).
The measured stability parameters were the pH, IA/PA ratio, total VFAs, and biogas composition as CH4 and CO2 concentrations.
Biogas productivity includes the specific biogas production (SGP) as the daily biogas production divided by the daily mass of biogas vs. that fed to the reactor, the specific methane production (SMP) as the SGP multiplied by the daily average CH4 concentration, and the biogas production rate (GPR) as the daily biogas production divided by the reactor working volume.
ηVS (%) was calculated based on the vs. content of inlet feedstock and withdrawn digestate by applying the following Equation (1):
ηVS = (VSin − VSout)/VSin
where VSin was the volatile solid content of inlet feedstock and VSout was the total volatile solid content of the outlet digestate.

2.5. Microbial Community Analysis

2.5.1. DNA Extraction

To obtain the total DNA form of the reactors at the described scenarios, 500 mg of the sampled sludge were extracted using the FastPrep 24™ homogenizer and the FAST DNA Spin Kit for soil (MP Biomedicals, Irvine, CA, USA) following the manufacturer’s protocol. The extracted DNA quantification was performed with a Qubit 3.0 fluorometer (ThermoFisher Scientific, Waltham, MA, USA). The purity and quality of the extracted DNA were assessed spectrophotometrically (Biotek Powerwave Xs Microplate Spectrophotometer, Agilent Technology, Santa Clara, CA, USA) by measuring absorbance at 260/280 and 260/230 nm. A total of 200 ng of DNA per sample were used to produce multiplexed paired-end libraries with the NEBNext Ultra DNA Library Prep Kit, following the manufacturer’s recommendations: the V4–V5 hypervariable regions of the bacterial 16S rRNA gene were chosen as taxonomic markers by using the 515F forward primer (5′-GTGCCAGCMGCCG CGGTAA-3′) and the 907R reverse primer (5′-CCGTCAATTCCTTTGAGTTT-3′). The libraries for Illumina sequencing were prepared. The prepared library was then sequenced by Novogene (Novogene Company Limited Rm.19C, Lockhart Ctr., 301–307, Lockhart Rd. Wan Chai, Hong Kong, China) using Ilumina NGS technology, generating 250 bp paired-end raw reads.

2.5.2. NGS Data Analysis

A standard pipeline for demultiplexing, trimming, and quality filtering the raw reads was performed via Qiime2 v. 2021.8 Reads assembling and bimera filtering, and the assignment to the Amplicon Sequence Variants (ASV) was performed on the DADA2 plugin (v. 1.20) for R software (V 4.1.1) as reported in the DADA2 SOP (https://benjjneb.github.io/dada2/tutorial.html). The taxonomy assignment of the reference sequences obtained by ASV construction was performed with a classifier trained on the Silva 138 99% database and was previously formatted by RESCRIPt (v. 2021.11.0) in order to contain unique, high-quality sequences of the specific V4-V5 region alone. The tool PICRUSt2 v. 2.4.1 allowed us to perform an inferential analysis of the microbial community: a functional inference was performed via statistical analysis of stratified metagenome contributions, both on EC numbers and whole MetaCyc pathways. The pathway inference was performed considering the single genome contribution (i.e., considering only those microorganisms that cover all the pathway by themselves), with a minimal coverage of 60%. The graphical results and statistical analysis of both the taxonomic and inferential data were obtained and performed with R v. 4.1.1 by using the tydiverse v. 1.3.1 and Phyloseq v. 1.40.0 packages. The graphical outputs were produced by using the R packages ggplot2 v. 3.3.5 and ComplexHeatmap v. 2.9.3.

3. Results

3.1. Anaerobic Digestion Performance

Focusing on the stability of the methanogenic reactors, the pH values were on average 7.02 ± 0.03, 7.35 ± 0.03, and 7.39 ± 0.05 in S1, S2, and S3, respectively. These values are optimal for the AD process and showed a positive trend when the HRT decreased in the fermentative reactor. The fermentative reactors, in S2 and S3, were supplied with NaOH to maintain a pH around 5.5, which is optimal for biohydrogen production.
Figure 2 reports the daily concentration of acetic, propionic, and butyric acid and the trend of the IA/PA ratio in the methanogenic reactors. This parameter was on average 0.16 ± 0.04, 0.16 ± 0.06, and 0.07 ± 0.02 for S1, S2, and S3, respectively, and resulted in the value of 0.3, which indicated a stable AD process [38].
Figure 3 reports the daily concentration of acetic, propionic, and butyric acid in the fermentative reactors. The results showed that the conversion of the organic substrate into VFAs was in the order of butyric > proprionic > acetic acid. This order is typical of the DF of organic wastes [39]. The maximum butyric acid concentration was approximately 5000 mg/L and was reached at the beginning of S2 (not steady state). The butyric acid concentration decreased when the HRT in S3 was halved.
Figure 4 reports the concentration of acetic, propionic, and butyric acid measured in each scenario. On average, the concentration of acetic acid resulted in 166 ± 19, 1.580 ± 451, 220 ± 14, 2.263 ± 113, and 168 ± 39 for S1CH4, S2H2, S2CH4, S2H2, and S3CH4, respectively; the concentration of propionic acid resulted in 67 ± 6, 1.557 ± 464, 87 ± 19, 2.416 ± 121, and 63 ± 28 for S1CH4, S2H2, S2CH4, S2H2, and S3CH4, respectively; the concentration of butyric acid resulted in 0 ± 0, 3.683 ± 312, 35 ± 25, 3.362 ± 168, and 15 ± 6 for S1CH4, S2H2, S2CH4, S2H2, and S3CH4, respectively.
Figure 5 reports the composition of the biogas produced in each scenario. In the methanogenic reactors, the CH4 content was on average 61.2 ± 2.2%, 70.1 ± 1.6%, and 73.1 ± 1.5% for S1, S2, and S3, respectively. CO2 was the main complementary gas in the methanogenic reactor. The CH4 content increased by 14.5% when methanogenic and fermenter reactors were coupled and by 4.3% when the HRT at the fermentative reactor was halved. Analogously, the H2 content passed from 18.4 ± 6.3% to 20.2 ± 4.5% from S2 to S3 (+8.9%).
Figure 6 reports the daily trend of the SGP in the methanogenic and fermentative reactors. The results showed that the methanogenic reactors produced biogas without inhibition issues and that HRT reduction increased the overall yield.
Figure 7 shows the average production of biohydrogen, CH4, and SGP in each scenario. CH4 production increased by 43.7% by coupling the methanogenic reactor to the fermenter (S2), which was further improved (+13.6%) when the HRT of the fermenter was set to 1.5 d. At the same time, H2 production increased by 39.7% from S2 to S3.
Figure 8 shows the daily trend of the volatile solids removal efficiency. The removal efficiency at the methanogenic reactor was 61.0 ± 1.2%, 54.5 ± 4.1%, and 59.8 ± 4.9 for S1, S2, and S3, respectively. The fermenter showed a volatile solid removal efficiency of 32.3 ± 4.4% and 32.4 ± 4.8% for S2 and S3, respectively.
The two-stage semicontinuous trials obtained two important results in terms of anaerobic performance: in analogy with literature studies, they confirmed the improvement in the anaerobic digestion of FW and the suitability of the application of this technology to the codigestion of FW and AS. As for the codigestion trial, the enhancement in biogas production and biogas quality were even higher than the two-stage digestion of the sole FW. As for the specific biogas production, we observed an overall increase of 50%. Concerning gas quality, the two-stage system observed a hydrogen-rich biogas in the first fermentative reactor (on average 20.2%) and an improvement in the methane content in the second methanogenic digester, which shifted from 61.2%, which was obtained for the one-stage experiment, to 73.5%. Such increases were due to the improvement in substrate hydrolysis. Indeed, besides the production of hydrogen, the first fermentative stage acted as a pretreatment degrading the complex organic matter and releasing significant amounts of VFAs that were readily available in the second stage.

3.2. Microbial Community Analysis

3.2.1. Differences between Hydrogen-Producing Reactors

Figure 9 reports the pathway of propionyl-CoA metabolization to succinate, extracted from the map m00640 of KEGG propionate metabolism.
In the hydrogen-producing sector of scenario 3, the major contribution of succinate, CoA ligase (ADP forming) (EC: 6.2.1.5), suggests that succinate, which is furtherly fermented to acetate and lactate to a major extent than at a higher HRT (scenario 2), is responsible for the higher acetate production observed in Figure 4, which reports the concentration of VFAs to the stationary phase in each sector and reactors.
At a lower HRT (scenario 3), a decrease in the contribution of the propanoate production pathway was observed (Figure 10a) that was parallel to the increase in the contribution of the propanoate ligation to CoA (Figure 9), leading to an accumulation of propanoate in this sector (Figure 4).
The inference of the hydrogen processing enzymes (Figure 10b) was similar in the two scenarios, with the exception of Nitrogenase, which was slightly overexpressed at a lower HRT, which evidenced a slightly higher hydrogen production (Table 3).
The methane-producing pathways were poorly expressed at both HRTs tested (Figure 11), showing that in these sectors, all methanogens are inhibited as expected by maintaining the pH at 5.5.
The reported functional analysis was sustained by a taxonomic analysis of the dominant genera. The dominant genera retrieved in these sectors were Prevotella sp., described as a hydrogen producer and a pectinolytic, proteolytic, and hemicellulolytic organism. It has been reported that it is capable of producing hydrogen from VFAs [40]; Prevotella sp. is mainly represented in scenario 3.
The cocontribution of these two genera is described in [41], where they are dominant in a mixed acid fermentation at pH 6.0. At a more acidic pH (range 4.7–5.0), Olsenella, Lactobacillus, and Bifidobacterium sps. are described as dominant [41]. In both the scenarios analyzed here, when the pH was at the intermediate value of 5.5, the same genera were significantly represented. In this context, it is reasonable to assess that these latter species and the Prevotella sp. are responsible for lactic acid production, rapidly fermented to butanoate by Megasphaera sp.
Scenario 3 shows that the relative abundance of Prevotella, Dialister, and Mitsuokella sps. negatively correlated with the HRT. These genera were effectively implied to be involved in the hydrolysis of complex carbohydrates. Some strains of Dialister sp. [42] were shown to be saccharolytic and stimulated by the presence of succinate, which was converted to propionate.
Mitsuokella sp. is described as a fermenter of simple carbohydrates to lactate and succinate [43].

3.2.2. Differences in Methanogenic Rectors

All the inferred VFA-forming pathways (Figure 10a) were more relevant in the methane-producing sectors, with the exception of the ”Acyl fermentation to butanoate II” pathway, which was limited to the hydrogen-producing sectors.
The sole butanoate-forming pathway inferred in the methane-producing sectors was related to the fermentation of proteins (“L-lysine fermentation to acetate and butanoate” specifically).
All the VFA-processing enzymes were preponderant in the methane-producing sectors. This result is in accordance with the stationary and low concentration of VFAs recorded (Figure 4), far below the inhibition limit reported by [44].
The butanoate-degrading enzymes were slightly overrepresented in the methane reactors following the DF (Figure 12), in accordance with a slightly higher concentration of acetate retrieved in the same sections, when compared to scenario 1 (Figure 4).
Propionate and butanoate concentrations were both slightly higher in the methane sectors that followed DF when compared to scenario 1 (Figure 10a). This effect seemed to be due to a carryover from the DF sectors instead of to the diverse metabolic capacities of scenario 1. On the other hand, the methane sector following the D showed an increment in the contribution of the hydrogen-processing enzymes (Figure 10b) such as Nitrogenase, Formate Dehydrogenase (NADP+ dependent), Hydrogen Dehydrogenase (NADP+ dependent), and, to a lower extent, Ferredoxin Hydrogenase.
Figure 10a shows that these hydrogen-processing enzymes were implied in irreversible hydrogen production during nitrogen reduction to ammonia, especially by lactic bacteria [45]. Hydrogen partial pressure regulation was conducted by the mediator compound formate [46] and ferredoxin oxidation/reduction during pyruvate fermentation to acetyl-CoA, lactate, and hydrogen [47]. Actually, a shift in favor of hydrogenoclastic methanogens, consuming the hydrogen formed from lactate and formate, which are both products of pyruvate metabolism, was observed. A carryover of ammonia produced in DF sectors by Megasphaera sp. was the most probable cause of inhibition of acetoclastic methanogens in scenario 2 and 3.
Archaea are enriched in methane-producing sectors after DF; the lower HRT, the higher their contribution (Table 3). Biodiversity in the methane-producing sectors was higher when compared to the hydrogen-producing sectors. In scenario 3, biodiversity was associated with the highest production of methane (Figure 7).
All the retrieved methanogens were mostly present in the scenario 3 methane-producing sector, and we provide a focus on the other microorganisms that were prevalent in this sector (Figure 13 and Figure 14).
Among the most abundant microorganisms, Syntrophomonas sp. has an important role in butyrate oxidation to hydrogen and acetate [48], favoring hydrogenotrophic methanogens.
In a study on the anaerobic digestion of WWTP, the W27 family (Cloacimonadales order), whose relative abundance was more significant in the scenario 3 methane-producing sector, together with Syntrophomonas sp. were stimulated in the presence of long-chain fatty acids, specifically oleic acid [49], suggesting that a lower HRT limits the transformation of this substrate into shorter chain compounds. The genes involved in the syntrophic propionate oxidation process were identified in members of the order Cloacimonadales [50], who performed the same function as Synthrophomonas sp. with propionate as the substrate.
A particular mention goes to Pelotomaculum sp. (Figure 1), one of the five principal genera of syntrophic propionate-oxidizing bacteria described in the literature [51].
Together with syntrophic bacteria, other hydrolytic fermenters are stimulated by a lower HTR:
Members of the Dysgonomonadaceae family are alkalitolerant hydrolytic fermenters, who are able to degrade recalcitrant polysaccharides to liberate oligosaccharides and are capable of fermenting them to VFAs [24].
The Sphaerochaeta sp. contains multiple genes related to carbohydrate fermentation, mostly obtained by horizontal transfer from clostridia [52].
The genus Acetovibrio sp. is an efficient cellulolytic and acidogenic microorganism implied in the hydrolysis of lignocellulosic material [53].

3.2.3. Process Stability and Overall Yield

In Table 4, the performance of a two-stage reactor in the tested scenarios is compared to the AD standard process (scenario 1).
The overall yield of the two-stage DF-AD reactor, in terms of methane production, led to a +52.4% v/v in comparison to the single AD stage. Decreasing the HRT in the DF stage from 3 (scenario 2) to 1.5 days (scenario 3) increased the methane yield by another 6.6%
Two-stage fermentation only produced hydrogen in the DF sector, and a lower HRT increased H2 furtherly by 1.8%.
The overall conversion of the total volatile solids in the biogas was also enhanced in the two-stage process by 16.8% and rose up to 20.1% when the DF HRT was halved.

4. Discussion

Microbial Analysis

Dark fermentation produces hydrogen at a relatively low yield with the accumulation of metabolites such as VFAs. Typical H2 yields range from 1 to 2 mol of H2/mol of glucose [54]. The DF process is still attractive because it requires a simple reactor design and ease in the selection of competent microbial communities from anaerobic sludges produced during methanogenic fermentation processes. Cow manure, municipal solid waste, compost, and even soil can be used as sources of mixed cultures if correctly pretreated (e.g., by thermal shock during the startup [55], acidic pH maintenance [56], or use of methanogen inhibitors [57]). The hard part to master is the optimization of the H2 yield, requiring a fine regulation of the complex microbial community toward the desired end product. VFAs, anyway, consist of a significative end product of the dark fermentation process.
Short-chain VFAs are value-added products: their cost value is proportional to the carbon chain length, e.g., butyric acid (2163 $/ton), propionic acid (2000 $/ton), and acetic acid (600 $/ton) [58], and they can be involved in interesting raw material biorefinery processes [44]. Ordinarily, the production of VFAs requires pure cultures [59] and simple substrates such as pentose or hexose sugars to be fermented [60]. The massive anaerobic production of VFAs in nonsterile conditions and in the presence of complex substrates such as an OFMSW is still at an upscaling phase [61].
Anyway, acidogenic processes can be exploited to enhance biogas production and increase the yield of the process. One possible process to produce additional H2 is consistent with light fermentation, a photofermentative process that involves specific phototrophic bacteria such as Rhodobacter sp. [62] or cyanobacteria [63]. These processes are associated with materials for construction that allow light to pass through, such as glass, and are associated consequently with limited dimensions of the reactors [64], a strict control of temperature, and in some cases, complex managing procedures, such as continuous growth medium exchange in anaerobic conditions [65].
Another feasible path is the use of microbial electrolytic cells (MEC) [66]; there are, however some practical limits to the scale up of this new technology, such as high manufacturing costs of the cells, high internal resistance, and issues due to biofouling [67], that are yet to be overcome.
Methane production in dedicated sectors can effectively and easily integrate acidogenic processes to a final methanogenic fermentation of VFA byproducts of dark fermentation [68]. However, high total concentrations of VFAs inhibit methanogenesis [69], and thus the intervention of microbial consortia must be able to transform the excess VFAs in suitable substrates for methanogens. The anaerobic oxidation of propionate and butyrate to acetate and/or hydrogen might occur anaerobically, but it is a high endergonic process (ΔG° Propionate = +76.1 and ΔG° Butyrate = +48.1 kJ/mol at 25 °C). On the other hand, these reactions might be performed by the syntrophic cooperation of propionate and butyrate-oxidizing bacteria and H2/formate-scavenging partners [70].
Propanoate oxidation, moreover, has the lowest energetic yield [71], and thus is likely to accumulate the most VFAs. Propanoate, thus, has a critical role in destabilizing anaerobic fermentation processes that are carried over by acetogenic methanogens; it has a reported limit concentration that is able to cease methane production in 3000 ppm [72].
Nevertheless, only acetoclastic Archaea are inhibited by a high total VFA content and low pH [73] and high ammonia content [74]. In these cases, however, a shift in methanogens can occur, leading to hydrogenoclastic methanogens overcoming acetoclastic bacteria and a cooperation with syntrophic propionate-oxidizing bacteria (SPOB) [75] and Butyrate-oxidizing syntrophs [76].
In the scenarios studied here and the sectors of the two-stage configuration, a shift in methanogens was observed, accompanied by an increment in the abundance of Megasphaera sp., which were putatively responsible for the increase in ammonia production. An increment in the contribution of Nitrogenase activity was also observed, which was responsible for the hydrogen production.
The observed higher contribution of other enzymes that could produce or consume hydrogen reversibly in methane-producing sectors suggests that a fine regulation of hydrogen partial pressure is adopted by the microbial community [77], which is crucial for the syntrophic oxidation of VFAs [70], and an inhibitor of methanogenic processes [78]. Megasphaera sp. itself is likely to be the most significant contributor to butanoate production, in accordance with the higher presence of the “acetyl CoA fermentation to butanoate II” pathway in the DF sector.
The two-stage reactor configuration strongly impacts the syntrophic community in methanogenic reactors: while Syntrophomonas sp. becomes dominant in scenario 2 and 3, the most preponderant genus retrieved in scenario 1 is DMER 64, a syntroph that exploits direct electron transfer (DIET) mediated by magnetite, especially in ammonia-stressed conditions [79], instead of producing hydrogen.
The decrease in the HRT in the DF sector led to a significantly higher production of biogases and a higher percentage of methane content in comparison to a single-stage AF in scenario 1, which correlated with an enrichment in the Archaeal community, together with the stimulation of Syntrophomonas sp. and other efficient hydrolytic fermenters of cellulose and long-chain fatty acids.
The selection of more efficient hydrolytic bacteria is also reflected in the enhancement in the removal efficiency of the total volatile solids.
A lower HRT in the DF sector had the highest impact on Prevotella sp. This genus is related to formate production in the DF process [80].
Formate works as a hydrogen transporter [46] when inside cells, as it is reverted to hydrogen and CO2 in the methane-producing sector and exploited by hydrogenotrophic methanogens to produce methane [81].
Formate as an interspecies shuttle of hydrogen can enhance methane production via hydrogenotrophs [82] while inhibiting acetoclastic methanogens as well [83].

5. Conclusions

This study developed a two-stage DF-AD pilot-scale process of the codigestion of the OFWMS and aerobic sludge by considering a simple reactor design, start-up method, and operating conditions, with the aim to valorize widely produced waste as source of energy to maintain simplicity for the scale-up step.
The long-term stability of the process, biogas yield, and removal of volatile solids were evaluated in comparison with a single-stage AD reactor. A key and practically tunable parameter for process management, the HRT in the DF stage, was found to improve the biogas yield by modifying the HRT in the DF stage, and it was successfully individuated and exploited to increase the biogas yield and TVS removal efficiency. Furthermore, the codigestion configuration showed improved process stability compared to FW digestion, as we observed a lower consumption of alkaline solution for the pH control due to the intrinsic buffer capacity of the AS. Other additional advantages of the two-stage process were associated with the overall reduction in the HRT (shifting from 17 d of the one-stage process to 1.5 d + 12 d of the two-stage system) and the higher removal of volatile solids (+14%). As such, the reduction in the HRT implies a reduction in the digester volume and investment costs while the increase in volatile solids removal was associated with a higher degree of digestate stabilization, which is a relevant issue when considering its final disposal.
Future work could be directed at studying the energy performance of processes on the preindustrial scale so as to make an energy balance that can legitimize the scale up of dark fermentation processes.
This study used the metabarcoding technique NGS and functional inference to shed light on microbial community rearrangement and metabolic shifts during the combined DF-AD fermentation processes. New probes (ammonium and formate) and microbiological markers (Prevotella, Megasphaera, Sintrophomonas sps.) were identified to have more control on DF-AD bioreactor performance.

Author Contributions

Conceptualization, I.P.; Methodology, I.P., E.R., S.B. and F.B.; Software, I.P., E.R. and S.B.; Validation, I.P. and S.B.; Formal analysis, I.P. and S.B.; Investigation, I.P. and F.B.; Resources, I.P. and F.B.; Data curation, I.P., E.R., S.B. and F.B.; Writing—original draft, E.R. and S.B.; Writing—review & editing, I.P., S.D.G. and R.I.; Visualization, I.P.; Supervision, I.P., S.D.G. and R.I.; Project administration, I.P.; Funding acquisition, I.P. All authors have read and agreed to the published version of the manuscript.

Funding

This research received no external funding.

Conflicts of Interest

The authors declare no conflict of interest.

References

  1. Communication from the Commission to the Council and the European Parliament on Future Steps in Bio-Waste Management in the European Union SEC (2010); OPOCE: Bruxelles, Belgium, 2010.
  2. López-Gómez, J.P.; Alexandri, M.; Schneider, R.; Latorre-Sánchez, M.; Coll Lozano, C.; Venus, J. Organic Fraction of Municipal Solid Waste for the Production of L-Lactic Acid with High Optical Purity. J. Clean. Prod. 2020, 247, 119165. [Google Scholar] [CrossRef]
  3. Directive 2008/98/EC of the European Parliament and of the Council of 19 November 2008 on Waste and Repealing Certain Directives; European Parliament: Strasbourg, France, 2008; pp. 3–30.
  4. Tyagi, V.K.; Fdez-Güelfo, L.A.; Zhou, Y.; Álvarez-Gallego, C.J.; Garcia, L.I.R.; Ng, W.J. Anaerobic Co-Digestion of Organic Fraction of Municipal Solid Waste (OFMSW): Progress and Challenges. Renew. Sustain. Energy Rev. 2018, 93, 380–399. [Google Scholar]
  5. Directive (EU) 2018/851 of the European Parliament and of the Council of 30 May 2018 Amending Directive 2008/98/EC on Waste; European Parliament: Strasbourg, France, 2018; pp. 109–1400.
  6. Eurostat Generation of Waste by Waste Category, Hazardousness and NACE Rev. 2 Activity. Available online: https://ec.europa.eu/eurostat/databrowser/view/ENV_WASGEN__custom_3110365/default/table?lang=en (accessed on 25 July 2022).
  7. Council Directive 91/271/EEC of 21 May 1991 Concerning Urban Waste-Water Treatment; European Parliament: Strasbourg, France, 1991; Volume 135.
  8. Vea, E.B.; Romeo, D.; Thomsen, M. Biowaste Valorisation in a Future Circular Bioeconomy. Procedia CIRP 2018, 69, 591–596. [Google Scholar] [CrossRef]
  9. Di Matteo, U.; Nastasi, B.; Albo, A.; Astiaso Garcia, D. Energy Contribution of OFMSW (Organic Fraction of Municipal Solid Waste) to Energy-Environmental Sustainability in Urban Areas at Small Scale. Energies 2017, 10, 229. [Google Scholar] [CrossRef]
  10. Baccioli, A.; Ferrari, L.; Pecorini, I.; Marchionni, A.; Susini, C.; Desideri, U. Feasibility Analysis of a Biogas-Fuelled Trigeneration Plant Operating with a MGT. In Proceedings of the 31st International Conference on Efficiency, Cost, Optimization, Simulation and Environmental Impact of Energy Systems, Guimarães, Portugal, 17–22 June 2018. [Google Scholar]
  11. Battista, F.; Frison, N.; Pavan, P.; Cavinato, C.; Gottardo, M.; Fatone, F.; Eusebi, A.L.; Majone, M.; Zeppilli, M.; Valentino, F.; et al. Food Wastes and Sewage Sludge as Feedstock for an Urban Biorefinery Producing Biofuels and Added-Value Bioproducts. J. Chem. Technol. Biotechnol. 2020, 95, 328–338. [Google Scholar] [CrossRef]
  12. Alibardi, L.; Astrup, T.F.; Asunis, F.; Clarke, W.P.; De Gioannis, G.; Dessì, P.; Lens, P.N.L.; Lavagnolo, M.C.; Lombardi, L.; Muntoni, A.; et al. Organic Waste Biorefineries: Looking towards Implementation. Waste Manag. 2020, 114, 274–286. [Google Scholar] [CrossRef]
  13. Bastidas-Oyanedel, J.-R.; Bonk, F.; Schmidt, J.; Thomsen, M. Dark Fermentation Biorefinery in the Present and Future (Bio)Chemical Industry. Rev. Environ. Sci. Bio/Technol. 2015, 14, 473–498. [Google Scholar] [CrossRef]
  14. Ghimire, A.; Frunzo, L.; Pirozzi, F.; Trably, E.; Escudie, R.; Lens, P.N.L.; Esposito, G. A Review on Dark Fermentative Biohydrogen Production from Organic Biomass: Process Parameters and Use of by-Products. Appl. Energy 2015, 144, 73–95. [Google Scholar] [CrossRef]
  15. Ariunbaatar, J.; Panico, A.; Esposito, G.; Pirozzi, F.; Lens, P.N.L. Pretreatment Methods to Enhance Anaerobic Digestion of Organic Solid Waste. Appl. Energy 2014, 123, 143–156. [Google Scholar] [CrossRef]
  16. Rossi, E.; Pecorini, I.; Panico, A.; Iannelli, R. Impact of Reactor Configuration and Relative Operating Conditions on Volatile Fatty Acids Production from Organic Waste. Environ. Technol. Rev. 2022, 11, 156–186. [Google Scholar] [CrossRef]
  17. Valentino, F.; Morgan-Sagastume, F.; Campanari, S.; Villano, M.; Werker, A.; Majone, M. Carbon Recovery from Wastewater through Bioconversion into Biodegradable Polymers. New Biotechnol. 2017, 37, 9–23. [Google Scholar] [CrossRef] [Green Version]
  18. Micolucci, F.; Gottardo, M.; Pavan, P.; Cavinato, C.; Bolzonella, D. Pilot Scale Comparison of Single and Double-Stage Thermophilic Anaerobic Digestion of Food Waste. J. Clean. Prod. 2018, 171, 1376–1385. [Google Scholar] [CrossRef]
  19. Micolucci, F.; Gottardo, M.; Bolzonella, D.; Pavan, P.; Majone, M.; Valentino, F. Pilot-Scale Multi-Purposes Approach for Volatile Fatty Acid Production, Hydrogen and Methane from an Automatic Controlled Anaerobic Process. J. Clean. Prod. 2020, 277, 124297. [Google Scholar] [CrossRef]
  20. Xie, S.; Wickham, R.; Nghiem, L.D. Synergistic Effect from Anaerobic Co-Digestion of Sewage Sludge and Organic Wastes. Int. Biodeterior. Biodegrad. 2017, 116, 191–197. [Google Scholar] [CrossRef]
  21. Francini, G.; Lombardi, L.; Freire, F.; Pecorini, I.; Marques, P. Environmental and Cost Life Cycle Analysis of Different Recovery Processes of Organic Fraction of Municipal Solid Waste and Sewage Sludge. Waste Biomass. Valor. 2019, 10, 3613–3634. [Google Scholar] [CrossRef]
  22. Li, Z.; Chen, Z.; Ye, H.; Wang, Y.; Luo, W.; Chang, J.-S.; Li, Q.; He, N. Anaerobic Co-Digestion of Sewage Sludge and Food Waste for Hydrogen and VFA Production with Microbial Community Analysis. Waste Manag. 2018, 78, 789–799. [Google Scholar] [CrossRef]
  23. Pecorini, I.; Olivieri, T.; Bacchi, D.; Paradisi, A.; Corti, A.; Carnevale, E. Evaluation of Gas Production in a Industrial Anaerobic Digester by Means of Biochemical Methane Potential of Organic Municipal Solid Waste Components. In Proceedings of the 25th International Conference on Efficiency, Cost, Optimization and Simulation of Energy Conversion Systems and Processes, Perugia, Italy, 26–29 June 2012; pp. 173–184. [Google Scholar]
  24. Owusu-Agyeman, I.; Plaza, E.; Cetecioglu, Z. Long-Term Alkaline Volatile Fatty Acids Production from Waste Streams: Impact of PH and Dominance of Dysgonomonadaceae. Bioresour. Technol. 2022, 346, 126621. [Google Scholar] [CrossRef]
  25. Pecorini, I.; Baldi, F.; Iannelli, R. Biochemical Hydrogen Potential Tests Using Different Inocula. Sustainability 2019, 11, 622. [Google Scholar] [CrossRef]
  26. Nabaterega, R.; Kumar, V.; Khoei, S.; Eskicioglu, C. A Review on Two-Stage Anaerobic Digestion Options for Optimizing Municipal Wastewater Sludge Treatment Process. J. Environ. Chem. Eng. 2021, 9, 105502. [Google Scholar] [CrossRef]
  27. Baldi, F.; Pecorini, I.; Iannelli, R. Comparison of Single-Stage and Two-Stage Anaerobic Co-Digestion of Food Waste and Activated Sludge for Hydrogen and Methane Production. Renew. Energy 2019, 143, 1755–1765. [Google Scholar] [CrossRef]
  28. APAT APAT, Digestione Anaerobica Della Frazione Organica Dei Rifiuti Solidi e Aspetti Fondamentali, Progettuali, Gestionali, Di Impatto Ambientale Ed Integrazione Con La Depurazione Delle Acque Reflue 2005. Available online: https://www.isprambiente.gov.it/contentfiles/00003400/3482-manuali-linee-guida-2005.pdf (accessed on 11 January 2023).
  29. Cavinato, C.; Giuliano, A.; Bolzonella, D.; Pavan, P.; Cecchi, F. Bio-Hythane Production from Food Waste by Dark Fermentation Coupled with Anaerobic Digestion Process: A Long-Term Pilot Scale Experience. Int. J. Hydrogen Energy 2012, 37, 11549–11555. [Google Scholar] [CrossRef]
  30. Micolucci, F.; Gottardo, M.; Bolzonella, D.; Pavan, P. Automatic Process Control for Stable Bio-Hythane Production in Two-Phase Thermophilic Anaerobic Digestion of Food Waste. Int. J. Hydrogen Energy 2014, 39, 17563–17572. [Google Scholar] [CrossRef]
  31. Chinellato, G.; Cavinato, C.; Bolzonella, D.; Heaven, S.; Banks, C.J. Biohydrogen Production from Food Waste in Batch and Semi-Continuous Conditions: Evaluation of a Two-Phase Approach with Digestate Recirculation for PH Control. Int. J. Hydrogen Energy 2013, 38, 4351–4360. [Google Scholar] [CrossRef]
  32. Rossi, E.; Becarelli, S.; Pecorini, I.; Di Gregorio, S.; Iannelli, R. Anaerobic Digestion of the Organic Fraction of Municipal Solid Waste in Plug-Flow Reactors: Focus on Bacterial Community Metabolic Pathways. Water 2022, 14, 195. [Google Scholar] [CrossRef]
  33. Alibardi, L.; Cossu, R. Effects of Carbohydrate, Protein and Lipid Content of Organic Waste on Hydrogen Production and Fermentation Products. Waste Manag. 2016, 47, 69–77. [Google Scholar] [CrossRef]
  34. Cappai, G.; De Gioannis, G.; Friargiu, M.; Massi, E.; Muntoni, A.; Polettini, A.; Pomi, R.; Spiga, D. An Experimental Study on Fermentative H2 Production from Food Waste as Affected by PH. Waste Manag. 2014, 34, 1510–1519. [Google Scholar] [CrossRef]
  35. Baldi, F.; Iannelli, R.; Pecorini, I.; Polettini, A.; Pomi, R.; Rossi, A. Influence of the PH Control Strategy and Reactor Volume on Batch Fermentative Hydrogen Production from the Organic Fraction of Municipal Solid Waste. Waste Manag. Res. 2019, 37, 478–485. [Google Scholar] [CrossRef]
  36. Standard Methods. Available online: https://www.standardmethods.org/ (accessed on 14 April 2020).
  37. Ripley, L.E.; Boyle, W.C.; Converse, J.C. Improved Alkalimetric Monitoring for Anaerobic Digestion of High-Strength Wastes. J. Water Pollut. Control Fed. 1986, 58, 406–411. [Google Scholar]
  38. Drosg, B. Process Monitoring in Biogas Plants; IEA Bioenergy: Paris, France, 2013. [Google Scholar]
  39. De Gioannis, G.; Muntoni, A.; Polettini, A.; Pomi, R. A Review of Dark Fermentative Hydrogen Production from Biodegradable Municipal Waste Fractions. Waste Manag. 2013, 33, 1345–1361. [Google Scholar] [CrossRef]
  40. Emerson, E.L.; Weimer, P.J. Fermentation of Model Hemicelluloses by Prevotella Strains and Butyrivibrio Fibrisolvens in Pure Culture and in Ruminal Enrichment Cultures. Appl. Microbiol. Biotechnol. 2017, 101, 4269–4278. [Google Scholar] [CrossRef]
  41. Feng, K.; Li, H.; Zheng, C. Shifting Product Spectrum by PH Adjustment during Long-Term Continuous Anaerobic Fermentation of Food Waste. Bioresour. Technol. 2018, 270, 180–188. [Google Scholar] [CrossRef]
  42. Sakamoto, M.; Ikeyama, N.; Toyoda, A.; Murakami, T.; Mori, H.; Iino, T.; Ohkuma, M. Dialister hominis sp. Nov., Isolated from Human Faeces. Int. J. Syst. Evol. Microbiol. 2020, 70, 589–595. [Google Scholar] [CrossRef]
  43. Bergey’s Manual of Systematics of Archaea and Bacteria (BMSAB); Wiley: Hoboken, NJ, USA, 2015; ISBN 978-1-118-96060-8.
  44. Sekoai, P.T.; Ghimire, A.; Ezeokoli, O.T.; Rao, S.; Ngan, W.Y.; Habimana, O.; Yao, Y.; Yang, P.; Yiu Fung, A.H.; Yoro, K.O.; et al. Valorization of Volatile Fatty Acids from the Dark Fermentation Waste Streams-A Promising Pathway for a Biorefinery Concept. Renew. Sustain. Energy Rev. 2021, 143, 110971. [Google Scholar] [CrossRef]
  45. Higdon, S.M.; Huang, B.C.; Bennett, A.B.; Weimer, B.C. Identification of Nitrogen Fixation Genes in Lactococcus Isolated from Maize Using Population Genomics and Machine Learning. Microorganisms 2020, 8, 2043. [Google Scholar] [CrossRef]
  46. Pinske, C.; Sawers, R.G. Anaerobic Formate and Hydrogen Metabolism. EcoSal. Plus 2016, 7, 246. [Google Scholar] [CrossRef]
  47. Sikora, A.; Detman, A.; Mielecki, D.; Chojnacka, A.; Błaszczyk, M. Searching for Metabolic Pathways of Anaerobic Digestion: A Useful List of the Key Enzymes; IntechOpen: London, UK, 2018; ISBN 978-1-83881-850-0. [Google Scholar]
  48. McInerney, M.J.; Bryant, M.P.; Hespell, R.B.; Costerton, J.W. Syntrophomonas Wolfei Gen. Nov. Sp. Nov., an Anaerobic, Syntrophic, Fatty Acid-Oxidizing Bacterium. Appl. Environ. Microbiol. 1981, 41, 1029–1039. [Google Scholar]
  49. Shakeri Yekta, S.; Liu, T.; Axelsson Bjerg, M.; Šafarič, L.; Karlsson, A.; Björn, A.; Schnürer, A. Sulfide Level in Municipal Sludge Digesters Affects Microbial Community Response to Long-Chain Fatty Acid Loads. Biotechnol. Biofuels 2019, 12, 259. [Google Scholar] [CrossRef]
  50. Pelletier, E.; Kreimeyer, A.; Bocs, S.; Rouy, Z.; Gyapay, G.; Chouari, R.; Rivière, D.; Ganesan, A.; Daegelen, P.; Sghir, A.; et al. “Candidatus Cloacamonas Acidaminovorans”: Genome Sequence Reconstruction Provides a First Glimpse of a New Bacterial Division. J. Bacteriol. 2008, 190, 2572–2579. [Google Scholar] [CrossRef]
  51. Westerholm, M.; Calusinska, M.; Dolfing, J. Syntrophic Propionate-Oxidizing Bacteria in Methanogenic Systems. FEMS Microbiol. Rev. 2021, 46, fuab057. [Google Scholar] [CrossRef]
  52. Caro-Quintero, A.; Ritalahti, K.M.; Cusick, K.D.; Löffler, F.E.; Konstantinidis, K.T. The Chimeric Genome of Sphaerochaeta: Nonspiral Spirochetes That Break with the Prevalent Dogma in Spirochete Biology. mBio 2012, 3, e00025-12. [Google Scholar] [CrossRef]
  53. Dassa, B.; Borovok, I.; Lamed, R.; Henrissat, B.; Coutinho, P.; Hemme, C.L.; Huang, Y.; Zhou, J.; Bayer, E.A. Genome-Wide Analysis of Acetivibrio Cellulolyticus Provides a Blueprint of an Elaborate Cellulosome System. BMC Genom. 2012, 13, 210. [Google Scholar] [CrossRef]
  54. Kanai, T.; Imanaka, H.; Nakajima, A.; Uwamori, K.; Omori, Y.; Fukui, T.; Atomi, H.; Imanaka, T. Continuous Hydrogen Production by the Hyperthermophilic Archaeon, Thermococcus Kodakaraensis KOD1. J. Biotechnol. 2005, 116, 271–282. [Google Scholar] [CrossRef]
  55. Taherdanak, M.; Jafari, O.; Vaez, E.; Zilouei, H. The Effects of Heat-Shock Pretreatment Conditions on Dark Hydrogen Fermentation from Glucose. Int. J. Ambient Energy 2017, 38, 627–630. [Google Scholar] [CrossRef]
  56. Ziara, R.M.M.; Miller, D.N.; Subbiah, J.; Dvorak, B.I. Lactate Wastewater Dark Fermentation: The Effect of Temperature and Initial PH on Biohydrogen Production and Microbial Community. Int. J. Hydrogen Energy 2019, 44, 661–673. [Google Scholar] [CrossRef]
  57. Liu, H.; Wang, J.; Wang, A.; Chen, J. Chemical Inhibitors of Methanogenesis and Putative Applications. Appl. Microbiol. Biotechnol. 2011, 89, 1333–1340. [Google Scholar] [CrossRef]
  58. Calt, E.A. Products Produced from Organic Waste Using Managed Ecosystem Fermentation. JSD 2015, 8, 43. [Google Scholar] [CrossRef]
  59. Strazzera, G.; Battista, F.; Garcia, N.H.; Frison, N.; Bolzonella, D. Volatile Fatty Acids Production from Food Wastes for Biorefinery Platforms: A Review. J. Environ. Manag. 2018, 226, 278–288. [Google Scholar] [CrossRef]
  60. Baumann, I.; Westermann, P. Microbial Production of Short Chain Fatty Acids from Lignocellulosic Biomass: Current Processes and Market. BioMed Res. Int. 2016, 2016, 1–15. [Google Scholar] [CrossRef]
  61. Esteban-Gutiérrez, M.; Garcia-Aguirre, J.; Irizar, I.; Aymerich, E. From Sewage Sludge and Agri-Food Waste to VFA: Individual Acid Production Potential and up-Scaling. Waste Manag. 2018, 77, 203–212. [Google Scholar] [CrossRef]
  62. Argun, H.; Kargi, F.; Kapdan, I.K. Light Fermentation of Dark Fermentation Effluent for Bio-Hydrogen Production by Different Rhodobacter Species at Different Initial Volatile Fatty Acid (VFA) Concentrations. Int. J. Hydrogen Energy 2008, 33, 7405–7412. [Google Scholar] [CrossRef]
  63. Ghiasian, M. Biophotolysis-Based Hydrogen Production by Cyanobacteria. In Prospects of Renewable Bioprocessing in Future Energy Systems. In Biofuel and Biorefinery Technologies; Rastegari, A.A., Yadav, A.N., Gupta, A., Eds.; Springer International Publishing: Cham, Switzerland, 2019; pp. 161–184. ISBN 978-3-030-14463-0. [Google Scholar]
  64. Uyar, B. Bioreactor Design for Photofermentative Hydrogen Production. Bioprocess Biosyst. Eng. 2016, 39, 1331–1340. [Google Scholar] [CrossRef]
  65. Zhang, Q.; Wang, Y.; Zhang, Z.; Lee, D.-J.; Zhou, X.; Jing, Y.; Ge, X.; Jiang, D.; Hu, J.; He, C. Photo-Fermentative Hydrogen Production from Crop Residue: A Mini Review. Bioresour. Technol. 2017, 229, 222–230. [Google Scholar] [CrossRef]
  66. Chorbadzhiyska, E.; Hubenova, Y.; Hristov, G.; Mitov, M. Microbial Electrolysis Cells as Innovative Technology for Hydrogen Production. Nat. Sci. 2011, 6, 422. [Google Scholar]
  67. Dange, P.; Pandit, S.; Jadhav, D.; Shanmugam, P.; Gupta, P.K.; Kumar, S.; Kumar, M.; Yang, Y.-H.; Bhatia, S.K. Recent Developments in Microbial Electrolysis Cell-Based Biohydrogen Production Utilizing Wastewater as a Feedstock. Sustainability 2021, 13, 8796. [Google Scholar] [CrossRef]
  68. Kim, J.; Park, C.; Kim, T.-H.; Lee, M.; Kim, S.; Kim, S.-W.; Lee, J. Effects of Various Pretreatments for Enhanced Anaerobic Digestion with Waste Activated Sludge. J. Biosci. Bioeng. 2003, 95, 271–275. [Google Scholar] [CrossRef]
  69. Jiang, Y.; Dennehy, C.; Lawlor, P.G.; Hu, Z.; McCabe, M.; Cormican, P.; Zhan, X.; Gardiner, G.E. Inhibition of Volatile Fatty Acids on Methane Production Kinetics during Dry Co-Digestion of Food Waste and Pig Manure. Waste Manag. 2018, 79, 302–311. [Google Scholar] [CrossRef]
  70. Schink, B.; Stams, A.J.M. Syntrophism among Prokaryotes. In The Prokaryotes: Volume 2: Ecophysiology and Biochemistry; Dworkin, M., Falkow, S., Rosenberg, E., Schleifer, K.-H., Stackebrandt, E., Eds.; Springer: New York, NY, USA, 2006; pp. 309–335. ISBN 978-0-387-30742-8. [Google Scholar]
  71. Amani, T.; Nosrati, M.; Mousavi, S.M.; Kermanshahi, R.K. Study of Syntrophic Anaerobic Digestion of Volatile Fatty Acids Using Enriched Cultures at Mesophilic Conditions. Int. J. Environ. Sci. Technol. 2011, 8, 83–96. [Google Scholar] [CrossRef]
  72. Boone, D.R.; Xun, L. Effects of PH, Temperature, and Nutrients on Propionate Degradation by a Methanogenic Enrichment Culture. Appl. Environ. Microbiol. 1987, 53, 1589–1592. [Google Scholar]
  73. Staley, B.F.; de los Reyes, F.L.; Barlaz, M.A. Effect of Spatial Differences in Microbial Activity, PH, and Substrate Levels on Methanogenesis Initiation in Refuse. Appl. Environ. Microbiol. 2011, 77, 2381–2391. [Google Scholar] [CrossRef]
  74. Inhibitors of the Methane Fermentation Process with Particular Emphasis on the Microbiological Aspect: A Review—Czatzkowska—2020—Energy Science & Engineering—Wiley Online Library. Available online: https://onlinelibrary.wiley.com/doi/full/10.1002/ese3.609 (accessed on 12 July 2022).
  75. Wang, H.; Fotidis, I.A.; Angelidaki, I. Ammonia Effect on Hydrogenotrophic Methanogens and Syntrophic Acetate-Oxidizing Bacteria. FEMS Microbiol. Ecol. 2015, 91, fiv130. [Google Scholar] [CrossRef]
  76. Cong, S.; Xu, Y.; Lu, Y. Growth Coordination Between Butyrate-Oxidizing Syntrophs and Hydrogenotrophic Methanogens. Front. Microbiol. 2021, 12, 742531. [Google Scholar] [CrossRef]
  77. Greening, C.; Geier, R.; Wang, C.; Woods, L.C.; Morales, S.E.; McDonald, M.J.; Rushton-Green, R.; Morgan, X.C.; Koike, S.; Leahy, S.C.; et al. Diverse Hydrogen Production and Consumption Pathways Influence Methane Production in Ruminants. ISME J. 2019, 13, 2617–2632. [Google Scholar] [CrossRef]
  78. Conrad, R. Contribution of Hydrogen to Methane Production and Control of Hydrogen Concentrations in Methanogenic Soils and Sediments. FEMS Microbiol. Ecol. 1999, 28, 193–202. [Google Scholar] [CrossRef]
  79. Lee, J.; Koo, T.; Yulisa, A.; Hwang, S. Magnetite as an Enhancer in Methanogenic Degradation of Volatile Fatty Acids under Ammonia-Stressed Condition. J. Environ. Manag. 2019, 241, 418–426. [Google Scholar] [CrossRef]
  80. Silva-Illanes, F.; Tapia-Venegas, E.; Schiappacasse, M.C.; Trably, E.; Ruiz-Filippi, G. Impact of Hydraulic Retention Time (HRT) and PH on Dark Fermentative Hydrogen Production from Glycerol. Energy 2017, 141, 358–367. [Google Scholar] [CrossRef]
  81. Guyot, J.-P.; Brauman, A. Methane Production from Formate by Syntrophic Association of Methanobacterium Bryantii and Desulfovibrio vulgaris JJ. Appl. Environ. Microbiol. 1986, 52, 1436–1437. [Google Scholar] [CrossRef]
  82. Belay, N.; Sparling, R.; Daniels, L. Relationship of Formate to Growth and Methanogenesis by Methanococcus Thermolithotrophicus. Appl. Environ. Microbiol. 1986, 52, 1080–1085. [Google Scholar] [CrossRef] [Green Version]
  83. Guyot, J.P. Role of Formate in Methanogenesis from Xylan by Cellulomonas sp. Associated with Methanogens and Desulfovibrio vulgaris: Inhbition of the Aceticlastic Reaction. 5. Available online: https://horizon.documentation.ird.fr/exl-doc/pleins_textes/pleins_textes_5/b_fdi_18-19/24195.pdf (accessed on 11 January 2023).
Figure 1. Schematic representation of the two-stage system [27].
Sustainability 15 03168 g001aSustainability 15 03168 g001b
Figure 2. Daily concentration of acetic, propionic, and butyric acid in the methanogenic reactors.
Sustainability 15 03168 g002
Figure 3. Daily concentration of acetic, propionic, and butyric acid in the fermentative reactors.
Sustainability 15 03168 g003
Figure 4. Volatile fatty acid stationary concentration for each sector and scenario. Values reported are the average of three replicates per sector and related scenarios, error bars represent standard error of the mean.
Sustainability 15 03168 g004
Figure 5. Daily trend of CH4 and H2 concentration in the methanogenic and fermentative reactors.
Sustainability 15 03168 g005
Figure 6. Daily trend of specific gas production (SGP) in the methanogenic and fermentative reactors.
Sustainability 15 03168 g006
Figure 7. Biogas production for each sector and scenario, reported as H2, CH4, and total biogas production. Values reported are the average of three replicates per sector and related scenarios, error bars represent standard error of the mean.
Sustainability 15 03168 g007
Figure 8. Daily reduction efficiency (ηVS) in the methanogenic and fermentative reactors.
Sustainability 15 03168 g008
Figure 9. Pathway of propionyl-CoA metabolization to succinate, inferred by PICRUSt2: (a) selection of KEGG map M00640; (b) absolute contributions from bacterial community to key enzymes evidenced in a). Each value is an average of three replicates for each sector and related scenarios; error bars represent standard error of the mean.
Sustainability 15 03168 g009
Figure 10. Bacterial community absolute contribution to pathways inferred by PICRUSt2: (a) short chain volatile fatty acids production; pathways are calculated by single genome contribution, with a coverage factor above 60%. Reported values are an average of three replicates per sector and related scenarios, error bars represent standard error of the mean. (b) Hydrogen-processing enzymes. Each value is an average of contributions of three replicates for each sector and related scenarios; error bars represent standard error of the mean.
Sustainability 15 03168 g010
Figure 11. Bacterial community absolute contribution methane producing pathways, inferred by PICRUSt2. Pathways are calculated by single genome contribution, with a coverage factor above 60%. Reported values are an average of three replicates per sector and related scenarios, error bars represent standard error of the mean.
Sustainability 15 03168 g011
Figure 12. Pathway of butanoyl-CoA metabolization to acetyl-CoA, inferred by PICRUSt2: (a) selection of KEGG map M00650, (b) absolute contributions from bacterial community to key enzymes evidenced in panel A by color match. Each value is an average of three replicates for each sector and scenario reported; error bars represent standard error of the mean.
Sustainability 15 03168 g012
Figure 13. Taxonomic heatmaps of 40 most abundant taxa at the genus level. Taxonomic heatmaps showing the first 40 most abundant ASVs per section: (a) absolute counts and (b) autoscaled counts, aggregated at the genus level. Percentages reported near the ASV names represent the relative abundance of the sum of ASV counts per sample against the total sum: a cut-off value of 0.005% was chosen. Hierarchical clustering was performed on columns with Pearson correlation based on Euclidean distance. In order to evidence variation, the color scheme of panel b, representing row-wise Z scores of ASV counts per sample, was chosen. For this color scheme, a Z value of 0 matches the reported percentage near the ASV names.
Sustainability 15 03168 g013
Figure 14. Taxonomic heatmaps of the 2nd 40 most abundant taxa at the genus level. Taxonomic heatmaps showing the first 40 most abundant ASVs per section: (a) absolute counts and (b) autoscaled counts, aggregated at the genus level. Percentages reported near the ASV names represent the relative abundance of the sum of ASV counts per sample against the total sum: a cut-off value of 0.005% was chosen. Hierarchical clustering was performed on columns with Pearson correlation based on Euclidean distance. In order to evidence variation, the color scheme of panel b, representing row-wise Z scores of ASV counts per sample, was chosen. For this color scheme, a Z value of 0 matches the reported percentage near the ASV names.
Sustainability 15 03168 g014
Table 1. Operating conditions of the reactors running during the experimental tests.
ParameterReference Scenario (S1)
S1CH4
Scenario 2 (S2)
S2H2
Scenario 2 (S2)
S2CH4
Scenario 3 (S3)
S3H2
Scenario 3 (S3)
S3CH4
Hydraulic Retention Time (HRT) (d)173121.512
Organic Loading Rate (ORL)
(kgVS/(m3d))
2.514.62.527.62.5
Table 2. Characterization feedstocks and inoculum feed to the reactor.
ParameterSubstrate Inoculum CH4Inoculum H2
TS (%)4.92.49 ± 0.022.49 ± 0.02
VS/TS (%)79.9961.33 ± 0.261.33 ± 0.2
pH (-)4.98.36 ± 0.028.36 ± 0.02
Table 3. Archaeal representation in different scenarios together with biogas volume and composition.
ScenarioArchaea (%)SEM
Archaea (%)
V Biogas (NL/Kgtvs)SEM
V Biogas
(NL/Kgtvs)
H2 (%)SEM H2 (%)CH4(%)SEM CH4 (%)
S1CH43.250.23519.7419.990.0070.00159.580.04
S2H21.620.1354.308.9614.6670.0172.370.02
S2CH44.870.61646.7658.500.0080.00072.750.11
S3H20.800.0441.498.7616.5450.0662.390.01
S3CH45.450.17691.3224.230.0100.00171.090.08
Table 4. Process yield in different scenarios.
ScenarioΔCH4 to S1
(%)
H2 from DF (%)H2 from DF (NL/KgTVS)ΔηVS
(%)
S10--0
S2+52.414.87.96+16.8
S3+59.016.66.86+20.1
Disclaimer/Publisher’s Note: The statements, opinions and data contained in all publications are solely those of the individual author(s) and contributor(s) and not of MDPI and/or the editor(s). MDPI and/or the editor(s) disclaim responsibility for any injury to people or property resulting from any ideas, methods, instructions or products referred to in the content.

