Abstract
In the international debate, the relationship between sustainable management in agriculture and the enhancement of landscapes is recent and is discussed in various international agendas. These objectives are connected to a growing demand for sustainable agricultural practices, quality productions, and ecosystem services in which farmers and institutions play a strategic role. According to the literature and international guidelines, new functions, and territorial connections can produce added value, especially in marginal rural areas. In this study, the aim is to investigate the factors that allow potential spatial concentrations for sustainable rural development to be identified, placing the landscape at the center of the research. Starting from a literature review, we select specific indicators and variables and analyze them combining Principal Component Analysis and cartographic analysis. The method applied to a region of significant importance in Italy, Apulia, has highlighted the importance of specific factors and significant imbalances, especially in marginal municipalities. The method, applicable in different regional contexts, can represent a useful policy tool, especially in marginal rural areas because it allows us to identify the geography of socio-economic spatial concentrations, suggesting interventions and actions in line with international agendas, such as Common Agricultural Policy reform and Green Deal.
1. Introduction
The new Common Agricultural Policy (CAP) for the 2023–2027 programming cycle represents an important challenge for European countries at various levels. Firstly, because there is the need to intervene and deal with the negative socio-economic effects produced by the COVID-19 pandemic, especially in favor of more fragile territories and population groups, and secondly because it proposes an ambitious and openly more sustainable development model for the rural areas participating in the European Green Deal. The new CAP aims to implement complex and strategic interventions, oriented toward results that look to the future of more equitable and sustainable agriculture and forestry, especially by considering local context factors in marginal rural regions. It, therefore, takes into account the critical issues and the main problems that have emerged in recent years, favoring greater support for small farms, and trying to adopt a more place-based approach with greater respect for local characteristics and conditions.
However, management methods in agriculture have produced important changes in agricultural landscapes in Europe. Although in the last 20 years, various initiatives have been developed within the framework of the CAP to favor more sustainable management of agriculture and landscapes, problems connected with effective implementation at the local scale have emerged.
In this context, the rural development objectives for the next programming cycle establish the promotion of a sustainable, smart, resilient, and diversified agriculture capable of guaranteeing: food security; launching and consolidating environmental and climate actions; actively supporting fragile territorial contexts. These objectives specifically concern the economic, social, and environmental dimensions. The modernization of agriculture, the dissemination and support of knowledge and innovation are key objectives for marginal regions, which therefore have to act in a strategic, transversal, and systemic way [1].
On the other hand, in the international debate, the attempt to deepen the relationship between biodiversity, sustainable management in agriculture, and enhancement of landscapes is recent and has been contemplated in various international agendas [1,2,3,4,5]. These objectives are connected to a growing demand for sustainable agricultural practices, quality productions, and ecosystem services in which farmers and institutions play a strategic key role. Farmers are considered fundamental actors for the concrete implementation on a local scale of practices capable of connecting agriculture, landscape, and biodiversity [6,7,8,9,10]. There has emerged a wider perspective on agriculture and its contribution to rural development. Agriculture is no longer limited to the economic and production functions in which the physical and economic size of the farms was an important delimitation criterion but is seen in a broader way, addressing other functions such as the social (food security, social cohesion, dispersed settlement patterns, employment, etc.), environmental (biodiversity, landscape, rural amenities, etc.), cultural (identity, heritage, etc.) and ethical aspects (fair trade, animal welfare, etc.) [11]. According to the new CAP guidelines, these functions and territorial connections can produce added value, especially in marginal rural areas.
However, what are the factors that allow the development of European rural regions from the perspective of cohesion and sustainability? A preliminary literature review conducted for keywords aimed at investigating characters and factors that allow potential spatial concentrations for sustainable rural development to be identified returns references that explicitly consider characters and dynamics directly connected to agriculture and specific regional socio-economic characteristics. Among them are wider approaches in the sense of broader transformation processes in the relations between agriculture and society: the role of short supply chains, multifunctionality, food security, and landscape preservation, the geography of quality productions, and more extensively, innovation and knowledge. In this study, the aim is to integrate these different research studies in an attempt to identify, describe, and represent socio-economic spatial concentrations oriented towards sustainable integrated rural development, in particular by placing the landscape at the center of the research, seen as a synthesis and key subject in the literature and in policy development, especially in favor of marginal rural areas.
The landscape and man-environment interaction placed at the center of this research are considered the main foundations and domains of geography [12,13,14,15,16]. Through the analysis of a regional case, significant at a national level, the Apulia region (South of Italy), for the identification of socio-economic spatial concentrations in the region, we will proceed through a series of stages. We will start from the literature review for the identification of key factors connected with the landscape, considered fundamental for sustainable rural development, then, to make these factors explicit, the corresponding indicators and variables will be selected from different official sources. These indicators/variables will be the subject of various stages of selection and analysis. In particular, the analysis of the principal components will be used to identify the most relevant factors for the explanation of the phenomenon and within this, the correlation matrix between components will be elaborated. The next phase will include the cartographic and cluster analysis to highlight areas of socio-economic concentration identified in the region.
At last, a method applicable in different regional contexts will be obtained. It can represent a useful policy tool, especially in marginal rural areas because it enables the geography of regional socio-economic spatial concentrations to be identified, suggesting interventions and actions oriented towards sustainability and territorial cohesion in line with international agendas.
2. Landscape and Its Contribution to Socio-Economic Development in Rural Areas
The territorial conditions and local assets considered as the basis of this study are those that affect the ability to generate local development benefits and processes. The visible and non-visible manifestations of these transformational processes are evident in the rural landscape above all, which is the expression and outcome of transformation and territorial organization and reorganization processes. This requires a study that can grasp the existing relationships and regional dynamics. The contribution of man in the formation of landscapes is significant and involves visible and non-visible manifestations that characterize landscapes and all the facts of a geographical, historical, economic, and social order which are the background of these aspects [16].
According to Löfgren [17], this idea of wholeness and complexity in the study and analysis of the landscape requires clarifications about the interrelationships between different aspects of landscapes, as well as the intrinsic relationships of “socio-ecological systems”. The concept of a socio-ecological system brings together two concepts: ecosystem and social. The term social, in this context, includes social, cultural, and economic systems. Socio-ecological systems provide different services and any change affects landscapes and related services, for example, the changes in land use. Similarly, the recreational function of a landscape depends not only on the land cover but also on other variables such as accessibility and other characteristics of the surrounding area. From a systemic point of view, it is, therefore, necessary to try to understand the relationships between different dimensions of a landscape (social, economic, natural, cultural, etc.), as well as the ongoing and future changes and the underlying processes. Regarding the transformations of the landscape, they are also complex, being driven by different factors in relation to each other, such as population growth, urbanization, economic factors, technological development, and so on. Knowledge of the current state of the landscape, of the different processes (social, economic, environmental, etc.), relationships, and changes is therefore fundamental for the formulation of strategic interventions. For these reasons, as Löfgren [17] argues, the cognitive phase is fundamental because, in addition to highlighting spatial relationships, it expresses territorial values through the descriptions of a landscape. Additionally, this is true when adopting different approaches such as experiential/participatory (people’s experiences of a landscape), empirical accounts (developed through scientific methods) of the current situation, and of social and environmental processes. In any case, regardless of the method adopted, in the description and representation of the landscape, the subjective component reflects the point of view of the observer because “Landscapes are spatial human-ecological systems that deliver a wide range of functions that are or can be valued by humans because of economic, sociocultural and ecological reasons” ([17], p. 928). Not only that, but as the author points out, the methods adopted to describe landscapes, however elaborate, are never exhaustive and in any case, involve a reduction of such complexity. According to the methods, there will be different representations and descriptions that will often be used as a basis for planning decisions, policy choices, and influencing the future of the territories. Therefore, it is essential to consider the types of knowledge available and their relevance, as well as the way in which that knowledge is produced with regard to the current and future situation (the so-called scenarios) and the ongoing and foreseen processes of change and transformation of the landscape.
Then, due to the importance that the landscape has in research and development policies, various classification schemes have been developed. The following categories have been frequently used: economic (including market values); natural meaning (including aspects of diversity and nature); aesthetic, scenic, and recreational (in terms of active and passive use and enjoyment); cultural significance (including elements associated with identity, learning, and history); and aspects relating to spirituality and a sense of place. Others are added to this perspective, such as intrinsic or anthropocentric, ethical, and participatory [17].
In this direction, among the landscape models that have tried to provide an integrated and place-based approach, there is the study conducted by Zasada et al. [15], innovative in several respects. In the first place it considers, analyzes, and interprets various significant European experiences to bring out methodological and conceptual explanatory elements in order to enrich the academic debate (putting the spatiality and existing diversity of European rural areas at the center of the research). Secondly, it gives pride of place to the landscape (one of the main foundations and domains of geography), as well as human-environment interaction.
Thirdly, it adopts a place-based perspective that considers different factors and mechanisms affecting agro-environmental aspects, policy and management of landscape, and its contribution to the socio-economic development of rural areas. This is done through the integration of the different dimensions of the local context, such as the social, economic, institutional ones, and the different spatial dynamics. Fourthly, the model has regulatory purposes. In fact, it aims to recognize the specific characters of the place, to explain the complex interactions that occur in agricultural landscapes in order to provide place-based policy indications. As the authors argue, agricultural landscapes are the most complex ones to understand but they represent important potential as they can offer various functions and services, which directly or indirectly satisfy human needs, food production, activities for recreation, and in general for human well-being, for the quality of life and the economic competitiveness of rural areas. Therefore, the sustainable management of agricultural and rural landscapes is increasingly important also to foster the vitality and dynamism of rural areas, especially marginal ones, in an integrated and coherent way with local needs.
From the research by Zasada et al. [15], which is based on a review of the literature and European case studies, it emerges that the recognition of specific characteristics linked to the local territorial system is fundamental for the development of rural areas and for understanding the complex interactions between policies, landscape, and benefits. The conceptual model aiming at place-based sustainable landscape management supports goals for well-being and quality of life and economic competitiveness in rural areas. This model highlights the role of the various factors and their influence, which are related to the local institutional capacity and specific context.
The model explains how the complex of policies (planning, agricultural, and other types) influence the ownership structures and the various aspects of agricultural management, with effects on the landscape, functions, and services. In these terms, agricultural management objectives and practices are important for several reasons, such as the ability of the landscape to provide more complex functions and benefits. The model, therefore, tries to explain the functional links between landscape and socio-economic benefits, considering socio-institutional (i.e., local actors, stakeholders, and governance structures), socio-economic aspects of the territorial contexts from the point of view of the “New Rural Paradigm” [15], based on the need for place-based policies that take into consideration the diversity of rural areas and the development potential expressed in the literature of territorial capital [18,19,20,21]. This presupposes the recognition of the local conditions, of the potential for development, and the problems affecting the European areas (characterized by a significant heterogeneity) that often limit the effectiveness and efficiency of policies and therefore the benefits in favor of local communities [15,22,23,24,25,26,27,28]. Starting from this conceptual framework, we will focus on the regional conditions and local assets capable of supporting sustainable development processes connected with landscapes.
3. Identifying Socio-Economic Spatial Concentrations for the Development of Rural Areas: A Proposal Method
3.1. Method
With these assumptions, the operational method follows a set of steps to identify the areas of socio-economic spatial concentrations that describe the main regional characters. In particular:
(1) The identification of factors for sustainable rural development, placing the landscape at the center, through literature review, documentary research, and occasions of discussion and active involvement of local actors (entrepreneurs, Local Action Groups, trade associations, etc.) to better calibrate the choices.
(2) Research and selection of quantitative data from different official sources and preparation of a database at the municipal scale for the last year available for the region and testing of cartographic elaborations.
(3) Preliminary factor and principal component analysis (PCA) and elaboration of the correlation matrix (using SPSS software) as the most suitable statistical technique for the representation.
(4) Identification of socio-economic spatial concentrations by analyzing and mapping the spatial distribution of each factor and correlated ones emerging from PCA and through the identification of clusters, by using the k-means method for the main components to get an overview of the phenomena.
In the next section, starting from these guidelines, the analysis of the literature will make it possible to identify specific factors associated with landscapes for integrated sustainable rural development. The next step will be to identify specific indicators and variables that made it possible to explain these drivers whose application concerns the case of the Apulia region. The Principal Component Analysis and cartographic analysis in a GIS environment (by using QGIS software) will allow the identification of socio-economic spatial concentrations connected with the landscapes for sustainable rural development in the region.
3.2. Territorial Conditions and Local Assets for Socio-Economic Spatial Concentrations: Theoretical Framework
The extraordinary richness of agricultural landscapes and the diversity of agricultural areas in Europe represent important potentials for the functioning and attribution of values to such landscapes and must go beyond the standard approach in order to highlight the specific peculiarities. Some studies conducted in Europe, such as that of Paracchini et al. [29] have developed some landscape indicators connected with the CAP in a broader sense of rural-agricultural landscape characterized by the interrelation of different identifiable components such as natural conditions, agricultural traditions, agricultural systems, cultural heritage, management (especially by farmers) oriented towards the development of the areas. Among the indicators selected, there are the agricultural areas in protected and valuable sites, certified products under the Protected Denomination of Origin (PDO), and Protected Geographic Indication (PGI) schemes.
In the model by Zasada et al. [15], presented in the previous section and in various research studies in neo-endogenous development models, specific local factors are crucial for development, especially of marginal rural areas [20,30]. In adopting the New Rural Paradigm, the authors [15] argue that rural development can take place by acting on specific fields, including innovation, market governance (institutional capacity to interact with various markets), and new institutional arrangements (institutional capacity to support stakeholder cooperation). Specifically, to support marginal regions, the axes of intervention concern the modernization of production and the integration of the value chain, and the restructuring and diversification of economic activities in rural areas as a whole. In addition, stabilization measures aim for the continuation of agricultural and forestry activities with special emphasis on agricultural survival and maintenance of the population in rural areas (the latter is often heavily dependent precisely on agricultural activities). Stabilization interventions mainly seek to support economic actors and deal with disadvantaged conditions, linked to the particular conditions of these areas (geomorphological, demographic, infrastructural, remoteness, etc.). To these interventions, the authors add the safeguarding of production systems in disadvantaged regions, often fundamental in the provision of ecosystem services related to agriculture, such as the visual quality and recreational values of cultivated landscapes or the conservation of biodiversity dependent on crops or livestock. The modernization of agricultural production, according to the authors, should allow the actors of the rural economy to make better and more sustainable use of natural resources to develop new processes or products, such as, for example, organic or integrated production, the production of quality products or those with a designation of origin. These elements contribute on the one hand to improving vertical integration and integration between different sectors and on the other favor the so-called “re-territorialization of value”.
Other authors recognize the importance of further characteristics and dynamics directly connected to agriculture for rural development, such as the role of short supply chains [31,32,33,34,35], the multifunctionality [11,36,37,38,39,40,41,42], the geography of quality productions [43,44,45,46,47,48], and more extensively, innovation and knowledge [49,50,51,52,53,54,55,56,57,58]. In particular, the most popular literature [50,53,54,55,56,57,59,60] recognizes that innovation plays a central role in regional development, especially in favor of rural marginal areas [25,52,58]. Among others, Läpple et al. [57] recognize innovation as a central role in productivity, profitability, and competitiveness in the agricultural sector, although for this potential there is marked heterogeneity between the different countries and this can be explained by various factors including institutional arrangements, knowledge systems, infrastructural systems. The authors argue that it is specifically in the literature that it is possible to identify the factors that can facilitate or limit innovation in agriculture, a fundamental sector in many marginal rural regions. Context factors such as attitudes and skills of the population, characteristics of the agricultural systems influence innovative performance, and geographical proximity. The latter, on which there is some disagreement in the literature, can however have negative effects on innovation efforts, especially in remote areas. Social learning usually promotes substantial technological and institutional innovation, whereby spatial concentration can have a positive impact on the exchange of knowledge between economic agents and actors and this can lead to the adoption of technologies, and, spatially clustered innovations. However, as emerges from the research, innovative activities tend to cluster within specific localities. The intensity of geographical concentration and the spatial organization of innovative processes can vary considerably between different sectors and regions. The concept of innovation adopted by the authors is a more complex one since it is not limited to the technical aspects but also to the social and environmental ones. Innovation in agriculture, therefore, evolves as a result of interactions between actors or different systems. An innovation system is facilitated in the context of networks between different actors and organizations to encourage the birth of new products, processes, and new forms of organization. At the micro level, possible drivers of innovation have been identified. The study revealed that structural characteristics, such as farm size and the age of the farmer, better explain spatial differences in innovative behavior across different groups, while accessibility to information distinguishes innovators from the rest.
Other factors concern the proximity to research centers which in many cases helps to favor agricultural innovations due to “knowledge-spillovers”. Furthermore, the role of education and the proximity to places of education that have a positive impact on innovation in rural areas is reconfirmed. The results of this study show that there is a heterogeneity in agricultural innovation, highlighting once again the presence of regional factors influencing it.
A further contribution is by Bathelt et al. [49]. For the authors, knowledge is considered one of the main distinctive characteristics of spatial clusters in the context of economic activities, in fact, in these areas, there are greater opportunities for the transmission of often non-articulated and tacit forms of knowledge between companies. Such locally present knowledge, when combined in new ways with codified and accessible external knowledge, allows new value to be generated. In fact, one of the main arguments in the contemporary literature on learning and innovation is that they are the result of interactive processes between different actors who collaborate for the solution of specific problems and, in this case, the research work often focuses on the relations of the business network. In specialized clusters, businesses develop a demand for highly specialized services and supplies and this often drives companies and other businesses to choose these areas as important markets are created. However, this is not enough, since the “localized capabilities” and the “non-negotiated interdependencies”, the socio-institutional contexts, the interactive processes of localized learning, the quality and density of social relationships, the development of values, attitudes, and shared interpretations typical of communities of practice, which allow local actors to engage in interactive learning and problem-solving, to transfer general and specific information for problem-solving, and to develop trust and reciprocity, factors which play a fundamental role in the processes of innovation and growth. The greater the number of similar and connected businesses in a spatial cluster, the more dynamic is the local context thanks to the dissemination of practices, knowledge, and potential for external collaborations. However, all this does not happen in a homogeneous way and requires institutional and infrastructural support, with adequate tools and actions to favor local and extra-local networking [49].
In summary, therefore, the literature agrees in regarding the following factors as fundamental: geography of quality productions and related schemes; market governance; cooperative arrangements; modernization of agricultural production; integration of the value chain; restructuring and diversification of economic activities in rural areas; provision of ecosystem services related to agriculture; biodiversity conservation/valorization; best and sustainable use of natural resources to define new processes or products (such as organic or integrated production); short supply chains; multifunctionality; innovation and knowledge systems; integrated networks between different actors and organizations to encourage the emergence of new products, processes and new forms of organization; size of the farm and the age of the farmer; role of education, of human and social capital; research and counseling systems; presence of highly specialized services and supplies; broader cooperation and networking and so on.
In the next sections, we will try to identify socio-economic spatial concentrations for rural development and landscapes by considering an emblematic case study at the national level. The method aims to clarify drivers for rural development connected with landscapes through the research and selection of specific variables and indicators, also calibrated through various moments of confrontation with local actors. In particular, in carrying out this research, the desk analysis was supported by fieldwork. Specific moments of discussion and involvement of local actors were held. In particular: thematic workshops in the presence of entrepreneurs, associations and representatives of the agriculture and environment sector, mayors, Local Action Groups, etc.; open discussions such as the thematic study day and in-depth interviews of a Local Action Group (LAG “Meridaunia”, significant at a national and regional level as a pilot area in the National Strategy for Inner Areas and therefore an experimentation laboratory for integrated and sustainable rural development strategies).
3.3. Study Area
The Apulia region (Southern Italy) is classified as one of the regions lagging behind, although it is among the most innovative in Italy in the LEADER context. Therefore, the region represents a national test bench for the policies and interventions implemented especially in recent years [25,58].
The territory, ranging between flat and hilly, extends for about 19,000 sq. km and is distinguished by a markedly individual character and by a physical uniformity due to the specific lithological composition. Various geographical and historical factors have influenced the irregular population distribution, the type of economic structures, and transformation processes in the agricultural sector, especially around the 1950s [14].
The prevalence of calcareous soils and the scarcity of surface hydrography, the development along the whole coast, and the flatness of the territory are among the characteristics that highlight the physical-geographical individuality of the region in comparison with Italian territory. However, this uniformity does not coincide with a landscape uniformity where the modeling activity of man has had a major impact and this is evident above all in agricultural landscapes in the region. These landscapes have a strong rural character in which the agricultural spaces have been strongly conquered by humans, who extended the dry arable land area during the dominance of extensive capitalist agriculture based on a pastoral cereal economy. The signs of these complex transformation processes are present everywhere in the region. The typical rural constructions (characterized by specific organizational forms) widespread in the region [14], are an important component of the landscape and of the region’s historical and cultural heritage, though today they are being abandoned or destined for other uses. Among other historical temporary buildings and shelters there are the “riposi” and “poste” for the flocks that migrated seasonally mainly in the north of the region. The flocks in large numbers came down from the mountains of Abruzzo in winter, along the “tratturi”, wide grassy routes, stopping in temporary rural residences, scattered among the typical “masserie”, buildings present throughout the region usually used by farm laborers for the extensive cultivation of wheat [16]. The socio-economic role that agriculture has played over time is evident in the regional landscapes. Indeed, the latter has been the subject of agricultural transformation processes which have often changed their physiognomy and territorial organization [14,16]. Most of the region is rural and this explains the strong dependence on the Common Agricultural Policy [10]. It is a region that has experienced and still experiences a territorial demographic and economic disparity which is concentrated above all in the smaller municipalities which are currently included in the National Strategy for Inner Areas.
In addition to its historical socio-economic importance, today the agricultural sector, still has a strategic role at the regional and national levels. Recent data show the importance of the sector at the national level, with specific characteristics of agricultural systems [61]. According to the National Institute of Statistics data [62] from the 2020 census, the region has the largest number of farms at the national level (over 190,000 in 2020) with a strong prevalence and persistence of farms managed directly by the owner or by family members. The region has the largest number of farms on a national level dedicated to arable crops (about 92,000 farms, accounting for around 13% on a national level with around 668,000 hectares of UAA) and woody agricultural crops (over 170,000 farms, around 21% on a national level, 491,000 hectares of UAA).
Although farms have decreased in number over time, as happened all over Italy, they represent an important socio-economic resource at the national and regional levels. The latest data for 2020 shows Apulia with the largest utilized agricultural area (after Sicily) in Italy (over 1,200,000 hectares) (Figure 1).
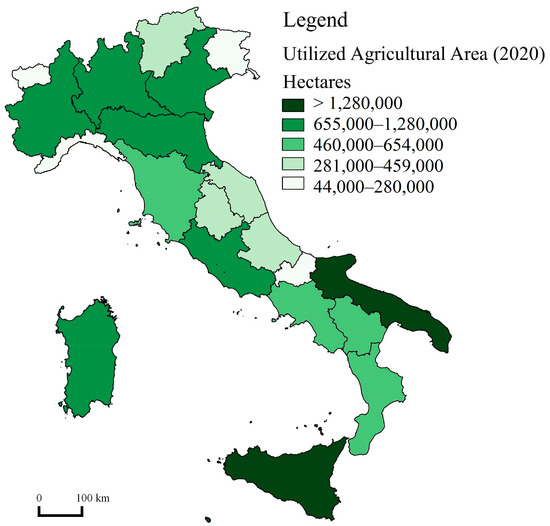
Figure 1.
Italian regions: utilized agricultural area (UAA) (2020). The map shows with different colors the Italian regions classified by UAA. Two regions show the highest values on a national scale: Apulia and Sicily. Source: our elaboration on Istat data, 2022.
This demonstrates the richness and variety of agricultural and productive structures in which it differs from the rest of Italy both in agricultural area, vast areas of significant rural landscapes, the prevalence of micro-enterprises established over time, and in the presence of local traditional crops of national significance (including the best known, olives and grapes). These crops are widespread throughout the territory and they constitute the distinctive feature of the rural landscape, also displaying dynamic agriculture [61,63]. In the history of the region, therefore, the natural, historical, economic conditions, human activity, and the role of institutions have been decisive over time, often modifying land management, services, functions, demographic settlement, and resulting in abandoned farms and irreversible effects on landscapes [10]. Although the agricultural sector is important and relevant in the national and, above all, regional economy, there are several problems and limits that the region has been trying to tackle, especially in the last programming cycles.
3.4. Materials and Data
As is known in recent years, for various reasons connected above all to the planning and programming of policy interventions at different territorial levels, there has been a spread of synthetic indicators representing complex phenomena not only derived from scientific research but also from policies [26,27,64,65,66,67,68,69]. More recent examples are the UN millennium development goals and the EU sustainable development strategy. Although these synthetic indicators are subject to criticism as regards the type and availability of data (especially at more detailed territorial scales), for the methodologies used, for the processes of selection of the variables and their aggregation and synthesis, they allow a more immediate understanding of the phenomenon, make it possible to make space-time comparisons and, by having data, they favor their replicability. One aspect to consider is that, when the indicators are linked together in a specific framework, this system of indicators is characterized by a greater value than the sum of its single parts. In fact, as observed by Eurostat’s methodological report [66,67], each variable and indicator explaining a phenomenon can be considered a part of a specific picture and it is important to consider and interpret it in relation to others. Another aspect is the fundamental importance of selecting an appropriate framework to define a set of indicators/variables in which a good combination is theory-driven, policy-driven [66], and place evidence [70]. Thirdly, it is important to limit the set of variables/indicators to those strictly necessary, to avoid “diluting key information” [66].
Based on these assumptions, the literature review produced an initial list of over 50 variables and indicators made available by official sources. They were chosen because potentially related to the landscape, for example in terms of their ability to characterize a landscape, to be the result of specific traditional management choices, or to have direct and indirect effects on the landscape. This is the case for example of certified productions which must comply with the following criteria as indicated in recent research [see [29]]: (1) the product determines a specific landscape (i.e., vineyards, olive groves, etc.); (2) the production area is characterized by a particular landscape (i.e., bocage, alpine meadows, maquis, etc.); (3) the production has a specific purpose of protecting and enhancing the characteristics of the landscape; (4) the production is the result of a long traditional process of rural landscape management.
The resulting database has been the subject of a process of selection and analysis of possible combinations capable of favoring an interpretation of the phenomenon using a theoretical framework. For the selection operations, the variables and indicators were better defined based on previous and ongoing research experience and on information acquired through work on the ground. Starting from the assumption that a single variable/indicator is never able to “express” a concept in all its semantic extension, we tried to use multiple ones to try, at least in this initial phase of exploration, to cover as much as possible the extension of the phenomenon to be studied. Specific variables/indicators were selected that could represent the different dimensions among the numerous, though limited, variables/indicators emerging from the most recent statistical survey on a municipal scale. With reference to the latter aspect, their choice was dictated by the effective availability, relevance, and ability to represent the various phenomenon. The database contained the last data available at the municipal level for a relatively homogeneous time period, in view of their effective availability and homogeneity. This enabled us to gain a preliminary understanding of the data trend, their territorial distribution, and the existing relationships.
3.5. Principal Component Analysis: Main Results
In order to estimate the adequacy and statistical significance of the database, a preliminary, exploratory analysis was conducted. Preliminary statistical analysis was performed through exploratory factor analysis using the principal component analysis (PCA) method. The PCA can be considered one of the most widely used multivariate statistical analysis methods in the social and physical sciences for size reduction [71,72]. It also aims to simplify the original data, by reducing a relatively high number of variables (which represent the characteristics of the phenomenon analyzed) to some latent ones. The reduction of complexity is accomplished by focusing on the analysis of the main variables/indicators (by variance). This step reduced the number of items selected, cutting them in half. The dataset was subjected to Kaiser-Meyer-Olkin sample adequacy, whose value was high (over 0.87, in general, values between 0.8 and 1 indicate that sampling is adequate), the Bartlett test to evaluate correlations, and commonality tests. The analysis of commonality expresses the variability that each individual character brings to the process of factor extraction. The greater this value, the better the variable lends itself to this type of analysis. The initial commonality is always equal to 1, as it is the variance explained by each phenomenon. A value over 0.50 represents increasing good commonality (the results obtained are shown in Table 1). The results of ACP, in terms of total variance explained, allow for the identification of specific components. The result enabled the extraction of significant items (Table 1) and five components explaining 77% of the total variance. A further result of the ACP was the correlation matrix calculated both among the items and five main components obtained at the municipal level.

Table 1.
ACP: results of the commonality analysis.
Considering the main results of the ACP, in representing the main components obtained, in descending order, the first and largest (which explains 46% of the variance, while the others that follow explain less than 10%), bringing together data which are the expression of the research infrastructures and employees, network activities, endowment of total services, places and institutions for education, entrepreneurial dynamism in terms of the birth rate, distribution of enterprises and employees. The second component brings together data that indicate forms of enhancement of local productions and integration of agro-food chains in the area. The third component identifies data closely related to companies in terms of dynamism and size. The fourth component looks at the broader aspects of integration and multifunctionality with agriculture, in terms of services connected with tourism, in the specific case of agro-tourism accommodation and related services. The fifth component mainly considers the socio-economic characteristics of the families living in the various municipalities, thus including the level of education, but also the quality of housing and services, and income conditions which are therefore an expression of the potential exposure to socio-economic vulnerability.
In the next step, the spatial distribution of each item and component will be explored. This enabled the exploration of the relationships between different attributes and the drawing of a picture of the characters to capture with grouping. The cartographic comparison between related items allowed us to highlight areas of spatial concentration, but also differences. In fact, to take this analysis to the next step, in order to understand to what extent these relationships are significant, cluster analysis was used. For this purpose, the k-means cluster analysis method can be considered one of the most widely used methods for grouping a data set. The algorithm used group observations on the basis of a set number of clusters. The k-means analysis and mapping of the five components that emerged in the ACP, highlighted the dynamics connected to the specific groupings.
3.6. Cartographic and Cluster Analysis: Main Results
The ACP carried out took into consideration what emerged in different steps. In fact, its calculation setting for each municipality and item enabled both specific insights and general analysis. Single items were subjected to a preliminary cartographic analysis in a GIS environment, where specific maps were elaborated. An overall picture was provided by the use of the k-means method which allowed the identification of clusters for each main component extracted from the ACP. The cartographic analysis assigned municipalities to specific groups based on their main characteristics.
It, representing some of the attributes and their respective concentrations and correlations, brought out some interesting aspects. Of particular interest is the share of active enterprises in the agriculture and manufacturing enterprises linked to agriculture, specifically the agro-industry of food and beverage (expressed by the National classification system of economic activities with “C” divisions 10 and 11 of the manufacturing sector) (Figure 2a). This indicator summarizes the action regarding the integration of primary producers in the agro-food chain through quality schemes, the promotion of products on local markets, short supply chains, producer associations, and inter-professional organizations. According to the correlation matrix, it has numerous significant correlations, with businesses, specialized services, with the multifunctionality of agriculture, natural, and landscape protection schemes. The cartographic elaboration highlighted some areas of greater, or medium concentration, and others of total absence of the phenomenon. Although the region plays an important socio-economic role on a national scale regarding agriculture, the integrations of the supply chain are still modest. This fact, considered together with the characteristics of the region’s agricultural systems, shows that the integration of primary producers is more evident in areas with a prevalence of medium-large farms, along an axis from the north of the region (from the province of Foggia) and extends into the nearby provinces, focusing on the larger centers. If we observe the phenomenon from the opposite extreme, it is evident that this integration above all does not concern the smaller municipalities, also here highlighting areas totally lacking the phenomenon. As emerges from the ACP correlation matrix, one of the factors with which it is correlated is the birth rate of companies and this can also be observed cartographically (Figure 2b). This rate is relatively low in most of the municipalities in the region, and again the highest values are found in the major municipalities where the integration between primary supply chains is more evident.
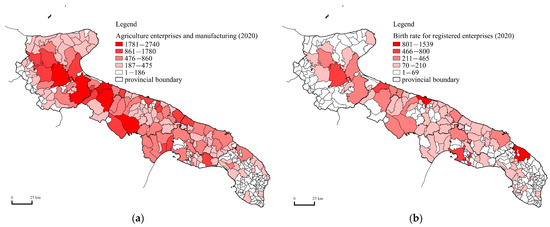
Figure 2.
Apulia region: share of active enterprises of the agriculture section and agro-manufacturing sector and birth rate for enterprises. Source: our elaboration based on Agenzia per la Coesione territoriale—Unioncamere. (a) Share of active enterprises in the agriculture and agro-manufacturing sector, specifically the food and beverage industry (per 100 enterprises) (2020). (b) Birth rate for registered enterprises (2020).
Regarding the level of employees in the tertiary sector “Knowledge-Intensive market services” (excluding high-tech and financial services) (per 1000 employees) (Figure 3a), also in this case, the map shows a concentration in the larger municipalities (where research infrastructures and highly specialized services are usually present). Based on the correlation matrix, this indicator also shows interesting correlations with others, one of which is the number of producers and processors of quality products with certified denominations (Figure 3b). The recognition and valorization of quality productions, therefore, shows areas of concentration in the presence of highly specialized knowledge-intensive services where there are knowledge-spillovers. The indicator of producers and processors of quality products with certified denomination has in turn a good correlation with the areas subject to special protection, although also in this case the territorial diffusion is still quite modest, clearly lower than the entity of natural and landscape sites present in the area.
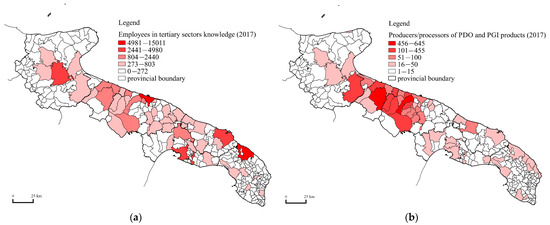
Figure 3.
Apulia: share of employees in tertiary sector Knowledge-Intensive market services and Producers and processors of PDO and PGI products. Source: our elaboration is based on Agenzia per la Coesione territoriale—Unioncamere, Istat data. (a) Apulia: share of employees in tertiary sector Knowledge-Intensive market services (excluding high-tech and financial services) (per 1000 employees). (b) Producers and processors of PDO and PGI products (2020).
As regards the protected and certified designations (obtained through the sum of those falling within the individual municipalities based on the geographical areas of the DOC and IGP productions defined by the Italian Ministry of Agriculture), although they show coverage for the region, also in this case their number is modest and any higher numbers are concentrated in well-defined areas. It shows correlations with businesses, specialized research and knowledge-intensive services, and the presence of protected areas in the territory. Considering the integrations with other production sectors, especially tourism, here too there are specific concentrations in well-defined areas which in part correspond to those where there are sites of naturalistic importance subject to special protection. The proposed method enables to get a better understanding of territorial dynamics and to identify the geography of socio-economic spatial concentrations in the region, which, when required, can compatibly be finer. In particular, the cartographic analysis highlights areas of socio-economic spatial concentration where, in addition to intermediate situations, two extremes emerge: areas of high concentration and areas of total absence of the observed phenomena. From the point of view of policy interventions, these are important signals in order to target initiatives in a territorialized manner, especially in areas with serious difficulties, especially regarding the social and economic vulnerability of the population (Figure 4).
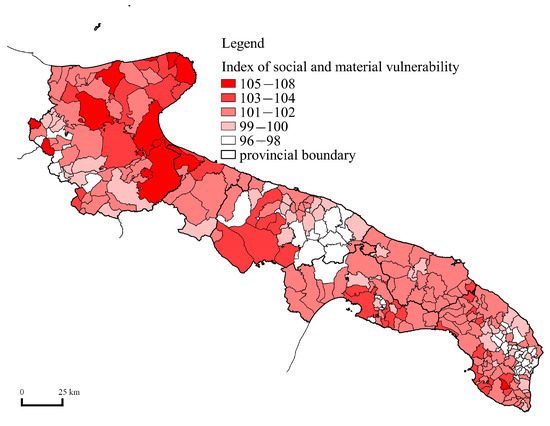
Figure 4.
Apulia region: index of social and material vulnerability in the various municipalities (2018). Source: our elaboration on Istat data, 2018.
Cluster analysis reinforced what has been discussed. The choice to carry out a cluster analysis is because it is useful “for extracting patterns from spatial-temporal datasets” and allows identification of similar elements through data mining operations to group them together. For this reason, in each group, or cluster, there will be characters similar to each other and dissimilar from those of other groups [74]. This allows for an overview of the data sets at the cluster level and, as carried out in this study, to be able to carry out specific insights. Among the various traditional methods of partition clustering, k-means was chosen. The k-means algorithm relies on distance as a similarity evaluation index, so the smaller the distance between two objects, the greater their similarity. It is capable of partitioning units based on spatial correlation and this allows for the differences between units in a group to be highlighted, furthermore it is suitable for all those cases where the number of clusters has already been defined [75,76]. In our case, in fact, the cartographic analysis for a single item and correlations made it possible to identify an optimal number of clusters equal to three. Then, the k-means method was used considering the ACP results. The five main components that emerged from ACP were analyzed and mapped in a GIS environment too. Although the analysis was carried out on all the components, the main results obtained for the first two principal components, which explain the greater variance, are reported. By considering the first component with the greatest explained variance, it is possible to identify three main clusters of municipalities. The first cluster (representing 2% of the region), consists exclusively of the major municipalities the urban poles of the region which therefore present similar characteristics in terms of infrastructural endowment and more qualified services, as well as a high level of entrepreneurial dynamism, production, research, and services activities. The second cluster (15% of the municipalities in the region) consists of medium-large municipalities characterized by a high population between 20,000 and over 100,000 inhabitants which are placed in an intermediate position. Figure 5, shows them located close to the major poles of which they often can be considered a socio-economic, organizational, and functional extension. The third cluster is the most numerous, as it brings together most of the municipalities in the region (about 84%). This grouping is heterogeneous, in fact, it includes both tiny municipalities (below 1000 inhabitants) and larger municipalities (over 25,000 inhabitants). It is a cluster of significant interest, as it includes, in addition to the municipalities defined by the Italian Strategy for Inner Areas, also other municipalities. It shows spatial imbalances, scarce or even absent infrastructural, production, and service structure, strongly subordinated to the more dynamic socio-economic systems, around which they gravitate.

Figure 5.
Apulia region: main clusters of municipalities emerging from ACP—First Component. Source: our elaboration.
The mapping of the second component from the ACP (Figure 6), the second highest in terms of explained variance, expresses the ability to enhance local products and favor supply chain integrations. It highlights the presence of three somewhat more heterogeneous clusters. Cluster 1 brings together 13% of the municipalities in the region, within which there are mainly medium-large sized municipalities in terms of population (with an average of 50,000 inhabitants) and also medium-large size farms (especially in the north of the region). Cluster 2, intermediate, representing about 34% of the municipalities, is a heterogeneous group in which there are above all medium-sized municipalities (average population of 15,000 inhabitants). There are dynamic municipalities from the various provinces, which in many cases represent production centers and qualified services, especially in terms of enhancing local quality products. Cluster 3 is the largest but also the most heterogeneous, representing about 53% of the municipalities in the region, including both small and medium-sized municipalities (average population of 7000 inhabitants). Most of the municipalities, despite presenting significant resources and quality productions, show less dynamism, lower local integration capacity between primary and other production sectors, and for the most part have a lower endowment of services and infrastructures capable of promoting processes of innovation and regional valorization.
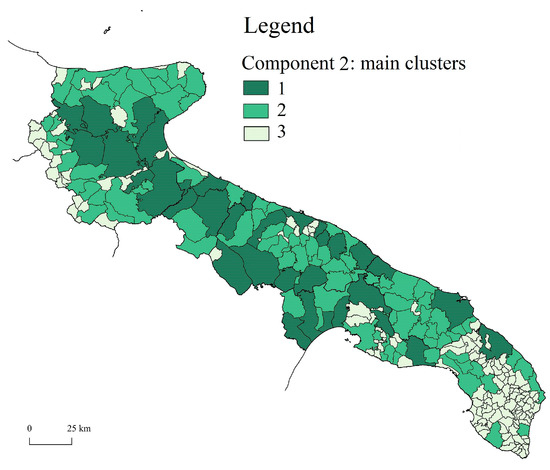
Figure 6.
Apulia region: main clusters of municipalities emerging from ACP—Component 2. Source: our elaboration.
In general, as shown by the detailed cluster analysis, different areas emerge, in which there are situations of greater dynamism and endowment of services, production qualification, and integration, along with intermediate situations often functionally integrated with larger ones, as well as more marginal areas characterized by significant problems of socio-economic vulnerability, scarce provision of services and infrastructures, reduced integration between the primary sector and other production sectors, etc., often strongly subordinated to the major centers, around which they gravitate. For the most part, the situation in the region is not particularly encouraging although there are significant local resources. Unfortunately, these are little known and scarcely exploited, as demonstrated, for example, by the indicators of protected and quality certifications (Figure 3b). However, the significant potential of the rural areas in the region is evident even just from the mapping of some of the most significant landscapes (Figure 7) which reveal the regional richness and variety, though still little known and therefore undervalued. The analysis carried out may suggest policy interventions that can facilitate integrated and sustainable rural development, especially in the more marginal municipalities, where, as can be seen in the map (Figure 7), these resources are present and an expression of local identity, and can represent a strategic connection factor. These resources differ from the network of ancient transhumance routes, significant rural landscapes, and those included in special protection areas, to the historic rural dwelling. With regard to the significant rural landscapes according to the landscape plan of the Apulia region [77] there are components of the valuable agricultural landscape such as historical heritage, areas of agricultural reforms, traditional forms of cultivation, multifunctional agricultural parks oriented towards valorization (parks of monumental olive trees, parks of towers and historic farmhouses, parks of Trulli Valley, etc.). Such resources which, as can be seen from Figure 7, connecting different municipalities, can represent an important driving force for rural development, especially in marginal areas. The resources represented are only some of those present in the region, for this reason and for all that has been discussed, an experiential and participatory approach would be important for their valorization and sustainable integrated development.
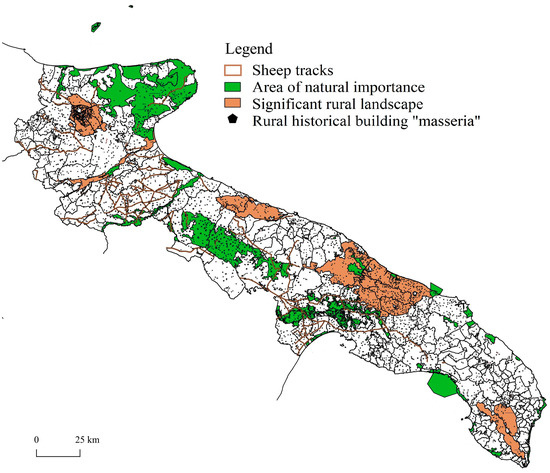
Figure 7.
Apulia region: the extraordinary presence of resources linked to the rural landscape. The map shows the ancient roads of transhumance called “tratturi”, the historic rural buildings, the rural landscapes, and areas under protection and of natural importance at national level. Source: our elaboration on Apulia—Territorial information system, various data, 2022.
4. Conclusions
The study, starting with the literature review, has allowed us to elaborate a method for the identification of the spatial socio-economic concentrations connected with the landscape oriented towards sustainable integrated development, especially in marginal rural areas. The combined use of specific statistical and cartographic analysis techniques at the municipal scale has made it possible to highlight the geography of socio-economic spatial concentrations, as well as the regional specificities, problems, and existing relationships between different phenomena.
Considering a regional case study, Apulia (South of Italy), significant on a national level, the analysis generally highlighted a limited propensity for innovation and supply chain integration, low enhancement of local productions and resources, weak presence of infrastructures and qualified services, high socio-economic vulnerability, etc. The evidence emerging from the study shows a geography of socio-economic spatial concentrations with in-depth analysis for each item, municipality, and cluster. The results obtained highlight spatial differentiations and, in particular, the presence of three main clusters of municipalities which can be classified in descending order in terms of endowment and specializations in qualified services, integration between primary supply chains, connections with other actors, economic activities (such as tourism), capacity to valorize local, quality products, the endowment of specialized human capital, etc.
The areas of greatest socio-economic spatial concentration usually coincide with the major municipalities where there is a greater presence of highly qualified services, research infrastructures, dynamic entrepreneurs, greater cooperation, better integration and cooperation between the primary sector and other sectors, etc. On the other hand, an extreme situation emerges concerning the minor municipalities where, despite the socio-economic role of agriculture and the presence of significant rural landscapes, there is little awareness and therefore little valorization of their potential. According to Italian Strategy for Inner Areas, these small municipalities have a key role, to “offer a strategic framework for the support and development of non-urban areas in decline or at demographic risk, but whose community asset is crucial for the overall maintenance of the territory in terms of hydrogeology, landscape and cultural identity” [[78], p. 3]. This study lends itself to more detailed insights useful for planning interventions and policies.
Principal aspects regard the ability to offer qualified services and quality products strongly connected with territorial values. The quality of products is confirmed as one of the drivers for rural development. The results are significant because the majority of such productions are concentrated in rural areas in Italy, characterized by demographic, social, and economic decline. However, as emerges from various European cases and as confirmed in our research, the most dynamic and innovative areas are those coinciding in the major centers, thus increasing the territorial imbalances.
Human capital plays a crucial role in knowledge production but is strongly reduced and continues to decrease in rural marginal areas. In these territories, the knowledge economy is a factor which, acting in a systemic manner, could unlock their socio-economic potential. As discussed here, most of the municipalities in the region fall into the typology of intermediate-marginal rural areas that face challenges of socio-economic vulnerability, poor accessibility to qualified services, high dependence on specific sectors, and a system of support for entrepreneurship and innovation that is weaker than in the rest of Italy with respect to the local needs.
As emerged in ongoing and current research, the combined reading of the structure and characteristics of the regional agricultural systems can reveal interesting reflections, and, above all, provide policy indications. A role certainly to be supported is that of the small and medium-sized farms which are widespread throughout the region and which show, as emerged in this study, evident limitations in marginal rural areas. These farms, as confirmed by research in Europe, contribute significantly to the supply of quality services and productions as well as having social, ethical, and environmental functions. As Renting et al. [11] argue, European evidence shows that small and medium-sized farms can contribute to the provision of important services and functions. An example is the role of the farms in the processing and marketing of food on a small scale in alternative food chains which provide economic benefits compared to industrialized supply chains. However, the richness and diversity of the regional rural landscape can represent an opportunity for the population, for entrepreneurial activities, and in general for rural development. Micro and medium sized-farms, widespread in the region, if adequately supported, can act to qualify the regional system as a whole, acting on the key potentialities and factors emerging in this research. These include connections with other sectors and production chains (such as tourism, crafts, heritage, etc.), with the enhancement of quality productions, development of qualified services, collaboration networks, dissemination of knowledge in a sector, like agriculture, which still has severe limitations in terms of innovation. In this direction, it is necessary to intervene specifically through strategic interventions in different areas because they require various factors for development. Therefore, regional support and governance are fundamental in order to intervene in a differentiated way in supporting especially marginal areas. In particular, as emerged in this study, the regional and local strategies should act in an integrated manner on specific potentialities, on the different factors of imbalance, favoring the networking between municipalities and different areas, promoting the dissemination of knowledge, and enhancing strategic and innovative collaborations in different fields at different scales.
Lastly, the method elaborated can be replicated in other contexts and in a dynamic way. Having data series available (at least) on a municipal scale it is possible the study of more complex spatial relationships to be able to act both on single factors and municipalities, and on the identified clusters. In fact, combining statistical and cartographic analysis enables one to understand the transformations taking place, and to offer support for the planning of interventions with a view to sustainability and territorial cohesion. The method can also represent a support tool for implementing agendas for sustainable rural development at a local scale because it is able to identify socio-economic spatial concentrations that highlight the regional potential and above all problems, the latter exacerbating socio-economic imbalances, the removal of which is essential for sustainable integrated rural development. The method enables these imbalances to be identified, setting the valorization of resources connected with agriculture as a fundamental objective, through the enhancement and integration of the existing rural heritage.
In view of the difficulties encountered in this research and for its future development, it could be desirable to implement the availability of quantitative and qualitative data at appropriate regional scales and to develop detection methods taking into account both the actual spatial dynamics and more experiential and participatory cognitive approaches. As discussed, this method allows one to carry out increasingly fine and detailed analyses according to various and specific purposes (knowledge, monitoring, planning, etc.) by different actors.
Funding
This research was funded by APULIA REGION, POR PUGLIA FESR-FSE 2014/2020—European Social Fund approved with Decision C (2015) 5854 of 13/08/2015 “Research for Innovation (REFIN)”.
Institutional Review Board Statement
Not applicable.
Informed Consent Statement
Not applicable.
Data Availability Statement
Main Official Data Resources: Istat—Istituto nazionale di statistica: https://www.istat.it; Agenzia per la Coesione territoriale—Unioncamere (SISPRINT—Sistema Integrato di Supporto alla PRogettazione degli Interventi Territoriali): http://www.pongovernance1420.gov.it; Agenzia per la Coesione territoriale (Strategia Nazionale Aree Interne): https://www.agenziacoesione.gov.it; Italian Ministry of Agriculture (Ministero dell’Agricoltura, della sovranità alimentare e delle foreste): https://www.politicheagricole.it; Apulia—Territorial information system (SIT—Sistema Informativo Territoriale della Regione Puglia): http://www.sit.puglia.it/ (accessed on 10 December 2022).
Conflicts of Interest
The author declares no conflict of interest.
References
- EC. Communication from the Commission to the European Parliament, the European Council, the Council, the European Economic and Social Committee and the Committee of the region. In The European Green Deal; EC: Brussels, Belgium, 2019. [Google Scholar]
- FAO—Food and Agriculture Organization. State of the World’s Biodiversity for Food and Agriculture; FAO: Rome, Italy, 2019; Available online: http://www.fao.org (accessed on 10 December 2022).
- EC. Commission staff working document. In Analysis of links between CAP Reform and Green Deal; SWD (2020) 93 Final; EC: Brussels, Belgium, 2020. [Google Scholar]
- EC. Communication from the Commission to the European Parliament, the Council, The European Economic and Social Committee and the Committee of the regions. In EU Biodiversity Strategy for 2030. Bringing Nature Back into Our Lives; COM/2020/380 Final; EC: Brussels, Belgium, 2020. [Google Scholar]
- EC. EU Biodiversity Strategy for 2030. Bringing Nature Back into Our Lives; EC: Luxembourg, 2021. [Google Scholar]
- Ledoux, L.; Crooks, S.M.; Jordan, A.; Turner, R.K. Implementing EU biodiversity policy: UK experiences. Land Use Policy 2000, 17, 257–268. [Google Scholar] [CrossRef]
- Robinson, G.M. (Ed.) Sustainable Rural Systems: Sustainable Agriculture and Rural Communities; Ashgate Publishing Ltd.: New York, NY, USA, 2016. [Google Scholar]
- Scherr, S.J.; McNeely, J.A. Biodiversity conservation and agricultural sustainability: Towards a new paradigm of ‘ecoagriculture’ landscapes. Phil. Trans. 2008, 363, 477–494. [Google Scholar]
- Kelemen, E.; Nguyen, G.; Gomiero, T.; Kovacs, E.; Choisis, J.P.; Paoletti, M.G.; Podmaniczky, L.; Ryschawy, J.; Sarthou, J.P.; Herzog, F.; et al. Farmers’ perceptions of biodiversity: Lessons from a discourse-based deliberative valuation study. Land Use Policy 2013, 35, 318–328. [Google Scholar]
- Labianca, M. Towards the new Common Agricultural Policy for Biodiversity: Custodian farmers for sustainable agricultural practices in the Apulia region (South of Italy). Belgeo 2022, 4. [Google Scholar] [CrossRef]
- Renting, H.; Oostindie, H.; Laurent, C.; Brunori, G.; Barjolle, D.; Jervell, A.; Granberg, L.; Heinonen, M. Multifunctionality of Agricultural Activities, Changing Rural Identities and New Institutional Arrangements. Int. J. Agric. Resour. Gov. Ecol. 2008, 7, 361–385. [Google Scholar] [CrossRef]
- Woods, M. Rural Geography; SAGE Publications: London, UK, 2005. [Google Scholar]
- Bonapace, U.; Turri, E.; Saibene, C.; Quaini, M.; Pedrini, L.; Desplanques, H.; Cori, B.; Fondi, M.; Bissanti, A.; Formica, C.; et al. I Paesaggi Umani; TCI: Milano, Italy, 1977. [Google Scholar]
- Bissanti, A. La Puglia. In I Paesaggi Umani; TCI: Milano, Italy, 1977; pp. 166–179. [Google Scholar]
- Zasada, I.; Häfner, K.; Schaller, L.; van Zanten, B.T.; Lefebvre, M.; Malak-Rawlikowska, A.; Nikolov, D.; Rodríguez-Entrena, M.; Manrique, R.; Ungaro, F.; et al. A conceptual model to integrate the regional context in landscape policy, management and contribution to rural development: Literature review and European case study evidence. Geoforum 2017, 82, 1–12. [Google Scholar] [CrossRef]
- Sestini, A. Il Paesaggio; TCI: Milano, Italy, 1963; Volume VII. [Google Scholar]
- Löfgren, S. Knowing the landscape: A theoretical discussion on the challenges in forming knowledge about landscapes. Landsc. Res. 2020, 45, 921–933. [Google Scholar] [CrossRef]
- ESPON. EDORA—European Development Opportunities for Rural Areas Applied Research; ESPON: Luxembourg, 2013. [Google Scholar]
- De Rubertis, S.; Mastromarco, C.; Labianca, M. Una proposta per la definizione e rilevazione del capitale territoriale in Italia. A proposal for the definition and detection of territorial capital in Italy. Boll. Assoc. Ital. Cartogr. 2019, 165, 24–44. [Google Scholar]
- Cejudo, E.; Navarro, E. (Eds.) Neoendogenous Development in European Rural Areas. Results and Lessons; Springer: Cham, Switzerland, 2020. [Google Scholar]
- Labianca, M.; De Rubertis, S.; Belliggiano, A.; Salento, A.; Navarro, F. Social Innovation, Territorial Capital and LEADER Experiences in Andalusia (Spain) and in Molise (Italy). In Neoendogenous Development in European Rural Areas. Results and Lessons; Cejudo, E., Navarro, F., Eds.; Springer: Cham, Switzerland, 2020; pp. 111–131. [Google Scholar]
- Prezioso, M. (Ed.) Quale Territorial Impact Assessment della Coesione Territoriale nelle Regioni Italiane. La Concettualizzazione del Problema; Pàtron: Bologna, Italy, 2018. [Google Scholar]
- Albrechts, L.; Healey, P.; Kunzmann, K.R. Strategic Spatial Planning and Regional Governance in Europe. J. Am. Plan. Assoc. 2003, 69, 113–129. [Google Scholar]
- Copus, A.; Dax, T. Conceptual Background and Priorities of European Rural Development Policy, Deliverable 1.2, EU-Project. Assessing the Impact of Rural Development Policies; EU: Stockholm, Sweden, 2010. [Google Scholar]
- Labianca, M. Towards a Visionary Approach for Rural Areas. From the Key Features to Planning the Future of Leader; Perspectives on Rural Development; Unisalento, SIBA: Lecce, Italy, 2021; Volume 5. [Google Scholar]
- ESPON. KITCASP—Key Indicators for Territorial Cohesion and Spatial Planning; ESPON: Luxembourg, 2013. [Google Scholar]
- ESPON. SeGI—Indicators and Perspectives for Services of General Interest in Territorial Cohesion and Development; ESPON: Luxembourg, 2013. [Google Scholar]
- ESPON. State of the European Territory. ESPON Contribution to the Debate on Cohesion Policy Post 2020; ESPON: Luxembourg, 2019. [Google Scholar]
- Paracchini, M.L.; Capitani, C.; Schmidt, A.M.; Andersen, E.; Wascher, D.M.; Jones, P.J.; Simoncini, R.; Carvalho Ribeiro, S.; Griffiths, G.H.; Mortimer, S.H.; et al. Measuring Societal Awareness of the Rural Agrarian Landscape: Indicators and Scale Issues; European Commission: Luxembourg, 2012; Available online: https://publications.jrc.ec.europa.eu/repository/handle/JRC68138 (accessed on 10 November 2022).
- Bosworth, G.; Price, L.; Hackulinen, V.; Marango, S. Rural Social Innovation and Neo-endogenous Rural Development. In Neoendogenous Development in European Rural Areas. Results and Lessons; Cejudo, E., Navarro, F., Eds.; Springer: Cham, Switzerland, 2020; pp. 21–32. [Google Scholar]
- Renting, H.; Marsden, T.K.; Banks, J. Understanding alternative food networks: Exploring the role of short food supply chains in rural development. Environ. Plan. A 2003, 35, 393–411. [Google Scholar] [CrossRef]
- Marsden, T.; Banks, J.; Bristow, G. Food supply chain approaches: Exploring their role in rural development. Sociol. Rural. 2000, 40, 424–438. [Google Scholar] [CrossRef]
- Ilbery, B.; Maye, D. Food supply chains and sustainability: Evidence from specialist food producers in the Scottish/English borders. Land Use Policy 2005, 22, 331–344. [Google Scholar] [CrossRef]
- Smith, B.G. Developing sustainable food supply chains. Phil. Trans. R. Soc. 2008, 363, 849–861. [Google Scholar]
- Shepherd, B. Global Value Chains and Developing Country Employment: A Literature Review; OECD Trade Policy Papers, No. 156; OECD Publishing: Paris, France, 2013. [Google Scholar] [CrossRef]
- Hrabák, K.; Konečný, O. Multifunctional agriculture as an integral part of rural development: Spatial concentration and distribution in Czechia. Nor. Geogr. Tidsskr. Nor. J. Geogr. 2018, 72, 257–272. [Google Scholar] [CrossRef]
- Brunstad, R.J.; Gaasland, I.; Vårdal, E. Agricultural production and the optimal level of landscape preservation. Land Econ. 1999, 75, 538–546. [Google Scholar]
- Brunstad, R.J.; Gaasland, I.; Vårdal, E. Multifunctionality of agriculture: An inquiry into the complementarity between landscape preservation and food security. Eur. Rev. Agric. Econ. 2005, 32, 469–488. [Google Scholar]
- Liu, L.; Cavaye, J.; Ariyawardana, A. Supply chain responsibility in agriculture and its integration with rural community development: A review of issues and perspectives. J. Rural Stud. 2022, 93, 134–143. [Google Scholar]
- Penker, M. Mapping and measuring the ecological embeddedness of food supply chains. Geoforum 2006, 37, 368–379. [Google Scholar]
- Vroegindewey, R.; Hodbod, J. Resilience of agricultural value chains in developing country contexts: A framework and assessment approach. Sustainability 2018, 10, 916. [Google Scholar]
- Knickel, K.; Renting, H. Methodological and conceptual issues in the study of multifunctionality and rural development. Sociol. Rural. 2000, 40, 512–528. [Google Scholar] [CrossRef]
- Parrott, N.; Wilson, N.; Murdoch, J. Spatializing quality: Regional protection and the alternative geography of food. Eur. Urban Reg. Stud. 2002, 9, 241–261. [Google Scholar]
- Tregear, A.; Arfini, F.; Belletti, G.; Marescotti, A. Regional foods and rural development: The role of product qualification. J. Rural Stud. 2007, 23, 12–22. [Google Scholar]
- Watts, D.C.; Ilbery, B.; Maye, D. Making reconnections in agro-food geography: Alternative systems of food provision. In The Rural; Routledge: London, UK, 2008; pp. 165–184. [Google Scholar]
- Sonnino, R.; Marsden, T. Beyond the divide: Rethinking relationships between alternative and conventional food networks in Europe. J. Econ. Geogr. 2006, 6, 181–199. [Google Scholar] [CrossRef]
- Murdoch, J.; Marsden, T.; Banks, J. Quality, nature and embeddedness: Some theoretical considerations in the context of the food sector. Econ. Geogr. 2000, 76, 107–125. [Google Scholar] [CrossRef]
- Crescenzi, R.; De Filippis, F.; Giua, M.; Vaquero-Piñeiro, C. Geographical Indications and local development: The strength of territorial embeddedness. Reg. Stud. 2022, 56, 381–393. [Google Scholar]
- Bathelt, H.; Malmberg, A.; Maskell, P. Clusters and knowledge: Local buzz and global pipelines and the process of knowledge creation. Prog. Hum. Geogr. 2004, 28, 31–56. [Google Scholar]
- Crevoisier, O.; Jeannerat, H. Territorial knowledge dynamics: From the proximity paradigm to multi-location milieus. Eur. Plan. Stud. 2009, 17, 1223–1241. [Google Scholar]
- Gertler, M. Tacit knowledge and the economic geography of context, or the undefinable tacitness of being (there). J. Econ. Geogr. 2003, 3, 75–99. [Google Scholar]
- Lagendijk, A.; Lorentzen, A. Proximity, Knowledge and Innovation in Peripheral Regions. On the Intersection between Geographical and Organizational Proximity. Eur. Plan. Stud. 2007, 15, 457–466. [Google Scholar] [CrossRef]
- Mattes, J. Dimensions of proximity and knowledge bases: Innovation between spatial and non-spatial factors. Reg. Stud. 2012, 46, 1085–1099. [Google Scholar]
- Moulaert, F.; Sekia, F. Territorial innovation models: A critical survey. Reg. Stud. 2003, 37, 289–302. [Google Scholar] [CrossRef]
- Shearmur, R. Innovations, regions and proximity: From neo-regionalism to spatial analysis. Reg. Stud. 2011, 45, 1225–1243. [Google Scholar]
- Healy, A.; Morgan, K. Spaces of innovation: Learning, proximity and the ecological turn. Reg. Stud. 2012, 46, 1041–1054. [Google Scholar] [CrossRef]
- Läpple, D.; Renwick, A.; Cullinan, J.; Thorne, F. What drives innovation in the agricultural sector? A spatial analysis of knowledge spillovers. Land Use Policy 2016, 56, 238–250. [Google Scholar]
- Labianca, M. From technological to social innovation: Objectives, actors, and projects of the European rural development program (2007–2013) in the Puglia region. Norois 2016, 241, 49–65. [Google Scholar]
- Boschma, R. Proximity and Innovation: A Critical Assessment. Reg. Stud. 2005, 39, 61–74. [Google Scholar] [CrossRef]
- Cloutier, J. Qu’est-ce que l’innovation sociale? In Cahier du CRISES. Études Théoriques; no ET0314; 2003. Available online: http://crises.uqam.ca/upload/files/publications/etudes-theoriques/CRISES_ET0314.pdf (accessed on 10 December 2022).
- Grillotti Di Giacomo, M.G. Atlante Tematico Dell’Agricoltura Italiana; Società Geografica Italiana: Roma, Italy, 2000. [Google Scholar]
- Istat. 7° Censimento generale dell’agricoltura: Integrazione dei primi risultati. In Aziende e SAU per Titolo di Possesso dei Terreni e regione; 2020; Available online: https://www.istat.it/it/archivio/273753 (accessed on 14 December 2022).
- Fiori, M.; Varraso, I. Puglia. In Atlante tematico Dell’Agricoltura Italiana; Grillotti Di Giacomo, M.G., Ed.; Società Geografica Italiana: Roma, Italy, 2000; pp. 345–350. [Google Scholar]
- Ballin, M.; Barcaroli, G.; Masselli, M. New LUCAS 2022 Sample and Subsamples Design: Criticalities and Solutions; Eurostat: Luxembourg, 2022. [Google Scholar]
- EC—European Commission. Directorate-General for Agriculture. From Land Cover to Landscape Diversity in the European Union; European Commission: Luxembourg, 2000. [Google Scholar]
- Eurostat. Towards a Harmonised Methodology for Statistical Indicators—Part 1: Indicator Typologies and Terminologies; Eurostat: Luxembourg, 2014. [Google Scholar]
- Eurostat. Towards a Harmonised Methodology for Statistical Indicators—Part 3: Relevance for Policy Making; Eurostat: Luxembourg, 2014. [Google Scholar]
- ESPON. INTERCO—Indicators of Territorial Cohesion. 2012. Available online: https://www.espon.eu/programme/projects/espon-2013/scientific-platform/interco-indicators-territorialcohesion (accessed on 25 November 2022).
- ESPON. SIESTA—Spatial Indicators for a Europe 2020 Strategy Territorial Analysis. 2012. Available online: https://www.espon.eu/programme/projects/espon-2013/applied-research/siesta-spatial-indicatorseurope-2020-strategy (accessed on 25 November 2022).
- Prezioso, M. (Ed.) Territorial Impact Assessment of National and Regional Territorial Cohesion in Italy. Place Evidence and Policy Orientations towards European Green Deal; Pàtron: Bologna, Italy, 2020. [Google Scholar]
- Demšar, U.; Harris, P.; Brunsdon, C.; Stewart Fotheringham, A.; McLoone, S. Principal Component Analysis on Spatial Data: An Overview. Ann. Assoc. Am. Geogr. 2013, 103, 106–128. [Google Scholar] [CrossRef]
- Harris, P.; Brunsdon, C.; Charlton, M. Geographically weighted principal components analysis. Int. J. Geogr. Inf. Sci. 2011, 25, 1717–1736. [Google Scholar] [CrossRef]
- Istat. Le Misure della Vulnerabilità: Un’applicazione a Diversi Ambiti Territoriali; Istat: Roma, Italy, 2020. [Google Scholar]
- Wu, X.; Cheng, C.; Zurita-Milla, R.; Song, C. An overview of clustering methods for geo-referenced time series: From one-way clustering to co-and tri-clustering. Int. J. Geogr. Inf. Sci. 2020, 34, 1822–1848. [Google Scholar] [CrossRef]
- Liu, L.; Peng, Z.; Wu, H.; Jiao, H.; Yu, Y.; Zhao, J. Fast Identification of Urban Sprawl Based on K-Means Clustering with Population Density and Local Spatial Entropy. Sustainability 2018, 10, 2683. [Google Scholar]
- Gorsevski, P.V.; Jankowski, P.; Gessler, P.E. Spatial Prediction of Landslide Hazard Using Fuzzy k-means and Dempster-Shafer Theory. Trans. GIS 2005, 9, 455–474. [Google Scholar]
- Regione Puglia, Piano Paesaggistico Territoriale Regionale (PPTRR). Bollettino Ufficiale Della Regione Puglia; n. 40; PPTRR: Regione Puglia, 2015. [Google Scholar]
- Agenzia per la Coesione Territoriale—Strategia Nazionale Aree Interne. In Aggiornamento 2020 della Mappa delle Aree Interne. NUVAP—Nota Tecnica; 2022; Available online: https://politichecoesione.governo.it/it/strategie-tematiche-e-territoriali/strategie-territoriali/strategia-nazionale-aree-interne-snai (accessed on 25 November 2022).


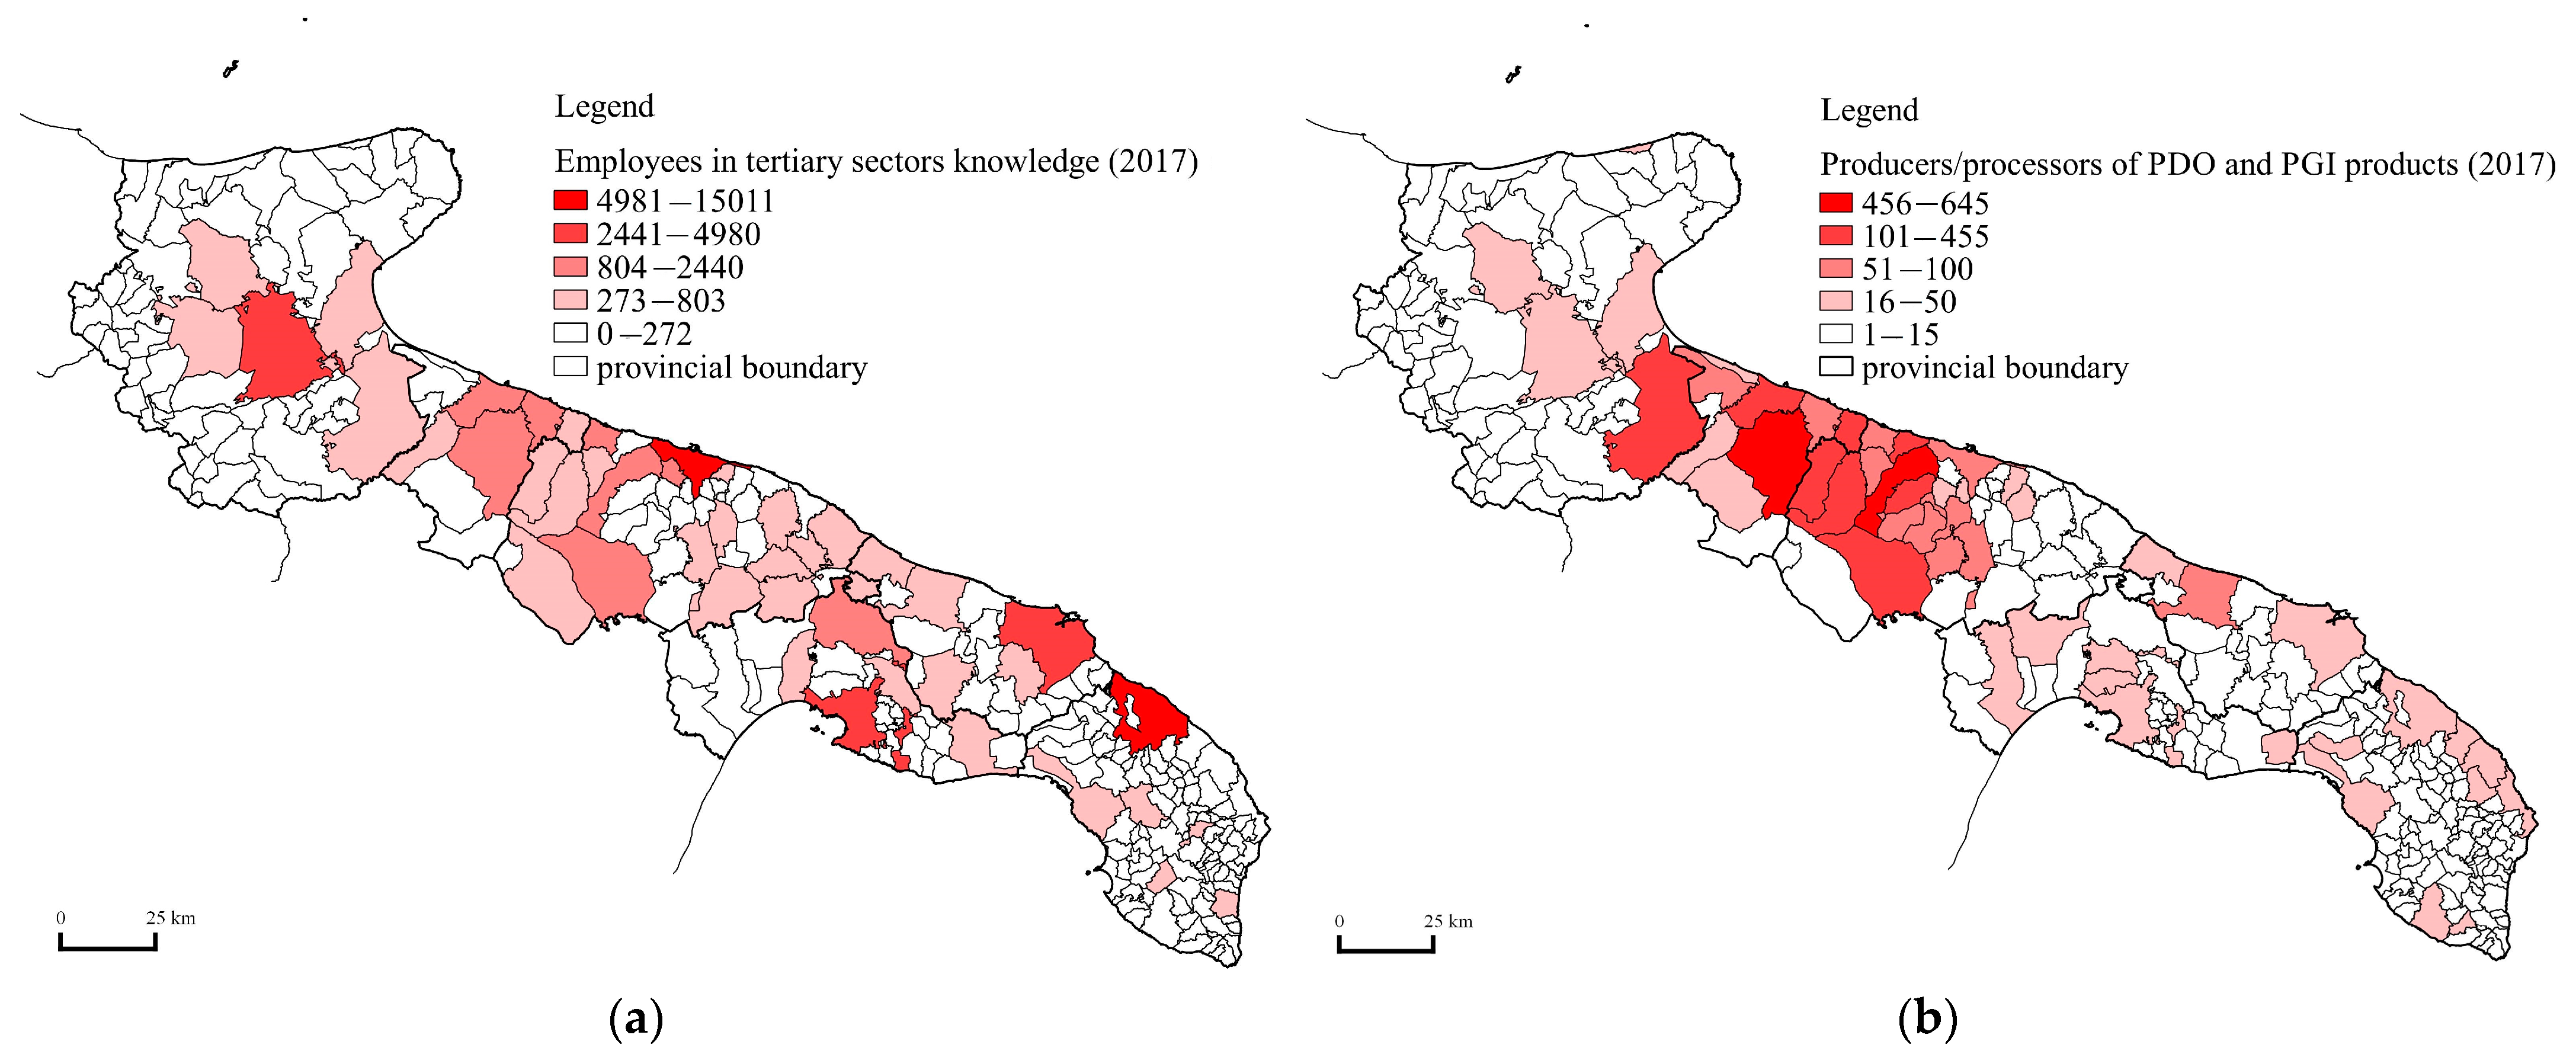
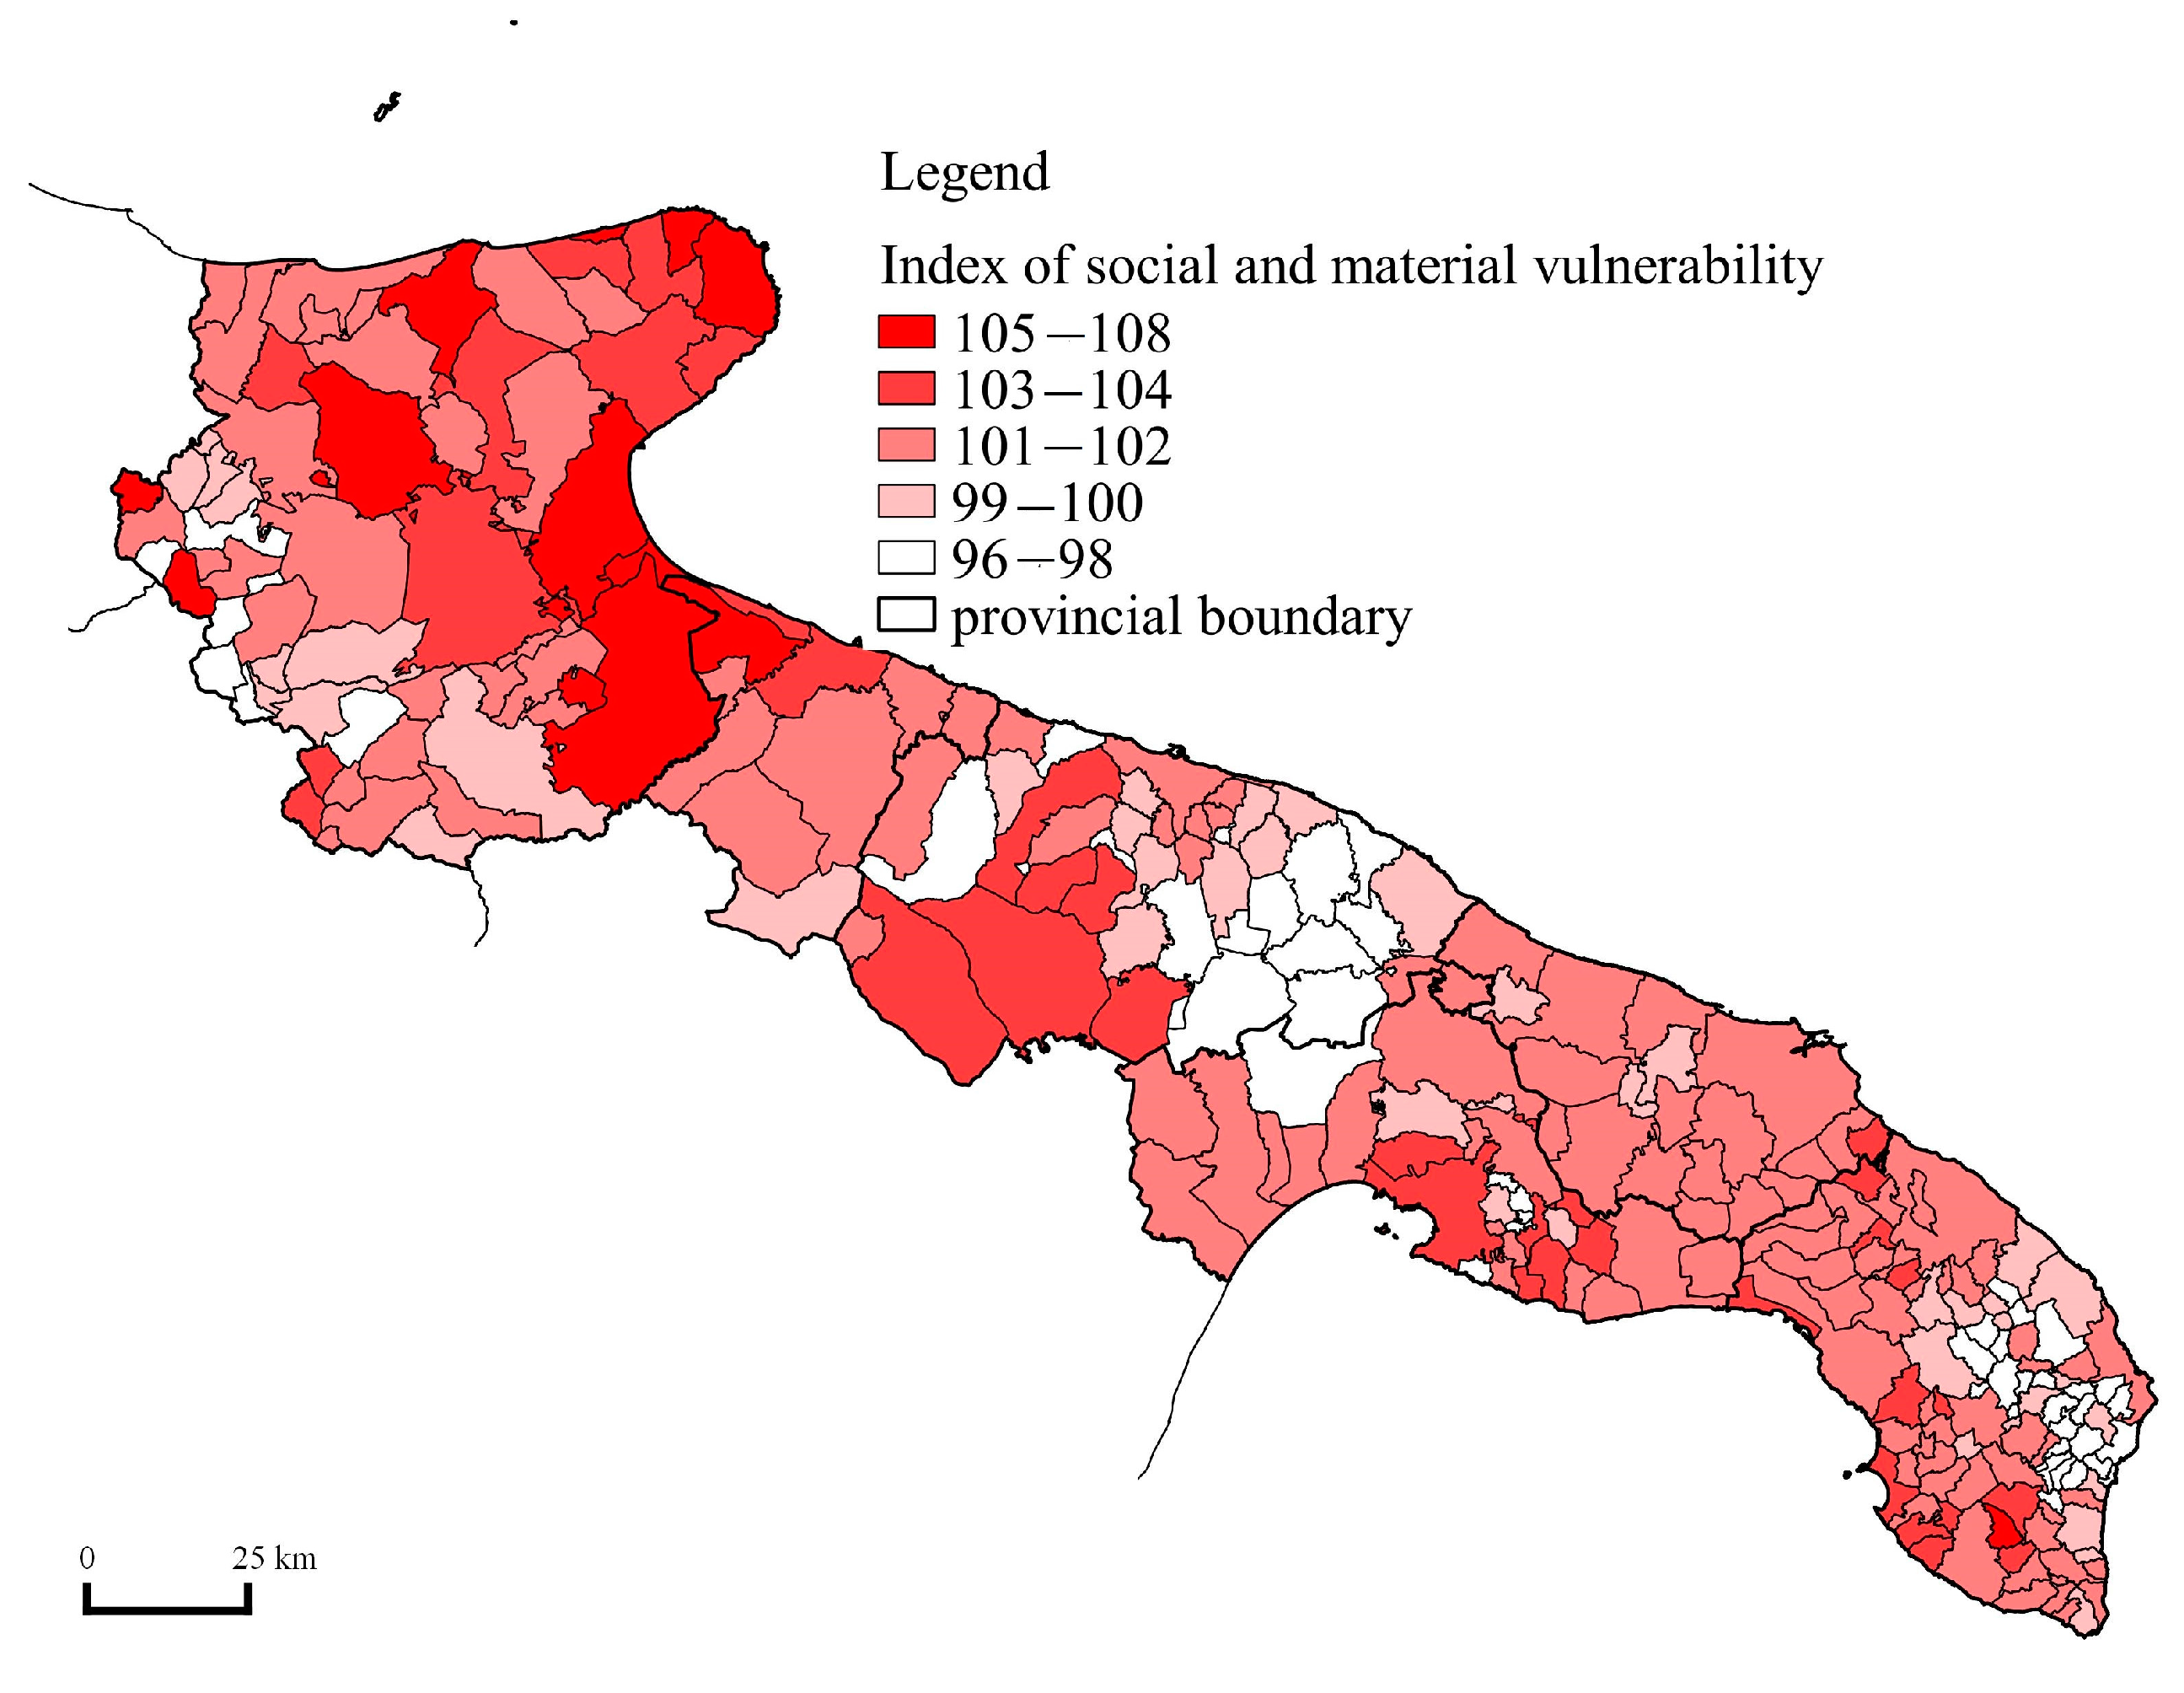
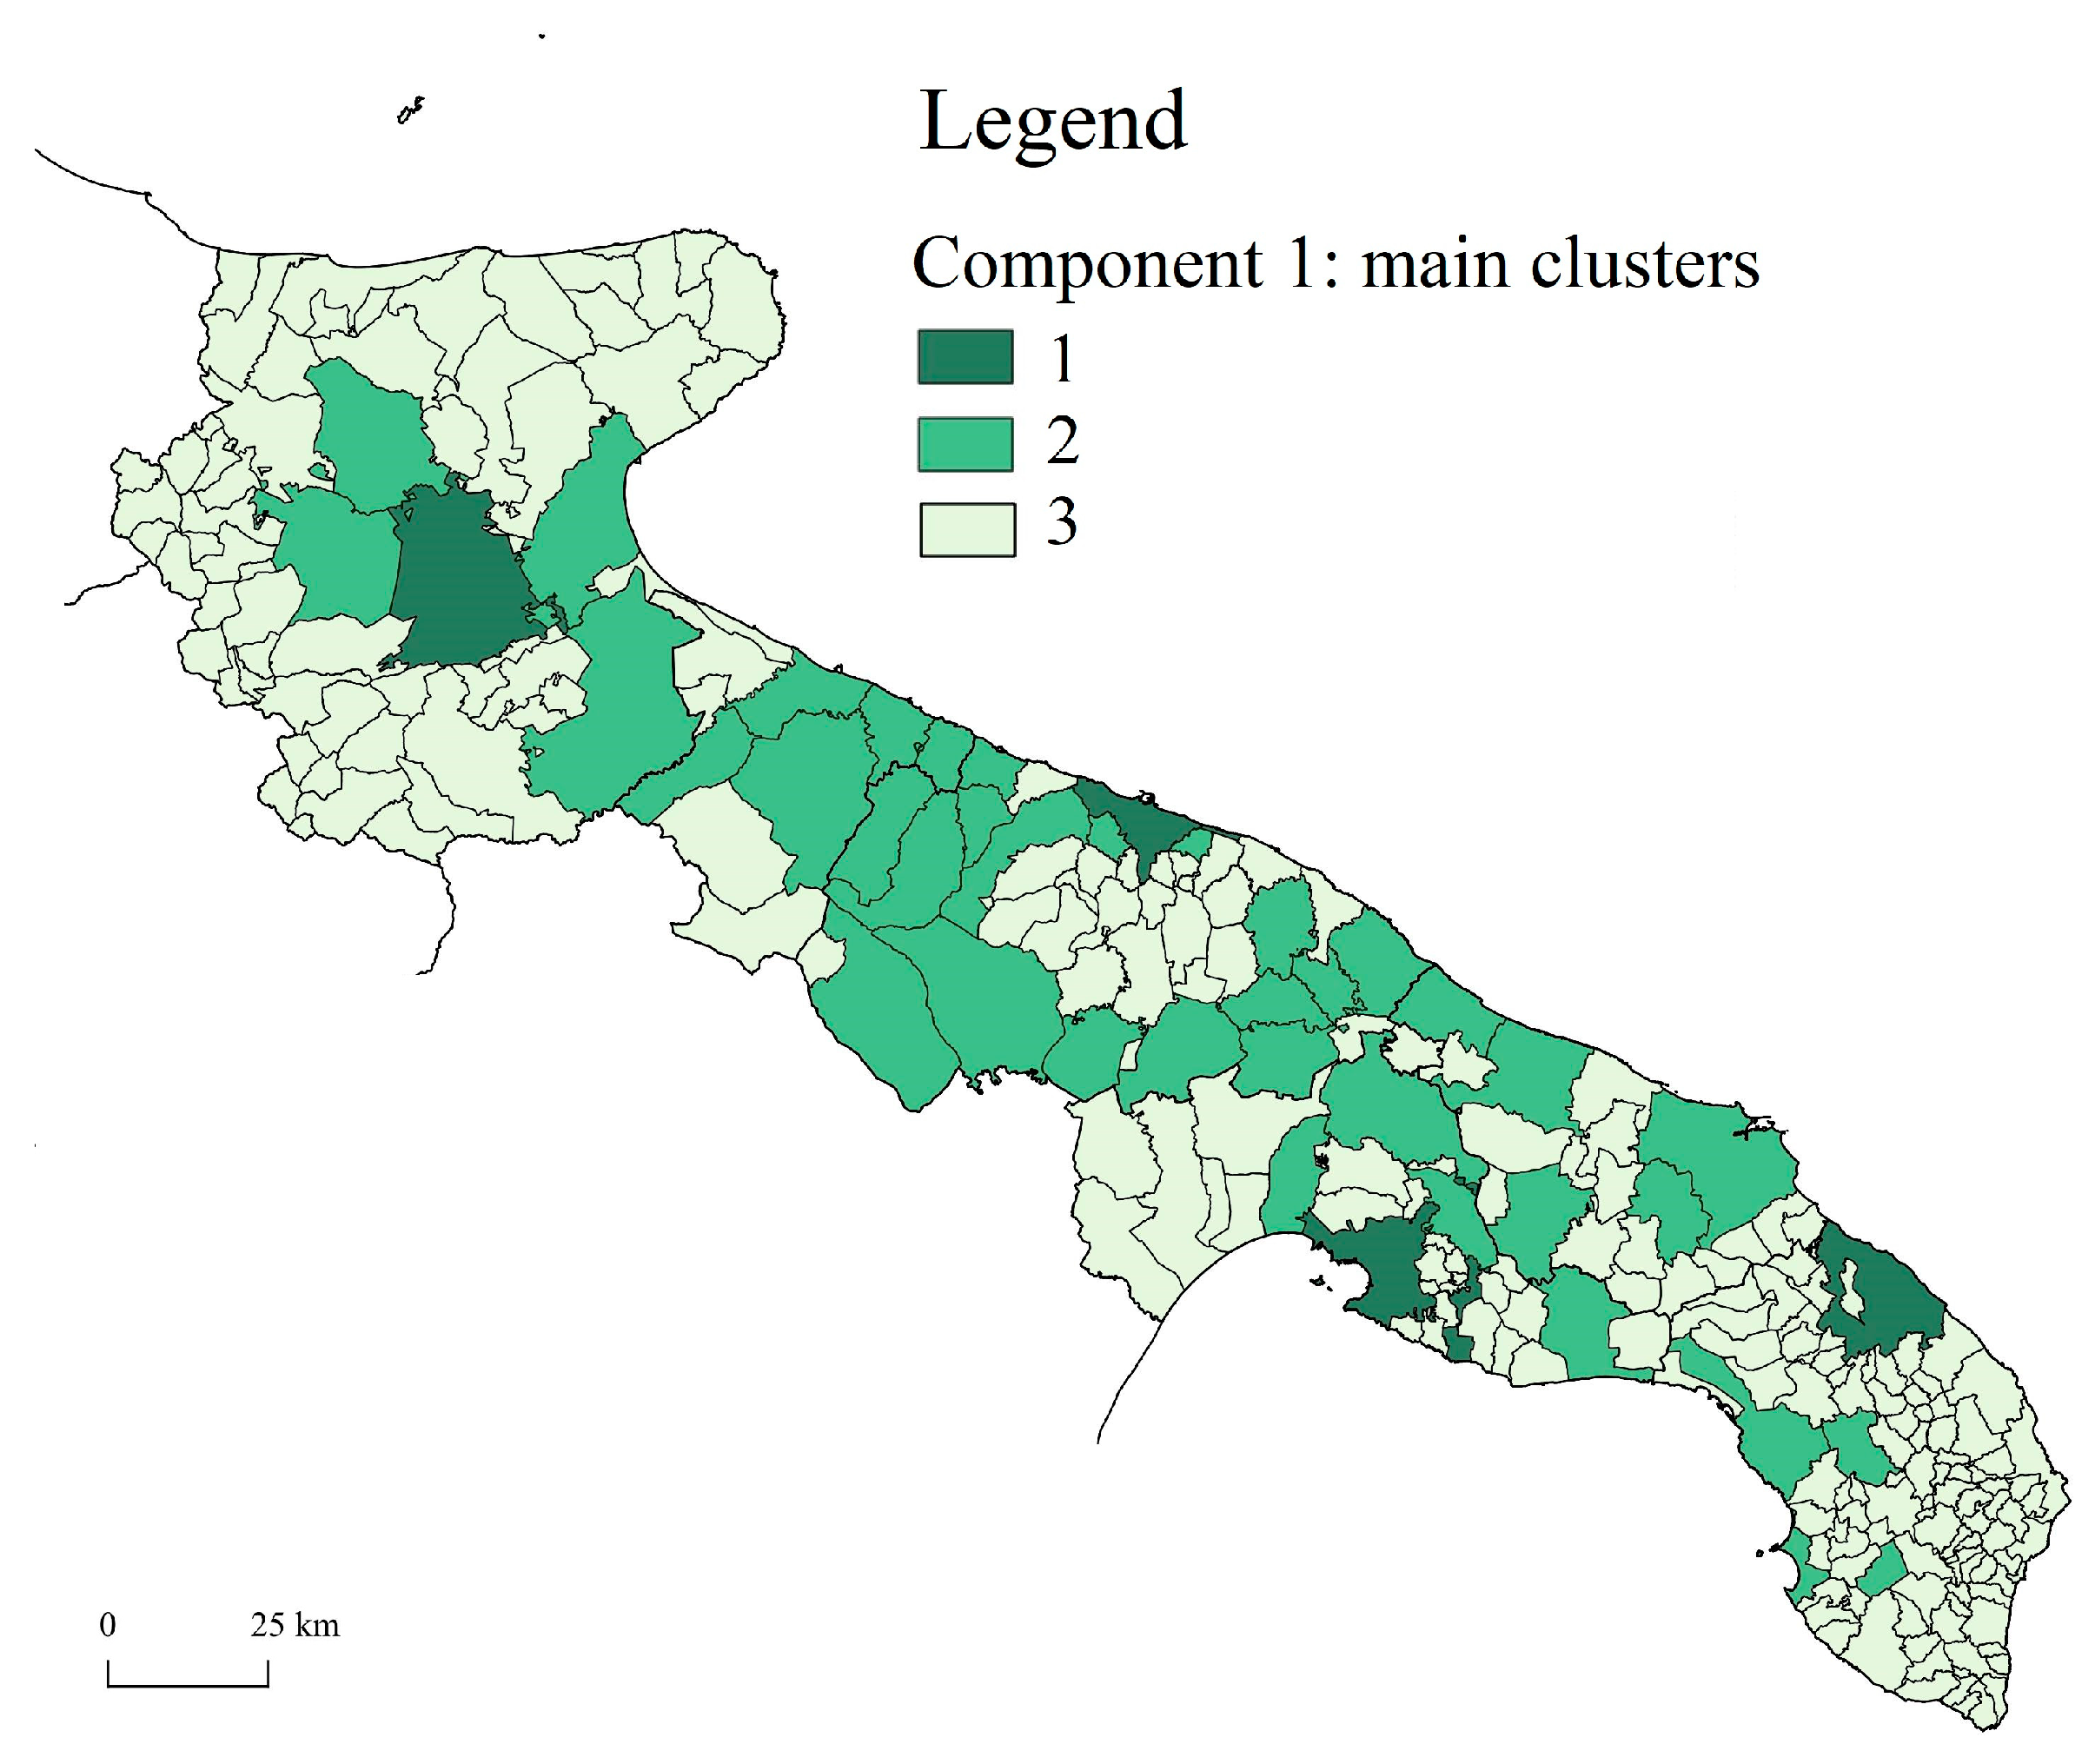
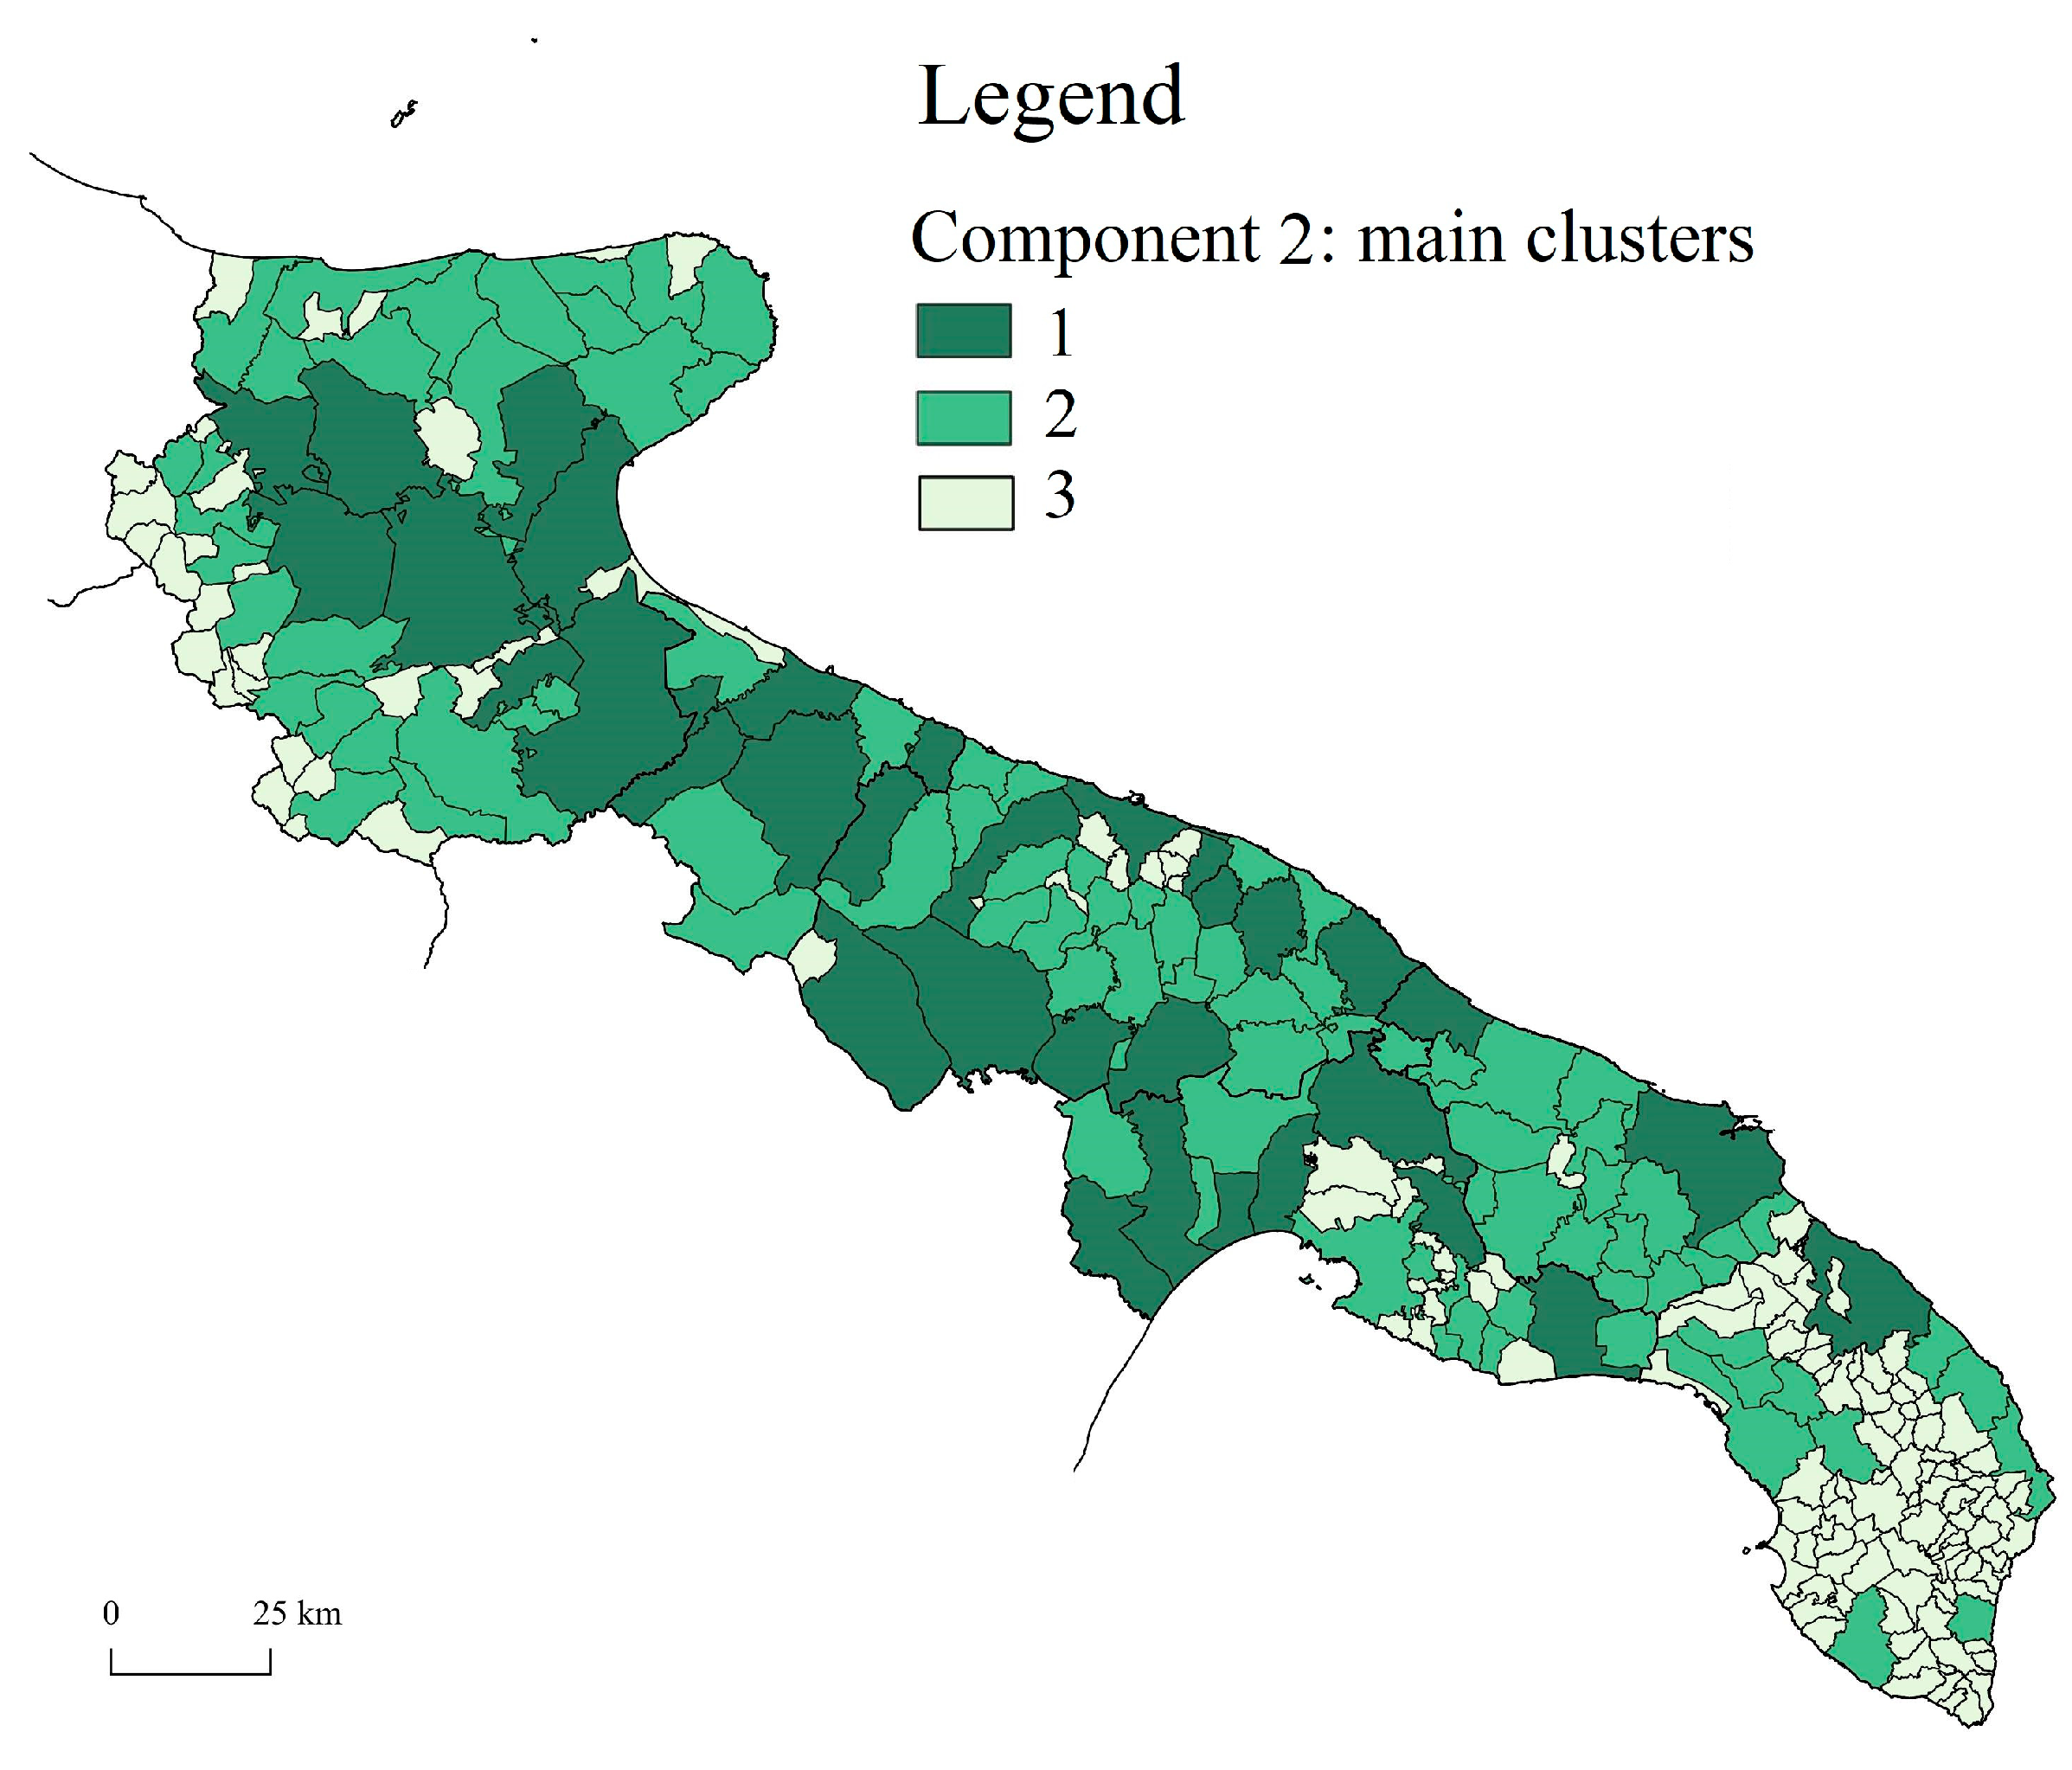
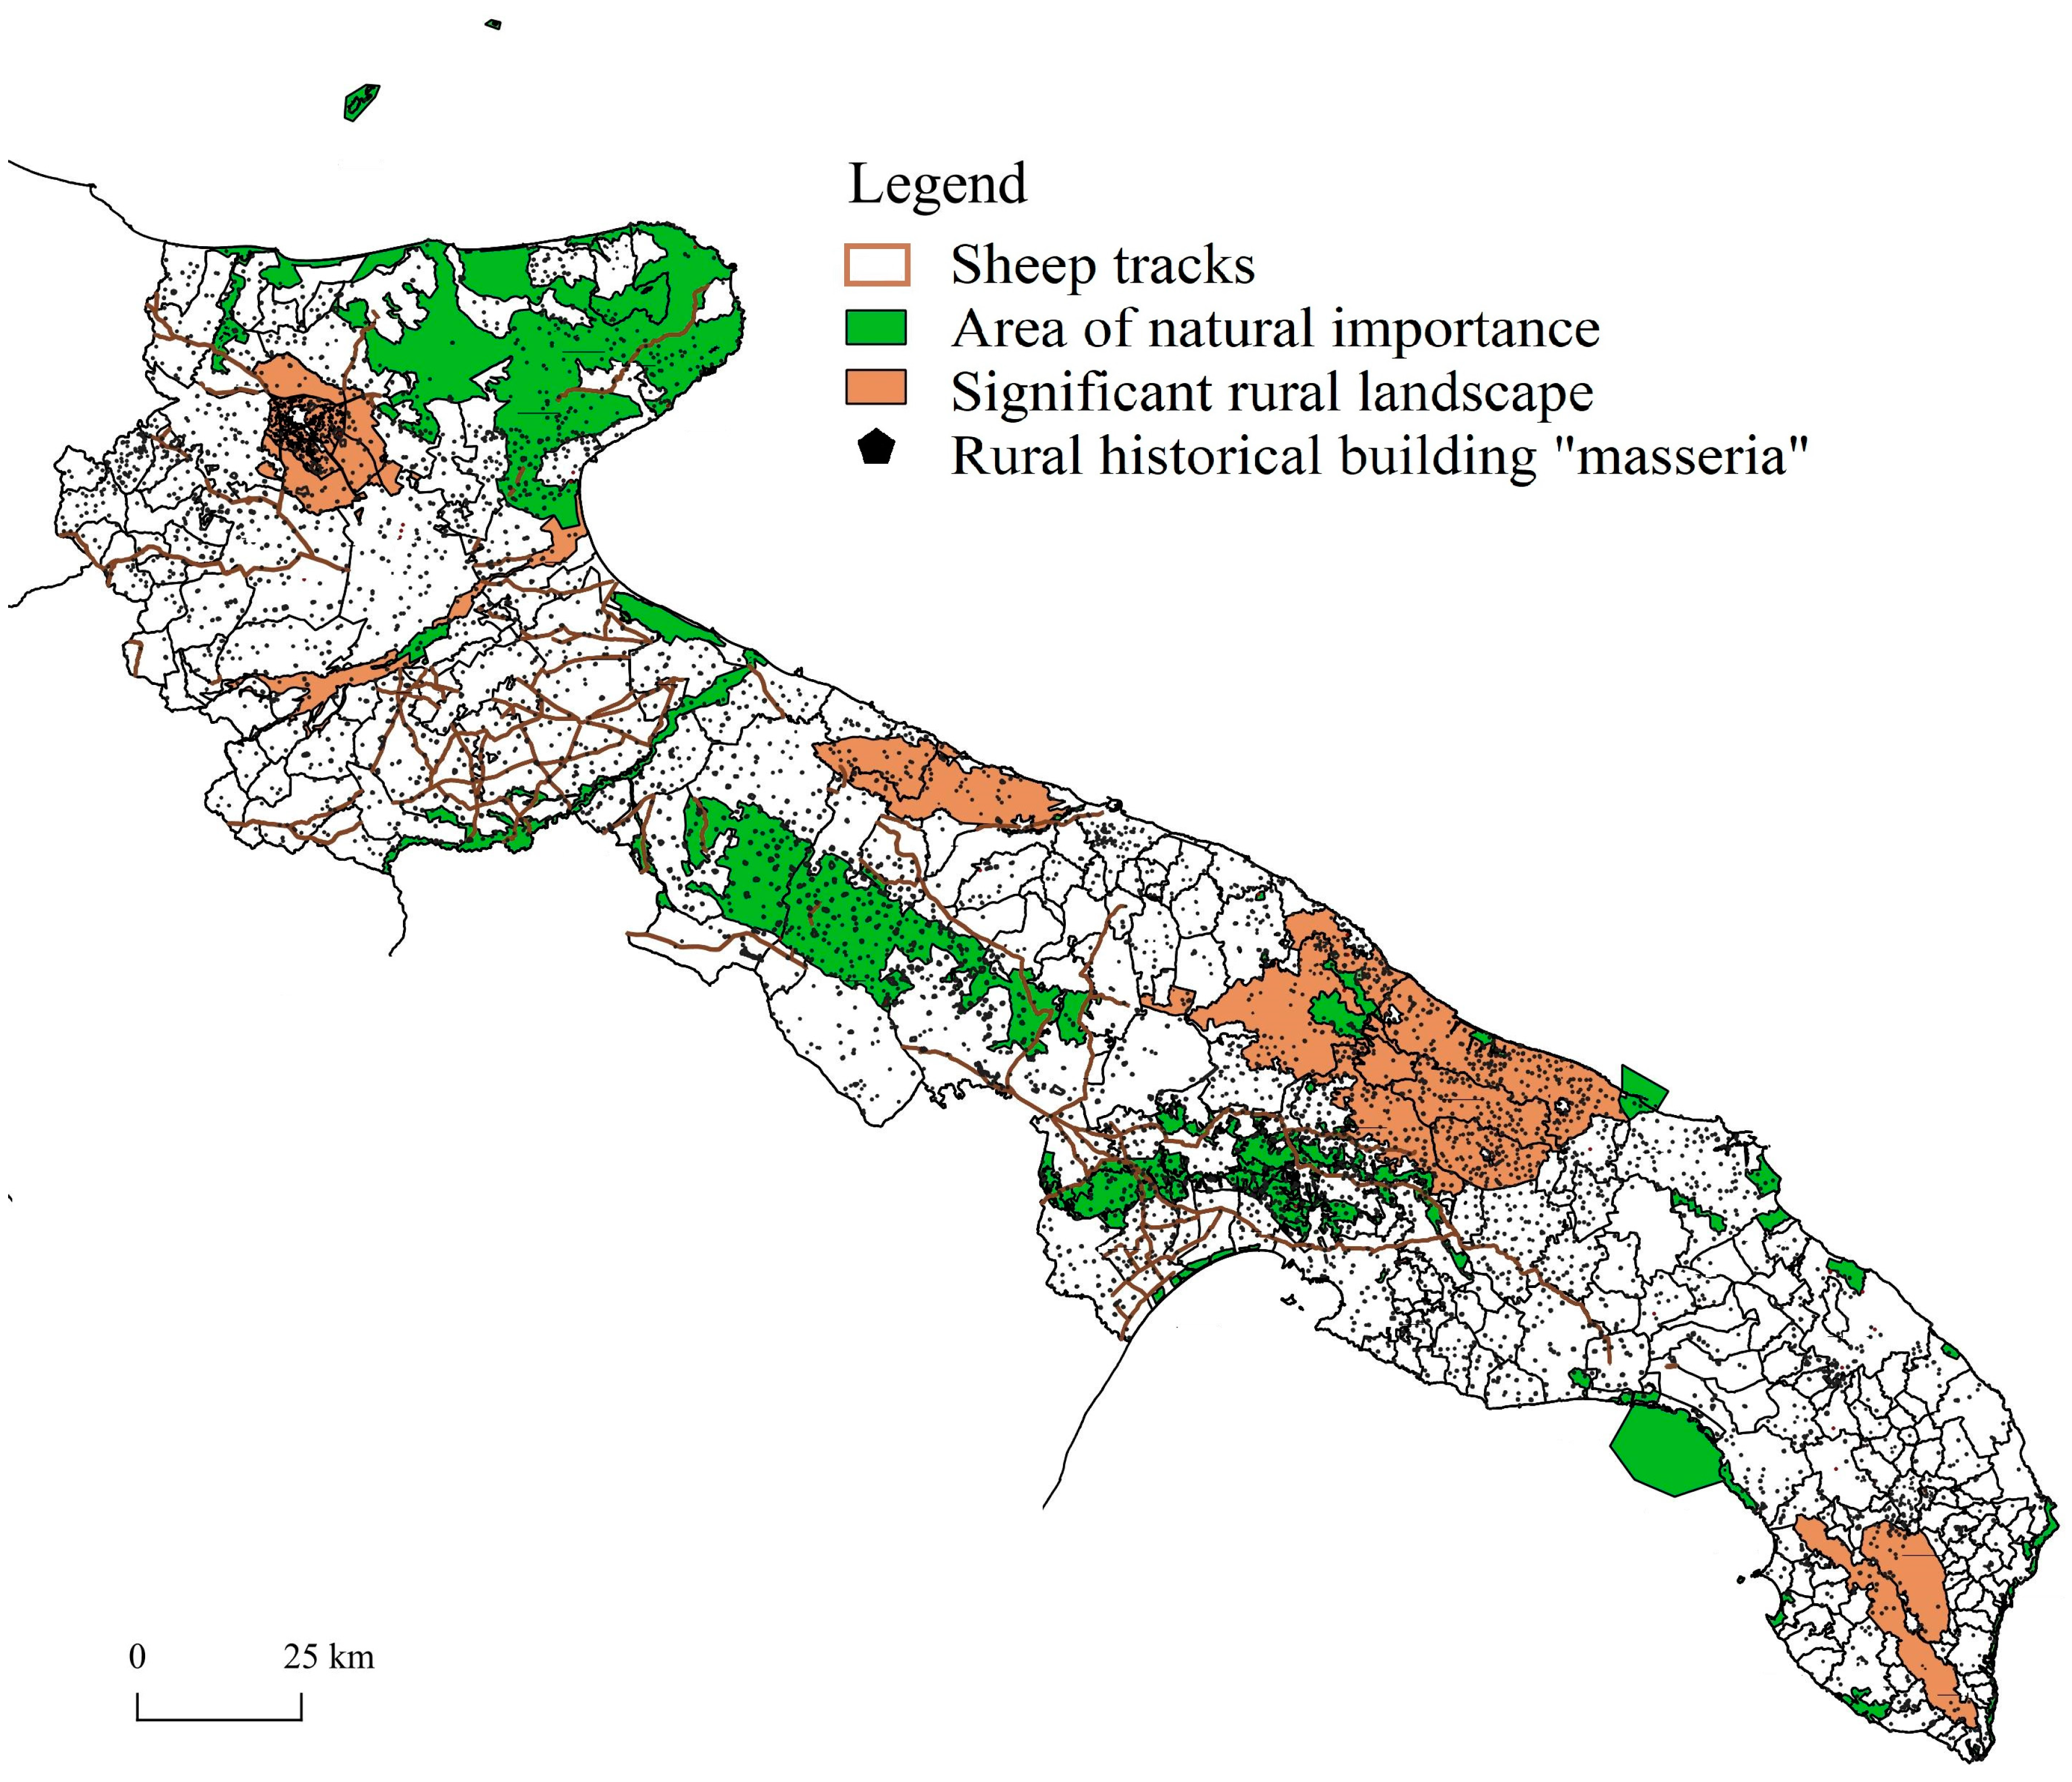
Disclaimer/Publisher’s Note: The statements, opinions and data contained in all publications are solely those of the individual author(s) and contributor(s) and not of MDPI and/or the editor(s). MDPI and/or the editor(s) disclaim responsibility for any injury to people or property resulting from any ideas, methods, instructions or products referred to in the content. |
© 2023 by the author. Licensee MDPI, Basel, Switzerland. This article is an open access article distributed under the terms and conditions of the Creative Commons Attribution (CC BY) license (https://creativecommons.org/licenses/by/4.0/).