Article

Wireless Communication System Performance in M2M Nakagami-m Fading Channel

1
Academy of Technical and Art Applied Studies, School of Electrical and Computer Engineering, Vojvode Stepe 283, 11010 Belgrade, Serbia
2
Faculty of Electronic Engineering, University of Niš, Aleksandra Medvedeva 14, 18106 Niš, Serbia
3
Faculty of Technical Sciences, University of Priština in Kosovska Mitrovica, Knjaza Miloša 7, 38220 Kosovska Mitrovica, Serbia
4
Faculty of Business and Law, MB University, Teodora Drajzera 27, 11111 Belgrade, Serbia
5
Faculty of Sciences and Mathematics, University of Priština in Kosovska Mitrovica, Lole Ribara 29, 38220 Kosovska Mitrovica, Serbia
*
Author to whom correspondence should be addressed.
Sustainability 2023, 15(4), 3211; https://doi.org/10.3390/su15043211
Submission received: 22 December 2022 / Revised: 30 January 2023 / Accepted: 1 February 2023 / Published: 9 February 2023

Abstract

:
In this paper, we investigate a wireless mobile communication system with a cooperative network operating over a mobile-to-mobile (M2M) fading channel in the presence of co-channel interference. Since there is no direct line of sight between the source (S) and the destination (D) due to various obstacles, the signal transmission takes place by using a relay (R). We modeled and represented the desired signal and co-channel interference by using the Nakagami-m fading distribution from the source (S) to the relay (R), as well as from the relay (R) to the destination (D). As the popularity of M2M communication has increased in 5G cellular networks, the performance analysis of the proposed system is of great importance. We derived closed-form expressions for the probability density function (PDF) and cumulative distribution function (CDF) of the signal-to-interference ratio (SIR) at the input of the destination station. Based on the cumulative distribution function (CDF), we also evaluated the outage probability (Pout) of the proposed communication system. In addition, we derived a closed-form approximate expression for the level crossing rate (LCR) by using the Laplace approximation formula for the three-fold integral. Validity of the derived theoretical results we approved by Monte Carlo simulations.

1. Introduction

Modern mobile communication systems and wireless systems, in general, have to deliver a very high amount of data to users. An efficient way to accomplish this task in an impaired channel, with fading, interference, and noise, is to use cooperation between the users [1,2]. Mobile-to-mobile (M2M) communication has an implementation in different applications, such as ad hoc wireless networks, intelligent transportation systems, and relay-based cellular networks [3]. The popularity of M2M communications has increased in the 5G cellular networks [4]. In cooperative networks, the source and the destination may communicate directly and/or via one or multiple relays. A relay may amplify and forward (AF) or fully decode and forward (DF) the received information. However, AF relays, due to their simplicity and energy consumption, have a higher practical importance. The high number of users causing co-channel interference may significantly influence the system’s performance. In such a case, we can neglect the thermal noise, and the environment is called interference-limited.
Cooperative relay systems have a wide range of applications. With the increase in end users’ demands for reliable and fast information transfer, the use of these systems has also increased. In rural areas where there are not many obstacles, AF and DF relay systems serve to transmit large amounts of data using free space optics (FSO) communications. FSO communications provide a higher data rate than traditional radio frequency (RF) communications [5]. In addition, there is a frequent application of hybrid cooperation relay systems. These systems use FSO communications to transmit information from the source to the relay and RF communications to transfer data from the relay to the destination [6,7,8]. In contrast, in urban areas where we have many users, the signal encounters many obstacles, so we use RF communications to transmit information from the source to the relay and from the relay to the destination. Although RF systems cannot match FSO systems in terms of many performances, they still have an advantage in such environments [9].
Due to its wide application in practical cases, the performance analysis of these systems is of exceptional importance for the further development of modern communications. The outage probability, or the probability that the reception quality is below a certain threshold, is a significant performance measure of a communication system. The authors of [10] analyze dual-hop AF and DF relaying in a Rayleigh fading channel with multiple interferences at the relay and destination. However, the Nakagami-m fading channel is more general, and its great accordance with the experimental data is the main reason for its usage in literature for the analysis of wireless cooperative communication systems [3,11,12,13,14,15,16,17,18]. In [11,12], the authors consider dual-hop AF relaying in the Nakagami-m fading environment without interference. The authors of [3,13] consider dual-hop interference-limited relaying with multiple interferers at the relay, with AF [3] and DF [13] relays in the Nakagami-m channel, and give the approximate expressions for the outage probability. In [14], the authors analyze a lower bound on the outage probability for a universal environment, where multiple interferers are present at the source and destination, and in [16], the authors consider the lower bound on the outage probability of AF mobile-to-mobile (M2M) relaying system in Nakagami fading channel and relay selection. The authors of [11,18] analyze the outage probability of a dual-hop DF cooperative system in the Nakagami-m channel with different scenarios. Furthermore, this paper brings a conditional relaying scheme where a relay may help source-destination communication if a specified condition is verified. In contrast, a full-duplex DF relaying is the topic of [17] analysis of several interference and self-interference scenarios.
Aside from the outage probability, the level crossing rate (LCR) is another performance measure of a wireless communication system. We define LCR as the average number of level crossings in a positive or negative direction within the interval of one second [19]. The LCR of the non-cooperative interference-limited Rice/Nakagami fading channel is considered in [20] for single-channel reception and in [21] for the case of diversity reception. LCR of a dual-hop AF relaying system, in the absence of interference, for a double Gaussian channel, is analyzed in [22], and for a twofold Nakagami-m fading channel with the average fade duration, in [23]. In addition to the LCR, the probability density function (PDF) and the average fade duration are obtained in [24] from other dual-hop AF Rician fading channel. The interference was not present, and the paper analyzes mobile-to-mobile (M2M), mobile-to-fixed, and fixed-to-mobile channels. In [21,25], the authors consider the LCR of a multi-hop DF relaying with the multiple interferences at relays in Rayleigh/Rician/Nakagami-m and Nakagami-Hoyt fading channels, both noise and interference-limited.
The authors of [26,27,28,29,30,31] present first and second-order statistics for Weibull, Rayleigh, and Double Nakagami distributions in cooperative relay systems. In [26], the authors consider a mobile-to-mobile communication system with a relay. They use the Weibull short-term fading model to describe the random variable process in channels and analyze the system performance. For Weibull short-term fading, the authors calculated the probability density function, cumulative density function, level crossing rate, and average fade duration. Authors of [27] consider the product of two Rayleigh random variables and a Nakagami-m random variable. In that research, they did not consider cooperative systems with relay, but results for level crossing rate can implement in similar mobile-to-mobile systems. The research presented in [28] provides results for a communication system in which data transmission performs via relays. The obtained results are interesting because the data transmission system uses an RF link (Nakagami-m distribution) to transmit data from the source to the relay and an FSO link (Nakagami-m squared distribution) to transmit data from the relay to the destination. The analysis of statistical processes described by Rayleigh, Nakagami-m, Weibull, and α-μ distributions in multi-hop wireless communication systems is presented in [29]. What the closed-form analytical expressions for the PDF and CDF have in common is their representation through the Meijer function. Current research and analysis of communication systems often rely on Meijer functions. The solutions presented through these functions make numerical calculations and simulation models easy. Similar to [26], the authors in [30] present an analysis of system performance using the Rayleigh distribution. This paper also analyzes the mobile-to-mobile cooperative system’s PDF, CDF, and LCR.
In [32,33,34,35], the authors present results for PDF and CDF for three Nakagami-m distributions, while [20,21,23,27,35,36] show average fade duration (AFD). Furthermore, the authors of [32] and [35] consider a more complicated case for mobile-to-mobile cooperative communication systems. In their work, they analyze the performance of the triple Nakagami-m random process. In addition, through presented graphical results, the authors explain implementation in wireless communication systems. Although the results presented in [32] and [35] represent a more complicated case from a theoretical point of view, the lack of closed-form analytical expressions for the PDF, CDF, outage probability, and average fade duration makes the analysis of this system cumbersome. In addition to mobile-to-mobile cooperative communication systems that use relays for data transmission, the use of various diversity techniques is also high. The authors of [33] provide the implementation of the diversity technique for the Nakagami-m random variables process. Performance analysis of communication systems has an important role. Insight into system performance can tell us a lot about the properties and behavior of those systems. In such cases, it is necessary to confirm the validity of the obtained results through the simulation process. In [34], the authors propose a sum of a sinusoid as a Nakagami-m fading simulator.
In this paper, we consider a wireless communication system operating over M2M interference-limited Nakagami-m multi-path fading channel in the presence of Nakagami-m co-channel interference. We evaluate expressions for the probability density function (PDF), the cumulative distribution function (CDF), and the level crossing rate (LCR) of the output signal-to-interference ratio (SIR). This paper gives the exact closed-form expressions for PDF and CDF and a closed-form approximate expression for LCR. We confirm all results by Monte-Carlo simulation.
The authors believe that the consideration of this system and the results they presented deserves attention, considering its wide range of implementation in modern communication systems.
For example, although the system seems simple at first glance, that is its advantage. A drone wireless relay system for disaster recovery and locating persons trapped under debris is just one of the possible implementations. We can also successfully implement such system in physical layer security to avoid eavesdropping attacks. By placing a relay on the drone, we can avoid eavesdropping in cases where the location of the eavesdropper is between the source and the destination. Finally, we can implement such system in systems with the adaptive transmission. In cases where we use algorithms with optimization of transmitter power or data rate, this system can be used as a channel state for information or as a channel for prediction.
The paper consists of five sections: Introduction, System model, Statistics of M2M Fading Channels, Numerical Results, and Conclusion. In the Introduction section, we explain the importance of cooperative relay systems and give a literature review. The System model section describes relations between the source, relay, and destination, the conditions under which the system works, and the channel model with preset assumptions. Statistics of M2M Fading Channels section provides analytical expressions in closed-form for PDF, CDF, outage probability, and LCR. The numerical Results section explains and graphically represents obtained results.

2. System Model

We will consider a dual-hop cooperative relay system shown in Figure 1. Due to various obstacles that block the signal, we do not have direct communication between the source (S) and the destination (D). To establish communication between the source (S) and destination (D), we use the AF relay (R). However, the same considerations stand for the other direction, so bi-directional communications are fully supported. As already mentioned in the Introduction, the communication system is dominantly impaired by interference due to a large number of users. Therefore, thermal noise may be neglected, and the environment is interference-limited. The interference is present in both sections, from source (S) to relay (R) and from relay (R) to destination (D). Since source–relay (S-R) and relay–destination (R-D) communications are performed in different time slots, we may consider them independent. The desired signal and the interference fading channels are also considered to be uncorrelated.
For the system model we are considering, interference degrades signal quality significantly more than thermal noise. In such case, we will observe the signal quality at the destination node through the signal-to-interference ratio (SIR). In this system model, random variables that describe desired signal and interference envelopes in both sections (S-R, R-D) of the communication system have Nakagami-m distribution. Nakagami-m is a general distribution that reduces to Rayleigh distribution for m = 1 and hyper-Rayleigh or worse-than-Rayleigh for m = 0.5. For m → ∞, Nakagami-m fading reduces to the fading-free channel. We denote random variables that describe the desired signal with x1 and x2 and interferences with y1 and y2 for the first and the second section, respectively. Envelopes in the first and second sections are independent non-identically distributed Nakagami-m random variables with the following probability density functions [32]:
p x i ( x i ) = 2 Γ ( m ) ( m x i Ω x i ) m x i x i 2 m x i 1 exp ( m x i Ω x i x i 2 ) , x i 0 , i = 1 , 2 p y i ( y i ) = 2 Γ ( m ) ( m y i Ω y i ) m y i y i 2 m y i 1 exp ( m y i Ω y i y i 2 ) , y i 0 , i = 1 , 2
where mx1, mx2, and my1, my2 are the desired signal and the interference fading severity parameters, respectively. With Ωx1 and Ωx2, we denoted the average signal power of the desired signal, and with Ωy1 and Ωy2, we denoted the average signal power of interference. In the following analysis, we have made assumption that the fading severity parameter is an integer. This is a quite common assumption in the literature because of the severe difficulties in the mathematical analysis of these channels. However, if needed, results, in this case, may be easily obtained by numerical integration.

3. Statistics of M2M Fading Channels

3.1. PDF of the Output SIR

We can present the signal-to-interference ratio at the destination node as z = z 1 z 2 , where z1 and z2 are signal-to-interference ratios in the first and the second section, respectively, defined as [26]:
z i = x i y i , i = 1 , 2
To find the PDF of z, pz(z), we first derive the expressions for the PDFs of z1 and z2, pz1(z1), and pz2(z2). Since i = 1,2 is the ratio of the random variables xi and yi, its PDF is defined as [30]:
p z i ( z i ) = 0 d y i y i p x i ( y i z i ) p y i ( y i ) , i = 1 , 2
After solving the integral in (3), as explained in Appendix A, we come to:
p z i ( z i ) = 2 Γ ( m x i + m y i ) Γ ( m x i ) Γ ( m y i ) ( Ω y i m x i ) m x i ( Ω x i m y i ) m y i z i 2 m x i 1 ( Ω x i m y i + m x i Ω y i z i 2 ) m x i + m y i
Since z = z 1 z 2 we have [37]:
p z ( z ) = 0 d z 2 1 z 2 p z 1 ( z / z 2 ) p z 2 ( z 2 )
After substituting values for pz1(z1) and pz2(z2) in (5) and simplifying the obtained expression, we find:
p z ( z ) = 4 B ( m x 1 , m y 1 ) B ( m x 2 , m y 2 ) ( Ω x 1 m y 1 Ω y 1 m x 1 ) m y 1 ( Ω y 2 m x 2 Ω x 2 m y 2 ) m x 2 z 1 2 m y 1 × 0 d z 2 z 2 2 m x 2 + 2 m y 1 1 ( 1 + Ω x 1 m y 1 m x 1 Ω y 1 z 2 z 2 2 ) m x 1 + m y 1 ( 1 + m x 2 Ω y 2 Ω x 2 m y 2 z 2 2 ) m x 2 + m y 2
Using Equation (3.259.3) from [38]:
0 x λ 1 ( 1 + α x p ) μ ( 1 + β x p ) ν d x = 1 p α λ / p B ( λ p , μ + ν λ p ) F 1 2 ( ν , λ p ; μ + ν ; 1 β α )
where B ( a , b ) is the beta function and F 1 2 ( a , b ; c ; d ) is the hypergeometric function, the final expression for PDF is
p z ( z ) = 2 B ( m x 2 + m y 1 , m x 1 + m y 2 ) B ( m x 1 , m y 1 ) B ( m x 2 , m y 2 ) ( Ω y 1 Ω y 2 Ω x 1 Ω x 2 m x 1 m x 2 m y 1 m y 2 ) m x 2 z 2 m x 2 1 × F 1 2 ( m x 2 + m y 2 , m x 2 + m y 1 ; m x 1 + m y 1 + m x 2 + m y 2 ; 1 z 2 Ω y 1 Ω y 2 Ω x 1 Ω x 2 m x 1 m x 2 m y 1 m y 2 )
Parameters from Equations (6) and (7) have the following relation:
λ = 2 m x 2 + 2 m y 1 α = Ω x 1 m y 1 m x 1 Ω y 1 z 2 β = m x 2 Ω y 2 Ω x 2 m y 2 μ = m x 1 + m y 1 ν = m x 2 + m y 2 p = 2

3.2. CDF and Outage Probability of the Output SIR

The cumulative distribution function of z is defined as [26]:
F z ( z ) = 0 z d t p z ( t )
By inserting Equation (6) into (9) we obtain:
F z ( z ) = 4 ( Ω y 1 m x 1 ) m x 1 ( Ω x 1 m y 1 ) m y 1 ( Ω y 2 m x 2 ) m x 2 ( Ω x 2 m y 2 ) m y 2 B ( m x 1 , m y 1 ) B ( m x 2 , m y 2 ) × 0 z 0 z 2 2 m x 2 + 2 m y 1 1 ( Ω x 2 m y 2 + Ω y 2 m x 2 z 2 2 ) m x 2 + m y 2 t 2 m x 1 1 ( Ω x 1 m y 1 z 2 2 + Ω y 1 m x 1 t 2 ) m x 1 + m y 1 d z 2 d t
The double integral in (10) may be first integrated over t and then over z2 because the integrand satisfies the condition of Fubini’s theorem [39], i.e., the absolute value of the integrand is < ∞ within the limits of the integration. Therefore,
F z ( z ) = 4 ( Ω y 1 m x 1 ) m x 1 ( Ω x 1 m y 1 ) m y 1 ( Ω y 2 m x 2 ) m x 2 ( Ω x 2 m y 2 ) m y 2 B ( m x 1 , m y 1 ) B ( m x 2 , m y 2 ) × 0 d z 2 z 2 2 m x 2 + 2 m y 1 1 ( Ω x 2 m y 2 + Ω y 2 m x 2 z 2 2 ) m x 2 + m y 2 0 z d t t 2 m x 1 1 ( Ω x 1 m y 1 z 2 2 + Ω y 1 m x 1 t 2 ) m x 1 + m y 1
Let us define:
J = 0 z d t t 2 m x 1 1 ( Ω x 1 m y 1 z 2 2 + Ω y 1 m x 1 t 2 ) m x 1 + m y 1
After variable substitution s = Ω x 1 m y 1 z 2 2 + Ω y 1 m x 1 t 2 , Equation (12) becomes:
J = 1 2 Ω y 1 m x 1 m x 1 m x 1 Ω x 1 m y 1 z 2 2 Ω x 1 m y 1 z 2 2 + Ω y 1 m x 1 z 2 d s ( s Ω x 1 m y 1 z 2 2 ) m x 1 1 s m x 1 + m y 1
Having in mind the fading parameter m is an integer, after expanding by using Equation (1.111) from [38]:
( s Ω x 1 m y 1 z 2 2 ) m x 1 1 = k = 0 m x 1 1 ( m x 1 1 k ) s m x 1 k 1 ( 1 ) k z 2 2 k Ω x 1 k m y 1 k
and changing the order of the integral and sum, the following is obtained:
J = 1 2 Ω y 1 m x 1 m x 1 m x 1 k = 0 m x 1 1 ( m x 1 1 k ) ( 1 ) k z 2 2 k Ω x 1 k m y 1 k Ω x 1 m y 1 z 2 2 Ω x 1 m y 1 z 2 2 + Ω y 1 m x 1 z 2 d s s ( m y 1 + k + 1 )
which becomes
J = 1 2 Ω y 1 m x 1 m x 1 m x 1 ( S 1 S 2 )
where
S 1 = 1 Ω x 1 m y 1 m y 1 m y 1 z 2 2 m y 1 2 1 m x 1 ( m x 1 1 ) ! ( 2 m x 1 1 ) ! ! S 2 = k = 0 m x 1 1 ( m x 1 1 k ) ( 1 ) k m y 1 + k z 2 2 k Ω x 1 k m y 1 k ( Ω x 1 m y 1 z 2 2 + Ω y 1 m x 1 z 2 ) m y 1 + k
Now, the CDF becomes
F z ( z ) = 2 ( Ω x 1 m y 1 ) m y 1 ( Ω y 2 m x 2 ) m x 2 ( Ω x 2 m y 2 ) m y 2 B ( m x 1 , m y 1 ) B ( m x 2 , m y 2 ) ( J 1 J 2 )
where
J 1 = 0 d z 2 z 2 2 m x 2 + 2 m y 1 1 ( Ω x 2 m y 2 + Ω y 2 m x 2 z 2 2 ) m x 2 + m y 2 S 1 J 2 = 0 d z 2 z 2 2 m x 2 + 2 m y 1 1 ( Ω x 2 m y 2 + Ω y 2 m x 2 z 2 2 ) m x 2 + m y 2 S 2
After several mathematical operations, J1 simplifies to
J 1 = 2 1 m x 1 ( m x 1 1 ) ! ( 2 m x 1 1 ) ! ! 1 Ω x 1 m y 1 m y 1 m y 1 1 ( Ω x 2 m y 2 ) m x 2 + m y 2 0 d z 2 z 2 2 m x 2 1 ( 1 + Ω y 2 m x 2 Ω x 2 m y 2 z 2 2 ) m x 2 + m y 2
which may be solved using Equation (3.251.11) from [38]
0 x μ 1 ( 1 + β x p ) ν d x = 1 p β μ / p B ( μ p , ν μ p )
as
J 1 = 2 m x 1 ( m x 1 1 ) ! ( 2 m x 1 1 ) ! ! B ( m x 2 , m y 2 ) Ω x 1 m y 1 m y 1 m y 1 ( Ω x 2 m y 2 ) m y 2 1 ( Ω y 2 m x 2 ) m x 2
Using Equation (3.259.3) from [38], integral J2 may be expressed as
J 2 = ( Ω y 1 m x 1 ) m x 2 ( Ω x 2 m y 2 ) m x 2 + m y 2 ( Ω x 1 m y 1 ) m x 2 + m y 1 z 2 m x 2 2 k = 0 m x 1 1 ( m x 1 1 k ) ( 1 ) k m y 1 + k B ( m x 2 + m y 1 + k , m y 2 ) × F 1 2 ( m x 2 + m y 2 , m x 2 + m y 1 + k ; m x 2 + m y 1 + m y 2 + k ; 1 z 2 Ω y 1 Ω y 2 Ω x 1 Ω x 2 m x 1 m x 2 m y 1 m y 2 )
By substituting Equations (22) and (23) in (18), after some mathematical manipulations, we obtain the expression for CDF:
F z ( z ) = B ( m x 1 , m x 1 ) B ( m x 1 , m y 1 ) 1 B ( m x 1 , m y 1 ) B ( m x 2 , m y 2 ) ( Ω y 1 Ω y 2 Ω x 1 Ω x 2 m x 1 m x 2 m y 1 m y 2 ) m x 2 × z 2 m x 2 k = 0 m x 1 1 ( m x 1 1 k ) ( 1 ) k m y 1 + k B ( m x 2 + m y 1 + k , m y 2 ) × F 1 2 ( m x 2 + m y 2 , m x 2 + m y 1 + k ; m x 2 + m y 1 + m y 2 + k ; 1 z 2 Ω y 1 Ω y 2 Ω x 1 Ω x 2 m x 1 m x 2 m y 1 m y 2 )
Finally, the outage probability is defined as the probability that the signal-to-interference ratio at the destination mobile station is lower than a certain threshold zth:
P o u t ( z t h ) = Pr [ z < z t h ] = F z ( z t h )

3.3. LCR of the Output SIR

The LCR is evaluated as the average value of the first derivative of the SIR or the ratio of two products of Nakagami-m random processes. This average value is evaluated by using the joint probability density function of the considered ratio and its first derivative. The signal-to-interference ratio at the input of the destination station can be expressed as the ratio:
z = x y = x 1 x 2 y 1 y 2
The first derivative of z is:
z ˙ = x 2 y 1 y 2 x ˙ 1 + x 1 y 1 y 2 x ˙ 2 x 1 x 2 y 1 2 y 2 y ˙ 1 x 1 x 2 y 1 y 2 2 y ˙ 2
It is well known that the first derivative of the Nakagami-m random variable follows zero-mean Gaussian distribution [40]. Therefore, x ˙ 1 , x ˙ 2 , y ˙ 1 and y ˙ 2 , have zero-mean Gaussian distribution with the following variances [40]:
σ x ˙ i 2 = π 2 f m 2 Ω x i m x i , σ y ˙ i 2 = π 2 f m 2 Ω y i m y i , i = 1 , 2
where fm is the maximum Doppler frequency.
Since a linear transformation of a Gaussian random variable is also a Gaussian random variable, z ˙ follows a conditional Gaussian distribution. The mean of z ˙ is
z ˙ ¯ = x 2 y 1 y 2 x ˙ 1 ¯ + x 1 y 1 y 2 x ˙ 2 ¯ x 1 x 2 y 1 2 y 2 y ˙ 1 ¯ x 1 x 2 y 1 y 2 2 y ˙ 2 ¯ = 0
because x ˙ 1 ¯ = x ˙ 2 ¯ = y ˙ 1 ¯ = y ˙ 2 ¯ = 0 .
The variance of z ˙ is
σ z ˙ 2 = π 2 f m 2 x 2 2 y 1 2 y 2 2 Ω x 1 m x 1 ( 1 + z 2 y 1 2 y 2 2 x 2 4 Ω x 2 Ω x 1 m x 1 m x 2 + z 2 y 2 2 x 2 2 Ω y 1 Ω x 1 m x 1 m y 1 + z 2 y 1 2 x 2 2 Ω y 2 Ω x 1 m x 1 m y 2 )
The joint probability density function of z , z ˙ , x 2 , y 1 , and y 2 is
p z z ˙ x 2 y 1 y 2 ( z , z ˙ , x 2 , y 1 , y 2 ) = p z ˙ ( z ˙ | z , x 2 , y 1 , y 2 ) p z x 2 y 1 y 2 ( z , x 2 , y 1 , y 2 )
where
p z x 2 y 1 y 2 ( z , x 2 , y 1 , y 2 ) = p x 2 ( x 2 ) p y 1 ( y 1 ) p y 2 ( y 2 ) p z ( z | x 2 , y 1 , y 2 )
The conditional joint probability density function of z is
p z ( z | x 2 , y 1 , y 2 ) = | d x 1 d z | f x 1 ( z y 1 y 2 x 2 )
After substituting Equations (32) and (33) into (31), the expression for p z z ˙ x 2 y 1 y 2 ( z , z ˙ , x 2 , y 1 , y 2 ) becomes
p z z ˙ x 2 y 1 y 2 ( z , z ˙ , x 2 , y 1 , y 2 ) = y 1 y 2 x 2 p x 1 ( z y 1 y 2 x 2 ) p x 2 ( x 2 ) p y 1 ( y 1 ) p y 2 ( y 2 ) p z ˙ ( z ˙ | z , x 2 , y 1 , y 2 )
The joint probability density function of z and z ˙ is
p z z ˙ ( z , z ˙ ) = 0 d x 2 0 d y 1 0 d y 2 y 1 y 2 x 2 p x 1 ( z y 1 y 2 x 2 ) p x 2 ( x 2 ) p y 1 ( y 1 ) p y 2 ( y 2 ) p z ˙ ( z ˙ | z , x 2 , y 1 , y 2 )
The LCR is defined by [26]
N z ( z ) = 0 d z ˙ z ˙ p z z ˙ ( z z ˙ )
Finally, the level crossing rate of signal-to-interference ratio process at the input of the destination station is:
N z ( z ) = 0 d x 2 0 d y 1 0 d y 2 y 1 y 2 x 2 p x 1 ( z y 1 y 2 x 2 ) p x 2 ( x 2 ) p y 1 ( y 1 ) p y 2 ( y 2 ) 0 d z ˙ z ˙ p z ˙ ( z ˙ | z , x 2 , y 1 , y 2 )
Using
0 d z ˙ z ˙ p z ˙ ( z ˙ | z , x 2 , y 1 , y 2 ) = 1 2 π σ z ˙ 0 z ˙ e z ˙ 2 2 σ z ˙ 2 d z ˙ = σ z ˙ 2 π
we have
N z ( z ) = 0 d x 2 0 d y 1 0 d y 2 y 1 y 2 x 2 p x 1 ( z y 1 y 2 x 2 ) p x 2 ( x 2 ) p y 1 ( y 1 ) p y 2 ( y 2 ) σ z ˙ 2 π
After substituting the probability density function (1) into (39), the expression for the level crossing rate becomes
N z ( z ) = 16 Γ ( m x 1 ) Γ ( m x 2 ) Γ ( m y 1 ) Γ ( m y 2 ) ( m x 1 Ω x 1 ) m x 1 ( m x 2 Ω x 2 ) m x 2 ( m y 1 Ω y 1 ) m y 1 ( m y 2 Ω y 2 ) m y 2 × z 2 m x 1 1 1 2 π π f m Ω x 1 m x 1 0 d x 2 0 d y 1 0 d y 2 × 1 + z 2 y 1 2 y 2 2 x 2 4 Ω x 2 Ω x 1 m x 1 m x 2 + z 2 y 2 2 x 2 2 Ω y 1 Ω x 1 m x 1 m y 1 + z 2 y 1 2 x 2 2 Ω y 2 Ω x 1 m x 1 m y 2 × exp ( m x 1 Ω x 1 z 2 y 1 2 y 2 2 x 2 2 m x 2 Ω x 2 x 2 2 m y 1 Ω y 1 y 1 2 m y 2 Ω y 2 y 2 2 + 2 ( m x 2 m x 1 ) ln x 2 + 2 ( m x 1 + m y 1 1 ) ln y 1 + 2 ( m x 1 + m y 2 1 ) ln y 2 )
The three-fold integral in the above expression is solved by using the Laplace approximation formula (theorem) for the three-fold integral [41]:
0 d x 0 d y 0 d z g ( x , y , z ) exp ( λ f ( x , y , z ) ) = ( 2 π λ ) 3 / 2 g ( x 0 , y 0 , z 0 ) B ( x 0 , y 0 , z 0 ) exp ( λ f ( x 0 , y 0 , z 0 ) )
where x0, y0, and z0 are solutions of the following set of equations:
f ( x 0 , y 0 , z 0 ) x 0 = 0 f ( x 0 , y 0 , z 0 ) y 0 = 0 f ( x 0 , y 0 , z 0 ) z 0 = 0
And
B ( x 0 , y 0 , z 0 ) = | 2 f ( x 0 , y 0 , z 0 ) x 0 2 2 f ( x 0 , y 0 , z 0 ) x 0 y 0 2 f ( x 0 , y 0 , z 0 ) y 0 z 0 2 f ( x 0 , y 0 , z 0 ) x 0 y 0 2 f ( x 0 , y 0 , z 0 ) y 0 2 2 f ( x 0 , y 0 , z 0 ) y 0 z 0 2 f ( x 0 , y 0 , z 0 ) x 0 z 0 2 f ( x 0 , y 0 , z 0 ) y 0 z 0 2 f ( x 0 , y 0 , z 0 ) z 0 2 |
For the considered case, the constant λ = 1 and functions f and g are
g ( x 2 , y 1 , y 2 ) = 1 + z 2 y 1 2 y 2 2 x 2 4 Ω x 2 Ω x 1 m x 1 m x 2 + z 2 y 2 2 x 2 2 Ω y 1 Ω x 1 m x 1 m y 1 + z 2 y 1 2 x 2 2 Ω y 2 Ω x 1 m x 1 m y 2
f ( x 2 , y 1 , y 2 ) = m x 1 Ω x 1 z 2 y 1 2 y 2 2 x 2 2 + m x 2 Ω x 2 x 2 2 + m y 1 Ω y 1 y 1 2 + m y 2 Ω y 2 y 2 2 2 ( m x 2 m x 1 ) ln x 2 2 ( m x 1 + m y 1 1 ) ln y 1 2 ( m x 1 + m y 2 1 ) ln y 2

4. Numerical Results

This section presents numerical results that indicate the influence of different fading parameters on the PDF, the outage probability, and LCR. The validity of the theoretical results is confirmed with the results obtained by the Monte-Carlo simulation with one million simulation steps. It is assumed, for all the following figures, that the Nakagami-m short-term fading severity parameter is equal for the desired signal and interference, in both sections, i.e., m x 1 = m x 2 = m y 1 = m y 2 = m . The other assumption is the equality of the desired signal and the interference power for both sections, i.e., Ω x 1 = Ω x 2 = Ω x and Ω y 1 = Ω y 2 = Ω y . These assumptions are introduced for the sake of a more simple, clean graphical representation of the results and do not limit the generality of the results.
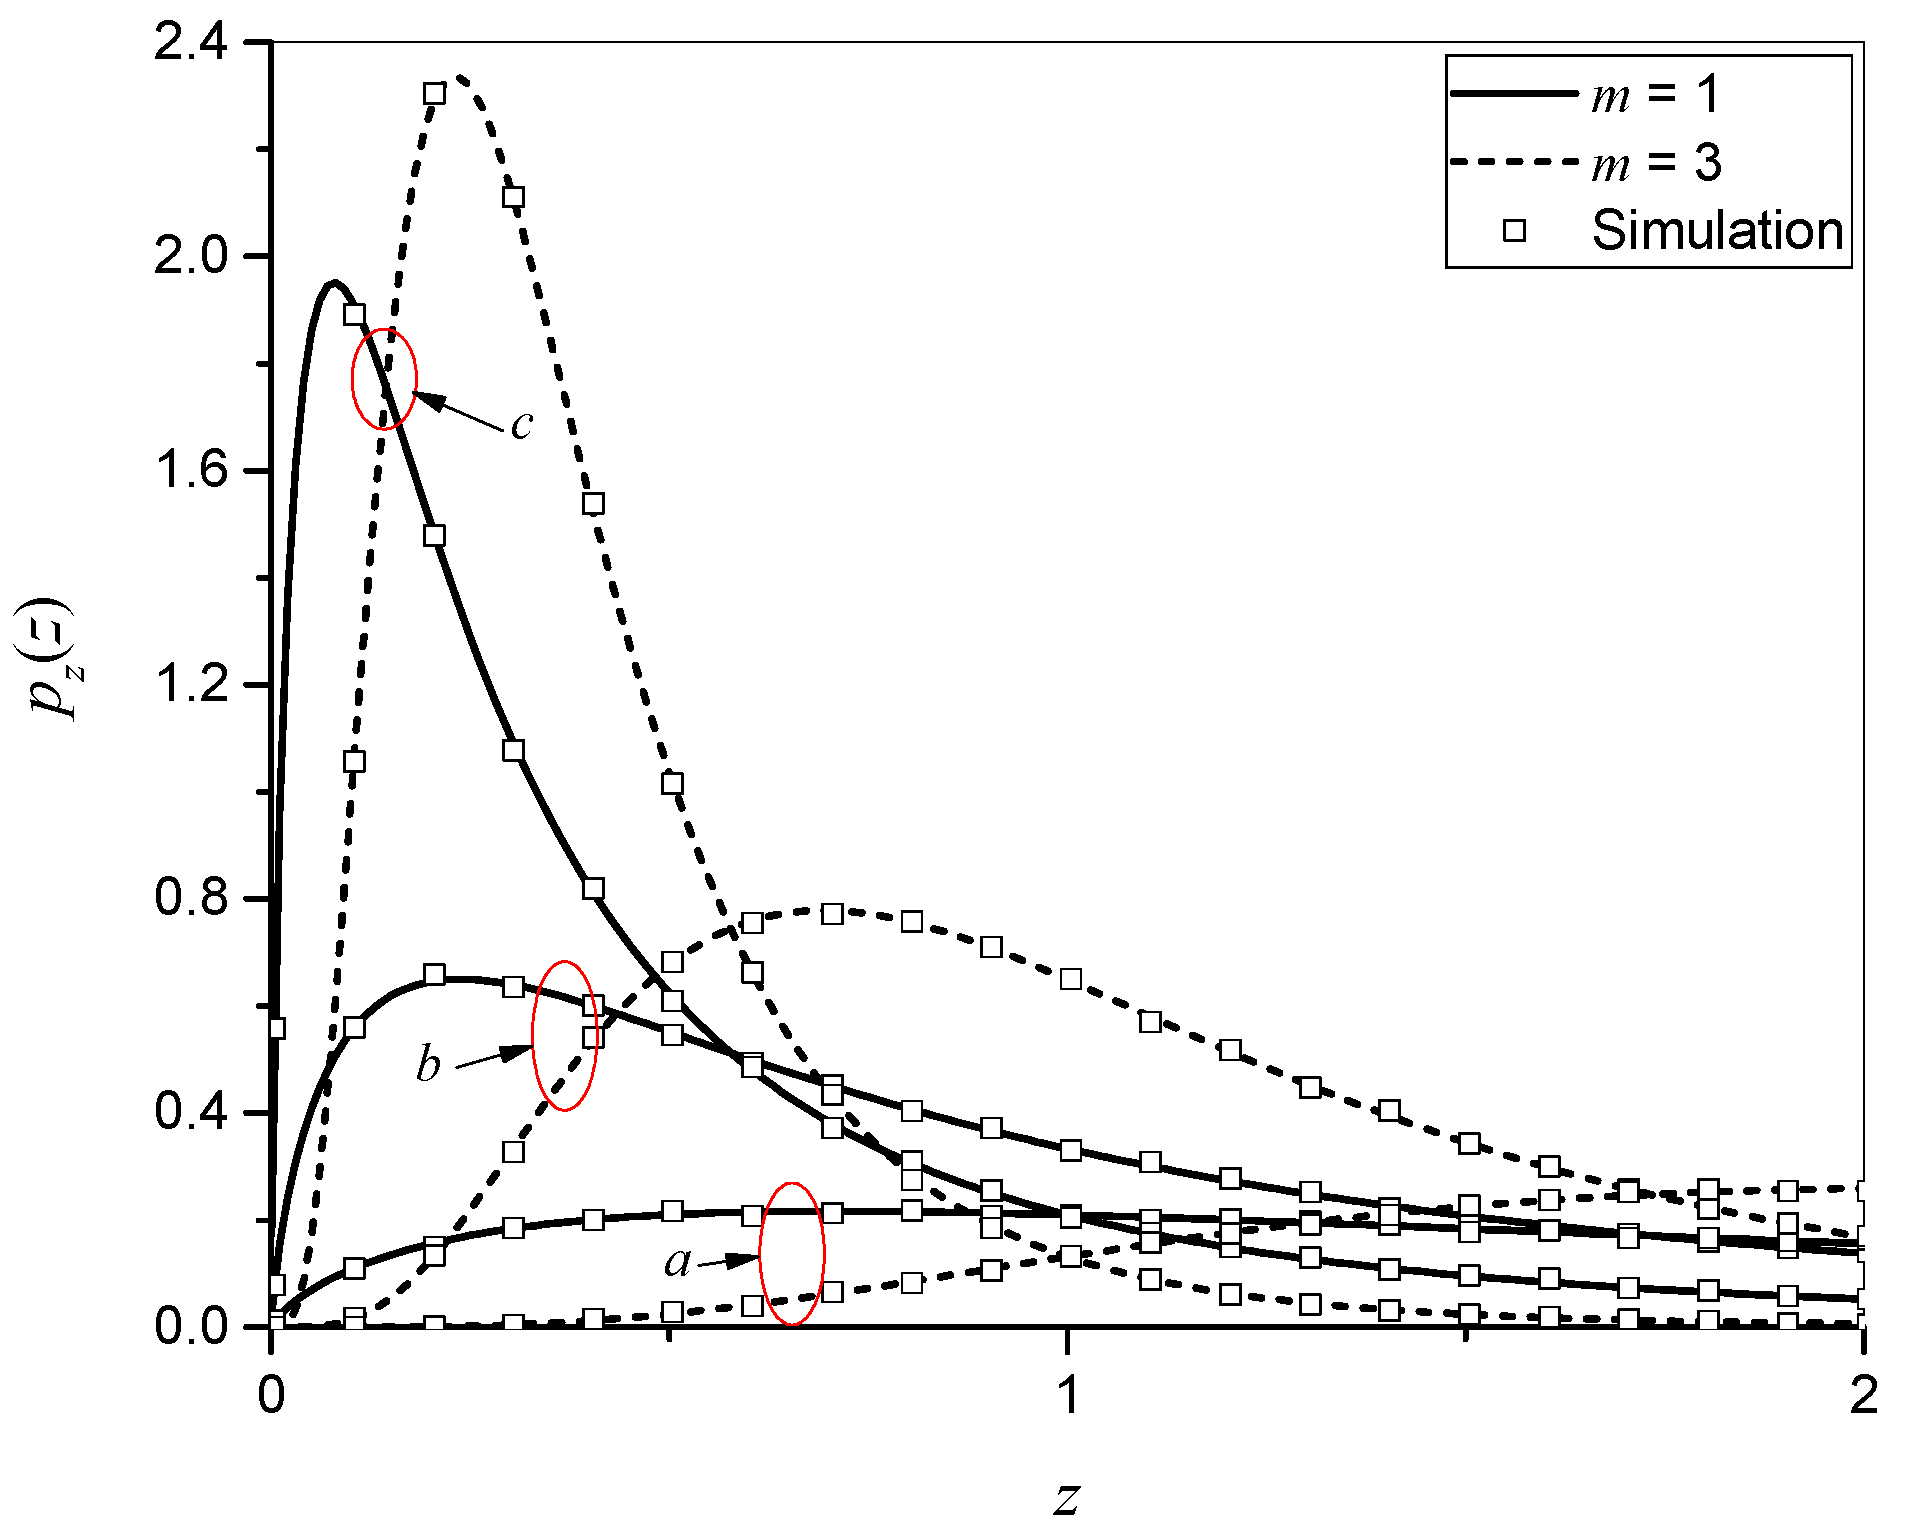
Figure 2 depicts the PDF versus signal-to-interference ratio for various values of fading severity parameters and different average signal-to-interference power ratios (SIR) Ωxy.
An increase in the value of the severity fading parameter has the effect of narrowing the range of the PDF on the destination node, as well as increasing the value of the maximum. An increase in the ratio of the average signal power parameters Ωx/Ωy results in the expansion of the range of the PDF on the destination node, as well as a decrease in the maximum value. From Figure 2 we can see a good agreement between the theoretical and simulation results.
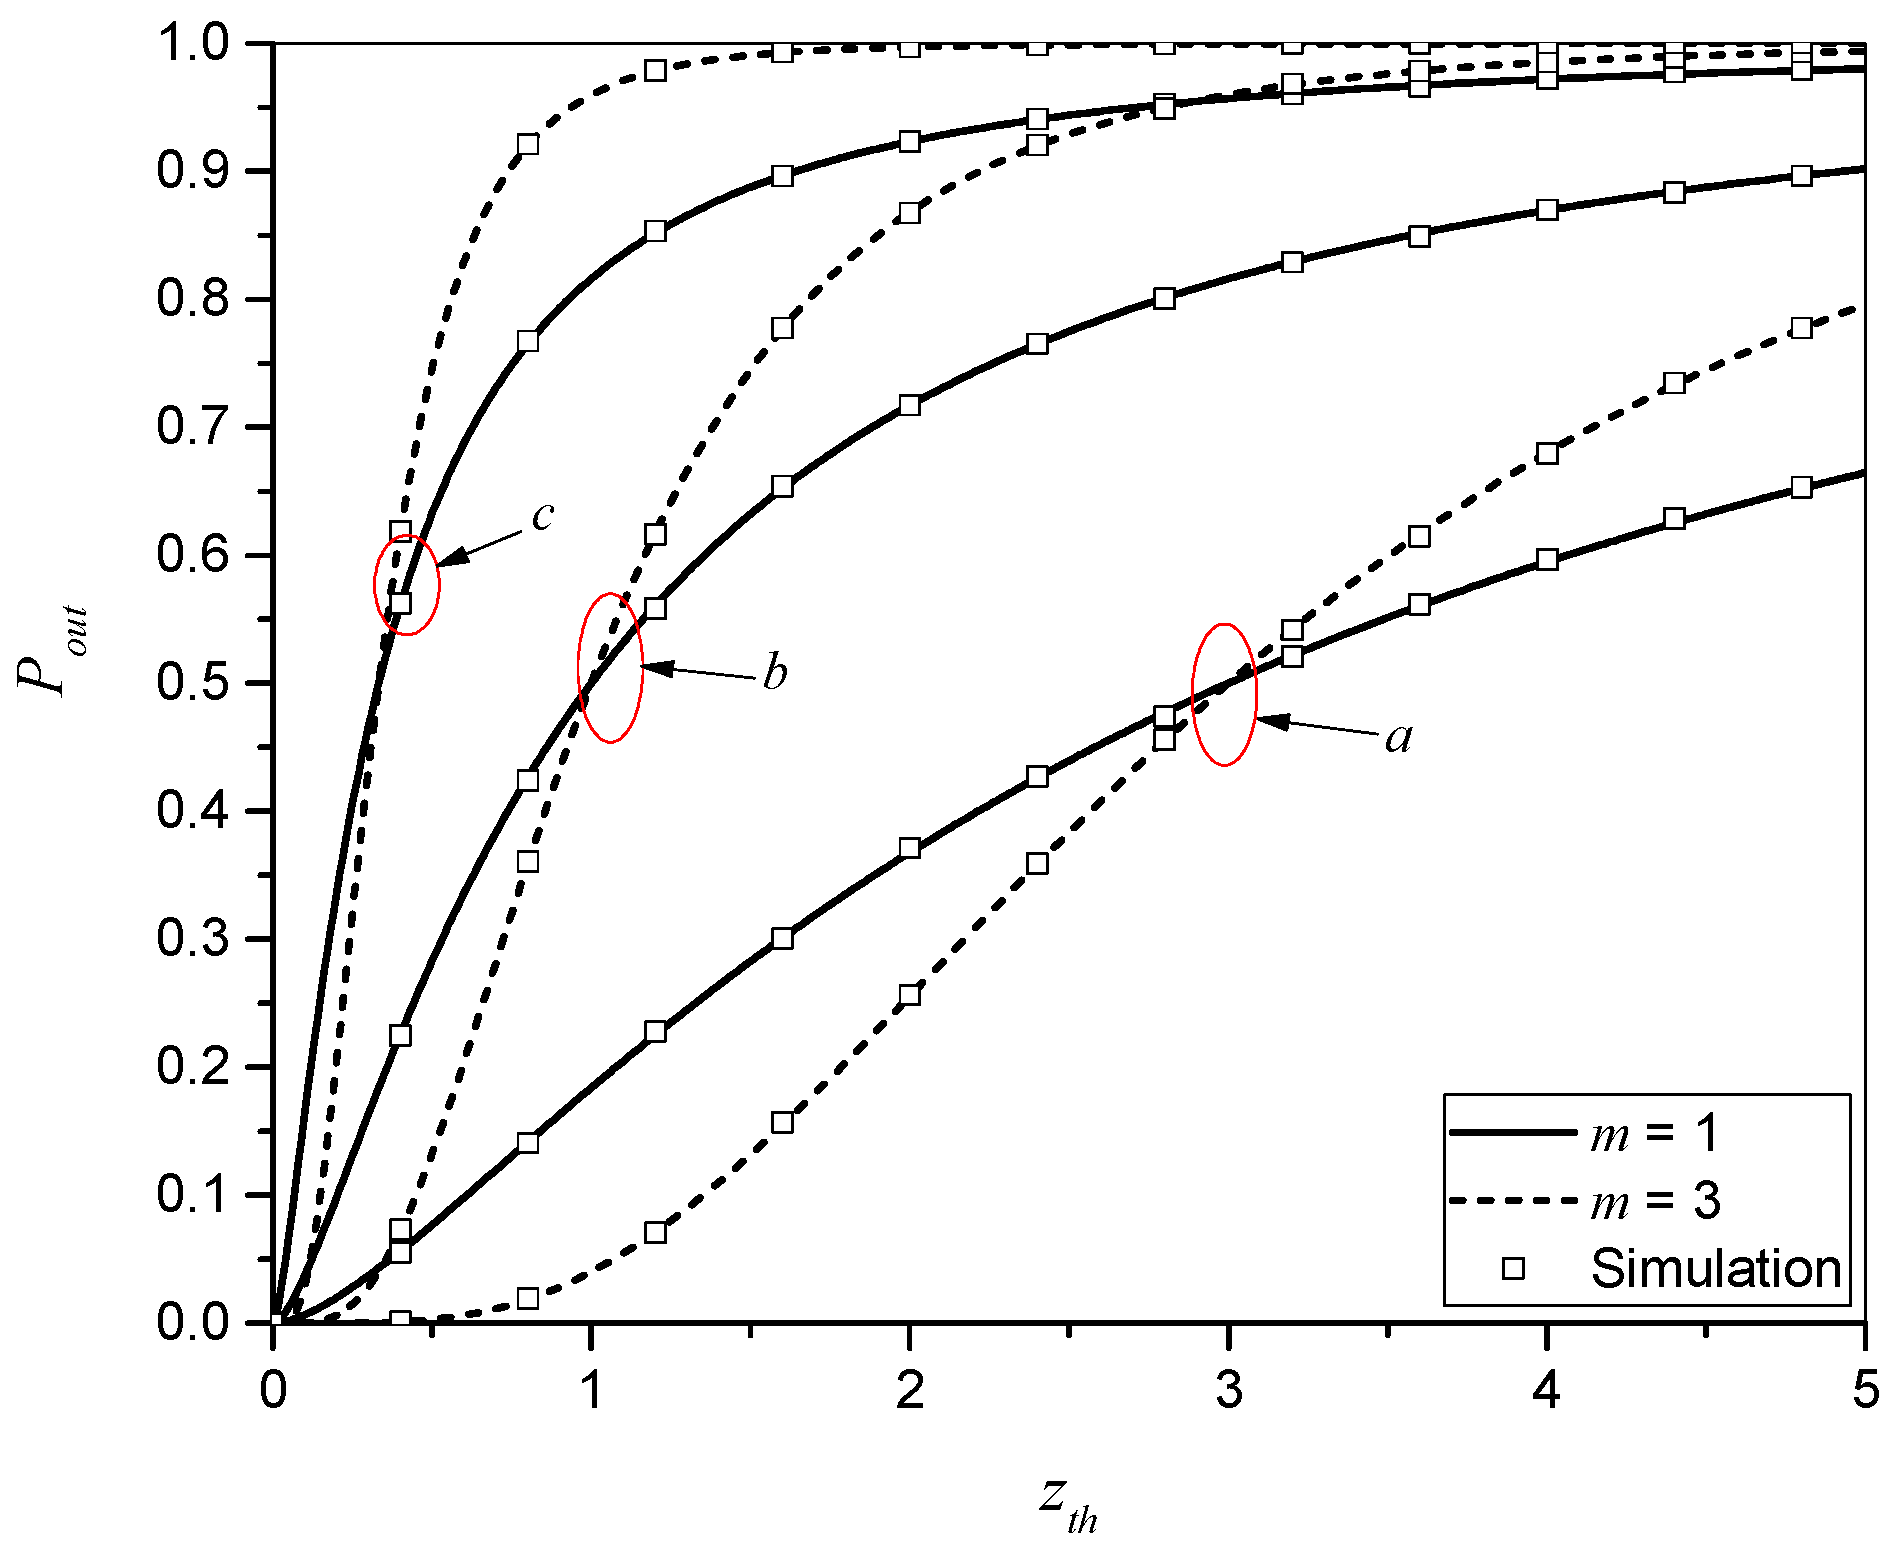
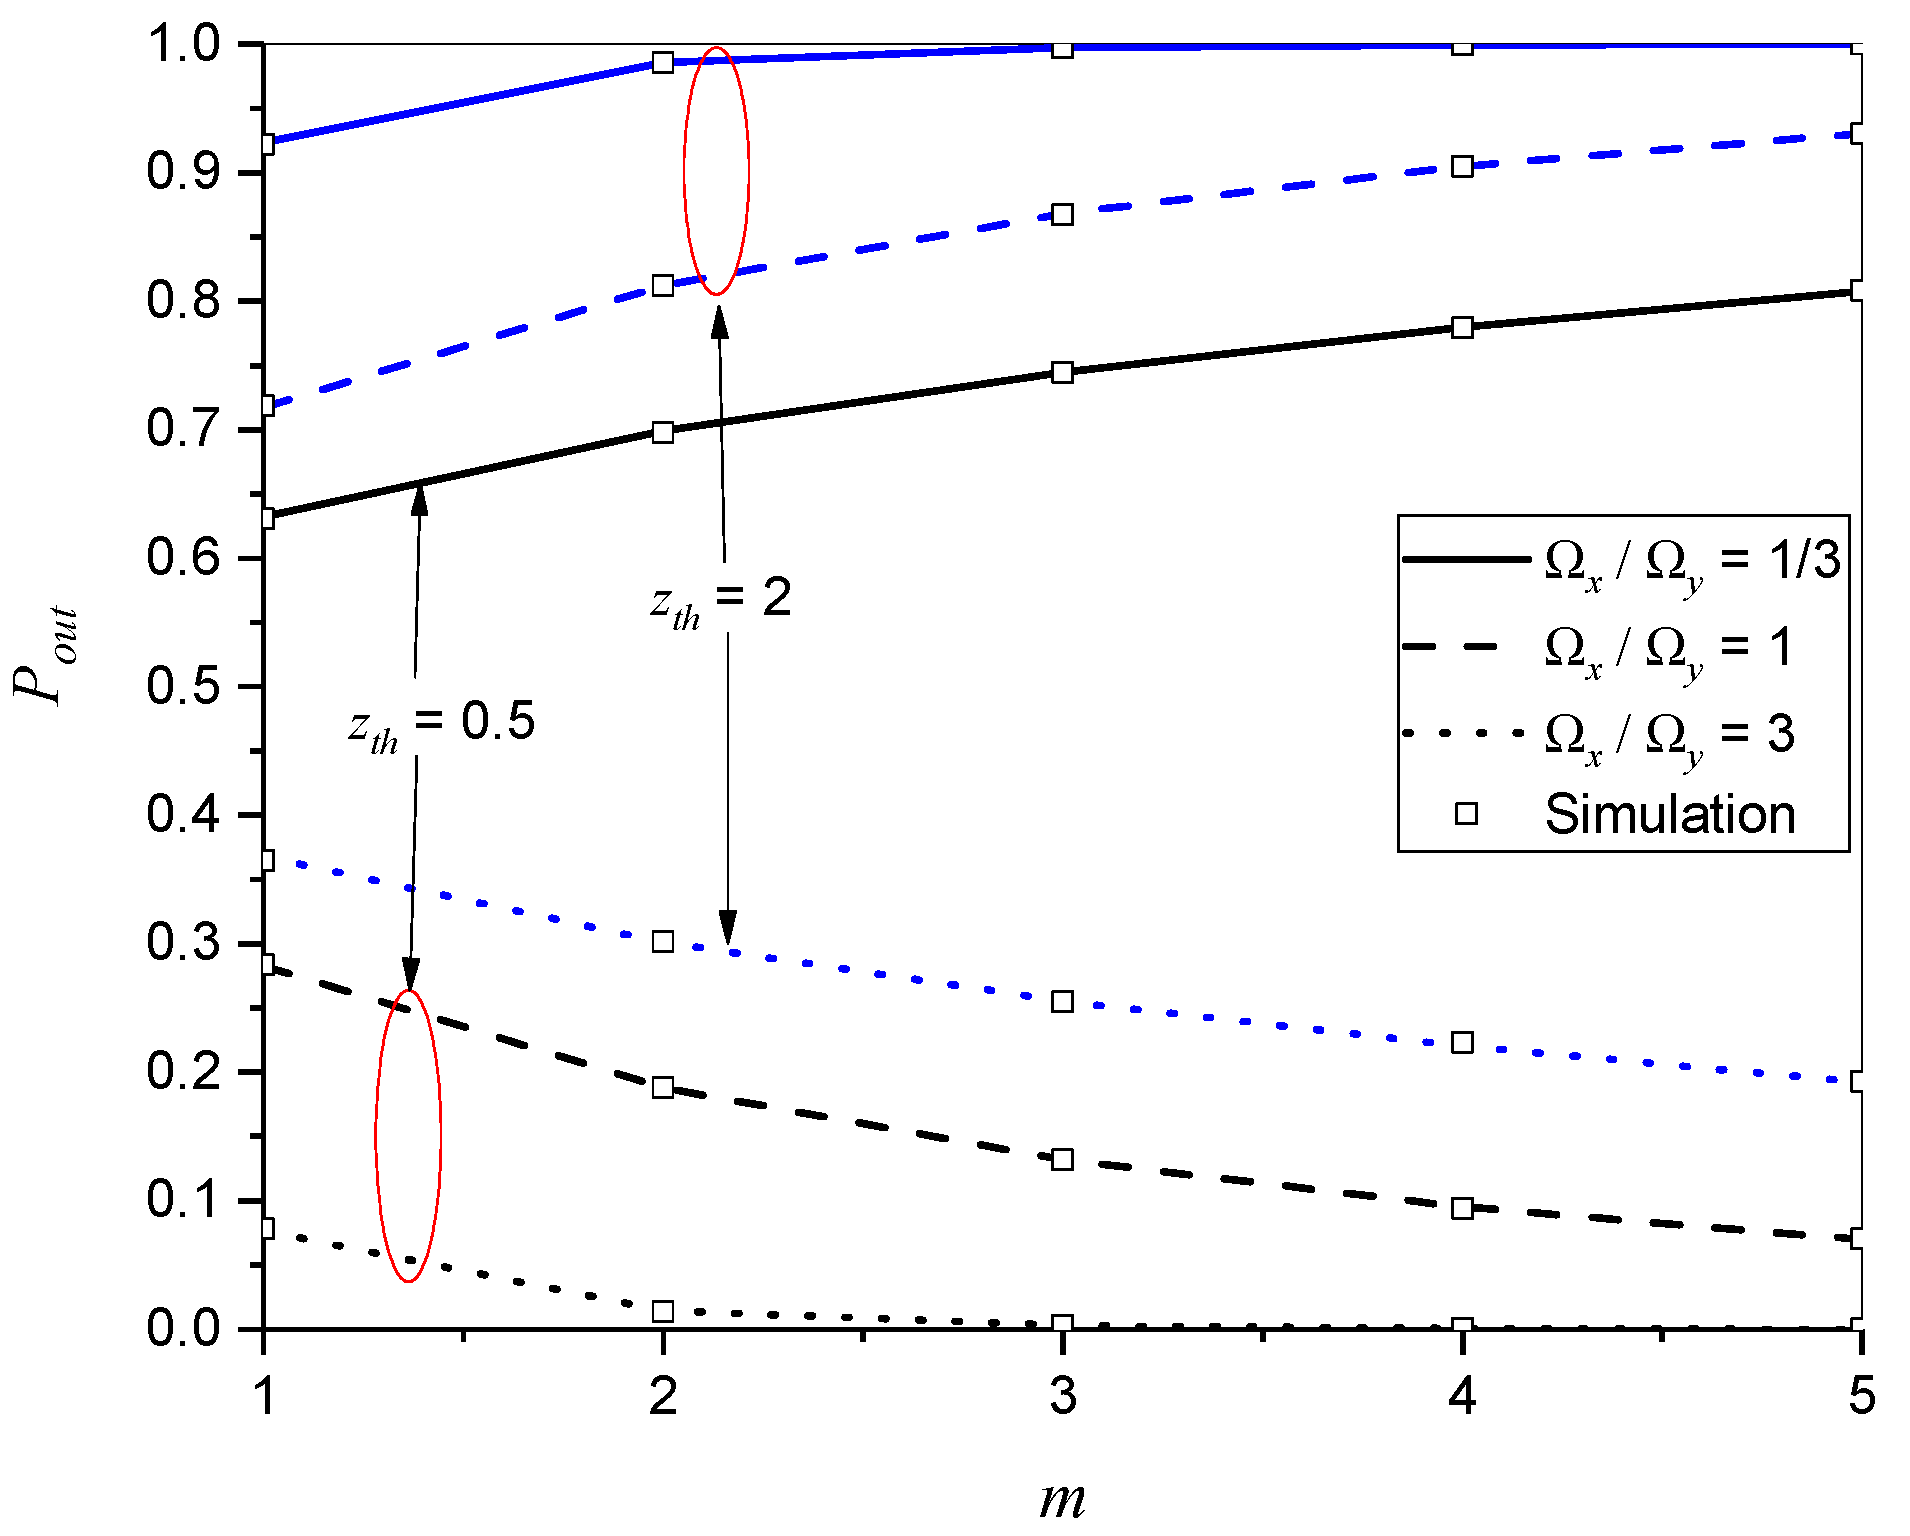
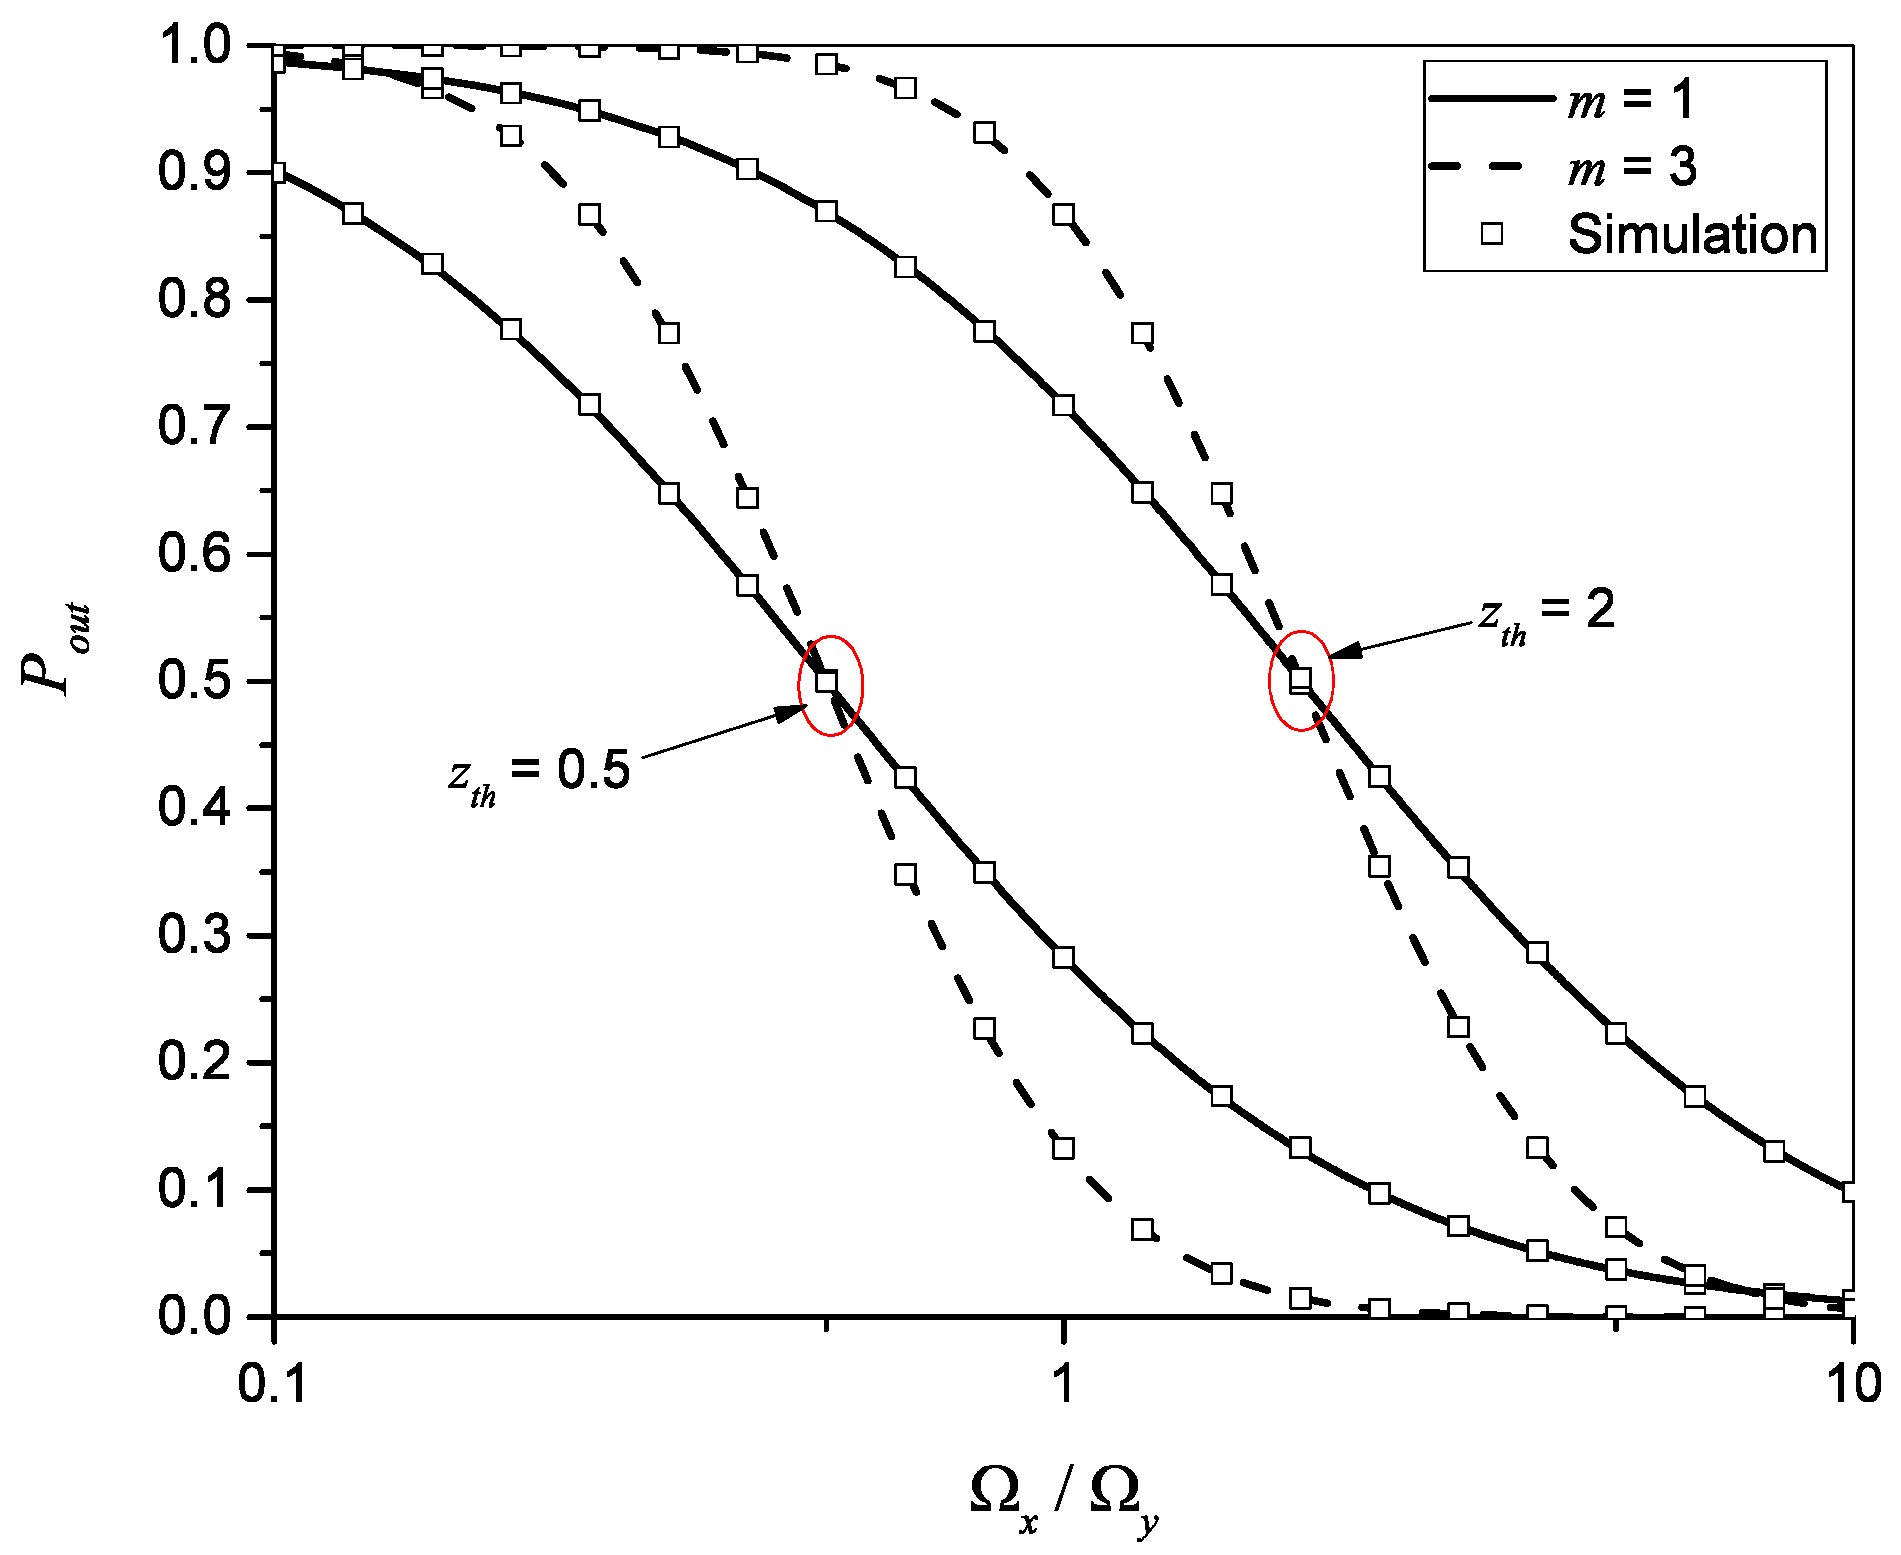
Figure 3, Figure 4 and Figure 5 depict the outage probability as a function of different parameters. Again, these figures show a good agreement between the theoretical and simulation results, this time for CDF.
Figure 3 depicts the outage probability of the system versus the outage threshold, zth. From this figure, we can see that the outage probability is higher for higher values of the outage threshold. In contrast, the influence of the fading severity parameter is twofold. For lower values of zth, the outage probability is lower for higher m. Likewise, for higher values of zth, the outage probability is higher for higher m. Further, from Figure 3 we can see that the outage probability is equal for m = 1 = 3 at zth = 0.33 for Ωxy = 1/3, m = 1 = 3 at at zth = 1 for Ωxy = 1, and m = 1 = 3 at zth = 3 for Ωxy = 3. This can be confirmed if we put Ωxy = zth in Equation (24). In this case, the outage probability is always equal to 0.5 and does not depend on m, zth, or Ωxy.
Figure 4 and Figure 5 show the outage probability as a function of m and Ωxy, respectively. From Figure 4, we can see that the outage threshold has a larger influence on the outage probability than the fading severity parameter m. Then, from Figure 5, we can see the influence of SIR on outage probability. As the ratio between the power of the desired signal and the interference increases, the outage probability decreases. Outage probability depends on the outage threshold that is selected. SNR over this level guarantees the reliable performance of the transmission system.
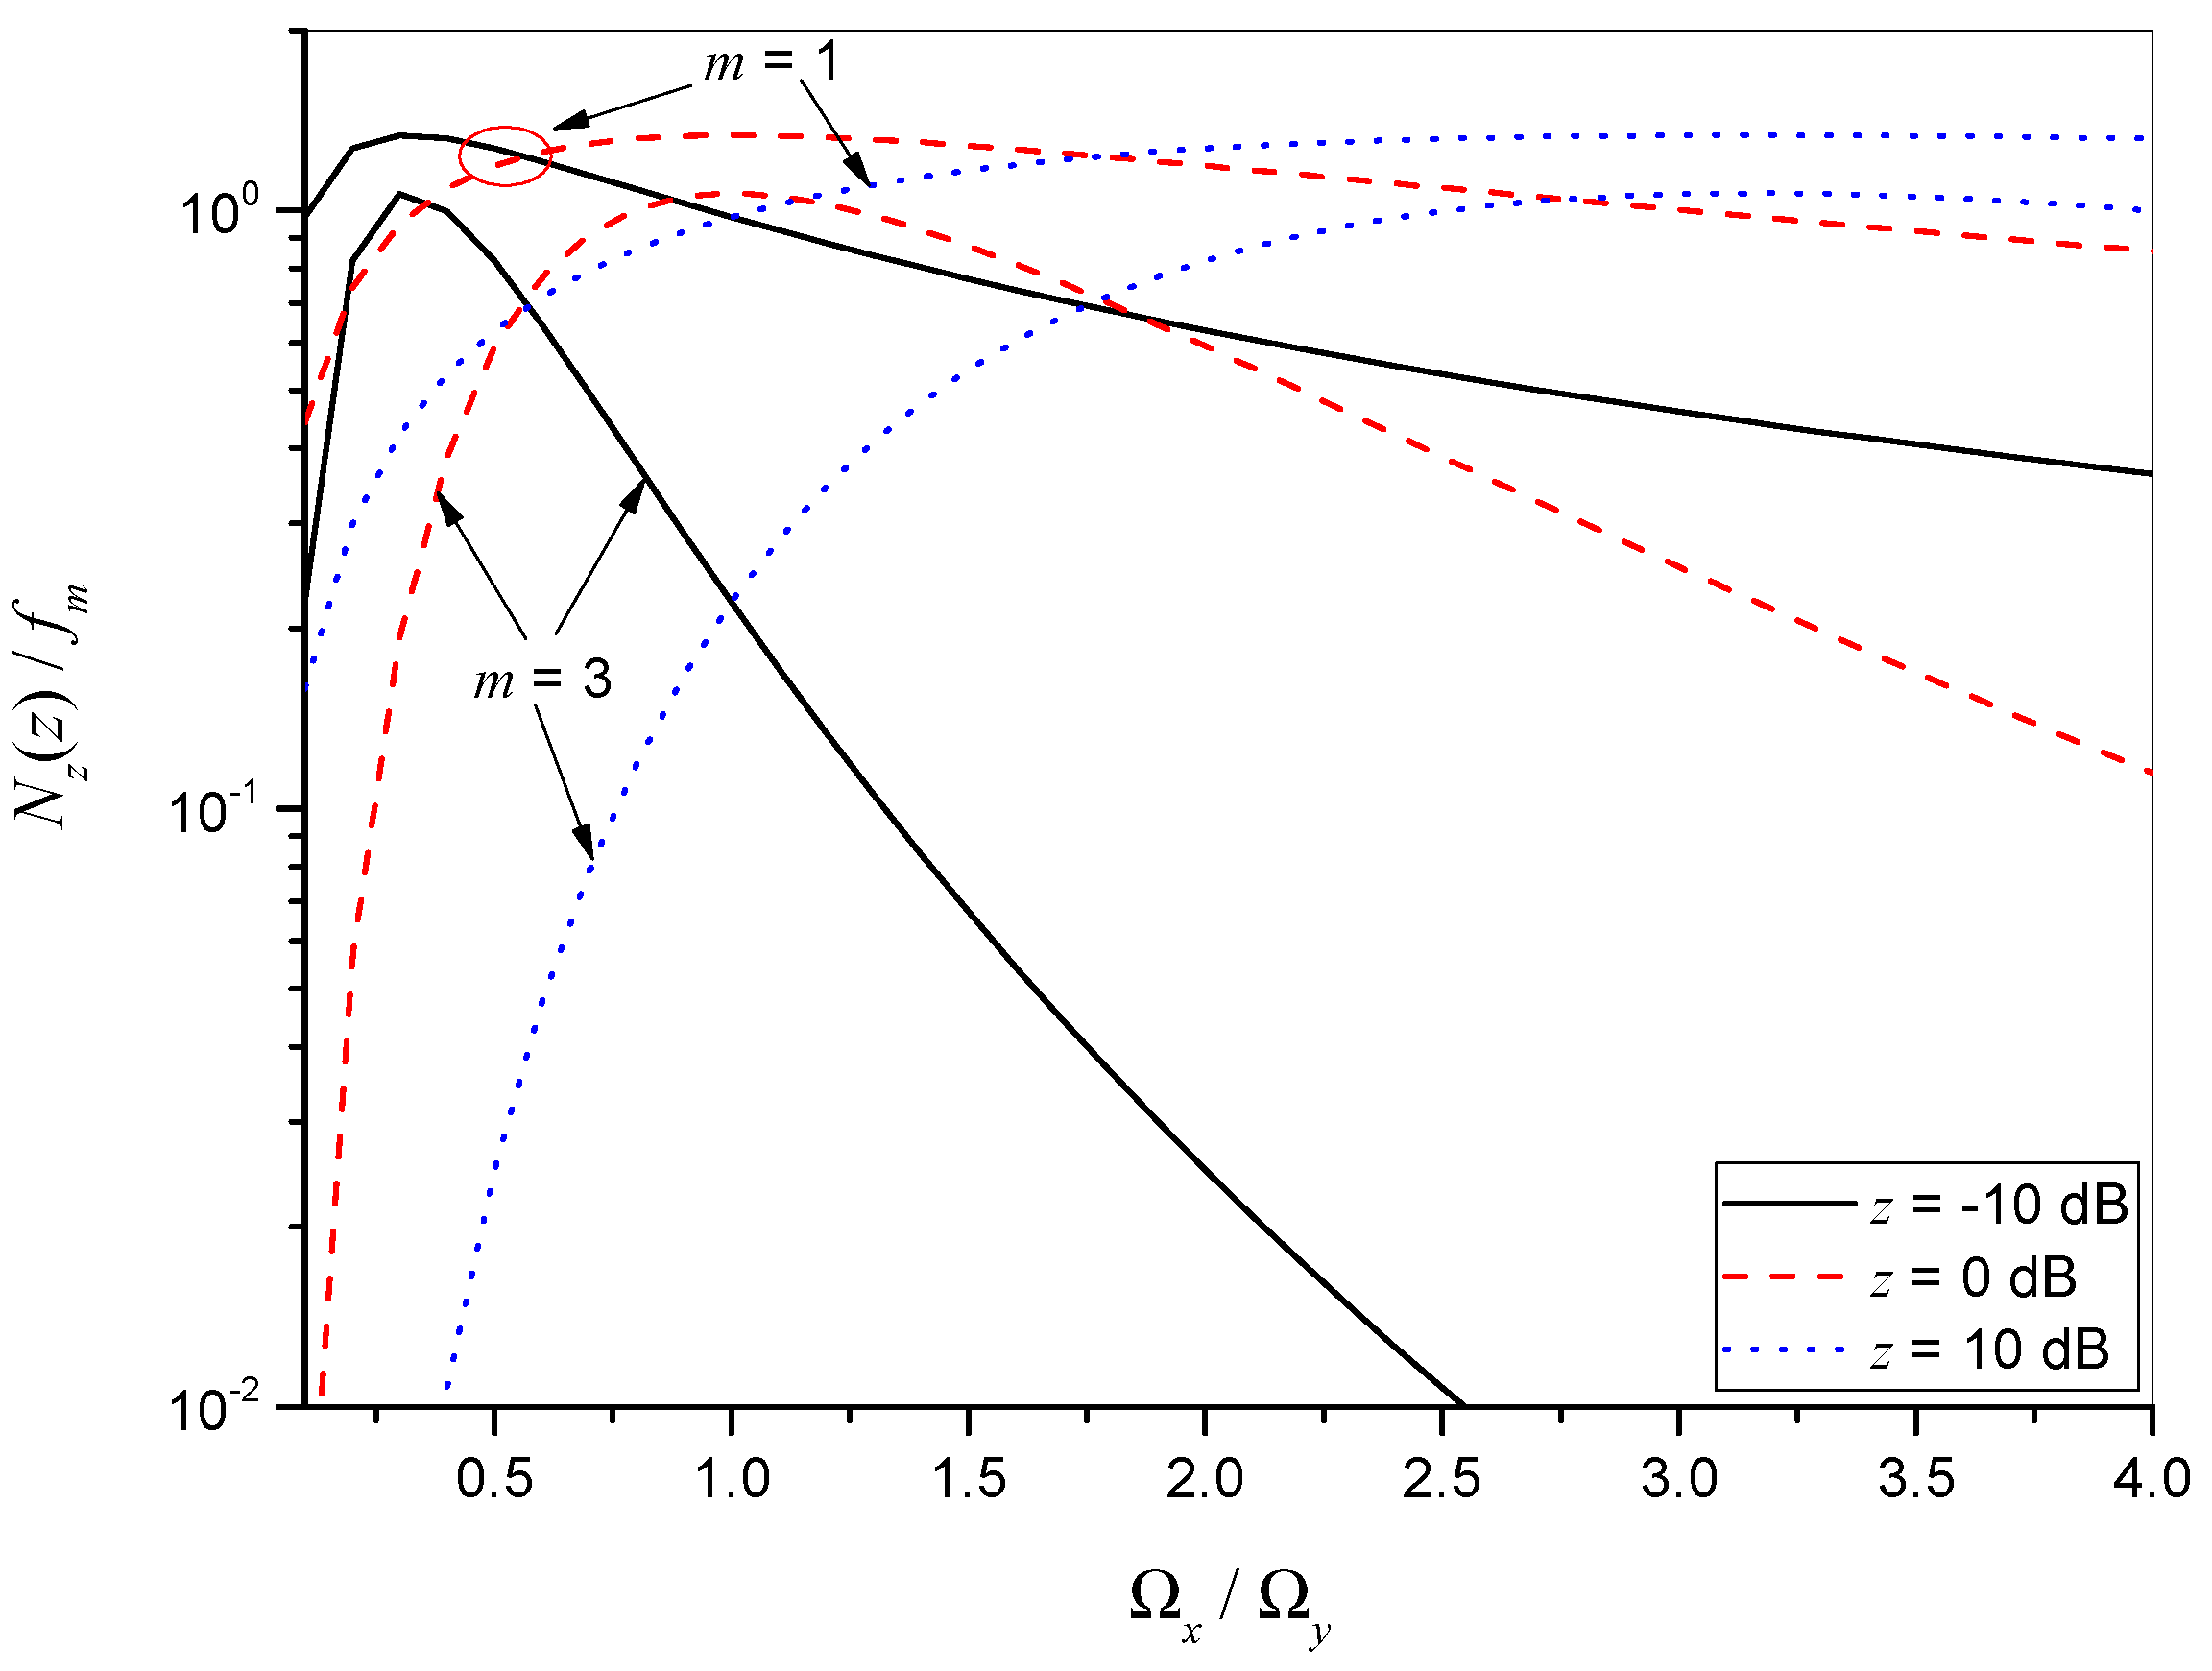
Figure 6, Figure 7 and Figure 8 show the influence of fading and signal parameters on the LCR. Aside from the Laplace approximation results, we present the results obtained by the numerical integration of Equation (40). These results are also confirmed with the Monte-Carlo simulation results, based on the sum-of-sinusoids Nakagami-m channel model.
The normalized LCR of signal-to-interference ratio process at the output of the M2M fading channel, as a function of LCR threshold z, is shown in Figure 6 for different values of fading severity parameter m. The signal-to-interference ratio is Ωx/Ωy = 3. The results show that the LCR is lower for higher m. In addition, for higher m, the threshold has a higher influence on the LCR. There is a good agreement between the exact (numerical integration), approximation, and simulation results, with the simulation results being slightly off for low z.
Figure 7 shows the LCR as a function of fading severity parameter m, for different values of signal-to-interference ratio and z = 10 dB. We can see that the influence of parameter m on the level crossing rate is higher for lower values of the signal-to-interference ratio.
The normalized LCR, obtained by the Laplace approximation versus signal-to-interference ratio, for several values of Nakagami-m severity parameters m and LCR thresholds z, is depicted in Figure 8.
As we can see, the level crossing rate increases for lower values of the signal-to-interference ratio, achieves maximum, and decreases for higher values of the signal-to-interference ratio. The influence of the signal-to-interference ratio on the level crossing rate is higher for lower values of the signal-to-interference ratio.

5. Conclusions

In this paper, we considered a wireless communication system with a cooperative network operating over mobile-to-mobile fading channels in the presence of co-channel interference. Communication between source and destination takes place via relay. The mobile-to-mobile fading channel has two sections (from source to relay and from relay to destination), and the desired signal and co-channel interference are present in both. In addition, the desired signal and co-channel interference in both sections experience Nakagami-m short-term fading. All these systems have practical applications such as drone wireless relay systems for disaster recovery and physical layer security to avoid eavesdropping attacks and adaptive transmission.
We evaluated the probability density function and cumulative distribution function of the signal-to-interference ratio at the input of the destination station. These theoretical results are shown as closed-form expressions. All the results are verified with Monte-Carlo simulations. As shown, the theoretical results are in great accordance with the simulation results. Analytical expressions in closed form for PDF and CDF represent the basis for calculating other system performances such as the outage probability, channel capacity, bit-error rate (BER), level crossing rates, average fade duration, and many others. The closed-form expressions for PDF and CDF presented in this work are not limited only to mobile-to-mobile communication systems with relays. These results are useful for performance analyses in systems with adaptive transmission, physical layer security, etc.
The outage probability as a measure of the performance of the considered system allows us to see the stability and reliability of the system. The results show that the outage probability increases when the power of the desired signal decreases or the power of co-channel interference increases. Moreover, if the average signal-to-interference power ratio is equal to the outage threshold, the outage probability is Pout = 0.5, regardless of the fading severity parameter m and the actual values of zth and Ωxy. The conclusion is that the outage probability of the system depends much more on the threshold level than on the severity parameter and the ratio of the power of the desired signal and interference. It is important because, with threshold level selection, we can control system reliability.
In addition, the closed-form expression for the level crossing rate was derived using the Laplace approximation theorem. The level-crossing rate results are also verified with the Monte-Carlo simulation. The obtained results showed that the level crossing rate increases for lower values of the signal-to-interference ratio and decreases for higher values of the signal-to-interference ratio.

Author Contributions

Conceptualization, Z.N. and P.S.; methodology, P.S.; validation, M.N., N.M. and M.S.; formal analysis, Z.N.; investigation, M.N. and N.M.; writing—original draft preparation, Nenad Miloševic and M.S.; writing—review and editing, M.N., N.M. and M.S. All authors have read and agreed to the published version of the manuscript.

Funding

This research received no external funding.

Institutional Review Board Statement

Not applicable.

Informed Consent Statement

Not applicable.

Data Availability Statement

Not applicable.

Conflicts of Interest

The authors declare no conflict of interest.

Appendix A

After inserting Equation (1) into (3), we obtain
p z i ( z i ) = 2 Γ ( m x i ) ( m x i Ω x i ) m x i 2 Γ ( m y i ) ( m y i Ω y i ) m y i z i 2 m x i 1 × × 0 d y i y i 2 m x i + 2 m y i 1 exp ( ( m x i z i 2 Ω x i + m y i Ω y i ) y i 2 ) = 2 Γ ( m x i ) ( m x i Ω x i ) m x i 2 Γ ( m y i ) ( m y i Ω y i ) m y i z i 2 m x i 1 × × 0 d y i 1 y i ( y i 2 ) m x i + m y i exp ( ( m x i z i 2 Ω x i + m y i Ω y i ) y i 2 )
We can evaluate the above integral under the following change of variable:
( m x i z i 2 Ω x i + m y i Ω y i ) y i 2 = q y i = q 1 2 ( m x i z i 2 Ω x i + m y i Ω y i ) 1 2 d y i = 1 2 q 1 2 ( m x i z i 2 Ω x i + m y i Ω y i ) 1 2 d q
p z i ( z i ) = 2 Γ ( m x i ) ( m x i Ω x i ) m x i 2 Γ ( m y i ) ( m y i Ω y i ) m y i z i 2 m x i 1 × × 0 1 2 q 1 2 ( m x i z i 2 Ω x i + m y i Ω y i ) 1 2 q 1 2 ( 2 m x i + 2 m y i 1 ) × × ( m x i z i 2 Ω x i + m y i Ω y i ) 1 2 ( 2 m x i + 2 m y i 1 ) exp ( q ) d q
p z i ( z i ) = 2 Γ ( m x i ) ( m x i Ω x i ) m x i 2 Γ ( m y i ) ( m y i Ω y i ) m y i z i 2 m x i 1 × × 1 2 ( m x i z i 2 Ω x i + m y i Ω y i ) ( m x i + m y i ) 0 q m x i + m y i 1 e q d q
Having in mind the definition of Gamma function Equation (8.310) from [38], Equation (A4) is equal to
p z i ( z i ) = 2 Γ ( m x i ) ( m x i Ω x i ) m x i 2 Γ ( m y i ) ( m y i Ω y i ) m y i z i 2 m x i 1 × × 1 2 ( m x i z i 2 Ω x i + m y i Ω y i ) ( m x i + m y i ) Γ ( m x i + m y i )
Finally, Equation (A5) simplifies to (3).

References

  1. Laneman, J.N.; Tse, D.N.C.; Wornell, G.W. Cooperative Diversity in Wireless Networks: Efficient Protocols and Outage Behavior. IEEE Trans. Inf. Theory 2004, 50, 3062–3080. [Google Scholar] [CrossRef]
  2. Talha, B.; Patzold, M. Channel Models for Mobile-to-Mobile Cooperative Communication Systems: A State of the Art Review. IEEE Veh. Technol. Mag. 2011, 6, 33–43. [Google Scholar] [CrossRef]
  3. Benevides da Costa, D.; Ding, H.; Yacoub, M.D.; Ge, J. Two-Way Relaying in Interference-Limited AF Cooperative Networks Over Nakagami- m Fading. IEEE Trans. Veh. Technol. 2012, 61, 3766–3771. [Google Scholar] [CrossRef]
  4. Suljović, S.; Milić, D.; Panić, S.; Stefanović, Č.; Stefanović, M. Level Crossing Rate of Macro Diversity Reception in Composite Nakagami-m and Gamma Fading Environment with Interference. Digit. Signal Process. 2020, 102, 102758. [Google Scholar] [CrossRef]
  5. Nguyen, N.T.T.; Vu, M.Q.; Pham, H.T.T.; Dang, B.H.; Dang, N.T. Performance Enhancement of HAP-Based Relaying M -PPM FSO System Using Spatial Diversity and Heterodyne Detection Receiver. J. Opt. Commun. 2021, 42, 111–120. [Google Scholar] [CrossRef]
  6. Amirabadi, M.A.; Vakili, V.T. Performance Analysis of Hybrid FSO/RFcommunication Systems with Alamouticoding or Antenna Selection. J. Eng. 2019, 2019, 3433–3437. [Google Scholar] [CrossRef]
  7. Zdravković, N.; Cvetković, A.M.; Milić, D.N.; Đorđević, G.T. Packet Error Rate Analysis of Decode-and-Forward Free-Space Optical Cooperative Networks in the Presence of Random Link Blockage. J. Mod. Opt. 2017, 64, 1657–1668. [Google Scholar] [CrossRef]
  8. Anees, S.; Harsha, P.S.S.; Bhatnagar, M.R. On the Performance of AF Based Mixed Triple-Hop RF / FSO / RF Communication System. In Proceedings of the IEEE 28th Annual International Symposium on Personal, Indoor, and Mobile Radio Communications (PIMRC), Montreal, QC, Canada, 8–13 October 2017; pp. 1–6. [Google Scholar] [CrossRef]
  9. Peppas, K.P. A New Formula for the Average Bit Error Probability of Dual-Hop Amplify-and-Forward Relaying Systems over Generalized Shadowed Fading Channels. IEEE Wirel. Commun. Lett. 2012, 1, 85–88. [Google Scholar] [CrossRef]
  10. Lee, D.; Lee, J.H. Outage Probability for Dual-Hop Relaying Systems With Multiple Interferers Over Rayleigh Fading Channels. IEEE Trans. Veh. Technol. 2011, 60, 333–338. [Google Scholar] [CrossRef]
  11. Alvi, S.H.; Wyne, S. On Amplify-and-Forward Relaying over Hyper-Rayleigh Fading Channels. Radioengineering 2014, 23, 1226–1233. [Google Scholar]
  12. Alvi, S.H.; Wyne, S. Error Analysis of Fixed-Gain AF Relaying with MRC Over Nakagami-m Fading Channels. Radioengineering 2016, 25, 106–113. [Google Scholar] [CrossRef]
  13. Benevides da Costa, D.; Ding, H.; Ge, J. Interference-Limited Relaying Transmissions in Dual-Hop Cooperative Networks over Nakagami-m Fading. IEEE Commun. Lett. 2011, 15, 503–505. [Google Scholar] [CrossRef]
  14. Soleimani-Nasab, E.; Matthaiou, M.; Karagiannidis, G.K.; Ardebilipour, M. Two-Way Interference-Limited AF Relaying over Nakagami-m Fading Channels. IEEE Glob. Commun. Conf. 2013, 475, 4275–4281. [Google Scholar] [CrossRef]
  15. Nakagami, M. The M-Distribution—A General Formula of Intensity Distribution of Rapid Fading. In Statistical Methods in Radio Wave Propagation; Elsevier: Amsterdam, The Netherlands, 1960; pp. 3–36. [Google Scholar] [CrossRef]
  16. Xu, L.; Zhang, H.; Wang, J.; Aaron Gulliver, T. Joint Relay Selection and Power Allocation for AF Relaying M2M Cooperative System. Wirel. Pers. Commun. 2017, 96, 4063–4077. [Google Scholar] [CrossRef]
  17. Alves, H.; Souza, R.D.; Benevides da Costa, D.; Latva-aho, M. Full-Duplex Relaying Systems Subject to Co-Channel Interference and Noise in Nakagami-m Fading. In Proceedings of the 2015 IEEE 81st Vehicular Technology Conference (VTC Spring), Glasgow, UK, 11–14 May 2015; Volume 2015, pp. 1–5. [Google Scholar] [CrossRef]
  18. He, W.; Lei, H.; Pan, G. Performance Modeling and Analysis on Conditional DF Relaying Scheme over Nakagami-m Fading Channels with Integral M. AEU-Int. J. Electron. Commun. 2016, 70, 743–749. [Google Scholar] [CrossRef]
  19. Lee, W.C.Y. Mobile Communications Engineering: Theory and Applications, 2nd ed.; McGraw-Hill Education: New York, NY, USA, 1998. [Google Scholar]
  20. Cao, Z.; Yao, Y.-D. Definition and Drivation of Level Crossing Rate and Average Fade Duration in an Interference-Limited Environment. In Proceedings of the IEEE 54th Vehicular Technology Conference. VTC Fall 2001. Proceedings (Cat. No.01CH37211), Atlantic, NJ, USA, 7–11 October 2001; Volume 3, pp. 1608–1611. [Google Scholar] [CrossRef]
  21. Yang, L.; Alouini, M.-S. On the Average Outage Rate and Average Outage Duration of Wireless Communication Systems With Multiple Cochannel Interferers. IEEE Trans. Wirel. Commun. 2004, 3, 1142–1153. [Google Scholar] [CrossRef]
  22. Patel, C.S.; Stüber, G.L.; Pratt, T.G. Statistical Properties of Amplify and Forward Relay Fading Channels. IEEE Trans. Veh. Technol. 2006, 55, 1–9. [Google Scholar] [CrossRef]
  23. Zlatanov, N.; Hadzi-Velkov, Z.; Karagiannidis, G.K. Level Crossing Rate and Average Fade Duration of the Double Nakagami-m Random Process and Application in MIMO Keyhole Fading Channels. IEEE Commun. Lett. 2008, 12, 822–824. [Google Scholar] [CrossRef]
  24. Talha, B.; Patzold, M. On the Statistical Analysis of Equal Gain Combining over Multiple Double Rice Fading Channels in Cooperative Networks. In Proceedings of the 2010 IEEE 72nd Vehicular Technology Conference-Fall, Ottawa, ON, Canada, 6–9 September 2010; pp. 1–5. [Google Scholar] [CrossRef]
  25. Akram, M.I.; Sheikh, A.U.H. On the Second Order Statistics of Non-Isotropic Nakagami Hoyt Mobile to Mobile Fading Channel. AEU-Int. J. Electron. Commun. 2013, 67, 549–556. [Google Scholar] [CrossRef]
  26. Milosevic, N.; Stefanovic, C.; Nikolic, Z.; Bandjur, M.; Stefanovic, M. First- and Second-Order Statistics of Interference-Limited Mobile-to-Mobile Weibull Fading Channel. J. Circuits, Syst. Comput. 2018, 27, 1850168. [Google Scholar] [CrossRef]
  27. Krstic, D.; Głąbowski, M.; Stefanovic, M.; Peric, M. Level Crossing Rate of Ratio of Product of Two Rayleigh and One Nakagami-m Random Variable and of Ratio of Rayleigh and Product of Two Nakagami-m Random Variables. In Proceedings of the 11th International Symposium on Communication Systems, Networks & Digital Signal Processing (CSNDSP), Budapest, Hungary, 18–20 July 2018; pp. 1–6. [Google Scholar] [CrossRef]
  28. Stefanovic, C.; Milovanovic, I.; Panic, S.; Stefanovic, M. LCR and AFD of the Products of Nakagami-m and Nakagami-m Squared Random Variables: Application to Wireless Communications Through Relays. Wirel. Pers. Commun. 2022, 123, 2665–2678. [Google Scholar] [CrossRef]
  29. Mekić, E.; Stefanović, M.; Spalević, P.; Sekulović, N.; Stanković, A. Statistical Analysis of Ratio of Random Variables and Its Application in Performance Analysis of Multihop Wireless Transmissions. Math. Probl. Eng. 2012, 2012, 841092. [Google Scholar] [CrossRef]
  30. Đošić, D.; Milošević, N.; Nikolić, Z.; Dimitrijević, B.; Banđur, M.; Stefanović, M. Statistics of signal to interference ratio process at output of mobile-to-mobile rayleigh fading channel in the presence of cochannel interference. Facta Univ. Ser. Autom. Control Robot. 2017, 16, 185–196. [Google Scholar] [CrossRef]
  31. Pavlović, D.Č.; Sekulović, N.M.; Milovanović, G.V.; Panajotović, A.S.; Stefanović, M.Č.; Popović, Z.J. Statistics for Ratios of Rayleigh, Rician, Nakagami- m, and Weibull Distributed Random Variables. Math. Probl. Eng. 2013, 2013, 252804. [Google Scholar] [CrossRef]
  32. Krstic, D.S.; Nikolic, P.B.; Vulic, I.; Minic, S.; Stefanovic, M.C. Performance of the Product of Three Nakagami-m Random Variables. J. Commun. Softw. Syst. 2020, 16, 122–130. [Google Scholar] [CrossRef]
  33. Sahu, H.K.; Sahu, P.R. Use of Nakagami-m Fading Channel in SSK Modulation and Its Performance Analysis. Wirel. Pers. Commun. 2019, 108, 1261–1273. [Google Scholar] [CrossRef]
  34. Tsan-Ming, W.; Shiuan-Yuan, T. Sum-of-Sinusoids-Based Simulator for Nakagami-m Fading Channels. In Proceedings of the 2003 IEEE 58th Vehicular Technology Conference. VTC 2003-Fall (IEEE Cat. No.03CH37484), Orlando, FL, USA, 6–9 October 2003; pp. 158–162. [Google Scholar] [CrossRef]
  35. Vulić, I.; Krstić, D.; Nikolić, P.; Minic, S.; Stefanović, M. Average Fade Duration of Triple Nakagami- m Random Process and Application in Wireless Relay Communication System. In Proceedings of the 4th International Conference on Smart and Sustainable Technologies (SpliTech), Split, Croatia, 18–21 June 2019; pp. 1–5. [Google Scholar] [CrossRef]
  36. Yang, L.; Hasna, M.O.; Alouini, M.-S. Average Outage Duration of Multihop Communication Systems with Regenerative Relays. IEEE Trans. Wirel. Commun. 2005, 4, 1366–1371. [Google Scholar] [CrossRef]
  37. Asymptotic approximations of integrals: R. Wong, Academic Press, San Diego, 1989. 543 pp. US $69.95, ISBN 0-12-762535-6. Math. Comput. Simul. 1990, 32, 316. [CrossRef]
  38. Gradshteyn, I.S.; Ryzhik, I.M. Table of Integrals, Series, and Products, 5th ed.; Academic Press, Inc.: San Diego, CA, USA, 1994. [Google Scholar]
  39. Akinremi, B.V.; Akintewe, B.; Famuagun, K.S.; Idiong, U.S. On the Application of Fubini’s Theorem in the Integration of Functiions of Two Variables in a Measure Space. Int. J. Adv. Math. Sci. 2013, 1, 78–86. [Google Scholar] [CrossRef]
  40. Yacoub, M.D.; Bautista, J.E.V.; Guerra de Rezende Guedes, L. On Higher Order Statistics of the Nakagami-m Distribution. IEEE Trans. Veh. Technol. 1999, 48, 790–794. [Google Scholar] [CrossRef]
  41. Wong, R.R. Asymptotic Approximations of Integrals; Society for Industrial and Applied Mathematics: Philadelphia, PA, USA, 2001. [Google Scholar]
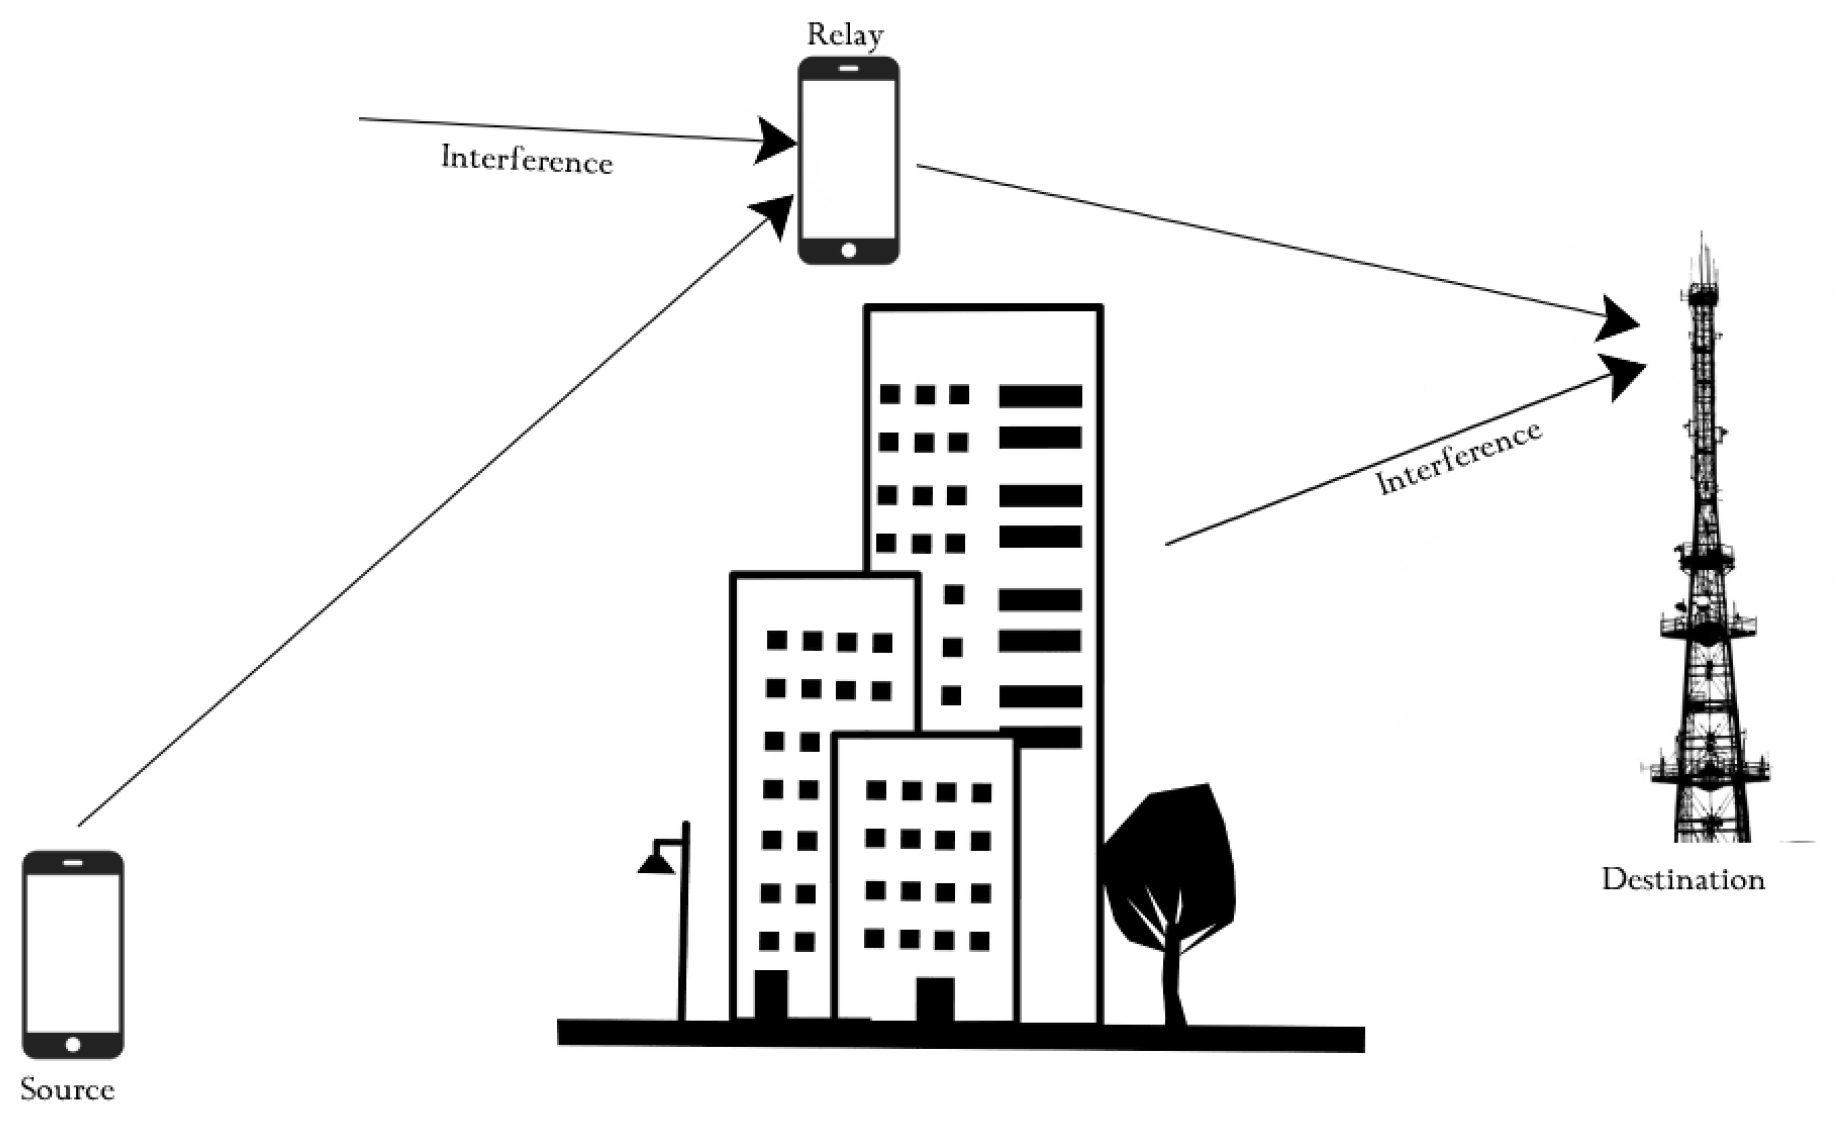
Figure 1. System model.
Sustainability 15 03211 g001
Figure 2. Probability density function for (a) Ωxy = 3, (b) Ωxy = 1, (c) Ωxy = 1/3. Theoretical (line) and simulation (symbol) results.
Sustainability 15 03211 g002
Figure 3. Outage probability as a function of outage threshold, (a) Ωxy = 3, (b) Ωxy = 1, (c) Ωxy = 1/3. Theoretical (line) and simulation (symbol) results.
Sustainability 15 03211 g003
Figure 4. Outage probability as a function of fading severity parameter m.
Sustainability 15 03211 g004
Figure 5. Outage probability as a function of signal-to-interference power.
Sustainability 15 03211 g005
Figure 6. The normalized LCR as a function of threshold z.
Sustainability 15 03211 g006
Figure 7. The normalized LCR as a function of Nakagami-m fading severity parameter m.
Sustainability 15 03211 g007
Figure 8. The approximate normalized LCR as a function of signal-to-interference ratio.
Sustainability 15 03211 g008
Disclaimer/Publisher’s Note: The statements, opinions and data contained in all publications are solely those of the individual author(s) and contributor(s) and not of MDPI and/or the editor(s). MDPI and/or the editor(s) disclaim responsibility for any injury to people or property resulting from any ideas, methods, instructions or products referred to in the content.