Abstract
Quantitative analysis of tomato root water uptake and soil water utilization in the root zone under deficit irrigation is an important tool to improve agricultural water utilization efficiency. In this study, three different deficit irrigation levels were set at the flowering and fruit development stage (Stage I) and the fruit-ripening stage (Stage II), respectively. The Hydrus-1D model and field data were used to analyze the effects of deficit irrigation on tomato root growth, soil water uptake and utilization in the root zone. The results showed that deficit irrigation could reduce the total root length density of water-absorbed roots but increase the water-absorbed root length density of the underlying soil (30–60 cm). Moderate and severe water deficits at Stage II increased the water-absorbed root length density of the underlying soil by 0.10–6.26% and 2.12–11.71% compared with a mild water deficit. Considering tomato root growth, the Hydrus-1D model can improve the accuracy of soil moisture simulation. The main water absorption zone of tomato roots was 0–30 cm. Compared with full irrigation, the ratio of water absorption by the underlying root system (30–60 cm) to the total water absorption of the profile (0–60 cm) increased by 2.16–2.82% and 5.34–6.34% due to mild and moderate water deficits at Stage I. At Stage I and Stage II, a water deficit could reduce soil evaporation. T3 had the highest water use efficiency in two years, which was 24.07% (T9) and 20.47% (T8) higher than the lowest value, respectively. The optimal deficit irrigation scheme under this experiment condition is as follows: the soil water content was 70–90% θf (field capacity) at Stage I and was 40–60% θf at Stage II (T3).
1. Introduction
Water resource scarcity has become one of the main factors restricting agricultural production, ecological restoration and industrial development [1,2,3]. Facility agriculture has developed rapidly at home and abroad in recent years due to its high utilization rate of light, heat and other resources and relatively controllable environment [4,5]. However, in arid and semi-arid areas, irrigation is the main water source for facility crops, and excessive irrigation will change the law of water migration in the soil, resulting in an increase in the proportion of surface evaporation or deep leakage in the total water consumption, thus reducing the water utilization efficiency [6,7]. Deficit irrigation, as one of the most effective measures to alleviate water shortages, is designed to improve water use efficiency through the rational allocation of limited water according to the different water demands of crops at different growth stages [8,9]. Deficit irrigation will change the distribution of soil water [10], thus affecting the absorption and utilization of soil water by crops. It is meaningful to study the absorption and utilization of water by facility crops under deficit drip irrigation to guide their scientific and reasonable irrigation.
Tomatoes are very popular among humans due to their rich nutritional value and antioxidant properties [11]. However, tomatoes are also a crop with a high water demand [12]. At present, people mainly rely on experience to irrigate greenhouse tomatoes, which not only causes the waste of water resources but also reduces the water use efficiency. Moreover, their yield has not been significantly increased [13], so it is urgently necessary to carry out reasonable deficit irrigation for greenhouse tomatoes. Soil water can promote the absorption of nutrients by crops, and the water and nutrients together affect the growth of roots and the above-ground parts of crops [14,15]. Studies showed that the irrigation level has a significant impact on crop root growth [16]. With a decrease in the irrigation level, the tomato root length, root surface area, root volume, root length density and root weight density all show a decreasing trend [17]. Existing studies have mainly focused on the effects of different irrigation levels and methods on the characteristic parameters of tomato whole roots [18,19], while there are few studies on the distribution of tomato roots along the soil profile under deficit drip irrigation [20], which needs further research.
Root water uptake (RWU) is a complex and important physiological process that is jointly affected by crop growth, soil and meteorological factors [21]. Clement et al. [22] concluded that deep-rooted crops have the advantage of obtaining deep soil water under drought conditions by comparing the water absorption status of the roots of different types of perennial crops. Wang et al. [23] defined the water content corresponding to the 95% RWU of the control treatment as the critical water content and concluded that the critical water content was different in different growth stages of winter wheat. In addition, the absolute RWU of different types of soil was affected by ET0 [24]. At present, the analysis methods of RWU include sequential daily soil water balance, proximal sensing and model simulation [25]; model simulation is a convenient, rapid and cost-efficient option. The RWU model can be divided into micro and macro methods [26]. The micro method is based on a physical mechanism and built on a single root scale. This method assumes that the roots are infinitely extending cylinders, that the water absorption characteristics are constant along the length of the roots and that the radius is consistent, which is inconsistent with the actual situation and very difficult to use in practical applications [27,28]. However, the macro model of RWU takes the root–soil system as a whole and has more advantages than the micro model in practical applications [29].
The Hydrus-1D software package sets several modules on the one-dimensional scale, such as the soil water, heat, solute migration and macro model of crop RWU, and has a variety of boundary conditions and a large number of parameter databases for reference, which can be used to simulate the law of soil water migration under drip irrigation conditions [30]. Results show that the Hydrus-1D model can be used as an effective tool to simulate soil water and salt dynamics in farmland, and the predicted values are in good agreement with the observed values [31,32,33]. Soil hydraulic parameters obtained using Hydrus-1D inversion are more accurate and can be used to further simulate RWU [34]. Li et al. [35] used the Hydrus-1D model to evaluate the effects of land use change on each component of the soil water balance in orchards on the Loess Plateau, and they concluded that, compared with cultivated land and young apple orchards (stand age < 10 years), the evapotranspiration of mature apple orchards (stand age > 20 years) increased, while the deep leakage was almost zero. It has been reported that studies using the Hydrus-1D model to simulate soil water migration mainly focus on maize, wheat and other field crops [1,36], while there are few studies on greenhouse tomatoes with drip irrigation under plastic film.
The root system is an important channel connecting the soil with the above-ground part of the crop. In order to simplify the model simulation, existing studies rarely consider the growth of crop roots when using the Hydrus-1D model to simulate soil water migration [37]. However, the root is an important organ for water absorption in crops, and deficit irrigation will affect the growth of the crop root system [38] and thus affect the water absorption and utilization of crops. Based on this, the Hydrus-1D model was used to simulate the water absorption and utilization of greenhouse tomatoes with drip irrigation under plastic film. The purpose of this study was to: (1) evaluate the performance of the Hydrus-1D model to simulate the soil water movement of greenhouse tomatoes by innovatively considering root growth, and, based on this, analyze the effects of deficit drip irrigation on the spatio-temporal variation in the RWU of greenhouse tomatoes; (2) explore the effects of different deficit irrigation schemes on soil water balance components in the root zone and the water use efficiency of greenhouse tomatoes, and to develop the best deficit irrigation schemes under the experimental conditions based on the simulation results and measured data. It is of great importance to develop efficient and water-saving facility agriculture to alleviate water shortages.
2. Materials and Methods
2.1. Study Site and Experimental Design
The study area is located in Liujiapu Tomato Industrial Park of Xiaodian District (37°64′ N, 112°48′ E), Taiyuan, Shanxi Province, China. The experimental area belongs to a temperate, continental monsoon-arid climate area. The annual average temperature, sunshine duration and evaporation are 9.5 °C, 2675.8 h and 1812.7 mm, respectively. The rainfall totals 468.4 mm, and the frost-free period is 202 d. The basic physical and chemical characteristics of soil in the experimental area are shown in Table 1.

Table 1.
Basic properties of different soil layers.
A total of nine plots were used in the experiment, and each plot was 7.5 m long and 6 m wide. The experiment adopted drip irrigation under plastic mulch. Two rows of tomatoes were planted on each ridge, and two drip irrigation strips were placed close to the inside of the tomato. The spacing of tomato rows and plants was 60 cm and 50 cm, respectively. The ground was fully covered with black mulch, and the width and thickness of the mulch film were 1.5 m and 0.008 mm, respectively. An impervious membrane 60 cm deep was placed between two adjacent plots to prevent water from flowing laterally. Before plowing, 180 kg/hm2 nitrogen fertilizer (urea: WN ≥ 46.4%), 180 kg/hm2 potassium fertilizer (potassium chloride: WK2O ≥ 57%), 200 kg/hm2 phosphate fertilizer (calcium magnesium phosphate: WP2O5 ≥ 15.0%) and 20,000 kg/hm2 organic fertilizer were applied as base fertilizer. Amounts of 60 kg/hm2 nitrogen fertilizer and 60 kg/hm2 potassium fertilizer were applied as topdressing to the soil through a drip irrigation system with water at the fruit development stages of the first and third ears, respectively.
The tomato variety “Shou Yan PT326” was transplanted in the three-leaf stage (10 May 2020; 12 May 2021); the growth period included the seedling stage (27 d in 2020; 34 d in 2021), flowering and fruiting development stage (Stage I: 65 d in 2020; 68 d in 2021) and fruit-ripening stage (Stage II: 37 d in 2020; 29 d in 2021). According to the upper and lower limits of irrigation, combined with the tomato’s sensitivity to water, three deficit levels were utilized at Stage I and Stage II, with a total of nine deficit treatments. Table 2 shows the information on irrigation lower and upper limits at Stage I and Stage II, where 70–90% θf indicates that irrigation began when the measured soil water content (SWC) was 70% of the field water capacity and the irrigation reached 90% of the field water capacity, and the other levels are similar. To ensure the survival rate of tomato seedlings, 20 mm and 25 mm of planting water were irrigated in 2020 and 2021, respectively. The cumulative irrigation volume, maximum and minimum temperatures and reference crop evapotranspiration (ET0) in two years are shown in Figure 1.
Table 2.
Irrigation of lower and upper limits of tomato in the two consecutive years.
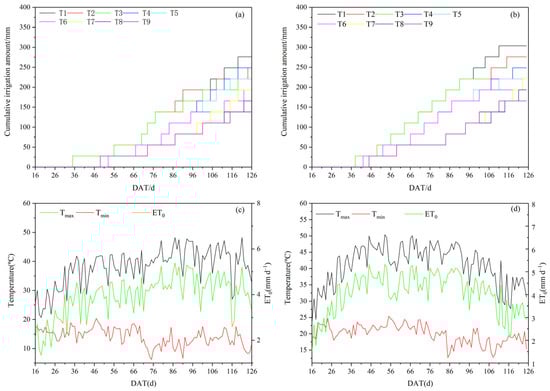
Figure 1.
Cumulative irrigation volume, temperature and reference crop evapotranspiration (ET0). Where, (a,b) represent cumulative irrigation volume for each treatment in the 2020 and 2021 growing seasons, respectively. Meanwhile, (c,d) represent temperature and ET0 in the 2020 and 2021 growing seasons, respectively.
2.2. Measurement and Analysis
We used a data logger (Hobo; Onset Computer, Pocasset, MA, USA) at 1 h intervals to measure the air temperature in the greenhouse. SWC was measured weekly using time-domain reflectometry (TRIME, IMKO, Ettlingen, Germany) at a vertical interval of 10 cm (0–60 cm) and a distance of 15 cm from the plant. At the end of the growth period of the tomato, 3 representative plants were selected from each plot, and a root drill with a diameter of 5 cm was used to sample them at a vertical interval of 10 cm (0–60 cm) and a distance of 15 cm from the plant. After sampling, we washed the roots with a sieve with a diameter of 0.5 mm and then scanned them with Epson Perfection. Root analysis software (WinRHIZO version 5.0) was used for the analysis. The water-absorbed root length density (RLD, cm cm−3) with a diameter of less than 2 mm was calculated by dividing the root length by the soil volume. After leaving 4 ears of fruit for each tomato plant, the tomato yield of each treatment was measured with an electronic balance with an accuracy level of 0.05 kg. Tomato water use efficiency (WUE) was calculated as follows:
where Y represents tomato yield (kg hm−2), and E and RWU represent water evaporation and root water uptake (m3 hm−2), respectively, which were derived from the Hydrus-1D simulation results.
2.3. Model Description
The vertical movement of soil water was mainly carried out in the vascular zone [39]. Therefore, only the one-dimensional vertical movement of soil water is considered in this study. The Hydrus-1D (Version 4.17) model can simulate farmland soil water movement and crop RWU on a one-dimensional scale.
2.3.1. Water Flow
The governing equation for water flow was a modified form of the 1D Richards equation, as follows [32]:
where θ represents the soil volumetric water content (cm3 cm−3), t represents the time (day), h represents the soil water pressure head (cm), z represents the vertical distance (cm), K represents the hydraulic conductivity coefficient (cm day−1) and s(z,t) represents the RWU rate (cm3 cm−3 d−1).
The van Genuchten–Mualem model in Hydrus-1D was used to fit the soil moisture characteristic curve, and its calculation formula was as follows:
where θs and θr are the saturated and residual volumetric water content (cm3 cm−3); α, n and m are the empirically fitted parameters, m = 1 − 1/n; Ks is the saturated water conductivity (cm d−1); Se is the dimensionless relative water content; and l is the tortuosity parameter, with the average value usually 0.5.
2.3.2. Reference Crop Evapotranspiration (ET0)
ET0 was calculated using the Hargreaves–Samani (HS) model recommended by FAO56 [40], and its formula was as follows:
where Ra is astronomical radiation (MJ m−2 d−1) [41]; λ is the latent heat of the vaporization of water, the average value is usually 2.45 MJ kg−1; mean temperature (Tmean, °C) is the average value of the maximum temperature (Tmax, °C) and minimum temperature (Tmin, °C); kRs-HS is the temperature coefficient, and the commonly used value is 0.17 °C−0.5 [42].
2.3.3. RWU
In the equation of soil water migration, the source and sink term S(z,t) is the amount of water absorbed by plants per unit volume of soil, which can be described by the Feddes model [43] as follows:
where γ(h) is the water stress function; h1 is a plant’s anaerobic growing point pressure head (cm); h2 is the maximum pressure head (cm) when plants absorb water at the maximum rate; h3high and h3low are the minimum pressure heads (cm) when the potential transpiration rate is 0.5 cm d−1 and 0.1 cm d−1, respectively; and h4 is the pressure water head (cm) at the growth wilting point of plants. The recommended values for tomato in the Hydrus-1D model were adopted, h1, h2, h3high, h3low and h4 are −10 cm, −25 cm, −800 cm, −1500 cm and −8000 cm, respectively. b(z) is a standardized water-absorbed root length density distribution function (cm cm−3), b′(z) is the measured water-absorbed root length density distribution function (cm cm−3), z is the soil depth (cm) and Tp is the potential transpiration rate (mm d−1).
2.3.4. Initial and Boundary Conditions
In this study, the simulated soil depth of 60 cm was divided into 61 node grids. As drip irrigation under plastic film was used in this study, the upper boundary was set as “Variable Pressure Head/Flux”. The groundwater level (>5 m) was far from the lower boundary, so the lower boundary was set as “Free Drainage”, the initial conditions of each treatment were set as the measured “water content” at the beginning of the simulation and the irrigation amount was taken as the variable boundary condition.
2.3.5. Model Calibration and Validation
The treatments T4 and T5 were used to calibrate the model over the two years. These treatments are representative because they have moderate irrigation levels compared to other treatments. The remaining treatments were used to verify the model. Using the inverse solution method in the Hydrus-1D model, the soil hydraulic parameters (θr, θs, α, n, Ks) were optimized, and the initial soil hydraulic parameters were determined according to the soil texture and bulk density. Since the soil particles at 0–20 cm and 20–40 cm were similar in size and texture, the whole soil region was divided into 0–40 cm and 40–60 cm for simulation. Table 3 shows the optimization results for soil hydraulic parameters.
Table 3.
Soil hydraulic parameters after calibration.
The root mean square error (RMSE), mean relative error (RE), mean absolute error (MAE) and determination coefficient (R2) were used to evaluate the precision of the simulation results. The calculation formulas for RMSE, RE, MAE and R2 were as follows:
where Pi is the predicted SWC (cm3 cm−3), Oi is the observed SWC (cm3 cm−3), is the average observed SWC (cm3 cm−3) and k is the number of points measured.
2.4. Statistical Analysis
IBM SPSS Statistics 26 was used for all statistical analyses, and the path coefficient was calculated in Excel.
3. Results
3.1. Root Growth of Greenhouse Tomato
3.1.1. Distribution of Tomato Water-Absorbed Root Length Density
Figure 2 shows the effect of deficit irrigation on greenhouse tomato water-absorbed root length density. The results of the two-year experiment showed that deficit irrigation could reduce the total water-absorbed root length density at 0–60 cm in tomatoes, and the total water-absorbed root length density at T1 was the highest, which was 48.69% and 47.14% higher than the lowest value (T9), respectively. The root system was mainly distributed in the 0–30 cm soil layer, and the water-absorbed root length density in the 0–30 cm soil layer accounted for 67.11–94.91% of the total water-absorbed root length density. The water-absorbed root length density in the 0–30 cm soil layer was 2.13–11.85% and 7.46–19.17% higher than that calculated under the mild and moderate water deficits at the end of the growing period due to full irrigation at Stage I. Deficit irrigation was beneficial to increase the water-absorbed root length density of the underlying soil (30–60 cm), and the moderate and severe water deficits increased the water-absorbed root length density by 0.10–6.67% and 2.12–11.71%, respectively, compared with the mild water deficit at Stage II.
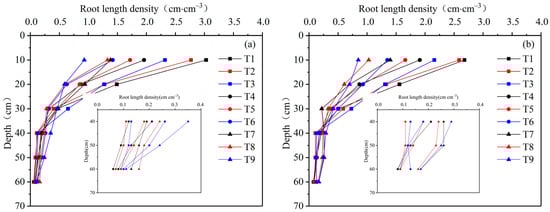
Figure 2.
Distribution of the water-absorbed root length density of tomato in 2020 (a) and 2021 (b) under deficit irrigation. The graph in the figure is an enlargement of the water-absorbed root length density of the underlying soil.
3.1.2. Distribution Function of Tomato Water-Absorbed Root Length Density
After fitting the measured water-absorbed root length density of each treatment, it decreased exponentially along the soil depth, so the standardized distribution function of water-absorbed root length density was as follows:
The fitting parameters of the standardized water-absorbed root length density distribution function for each treatment are shown in Table 4. The determination coefficient (R2) of the distribution function was above 0.775, indicating a good fitting effect. According to Figure 2 and Table 4, the water-absorbed root length density gradually decreased with the increase in soil depth. The larger the value “a” is, the more concentrated the root system was on the soil surface. The value “a” decreased with the increase in the deficit degree in each growth period. The smaller the value “c”, the more evenly distributed the tomato roots were along the soil depth, and deficit irrigation caused the roots to be more evenly distributed in the soil. The “c” value of T9 was the lowest, at 0.038 and 0.033 for 2020 and 2021, respectively.
Table 4.
The standardized water-absorbed root length density distribution function fitting parameters.
3.2. Evaluation of Model Performance
The calibration and validation results of the simulation of SWC using the Hydrus-1D model are shown in Figure 3 and Figure 4. The calibration results are taken as an example for the T4 treatment in 2020. The predicted values are in good agreement with the observed values, the R2 is within 0.7751–0.9178, the RMSE at different soil depths is lower than 0.0227 cm3 cm−3, and the MAE is within 0.0067–0.0181 cm3 cm−3. The RE was no higher than 4.07%, suggesting that the Hydrus-1D model could be used to predict soil moisture in deficit drip irrigation. In addition, the error between the predicted and observed SWC in the 0–10 cm soil layer was slightly larger than that in the 10–60 cm soil layer.
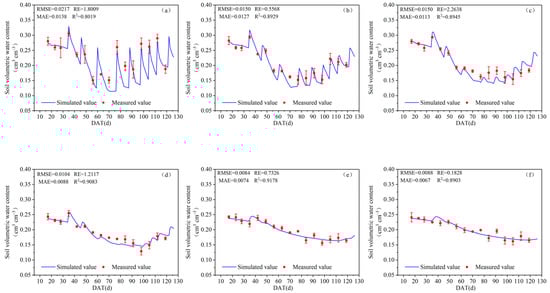
Figure 3.
Predicted and observed values of SWC and related model evaluation indexes by T4 in 2020. Where, (a–f) represent 0–10 cm, 10–20 cm, 20–30 cm, 30–40 cm, 40–50 cm and 50–60 cm soil layers, respectively.
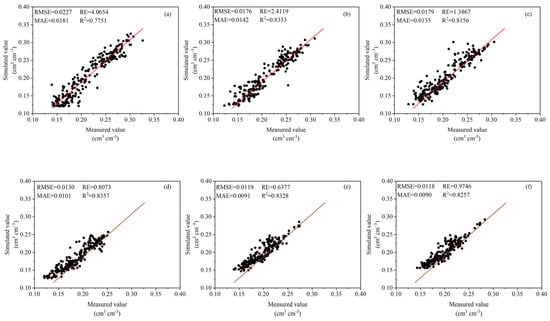
Figure 4.
Predicted and observed values of SWC for validation at different soil depths and related model evaluation indexes. Where, (a–f) represent 0–10 cm, 10–20 cm, 20–30 cm, 30–40 cm, 40–50 cm and 50–60 cm soil layers, respectively.
3.3. Spatio-Temporal Distribution of RWU under Deficit Irrigation
As can be seen from Figure 5, the RWU rate and range first increased and then decreased with the progression of the growth period, and the RWU rate reached its maximum 30–50 d after transplanting. The RWU rate was higher in the 0–30 cm soil layer and accounted for more than 90% of the whole soil depth (0–60 cm) during both seasons. With the increase in the deficit degree, the ratio of RWU in the 30–60 cm soil layer to the whole soil depth gradually increased. Compared with full irrigation at Stage I, the ratio of RWU in the 30–60 cm soil layer increased by 2.16–2.82% and 5.34–6.34% under the mild and moderate water deficits, respectively. However, there was little difference between the ratio of RWU of the 30–60 cm soil layer under the moderate and severe water deficits at Stage II and that under the mild water deficit. In addition, after transplanting at 60–70 d in 2020 and 70–80 d in 2021, the RWU rate in the 0–20 cm soil layer was almost zero due to the moderate water deficit at Stage I. This may be because this is a critical period for fruit expansion, and a moderate water deficit will lead to a decrease in SWC in the 0–20 cm soil layer. The RWU of the 20–35 cm soil layer was higher than that of the 0–20 cm soil layer.
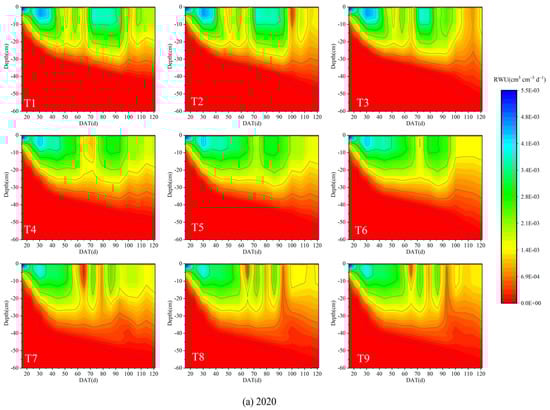
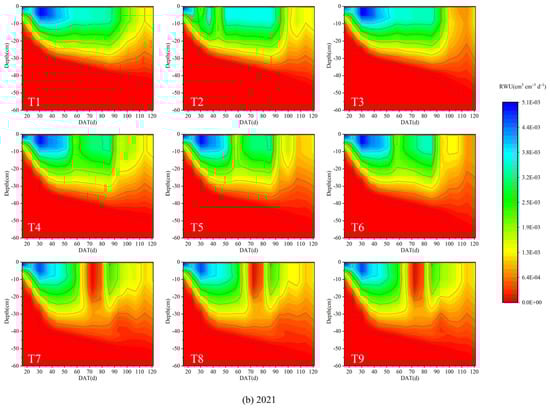
Figure 5.
The dynamics of the RWU rate of tomato at different soil depths in 2020 (a) and 2021 (b).
3.4. Soil Water Balance in the Root Zone and Water Use Efficiency
Based on the simulation results, the RWU, soil evaporation (E) and soil water change (ΔW) were calculated during both seasons (Table 5). The results showed that the total RWU of the tomato decreased with the increase in the deficit degree, and the RWU of T1 was the highest, at 28.74% and 35.33% higher than the lowest value (T9) in 2020 and 2021, respectively. Soil evaporation accounted for 3.44–5.56% of the total evapotranspiration due to the seedling emergence holes and the breakage of the plastic film. Soil evaporation decreased with the increase in the water deficit degree. Compared with full irrigation, soil evaporation decreased by 1.58–23.47% and 31.41–44.05% under the mild and moderate water deficits at Stage I, respectively. The moderate and severe water deficits at Stage II reduced soil evaporation by 3.59–20.80% and 6.35–37.08% compared with the mild water deficit. The soil water variation at T9 in 2020 and T6 in 2021 was the largest, with decreases of 72.98 mm and 71.57 mm, respectively.
Table 5.
Soil water balance in tomato root zone and water use efficiency under deficit irrigation.
Combined with the calculation results in Figure 5 and Table 5, it can be seen that when the RWU at Stage I (2020, T1 and T7) and Stage II (2020, T1 and T2) decreased by around 33%, the tomato yield decreased by 30.0% and 1.3%, respectively, which indicates that Stage I is the key water demand period for the formation of the tomato yield. Under the mild water deficit at Stage II, the WUE of tomato first decreased and then increased with the increase in the water deficit degree at Stage I, and the maximum value of full irrigation was 9.35% and 12.41% higher than the minimum value under a mild water deficit in 2020 and 2021, respectively. When the water deficit was moderate and severe at Stage II, the WUE of tomato decreased with the increase in the water deficit at Stage I. With the exception of T8 and T9, the WUE of tomato showed an increasing trend with the increase in the water deficit degree at Stage II. The WUE of T3 reached the maximum value in the two years, at 24.07% (T9) and 20.47% (T8) higher than the lowest value in 2020 and 2021, respectively.
4. Discussion
4.1. Effects of Deficit Irrigation on Tomato Root Growth
The root is an important organ for crops to absorb water and nutrients. Existing studies have shown that with an increase in irrigation level, the whole root’s characteristic parameters, such as the root length, root surface area, root volume, root length density and root weight density of the tomato, also increase, but they have no significant effect on the average root diameter [17]. This study also concluded that deficit irrigation could reduce the total water-absorbed root length density of the tomato; the total water-absorbed root length density of T1 was the highest, at 48.69% and 47.14% higher than the lowest value (T9) in 2020 and 2021, respectively. The reason for this may be that an increased irrigation level would increase the space for the root system to absorb water and nutrients [44].
In this study, it was concluded that deficit irrigation would cause tomato roots to be deeply rooted and increase the water-absorbed root length density at 30–60 cm, which was consistent with the conclusions of the deficit irrigation experiments conducted by Flynn [45] and Sharma [46] on corn and melon, respectively. The reason for this may be that, compared with full irrigation, deficit irrigation will cause crop roots to distribute more photocontracted substances so that they can absorb water in deeper soil. In addition, the availability of deep soil water can maintain root turgor pressure and promote root growth [47]. In addition, it was found in this study that the depth of tomato roots decreased exponentially along the soil layer, which was different from the study result of Zhao et al. [48]. The reason for this may be that the irrigation method in their study was medium–deep irrigation, while this study used drip irrigation under plastic film.
4.2. Simulated Performance of Hydrus-1D
The Hydrus-1D model was used to simulate the soil water movement under drip irrigation under plastic film in this study. The simulated results were calibrated and verified using the observed SWC. The minimum R2 value was 0.7751, the maximum RMSE, MAE and RE values in terms of the predicted and observed values at different soil depths were 0.0227 cm3 cm−3, 0.0181 cm3 cm−3 and 4.06%, respectively, and the goodness of fit index was within the range of different research results [31,39,49,50], suggesting that the Hydrus-1D model can be used to simulate soil water movement under submembrane deficit drip irrigation. Ling et al. [51] used Hydrus-1D to simulate the soil moisture of rubber trees in Xishuangbanna and found that the simulation results for the lower layer (70–130 cm) were better than those for the upper layer (0–40 cm), which was similar to the simulation errors of the 0–10 cm layer being slightly larger than those of the 10–60 cm layer obtained in this study. The reasons are as follows: the plastic film formed a stable air layer with the soil surface, which could effectively inhibit water vapor exchange; at the same time, the air layer could suppress the nighttime long-wave radiation and weaken the sensible and latent heat exchange between the soil and atmosphere [52]. Therefore, the mulching film has a great influence on the water and heat fluctuation of the surface soil [53,54]. In addition, most roots are distributed in the surface of the soil, which has a significant impact on soil moisture. With the increase in soil depth, the density of the root length gradually decreases, and the variation range of soil moisture is small [55].
In order to simplify the model simulation process, the Hydrus-1D model was used to simulate soil water movement without considering root growth. The simulation result for the SWC of the greenhouse tomato, obtained using the Hydrus-1D model without considering root growth, is shown in Figure 6. Combined with Figure 4 and Figure 6, except for the RE of 0–10 cm, the RMSE, RE and MAE values for the predicted and observed SWC of each soil layer with root growth considered were all smaller than the simulation results without considering root growth, while R2 showed the opposite trend. The results showed that the simulation effect of the Hydrus-1D model could be further improved by considering tomato root growth under membrane deficit drip irrigation. The reason may be that the root growth depth of crops in different growth stages under deficit irrigation was different, which led to changes in the range of RWU and the distribution of soil water, and the simulation accuracy of the model was further affected [56].
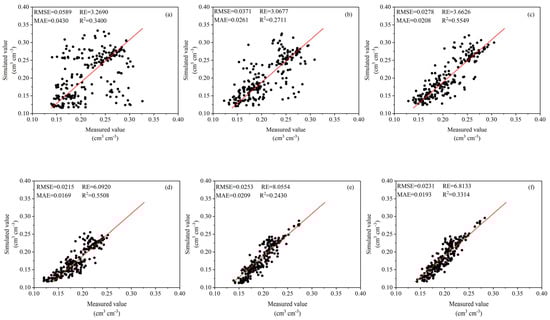
Figure 6.
The predicted and observed values of SWC without considering root growth and the related model evaluation indexes. Where, (a–f) represent 0–10 cm, 10–20 cm, 20–30 cm, 30–40 cm, 40–50 cm and 50–60 cm soil layers, respectively.
4.3. Relationship between RWU, Root Distribution of Greenhouse Tomato and Soil Moisture
The root is an important organ for plants to obtain soil water. The distribution characteristics of roots mainly depend on the spatial distribution of soil water and the plasticity of the root system itself, which determine the source of the water uptake of plants to a certain extent [57,58], and the RWU further affects the soil moisture in the root zone. Wu et al. [24] showed that the atmospheric evaporation force and leaf area index had no significant influence on the dynamic change in the RWU rate, while the distribution shape of the roots had a significant influence on the RWU rate. In order to further quantify the relationship among the RWU rate, root growth and SWC, this study took the RWU rate of different soil layers at the end of the growth period of a greenhouse tomato (DAT = 121 d) as the dependent variable and the root distribution and SWC as the independent variables to conduct path analysis. The results showed that the correlation between them reached an extremely significant level (p < 0.01). The direct path coefficient of SWC on the RWU rate (0.697) was greater than that of root growth (0.269), the root growth indirectly affected the RWU rate by affecting the SWC, and the indirect path coefficient was 0.451.
4.4. Effects of Deficit Irrigation on the Proportion of Evapotranspiration in Drip Irrigation under Plastic Film
Under the conditions of farmland mulching, due to the existence of irrigation holes, seedling holes and field management, the mulching rate is unable to reach 100%, and the mulching opening rate directly affects the evaporation of soil water [59]. In this study, Hydrus-1D was used to simulate the soil water absorption and utilization of a greenhouse tomato. The results showed that soil evaporation under different drip irrigation treatments accounted for 3.44–5.56% of the total evapotranspiration. In addition, this study showed that soil evaporation in the tomato root zone could be reduced by a water deficit during Stage I and Stage II. However, Zhang et al. [60] estimated the evapotranspiration when processing tomatoes under film using the SIMDualKc model and concluded that the ratio of surface evaporation to total evapotranspiration under deficit irrigation was approximately 2% higher than that under full irrigation. The reason for this may be that its mulch coverage rate is only around 70%, while, in this study, we used a full film coverage, which can reduce the water exchange between the soil and atmosphere and enable more water to be absorbed and utilized by the roots [61].
5. Conclusions
The root growth and RWU were mainly distributed in the 0–30 cm soil layer, and the water-absorbed root length density in the 0–30 cm soil layer accounted for 67.11–94.91% of the total water-absorbed root length density. Deficit irrigation was beneficial to the deeper parts of tomato roots and their uniform distribution along the soil layer, and it increased the water-absorbed root length density in the underlying soil. Considering that tomato root growth can improve the simulation accuracy of soil water movement using Hydrus-1D under deficit irrigation, the effects of deficit irrigation on RWU and soil water balance in the root zone can be accurately studied. Compared with full irrigation at Stage I, the ratio of RWU in the 30–60 cm soil layer to the whole soil depth increased by 2.16–2.82% and 5.34–6.34% under mild and moderate water deficits, respectively. However, there was little difference between the ratio of RWU in the 30–60 cm soil layer under moderate and severe water deficits and a mild water deficit at Stage II. A water deficit at Stage I and Stage II can reduce ineffective water consumption in the tomato root zone soil. The irrigation levels of 70–90% θf at Stage I and 40–60% θf at Stage II (T3) reached the maximum water use efficiency in the two years; these values were higher than the lowest values of 24.07% (T9) and 20.47% (T8) in 2020 and 2021, respectively, and represent the best deficit irrigation scheme under the conditions of this experiment. The results of this study play an important role in exploring the RWU mechanism of deficit irrigation and improving the utilization efficiency of water resources. In the future, it will be valuable to combine the water stable isotope technology with the Hydrus model to analyze the effects of deficit irrigation on root water uptake.
Author Contributions
Edited the original draft, X.L.; reviewed and edited the draft, J.M., X.S. and L.Z.; investigation, R.C. and J.A.; funding acquisition, J.M., L.Z. and X.L. All authors have read and agreed to the published version of the manuscript.
Funding
This research was financially supported by the National Natural Science Foundation of China (52079085, 52109061), the Key Research and Development Projects of Shanxi Province (201903D211011), and the Scientific and Technological Innovation Programs of Higher Education Institutions in Shanxi Province (2022Y180).
Institutional Review Board Statement
Not applicable.
Informed Consent Statement
Not applicable.
Data Availability Statement
Not applicable.
Conflicts of Interest
The authors declare no conflict of interest.
References
- Yi, J.; Li, H.J.; Zhao, Y.; Shao, M.A.; Zhang, H.L.; Liu, M.X. Assessing soil water balance to optimize irrigation schedules of flood-irrigated maize fields with different cultivation histories in the arid region. Agric. Water Manag. 2022, 265, 107543. [Google Scholar] [CrossRef]
- Xu, X.; Jiang, Y.; Liu, M.H.; Huang, Q.A.; Huang, G.H. Modeling and assessing agrohydrological processes and irrigation water saving in the middle Heihe River basin. Agric. Water Manag. 2019, 211, 152–164. [Google Scholar] [CrossRef]
- Painagan, M.S.; Ella, V.B. Modeling the impact of deficit irrigation on corn production. Sustainability 2022, 14, 10401. [Google Scholar] [CrossRef]
- Rabbi, B.; Chen, Z.H.; Sethuvenkatraman, S. Protected cropping in warm climates: A review of humidity control and cooling methods. Energies 2019, 12, 2737. [Google Scholar] [CrossRef]
- Geng, W.C.; Ma, Y.; Zhang, Y.C.; Zhu, F. Research progress in soil health regulation technology for protected agriculture. Chin. J. Eco-Agric. 2022, 30, 1973–1984. [Google Scholar]
- Li, R.F.; Ma, J.J.; Sun, X.H.; Guo, X.H.; Zheng, L.J. Simulation of soil water and heat flow under plastic mulching and different ridge patterns. Agriculture 2021, 11, 1099. [Google Scholar] [CrossRef]
- Han, M.; Zhao, C.Y.; Feng, G.; Yan, Y.Y.; Sheng, Y. Evaluating the effects of mulch and irrigation amount on soil water distribution and root zone water balance using HYDRUS-2D. Water 2015, 7, 2622–2640. [Google Scholar] [CrossRef]
- Du, T.S.; Kang, S.Z.; Zhang, J.H.; Davies, W.J. Deficit irrigation and sustainable water-resource strategies in agriculture for China’s food security. J. Exp. Bot. 2015, 66, 2253–2269. [Google Scholar] [CrossRef]
- Zhou, H.P.; Chen, J.L.; Wang, F.; Li, X.J.; Génard, M.; Kang, S.Z. An integrated irrigation strategy for water-saving and quality-improving of cash crops: Theory and practice in China. Agric. Water Manag. 2020, 241, 106331. [Google Scholar] [CrossRef]
- Liang, S.S.; Li, L.; An, P.; Chen, S.Y.; Shao, L.W.; Zhang, X.Y. Spatial soil water and nutrient distribution affecting the water productivity of winter wheat. Agric. Water Manag. 2021, 256, 107114. [Google Scholar] [CrossRef]
- Gorni, P.H.; Lima, G.R.; Pereira, L.M.O.; Spera, K.D.; Lapazc, A.M.; Pacheco, A.C. Increasing plant performance, fruit production and nutritional value of tomato through foliar applied rutin. Sci. Hortic. 2022, 294, 110755. [Google Scholar] [CrossRef]
- Guo, L.J.; Cao, H.X.; Helgason, W.D.; Yang, H.; Wu, X.Y.; Li, H.Z. Effect of drip-line layout and irrigation amount on yield, irrigation water use efficiency, and quality of short-season tomato in Northwest China. Agric. Water Manag. 2022, 270, 107731. [Google Scholar] [CrossRef]
- Zhu, J.W.; Zhao, C.J.; Guo, R.R.; Zhou, L.L. Water-saving irrigation regime for winter wheat in county areas under water resources constraints. Trans. CSAE 2021, 37, 92–100. [Google Scholar]
- Mai, T.H.; Schnepf, A.; Vereecken, H.; Vanderborght, J. Continuum multiscale model of root water and nutrient uptake from soil with explicit consideration of the 3D root architecture and the rhizosphere gradients. Plant Soil 2019, 439, 273–292. [Google Scholar] [CrossRef]
- Besharat, S.; Nazemi, A.H.; Sadraddini, A.A. Parametric modeling of root length density and root water uptake in unsaturated soil. Turk. J. Agric. For. 2010, 34, 439–449. [Google Scholar]
- Wang, X.K.; Yun, J.; Shi, P.; Li, Z.B.; Li, P.; Xing, Y.Y. Root growth, fruit yield and water use efficiency of greenhouse grown tomato under different irrigation regimes and nitrogen levels. J. Plant Growth Regul. 2018, 38, 400–415. [Google Scholar] [CrossRef]
- Shabbir, A.; Mao, H.P.; Ullah, I.; Buttar, N.A.; Ajmal, M.; Solangi, K.A. Improving water use efficiency by optimizing the root distribution patterns under varying drip emitter density and drought stress for cherry tomato. Agronomy 2021, 11, 3. [Google Scholar] [CrossRef]
- Liu, R.; Yang, Y.; Wang, Y.S.; Wang, X.C.; Rengel, Z.; Zhang, W.J.; Shu, L.Z. Alternate partial root-zone drip irrigation with nitrogen fertigation promoted tomato growth, water and fertilizer-nitrogen use efficiency. Agric. Water Manag. 2020, 233, 106049. [Google Scholar] [CrossRef]
- Ullah, I.; Mao, H.P.; Rasool, G.; Gao, H.Y.; Javed, Q.; Sarwar, A.; Khan, M.I. Effect of deficit irrigation and reduced N fertilization on plant growth, root morphology and water use efficiency of tomato grown in soilless culture. Agronomy 2021, 11, 228. [Google Scholar] [CrossRef]
- Ge, J.K.; Ping, Y.L.; Gong, X.W.; Wang, L.; Xing, Q.C.; Zhang, L.; Liu, H.H. The Effects of water deficit on root growth and water uptake of mulched greenhouse tomato under drip irrigation. J. Irrig. Drain. 2022, 41, 1–9. [Google Scholar]
- Cao, X.Q.; Yang, P.L.; Engel, B.A.; Li, P.F. The effects of rainfall and irrigation on cherry root water uptake under drip irrigation. Agric. Water Manag. 2018, 197, 9–18. [Google Scholar] [CrossRef]
- Clement, C.; Sleiderink, J.; Svane, S.F.; Smith, A.G.; Diamantopoulos, E.; Desbroll, D.B.; Thorup-Kristensen, K. Comparing the deep root growth and water uptake of intermediate wheatgrass (Kernza (R)) to alfalfa. Plant Soil 2022, 472, 369–390. [Google Scholar] [CrossRef]
- Wang, X.W.; Cai, H.J.; Zheng, Z.; Yu, L.Y.; Wang, Z.S.; Li, L. Modelling root water uptake under deficit irrigation and rewetting in Northwest China. Agron. J. 2020, 112, 158–174. [Google Scholar] [CrossRef]
- Wu, Y.Z.; Huang, M.B. Analysis of influential factors for maize root water uptake based on Hydrus-1D model. Trans. CSAE 2011, 27, 66–73. [Google Scholar]
- Zhao, D.X.; Eyre, J.X.; Wilkus, E.; Voil, P.; Broad, I.; Rodriguez, D. 3D characterization of crop water use and the rooting system in field agronomic research. Comput. Electron. Agric. 2022, 202, 107409. [Google Scholar] [CrossRef]
- Yang, P.L.; Hao, Z.Y. Developments of plant root water uptake models. J. China Agric. Univ. 1999, 4, 67–73. [Google Scholar]
- Kumar, R.; Shankar, V.; Jat, M.K. Evaluation of root water uptake models—A review. ISH J. Hydraul. Eng. 2015, 21, 115–124. [Google Scholar]
- Albasha, R.; Mailhol, J.C.; Cheviron, B. Compensatory uptake functions in empirical macroscopic root water uptake models-experimental and numerical analysis. Agric. Water Manag. 2015, 155, 22–39. [Google Scholar] [CrossRef]
- Peddinti, S.R.; Kambhammettu, B.V.N.P.; Lad, R.S.; Simunek, J.; Gade, R.M.; Adinarayana, J. A macroscopic soil-water transport model to simulate root water uptake in the presence of water and disease stress. J. Hydrol. 2020, 587, 124940. [Google Scholar] [CrossRef]
- Chen, W.L.; Wang, J.J.; Liu, Y.F.; Jin, M.G.; Liang, X.; Wang, Z.M.; Ferré, T.P.A. Using bromide data tracer and HYDRUS-1D to estimate groundwater recharge and evapotranspiration under film mulched drip irrigation in an arid Inland Basin, Northwest China. Hydrol Process. 2021, 35, e14290. [Google Scholar] [CrossRef]
- Iqbal, M.; Kamal, M.R.; Mohd, F.M.; Man, H.C.; Wayayok, A. HYDRUS-1D simulation of soil water dynamics for sweet corn under tropical rainfed condition. Appl. Sci. 2020, 10, 1219. [Google Scholar] [CrossRef]
- Zheng, L.J.; Ma, J.J.; Sun, X.H.; Guo, X.H.; Cheng, Q.Y.; Shi, X.K. Estimating the root water uptake of surface-irrigated apples using water stable isotopes and the Hydrus-1D model. Water 2018, 10, 1624. [Google Scholar] [CrossRef]
- Kanzari, S.; Daghari, I.; Šimůnek, J.; Younes, A.; Ilahy, R.; Mariem, S.B.; Rezig, M.; Nouna, B.B.; Bahrouni, H.; Abdallah, M.A.B. Simulation of water and salt dynamics in the soil profile in the semi-arid region of Tunisia—Evaluation of the irrigation method for a tomato crop. Water 2020, 12, 1594. [Google Scholar] [CrossRef]
- Wang, X.F.; Li, Y.; Chau, H.W.; Tang, D.X.; Chen, J.Y.; Bayad, M. Reduced root water uptake of summer maize grown in water-repellent soils simulated by HYDRUS-1D. Soil Tillage Res. 2021, 209, 104925. [Google Scholar] [CrossRef]
- Li, B.B.; Wang, Y.Q.; Hill, R.L.; Li, Z. Effects of apple orchards converted from farmlands on soil water balance in the deep loess deposits based on HYDRUS-1D model. Agric. Ecosyst. Environ. 2019, 285, 106645. [Google Scholar] [CrossRef]
- Er-Raki, S.; Ezzahar, J.; Merlin, O.; Amazirh, A.; Hssaine, B.A.; Kharrou, M.H.; Khabba, S.; Chehbouni, A. Performance of the HYDRUS-1D model for water balance components assessment of irrigated winter wheat under different water managements in semi-arid region of Morocco. Agric. Water Manag. 2021, 244, 106546. [Google Scholar] [CrossRef]
- Tang, H.G.; Zhou, T.Z.; Xin, P. Stimulation of sediment deposition to root water uptake and soil water change in wetland near sea. Water Res. Prot. 2020, 36, 87–92. [Google Scholar]
- Yuan, C.F.; Feng, S.Y.; Huo, Z.L.; Ji, Q.Y. Effects of deficit irrigation with saline water on soil water-salt distribution and water use efficiency of maize for seed production in arid Northwest China. Agric. Water Manag. 2019, 212, 424–432. [Google Scholar] [CrossRef]
- Ding, C.M.; Wu, P.N.; Yue, L.; Li, Y.H.; Guan, X.K.; Wang, T.C. Modelling the effect of tillage on soil water dynamics in corn field. J. Irrig. Drain. 2020, 39, 24–31. [Google Scholar]
- FAO. Crop Evapotranspiration: Guidelines for Computing Crop Water Requirements; FAO: Rome, Italy, 1998. [Google Scholar]
- Zheng, S.R.; Hu, Q.; He, H.Y.; Xing, M.Y.; Gao, H.R.; Liu, Y.Y.; Ma, X.Q.; Pan, X.B. Temporal and spatial variation characteristics of radiation in winter wheat-summer maize growing season in the North China Plain during 1961–2020. J. China Agric. Univ. 2022, 27, 26–37. [Google Scholar]
- Almorox, J.; Quej, V.H.; Martí, P. Global performance ranking of temperature-based approaches for evapotranspiration estimation considering Köppen climate classes. J. Hydrol. 2015, 528, 514–522. [Google Scholar] [CrossRef]
- Feddes, R.A. Simulation of field water use and crop yield. Soil Sci. 1978, 129, 193. [Google Scholar]
- Alrajhi, A.; Beecham, S.; Hassanli, A. Effects of partial root-zone drying irrigation and water quality on soil physical and chemical properties. Agric. Water Manag. 2017, 182, 117–125. [Google Scholar] [CrossRef]
- Flynn, N.E.; Comas, L.H.; Stewart, C.E.; Fonte, S.J. Deficit irrigation drives maize root distribution and soil microbial communities with implications for soil carbon dynamics. Soil Sci. Soc. Am. J. 2021, 85, 412–422. [Google Scholar] [CrossRef]
- Sharma, S.P.; Leskovar, D.I.; Volder, A.; Crosby, K.M.; Ibrahim, A.M.H. Root distribution patterns of reticulatus and inodorus melon (Cucumis melo L.) under subsurface deficit irrigation. Irrig. Sci. 2018, 36, 301–317. [Google Scholar] [CrossRef]
- dos Santos, M.R.; Martinez, M.A.; Donato, S.L.R.; Coelho, E.F. Fruit yield and root system distribution of ‘Tommy Atkins’mango under different irrigation regimes. Rev. Bras. Eng. Agric. Ambi. 2015, 18, 362–369. [Google Scholar] [CrossRef]
- Zhao, Y.G.; Ma, J.J.; Sun, X.H.; Guo, X.H. Spatial distribution of soil moisture and fine roots of apple trees under water storage pit irrigation. J. Irrig. Drain Eng. 2014, 140, 1–4. [Google Scholar] [CrossRef]
- González, M.G.; Ramos, T.B.; Carlesso, R.; Paredes, P.; Petry, M.T.; Martins, J.D.; Aires, N.P.; Pereira, L.S. Modelling soil water dynamics of full and deficit drip irrigated maize cultivated under a rain shelter. Biosyst. Eng. 2015, 132, 1–18. [Google Scholar] [CrossRef]
- Ramos, T.; Šimůnek, J.; Gonçalves, M.; Martins, J.; Prazeres, A.; Castanheira, N.; Pereira, L. Field evaluation of a multicomponent solute transport model in soils irrigated with saline waters. J. Hydrol. 2011, 407, 129–144. [Google Scholar] [CrossRef]
- Ling, Z.; Shi, Z.T.; Gu, S.X.; He, G.X.; Liu, X.Y.; Wang, T.; Zhu, W.W.; Gao, L. Estimation of applicability of soil model for Rubber (Hevea brasiliensis) plantations in Xishuangbanna, Southwest China. Water 2022, 14, 295. [Google Scholar] [CrossRef]
- Zhang, D.; Wang, H.Y.; Hu, W.L.; Yang, H.D.; Xu, Y.; Ma, X.W.; Zhao, P.Y.; Liu, H.B. Effect of film thickness on crop yield and soil environment. J. Agro-Environ. Sci. 2017, 36, 293–301. [Google Scholar]
- Yang, B.F.; Feng, L.; Li, X.F.; Yang, G.Z.; Ma, Y.Y.; Li, Y.B. Effects of plastic film mulching on the spatiotemporal distribution of soil water, temperature, and photosynthetic active radiation in a cotton field. PeerJ 2022, 10, e13894. [Google Scholar] [CrossRef] [PubMed]
- Thidar, M.; Gong, D.Z.; Mei, X.R.; Gao, L.L.; Li, H.R.; Hao, W.P.; Gu, F.X. Mulching improved soil water, root distribution and yield of maize in the Loess Plateau of Northwest China. Agric. Water Manag. 2020, 241, 106340. [Google Scholar] [CrossRef]
- Zhao, Y.; Zhou, W.Y.; Sun, B.P.; Yang, Y.; Li, J.F.; Li, J.R.; Cao, B.; Zhong, H. Root distribution of three desert shrubs and soil moisture in Mu Us Sandy Land. Res. Soil Water Conserv. 2010, 17, 129–133. [Google Scholar]
- Eltarabily, M.G.; Berndtsson, R.; Abdou, N.M.; El-Rawy, M.; Selim, T. A comparative analysis of root growth modules in HYDRUS for SWC of rice under deficit drip irrigation. Water 2021, 13, 1892. [Google Scholar] [CrossRef]
- Musa, A.; Zhang, Y.H.; Cao, J.; Wang, Y.C.; Liu, Y. Relationship between root distribution characteristics of Mongolian pine and the soil water content and groundwater table in Horqin Sandy Land, China. Trees 2019, 33, 1203–1211. [Google Scholar] [CrossRef]
- Pei, Y.W.; Huang, L.M.; Li, R.L.; Shao, M.A.; Zhang, Y.L. Root water source of Pinus sylvestris L. var. Mongholica Litv. and influencing factors in the southeastern part of Mu Us Sandy Land, China. Acta Pedol. Sin. 2022, 59, 1336–1348. [Google Scholar]
- Li, Y.; Shao, M.A.; Wang, W.Y.; Wang, Q.J.; Horton, R. Open hole effects of perforated plastic mulches on soil water evaporation. Soil Sci. 2003, 168, 751–758. [Google Scholar] [CrossRef]
- Zhang, H.M.; Huang, G.H.; Xu, X.; Xiong, Y.W.; Huang, Q.Z. Estimating evapotranspiration of processing tomato under plastic mulch using the SIMDualKc model. Water 2018, 10, 1088. [Google Scholar] [CrossRef]
- Chen, N.; Li, X.Y.; Shi, H.B.; Yan, J.W.; Hu, Q.; Zhang, Y.H. Assessment and modeling of maize evapotranspiration and yield with plastic and biodegradable film mulch. Agric. For. Meteorol. 2021, 307, 108474. [Google Scholar] [CrossRef]
Disclaimer/Publisher’s Note: The statements, opinions and data contained in all publications are solely those of the individual author(s) and contributor(s) and not of MDPI and/or the editor(s). MDPI and/or the editor(s) disclaim responsibility for any injury to people or property resulting from any ideas, methods, instructions or products referred to in the content. |
© 2023 by the authors. Licensee MDPI, Basel, Switzerland. This article is an open access article distributed under the terms and conditions of the Creative Commons Attribution (CC BY) license (https://creativecommons.org/licenses/by/4.0/).