Abstract
Cement global demand shows continued growth and a significant increase in the production volume, which may negatively impact the non-renewable natural resources and the environment, which is incompatible with sustainability goals. Cement kiln dust (CKD) is a primary concern associated with clinker manufacturing as a waste byproduct. Similarly, the mining industry produces copper tailing as unwanted material while beneficiating the ore, creating environmental problems due to difficulty in managing worldwide generated quantities that reach billions of metric tons. This study investigated the beneficial utilization of cement kiln dust and copper tailing as undesirable wastes in industrial applications through underground mines’ cemented paste backfill (CPB). Sixty different mixtures were prepared with three types of CKD collected from various cement manufacturers and were accordingly used with a proportion of 5, 10, and 15% to partially replace ordinary Portland cement (OPC) and pozzolan Portland cement (PPC) binders, represented in hundreds of CPB samples. The hardened specimens were subjected to density, uniaxial compressive strength (UCS), and axial deformation measurements to evaluate the physical and mechanical properties at curing up to 90 days. Meanwhile, X-ray powder diffraction (XRD) was extensively applied to chemically investigate the hydration products of CPB-hardened mixtures. Moreover, we developed a UCS predictive model applying two techniques: multiple variables regression analysis and artificial neural network (ANN). The results showed that the tricalcium silicate (Alite) and dicalcium silicate (Belite) phases form C-S-H upon hydrations and provide high strength in the binary mixtures. Meanwhile, the CKD’s lime saturation factor (LSF) governed the strength value in the ternary mixtures that utilized copper tailings. That makes CKD practical in the CPB mixture when partially replacing the OPC and PPC binders, with a proportion of up to 15%. In addition, the ANN technique’s predictive model exhibited a significant positive correlation with excellent statistical parameters that achieved 0.995, 0.065, and 0.911 for R2, RMSE, and MAE, respectively.
1. Introduction
With the rapid global growth and massive industrial development over the recent decades, the cement industry still maintains its importance as one of the primary industries worldwide, as it is the main component of construction projects. The global market showed that cement production increased during the last six years from 3.7 to more than 4 billion tons, reinforcing the growing need for this industry [1]. It is also expected that this number will increase in the coming years. Still, on the other hand, this increase overconsumes the non-renewable raw materials that enter cement manufacturing, as producing only 1 ton of cement requires 1.7 tons of raw materials. Moreover, the cement industry negatively impacts the environment via byproducts such as carbon dioxide (CO2) emission and cement kiln dust (CKD), which are generated during Portland clinker production, and prompted many scholars to make various attempts to reduce dependency on cement [2,3,4].
Cement kiln dust (CKD) is considered a primary environmental concern related to cement manufacturing. CKD is powdered waste generated under high temperatures, deposited in dust collectors, and transported to landfills [5]. It mainly comprises three components: raw materials, calcined matter, and some clinker granules [6,7,8]. The amount of CKD generated represents 15 to 20% of the clinker produced [9,10,11]. At the same time, it constitutes a large number of tons, mainly because these vast quantities are not recycled in the cement industry, except on a tiny scale due to considerations of the quality of the final product. That necessitates transporting the rest of the materials to landfills, which is a significant source of inconvenience to cement manufacturers for economic and environmental reasons and is not in line with the goals of industrial sustainability [12].
As the literature showed, CKD materials have beneficial chemical and physical properties that make them a practical material suitable for many industrial applications, which motivated researchers to conduct many studies on them. In addition, the utilization of CKD in these applications is considered safe and is not accompanied by any adverse effects on health or the environment alike, according to what was stated by The United States environmental protection agency (EPA) [8]. Accordingly, using CKD in various industrial applications contributed to a positive turning point in reducing its adverse economic or environmental effects, as was evident in several investigations [13,14,15,16,17,18].
CKD was introduced as one of the solutions that proved successful in soil stabilization, including the following: Ghorab et al. (2007) for road paving and production of some building units [19], Sreekrish et al. (2007) for soil treatment [20], Moon et al. (2008) to assess contaminated soil stabilization and solidification [21], Carlson et al. (2011) in improving soil engineering properties [22], Ebrahimi et al. (2012) for enhancing soil stiffness [23], Albusoda and Salem (2012) in the stabilization of the dune sand [24], Okafor and Egbe (2013) for improving the sub-grade materials [25], Gupta et al. (2015) for inactivating the contaminated soil heavy metal presence [26], Arulrajah et al. (2017) to stabilize the aggregate [27], Mohammadinia et al. (2018) for aggregate strength and stiffness increasing [28], and Ekpo et al. (2021) in optimizing the tropical soil plasticity properties [29].
CKD was also beneficially used as a partial replacement binder for cement with various proportions (5–50%) in different fields, including the following: Al-Harthy et al. (2003) in the mixture of mortar and concrete [30], Mohammad and Hilal (2010) for the production of concrete [31], Marku et al. (2012) in concrete and modified mortar production [32], El-Mohsen et al. (2015) for preparing self-consolidating concrete [33], Hussain and Rao (2014) in concrete optimizing [34], Sadek et al. (2017) for paving blocks [35], Saleh et al. (2020) in lightweight concrete [36], and Bagheri et al. (2020) for green concrete production [37].
Likewise, CKD was economically utilized in the brick and ceramic industry as a cementitious agent with many percentages (2–50%), including the following: Aydin et al. (2019) in the production of ceramic wall tiles [38], Ewais et al. (2015) to produce wollastonite ceramics [39], Mahrous and Yang (2011) for cement bricks production [40], Ogila (2014) in the manufacturing of red clay bricks [41], El-Attar et al. (2017) to produce bricks [42], Abdel-Gawwad et al. (2021) in unfired building brick production [43], and Abdulkareem and Eyada (2018) to manufacture pressed building bricks [44].
In Saudi Arabia, CKD generated locally is also beneficially recycled by many scholarships, including the following: Al-Refeai and Al-Karni (1999) for problematic soil treatment [45], Daous (2004) in the modification of cement blends [46], Maslehuddin et al. (2008) to produce cement products [47], Mahyoup (2009) for the stabilization of soil [48], Ghazaly et al. (2012) to produce cement concrete [49], Alawi (2016) in the stabilization of the underneath roads [50], Al-Homidy et al. (2017) in improving the geotechnical properties of sabkha soil [51], and by Alharthi et al. (2021) for plain concrete and cement blocks production [52]. However, in Saudi Arabia, investigations have not been conducted to study utilizing CKD in industrial applications related to the mining industry.
Likewise, mining is considered one of the most critical sectors controlling several economies worldwide [53,54]. The materials extracted from the mines provide many industries with the raw materials necessary to continue manufacturing products. For example, the government attaches great importance to the mining industry in Saudi Arabia, as mining has been placed on the list of three sources of national income, along with oil and petrochemicals, in line with Vision 2030.
However, there are many adverse effects on the environment associated with mining activities, the most important of which is the mineral tailings generated during ore beneficiating in processing units, where expectations indicate that the total quantities of tailings produced in 2022 are 14 billion metric tons around the world [55]. This large amount is a genuine environmental concern due to the challenge of managing. Disposing of mineral tailings in cemented paste backfill (CPB) of underground mines is one of the modern solutions for this waste material management from economic and environmental perspectives [56,57,58]. Cemented paste backfill (CPB) is a new technology developed in modern mines for backfill purposes; it consists of mineral tailings, a small binder dosage, and water [59].
The need for mine backfill is rising due to the excavation of millions of tons of raw material daily from underground mines that generate huge voids such as stopes, caves, and rooms, which negatively influence the environment, safety, and production [60]. Therefore, researchers conducted many approaches to provide ground support and achieve mine stability through backfill methods. However, from an applied point of view, there are many economic challenges associated with using CPB in backfill applications, the most important of which is the price of the binder (cement), which represents 75% of the cost of this technology. That also reflected in the total cost of CPB, as it costs 10–20% of the gross operating cost in underground mines [61]. As the cost of the binder (cement) may reach $180/ton, it is possible to reduce this cost by 10–37% using supplement waste materials as a partial replacement for cement, such as cement kiln dust (CKD) [62]. Therefore, some studies were conducted to investigate the possibility of using CKD as a partial substitute for cement in cemented paste backfill (CPB) by Lutyński and Pierzyna (2017) [63], and in the same context, Beltagui et al. (2018) [64].
This research introduced eco-sustainable solutions that combine cement kiln dust and copper tailings as industrial byproducts in the cemented paste backfill mixture. Accordingly, converting them from waste into valuable materials means they can be utilized in mining applications with experimentally proven added values. Experimentally, this investigation designed sixty different binary as well ternary mixtures with three types of CKD collected from various cement manufacturers and used with a proportion of 5, 10, and 15% to partially replace ordinary Portland cement (OPC) and pozzolan Portland cement (PPC) binders. The experimental investigation included hundreds of CPB specimens representing binary and ternary mixtures. The binary mixes were designed with only cement and CKD solid ingredients. Meanwhile, the ternary mixtures were initially prepared with cement, CKD, and silica sand. Furthermore, the silica medium was replaced with copper tailings to examine its impact chemically. Moreover, this study applied ANN in developing a new model for prediction and optimization purposes, as many approaches were conducted using different technologies to optimize waste materials mixes [65,66].
2. Materials and Methods
2.1. Raw Materials
This study utilized three types of CKD materials, abbreviated YCKD, ACKD, and UCKD, collected from three Saudi cement manufacturers in the western region, as well as two kinds of copper tailings (coarse and fine) obtained from a local cooper underground mine owned by Maaden Barrick Copper Company (Figure 1). In addition, fine-grained silica sand, Ordinary Portland cement (OPC), and Pozzolana Portland Cement (PPC) were used. OPC and PPC were produced locally and used as binder agents in cemented paste backfill due to their cementitious properties that stabilize underground mines [67]. This investigation also used tap water with pH ≈ 9.07, TDS ≈ 92.78 PPM, and conductivity of 148.2 μs/cm to maintain the proper hydration process for a mixture of ingredients upon being mixed.
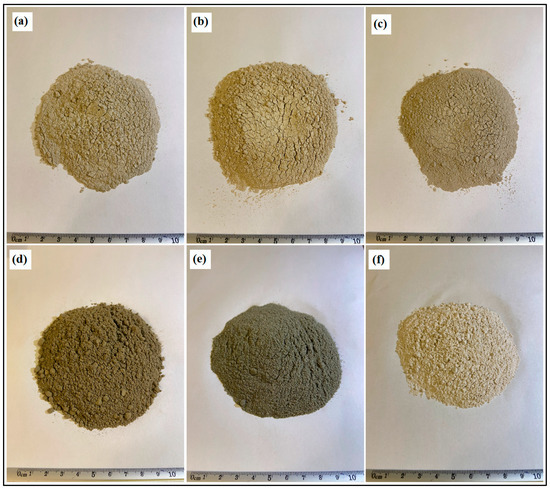
Figure 1.
Photographs of raw materials used. (a) YCKD; (b) ACKD; (c) UCKD; (d) fine tailing; (e) coarse tailing; (f) silica sand.
2.1.1. Chemical Composition
The chemical compositions of all raw materials (CKD, binders, silica sand, and tailings) used in this study were analyzed by X-ray fluorescence (XRF). The results of the XRF analysis showed that Silicon dioxide (SiO2), Calcium oxide (CaO), Sulfur trioxide (SO3), Sodium oxide (Na2O), Chlorine (Cl), and Free lime (F-Cao) were the major components of the three CKD samples. At the same time, Calcium oxide (CaO) and Silicon dioxide (SiO2) constituted the highest percentage in the chemical composition of cement. Likewise, Silicon dioxide (SiO2) and Aluminum oxide (Al2O3) represented the primary content in the silica sand. Silicon dioxide (SiO2), Aluminum oxide (Al2O3), Ferric oxide (Fe2O3), Calcium oxide (CaO), Magnesium oxide (MgO), and Sulfur trioxide (SO3) are the significant components of the tailing material, as shown in Table 1.

Table 1.
The chemical composition of raw materials (CKD, cement, silica sand, and tailings) used in this study.
2.1.2. Chemical Parameters of CKD
Based on the gained chemical composition of CKD’s different materials, this study also calculated Lime Saturation Factor (LSF), Alumina Modulus (AM), and Silicate Modulus (SM) to investigate these parameters variations in the utilized three samples of CKD according to the following formulas:
where, SiO2 is Silicon dioxide, CaO is Calcium oxide, Al2O3 is Aluminum oxide, and Fe2O3 is Ferric oxide.
The results indicate three groups of LSF parameters, where ACKD showed the highest value, with 152.82. Meanwhile, 139.85 and 129.45 were achieved by YCKD and UCKD, respectively. At the same time, no significant variations were illustrated in AM and SM values, as shown in Table 2.
Table 2.
The chemical parameters of three CKD samples used in this study.
2.1.3. Particle Size Analysis
The particle size of raw materials and the chemical composition play a significant role in the cemented paste’s backfill hardened-specimens strength [68]. The MASTERSIZER 3000 particle size analyzer was applied in this investigation to obtain a high accuracy for the size distribution of the studied fine-grained materials depending on the laser diffraction technology. The gained outcomes indicate that most CKD materials and silica sand particle sizes lie in the range of 10–80 μm. Meanwhile, copper tailings achieved 5–70 μm and 100–280 μm for the fine and coarse, respectively. Likewise, both types of cement showed a particle size close to CKD materials, which ranged between 10–70 μm (Figure 2). The cumulative passing at various diameters: 10, 30, 50, 60, and 90 μm, as well as the uniformity coefficient (Cu) and curvature coefficient (Cc), are shown in Table 3.
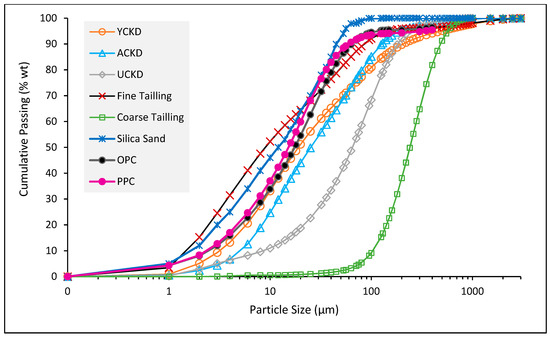
Figure 2.
Particle size distribution of all materials used (CKD, silica sand, cement, and tailings).
Table 3.
Physical properties of all raw materials used (CKD, silica sand, tailings, and binders).
2.1.4. Specific Surface Area
As a significant engineering parameter, the specific surface area plays a vital role in the material’s mechanical properties, such as strength [61]. This study applied the adjusted Air-permeability apparatus to measure powdered materials’ fineness according to the recognized standard, ASTM C 204 [69]. The results showed that the fine tailing has a specific surface area value of 540 m2/kg, which reflects the high fineness against the 139 m2/kg belonging to the coarse tailing. The value of fine tailing is close to the specific surface area of the copper tailing obtained from the ball mill [70]. At the same time, the significant variations between fine and coarse tailings agree with the physical properties of both materials as the D50 of fine tailing achieved 10 μm; meanwhile, coarse tailing exhibited 240 μm for D50. In addition, CKD materials showed minor variation in specific area properties as we obtained 124, 192, and 202 m2/kg for UCKD, YCKD, and YCKD, respectively, which confirms that the cement manufacturing process, including the dust collecting system, influences the physical properties of the generated CKD materials. Furthermore, a value of 236 m2/kg for the silica sand keeps it suitable physically to be used in the experimental work as an alternative medium to the mixed tailings. Both types of cement gained 366 and 399 m2/kg for the OPC and PPC, respectively, where more grinding for PPC after adding Pozzolana in the cement mill makes this cement relatively finer (Figure 3). As the minimum specific surface area of the rapid hardening Portland cement using Blaine’s air permeability technique is 325 m2/kg, according to IS 8041–1990, the used cement meets the requirement, and at the same time, the gained value lies in the normal range.
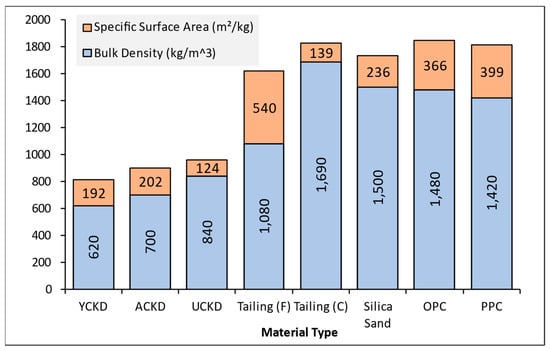
Figure 3.
Specific Surface Area and bulk density of all raw materials used.
2.1.5. Bulk Density
Bulk density shows powder material mass per unit volume. In this study, pouring of the bulk density into the graduated cylinder was applied to determine the powdered-materials bulk density according to ASTM D7481-18 [71]. The results indicated that coarse tailing has a bulk density with a value of 1690 kg/m3, which refers to the mass of rock content. At the same time, fine tailing gained 1080 kg/m3 due to subjecting to more processes compared to coarse tailing. CKD materials achieved a bulk density of 620, 700, and 840 kg/m3 for YCKD, ACKD, and UCKD, respectively, which are mainly affected by the type of raw materials used and the cement manufacturing process. Silica sand showed a bulk density of 1500 kg/m3 because of quartz minerals. Meanwhile, OPC exhibited 1480 kg/m3 and PPC 1420 kg/m3, which decreased due to the mass of pozzolana materials, as shown in Figure 3.
2.1.6. Moisture Content
In raw materials, the moisture content is a primary factor that may govern engineering properties; it should be determined and considered a significant aspect before the experimental investigation in the geotechnical field [72]. In addition, carefully considering the moisture content is a crucial step before mixing recipe ingredients to maintain the desired proportion of the mixing water. This study used the conventional method to determine the moisture content in the investigated materials. According to ASTM D2216-19 [73], it was done by keeping the representative samples in the laboratory oven at a temperature of 110° for twenty-four hours. As per the gained findings, the copper tailings showed 17.26 to 17.70% since these materials were obtained directly from the mine while ore processing. Meanwhile, CKD materials, silica sand, and cement as a dry and powder matter showed a tiny percentage, reaching a maximum of 0.1% water content.
2.1.7. Scanning Electron Microscopy Analysis
Scanning Electron Microscopy (SEM) is a powerful technique for investigating the sample’s surface topography when focusing an electron beam to produce different magnification images. The present investigation subjected CKD material to SEM to illustrate the fine-grained particles’ size and shape. That was done by performing different magnifications with the Scanning Electron Microscope (SEM; model JSM-7600F, JOEL, Japan). As revealed in CKD materials SEM images, YCKD has more fine-size particles than ACKD and UCKD; these results agree with the particle size analysis of CKD materials achieved by the laser diffraction technique. The relatively larger particles in ACKD and UCKD contributed to the availability of more voids. At the same time, all types of CKD indicate that particles have an irregular surface shape and are heterogeneously distributed, as shown in Figure 4.
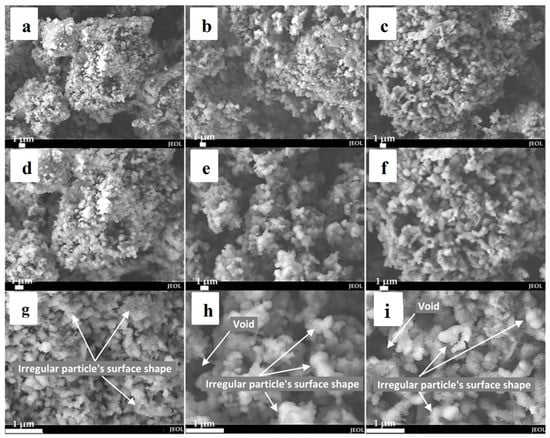
Figure 4.
SEM micrographs of CKD materials at different magnifications: X 3500 (a–c); X 5000 (d–f); X 10,000 (g–i). Where (a,d,g) represents YCKD; (b,e,h) refers to ACKD; and (c,f,i) belongs to UCKD.
2.2. Sample Preparation
2.2.1. Mixture Design
The cemented paste backfill mixes were designed depending on the water, binders, CKD, silica sand, and tailings proportions according to Equations (4)–(8):
MW, MB, MS, MC, and MT are the mass of water, binder, silica, CKD, and tailings, respectively.
Accordingly, this study designed CPB recipes, including three types of CKD collected from various cement manufacturers and used to partially replace ordinary Portland cement (OPC) and pozzolan Portland cement (PPC) binders, represented in hundreds of CPB samples. The mixtures were mainly divided into six groups; each group involved one control mix (without adding CKD) for referencing purposes, and nine combinations prepared with three types of CKD lie in three replacement proportions, 5, 10, and 15%. The first group (ten mixtures) was designed as a binary mixture that contained only OPC and three types of CKD as a solid ingredient mixed with water. Meanwhile, silica sand was entered into the second group to prepare the ternary mixture. Copper tailings in the third group replaced the silica sand (Table 4). The same groups were repeated but with replacing OPC with PPC binder, as shown in Table 5. This investigation fixed the water percentage at 23% by the mixture mass for all groups.
Table 4.
Recipe ingredients of different groups using ordinary Portland cement (OPC).
Table 5.
Recipe ingredients of different groups using pozzolana Portland cement (PPC).
2.2.2. Samples Preparation
After collecting the required materials of cemented paste backfill mixtures for each recipe, the ingredients were weighted using a digital balance. Next, the materials were transported to the concrete mixing and casting lab, which meets the requirements of ASTM C31. Then a handled cement mixer (Makita, DS4011, 600 rpm) was employed for 10 min to mix the ingredients according to the designed proportion to achieve a homogenized paste [56]. Next, the mixed paste was poured into a 100 × 50 mm cylindrical mold. Then, all prepared specimens (15 samples for each recipe) were cured at 7, 14, 28, 56, and 90 days. Before the experimental test, samples were extruded and finished on the bottom and top through a surface grinder to gain a flat finish. Finally, a digital balance and electronic caliper were used for weighting and dimensions measuring.
2.3. Experimental Methods
2.3.1. Density
Hardened sample density plays an essential role in the mechanical properties of the materials, such as compressive strength, as the denser specimens can exhibit a higher density due to the fewer porosity and voids. Moreover, this study measured the density of the prepared CPB samples to investigate the impact of cement kiln dust fine-grained material added to the mixtures. Therefore, the density measurement was conducted as a primary aspect according to ASTM C642-97 [74] for all hardened specimens before subjecting them to experimental tests.
2.3.2. Uniaxial Compressive Strength (UCS) Test
After removing each hardened sample from the cylindrical mold by injecting air pressure into the predrilled hole at the bottom of the mold [75] and finishing both surfaces using a surface grinder equipment to achieve a flat area, the height and diameter of samples were measured carefully in terms of maintaining a height-to-diameter ratio within 2 to 2.5 according to ASTM D2166 [76]. All of that comes before conducting the UCS test, which was successfully performed by Unitronic Compression (model S205-05M) made by MATEST Co., Italy, which has a load capacity of up to 50 kN (Figure 5). The tested specimen was subjected to a 1.00 mm/min load until the sample got compressive failure. At the same time, the axial deformation also was considered in terms of plotting the stress–strain curve. The compression testing machine (Unitronic Compression) induces compressive stress (σ), a force per cross-sectional area of the tested specimen, as shown in Equation (9). Accordingly, the axial strain (ε) is resulted in the induced change in the material length (deformation) due to the applied stress.
where σ: the compressive stress, P: the load, and A0: cross-sectional area of the sample.
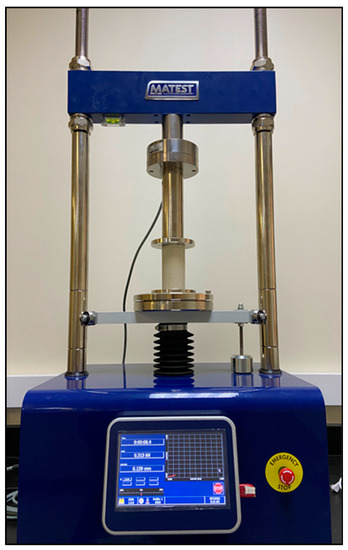
Figure 5.
The experimental setup for the UCS test.
2.3.3. Axial Deformation
Axial deformation is the deformation that occurs in the specimen due to the axial loading. This study measured the axial deformation of mixtures prepared with silica sand and copper tailings to investigate the impact of adding CKD to a variety containing copper tailings, which were compared the achieved results to the outcomes of mixes prepared with silica sand. That was done because the elasticity modulus governs the deformation and load (stress) relationship. Axial deformation can be given as follows:
where:
P: Axial load;
L: Original length;
E: Elastic Modulus of the material; and
A: Cross-section area of the sample.
2.3.4. Slump Test
Over many years, the slump test has been considered a powerful tool used to evaluate the quality of the paste in the cemented paste backfill plant. It is a simple and quick technique that can reflect the consistency of the paste, which is related to the flowability or rheology of the prepared paste. The paste flow plays a primary role in the stability of the pipeline operation, e.g., the thicker paste has more friction and cause pressure losses in the pipeline that can negatively impact the transporting system. This investigation used a 77 mm in diameter and 77 mm in length ASTM cylindrical metallic mold (Paterson & Cooke, South Africa) for the slump test. Four mixtures were subjected to slump tests with 0, 5, 10, and 15% CKD to evaluate the effect of CKD as a partial replacement for OPC on the consistency of CPB prepared by copper tailings. The paste was carefully poured into the metallic mold and each layer was tamped and leveled, we slowly removed the mold in the vertical direction, and then measured distance that the paste sloughed out of its original cylindrical shape or subsidence
2.3.5. X-ray Diffraction
In this study, CPB samples were subjected to the X-ray Diffraction (XRD) technique to investigate mineral phases of the hydration products for the different binary and ternary mixtures. The X-ray Diffraction (XRD) method was then applied by an X-ray diffractometer (Regaku, Ultima IV, Japan) for the establishment of molecules in the subjected specimens further and quantifying the compound’s minerals percentage composition. The XRD pattern of the examined samples was scanned in a continuous mode with a 4°/min scanning speed and (2θ) 10° to 80° angular range. Moreover, we utilized the cards of the International Centre for Diffraction Data (ICDD, Campus Blvd, Newton Square, PA, USA) for diffraction peak matching and then established the samples mineral phases [77,78].
3. Results and Discussions
3.1. Density
This study investigated the density of hardened specimens during a curing time of up to 90 days. The outcomes showed a relative increase in the density values of the samples prepared with the binder (OPC) and cement kiln dust material (CKD) compared with the control mix (0% CKD), which has a value of 2.055 g/cm3 over the curing time, as shown in Figure 6a. At the same time, the binary mixtures, OPC and YCKD, gained an average of 2.072 and 2.061 g/cm3 for 5 and 10% proportions, respectively. Furthermore, ACKD achieved a density higher than the control mix for all replacement percentages (5, 10, and 15%) with an average value of 2.056, 2.067, and 2.067 g/cm3. UCKD showed an almost similar density to the control mix, which exhibited 2.055, 2.059, and 2.055 g/cm3 for 5, 10, and 15% replacement proportions, respectively.
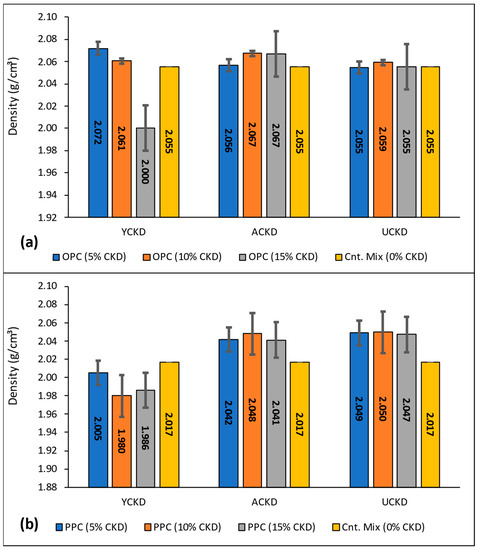
Figure 6.
The density of hardened binary mixtures prepared by cement and CKD. (a) OPC with YCKD, ACKD, and UCKD. (b) PPC with YCKD, ACKD, and UCKD.
Meanwhile, the control mix of binary mixtures prepared with PPC showed a relatively lower density (2.017 g/cm3) than the control mix containing OPC (2.055 g/cm3) because of the additive pozzolanic content, which is lighter than pure clinker in OPC, as shown in Figure 6b. It was also noted that ACKD and UCKD contributed to increasing the density for all replacement proportions against YCKD, which failed to add value to the density in the presence of PPC.
All 18 mixtures incorporating CKD materials in the binary phases indicated that the CKD’s chemical and physical properties significantly impact the density of hardened samples, as shown in Figure 6a,b. Moreover, the replacement proportions value can affect the density, even for the same CKD material. The increased density of binary mixes of CKD utilized may be due to the chemical composition, as CKD contains raw and calcined materials with some clinker. In addition, because of the physical properties of this powdered material, the fine-grained particles can fill tiny pores in the hardened specimens and then contribute to forming a denser microstructure upon hydration. Binary mixtures prepared with OPC showed higher density than those designed with PPC due to adding natural pozzolana to this type of cement. The OPC contains pure clinker, which is denser than pozzolanic materials added as an additive material in the cement mill to produce PPC.
In the ternary mixtures, the hardened samples prepared with silica, cement, and CKD materials exhibited a generally lower density for the control mix with an average value of 1.648 g/cm3 over the curing times compared to binary mixtures (2.055 g/cm3). Meanwhile, adding the CKD induced a slight improvement in the density, especially for ACKD material that showed 1.676, 1.667, and 1.663 g/cm3 for 5, 10, and 15% replacement proportions, respectively, as shown in Figure 7a. At the same time, the mixture prepared with PPC showed less density compared to the OPC mixture (1.648 g/cm3) with a value of 1.615 g/cm3, which was slightly increased with adding CKD materials (Figure 7b).
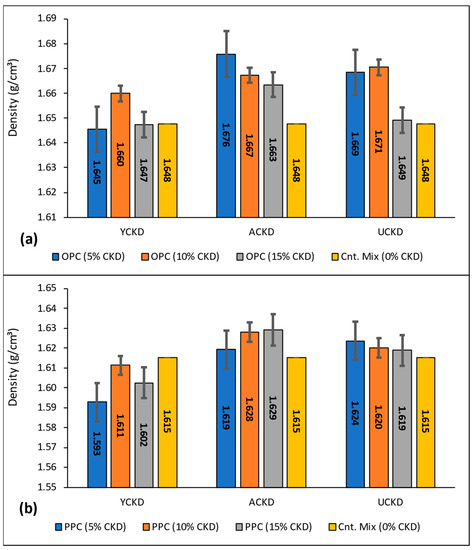
Figure 7.
The density of hardened ternary mixtures prepared by cement, silica, and CKD. (a) OPC with YCKD, ACKD, and UCKD. (b) PPC with YCKD, ACKD, and UCKD.
However, density was increased in the ternary mixtures when copper tailings replaced the silica sand. Accordingly, the control mix exhibited a density average of 1.801 g/cm3, which is almost higher than other mixes that utilized different types of CKD in the presence of OPC, as shown in Figure 8a. When the binder type changed to PPC, the control mix showed an average density of 1.776 g/cm3, which was less than the OPC binder (1.801 g/cm3). At the same time, the PPC control mix also achieved a higher density than mixtures that partially used CKD materials (Figure 8b). On the other hand, adding CKD to copper tailings can improve the mechanical properties and the durability of the copper tailings when investigated in the geopolymer bricks applications [79].
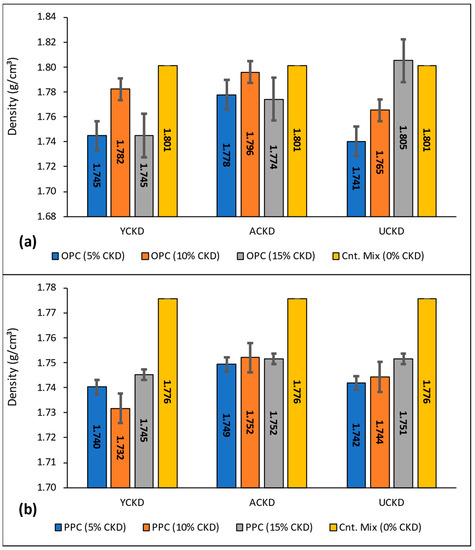
Figure 8.
The density of hardened ternary mixtures prepared by cement, copper tailings, and CKD. (a) OPC with YCKD, ACKD, and UCKD. (b) PPC with YCKD, ACKD, and UCKD.
3.2. Uniaxial Compressive Strength (UCS)
Figure 9a illustrates the UCS test results of the binary mixture prepared by YCKD with OPC and PPC, where the outcomes obtained at the long-term curing time (90 days) indicate a 45.99 MPa achieved by the OPC control mix (0% CKD). Meanwhile, replacing OPC with 5 and 10% YCKD contributed to achieving a higher strength with 55.54 and 50.40 MPa, respectively, and the proportion of 15% YCKD showed a slightly reduced compressive strength than the control specimens with a value of 43.9 MPa. At the same time, the PPC control mix exhibited a UCS of 48.64 MPa, which is higher than all mixtures that partially replaced PPC with YCKD. Meanwhile, the coefficient of variation (CV) analysis of all mixtures for UCS showed that the maximum value was 14.5%, which means the variations were within the acceptable limit.
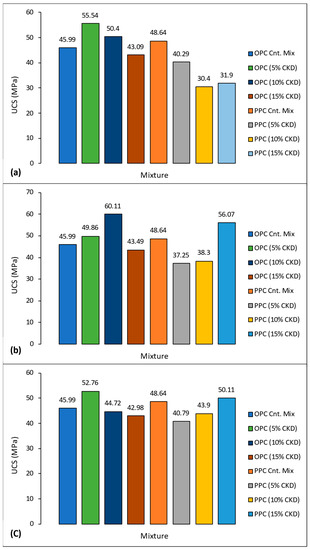
Figure 9.
UCS test results of the binary mixtures prepared by OPC and PPC with CKD at a long-term curing time (90 days). (a) YCKD; (b) ACKD; and (c) UCKD.
The results illustrated in Figure 9b also confirm that using ACKD material in the OPC binary mixtures increased the compressive strength compared to the control mix, which achieved 45.99 MPa. Replacing OPC with 5% ACKD showed 49.86 MPa, and 60.11 MPa was associated with a 10% proportion. Meanwhile, 15% gained 45.49, which is close to the UCS achieved by the control mix. Moreover, ACKD, when utilized with the PPC with 15%, exhibited a higher strength with a value of 56.07 MPa compared to 48.64 achieved by the PPC control mix.
The third type of cement kiln dust material (UCKD) also improved the tested samples’ strength, as when partially substituting OPC with 5% UCKD, the UCS increased to 52.76 MPa compared to 45.99 MPa of the control sample. With 10 and 15% replacement, the achieved strength showed 44.72 and 42.98 MPa, respectively, as shown in Figure 9c. The binary mixture prepared in the presence of PPC and UCKD indicated that 15% replacement for the PPC gained 50.11 MPa, which is higher than the 48.64 Mpa that belonged to the control mix. Overall obtained results during the binary mixtures phase investigation showed that the three types of CKD materials could improve the compressive strength of the specimens subjected to the UCS test in all with OPC and partly with PPC, according to physical and chemical perspectives. As the PPC made with pozzolanic materials contains a relatively higher content of SiO2, Al2O3, Fe2O3, and MgO than OPC, adding CKD may negatively affect the chemical reaction in terms of forming internal bonds.
In the ternary mixtures phase, silica sand was added at 67.76%, inducing a significant reduction in the specimen’s strength due to decreasing the Portland cement portion, which was used in the binary mixtures and created high strength upon hydration [64]. As the OPC control mix achieved only 3.91 MPa at the 90 days curing time, no significant variations were observed with replacing OPC by 5, 10, or 15% YCKD at the same long-term curing time. However, when using PPC, it led to a decrease in the strength compared to OPC, whereas the PPC control mix achieved 2.68 MPa; slight improvements were recorded when utilizing YCKD with different values, especially at a 10% substitute, as shown in Figure 10a.
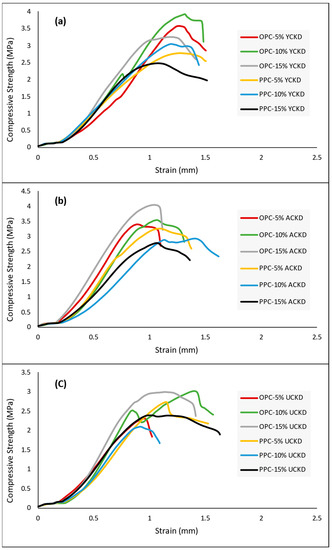
Figure 10.
Compressive strength behaviors of the ternary mixtures prepared by different CKDs and silica sand with OPC and PPC at the long-term curing time (90 days). (a) YCKD; (b) ACKD; and (c) UCKD.
Likewise, we observed the same findings when using ACKD material, as 15% OPC replacement achieved the highest value with 4.06 MPa. Some increments in strength values of PPC were also obtained compared to PPC and YCKD strength, as shown in Figure 10b. Meanwhile, UCKD material recorded the lowest UCS for both types of cement (OPC and PPC) compared to YCKD and ACKD, as shown in Figure 10c.
The present investigation used silica sand as a neutral medium to study the impact of gradually adding CKD through it. In addition, it focused on the CKD’s physical (density), chemical (hydration mineral phases), and mechanical behavior (UCS and axial deformation) upon hydration before moving on to the next step, which replaces the silica sand with copper tailings for comparison purposes.
In the ternary mixtures that incorporated copper tailings with 67.7% in place of silica sand to prepare CPB, control mixes exhibited a strength of 3.80 and 3.23 MPa for OPC and PPC, respectively. At the same time, when YCKD replaced OPC and PPC, the highest strength values achieved were in a 5% replacement mixture for OPC and 15% replacement in PPC, as shown in Figure 11a. Changing CKD material to ACKD also affected the proportion that gained the highest strength to 10% for both OPC and PPC (Figure 11b). Meanwhile, UCKD results indicated that 15% showed the maximum USC for OPC and PPC, as shown in Figure 11c.
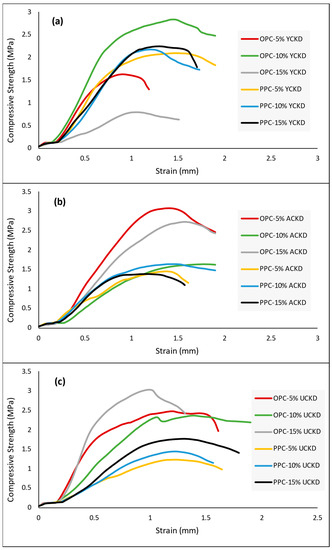
Figure 11.
Compressive strength behaviors of the ternary mixtures prepared by different CKD and copper tailings with OPC and PPC at the long-term curing time (90 days). (a) YCKD; (b) ACKD; and (c) UCKD.
The findings of the UCS test at the long-term curing time when preparing the CPB mixtures with copper tailing, OPC, PPC, and different CKD materials revealed that the CKD’s lime saturation factor (LSF) had a significant impact on the achieved strength. ACKD, with an LSF of 152.82, showed the highest UCS when replacing a proportion with 5%. YCKD, with an LSF value of 139.85, gained the maximum UCS when replacing 10%, and 15% for the UCKD, which has an LSF value of 129.45. There was a noticeable inverse relationship over the tested samples; if the CKD material has a high LSF value, the maximum strength is achieved at a low replacing proportion, and vice versa in the presence of OPC. Meanwhile, that relationship could be slightly affected by using PPC due to the pozzolanic content in this type of cement.
To conclude, the investigated CPB samples exceeded the minimum UCS limit required for the underground mines stope stability, which is 700 to 2000 kPa at a curing age of 28 days [67,80]. However, discussing the UCS results of cemented paste backfill at a long-term curing time is crucial due to the curing period’s impact on the mechanical properties of the prepared samples [64,67]. The results obtained at 90 days of curing agree with recommendations of previous studies that introduced CKD material as an agent utilized for improving long-term strength as well as durability, as CKD can provide some chemical benefits to the prepared mixture [79]. Moreover, USC results obtained at 90 days for CPB samples showed higher values for most combinations than the CPB long-term UCS prepared only by copper tailing and 10% binder, which was about 1.4 MPa [81]. It can be noted, from this investigation, that the different mixtures of cemented paste backfill prepared with 5, 10, and 15% cement kiln dust as a replacement for cement could meet the required strength for underground mine backfill.
Utilization of CKD material in cemented paste backfill applications can beneficially minimize 15% of operating costs by reducing the direct amount of binder (cement), which is 75% of cemented paste backfill production cost [61]. In addition, many benefits are associated with recycling CKD and copper tailings in mining applications, such as reducing the enormous quantities of these materials shifted to landfills and minimizing the transport cost. Likewise, it mitigates the adverse effects on the surrounding environment, surface, and groundwater that may be caused due to waste dumping in addition to promoting sustainability by reducing carbon dioxide (CO2) emitted by the cement industry. Furthermore, it saves energy and protects the non-renewable natural resources used as inputs to produce cement, such as limestone, gypsum, clay, etc., which requires 1.7 tons of raw materials for only 1 ton of clinker production.
3.3. Axial Deformation
Axial deformation of ternary mixtures containing CKD, cement, and silica sand, later replaced by copper tailings, was measured over all curing times up to 90 days to investigate the impact of using CKD with cooper tailings on the mechanical properties of CPB. The results showed that using three types of CKD increases the axial deformation of the tested samples compared to the control mix. For example, the OPC control mix achieved an axial deformation average of 1.09 mm overall for curing times, 7, 14, 28, 56, and 90 days, meanwhile when mixed with UCKD, it exhibited 1.37, 1.47, and 1.23 mm for 5, 10, and 15% replacement proportions, respectively. It was also observed that at an early curing time, the control mix showed the highest axial deformation value compared to other mixtures modified with CKD; however, as the curing time progressed, the lowest values were recorded to 90 days, as shown in Figure 12a. The same increase was also gained when using PPC in place of OPC, as the control mix showed 0.99, which was less than the OPC control mix, and after adding UCKD, improved to 1.28, 1.32, and 1.29 mm, as shown in Figure 12b.
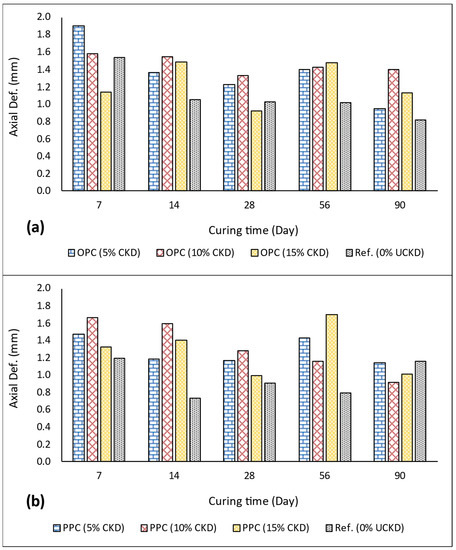
Figure 12.
Axial deformation of the ternary mixtures prepared by UCKD and silica sand at different curing times: (a) with OPC; (b) with PPC.
When replacing silica sand with copper tailings in the ternary mixtures, the axial deformation results indicate that the OPC control mix achieved higher axial deformation with an average value of 1.57 mm compared to the previous control mix in the presence of silica (1.09 mm). However, some stability was observed by replacing OPC with CKD materials, e.g., UCKD exhibited an average of 1.34, 1.54, and 1.50 mm (Figure 13a). CKD and copper tailings with PPC showed 1.50 mm as an average axial deformation for the PPC control mix. At the same time, no noticeable varieties were recorded for utilizing CKD as a partial replacement for PPC with different proportions, where UCKD achieved 1.41, 1.40, and 1.52 mm for 5, 10, and 15% replacement, as shown in Figure 13b.
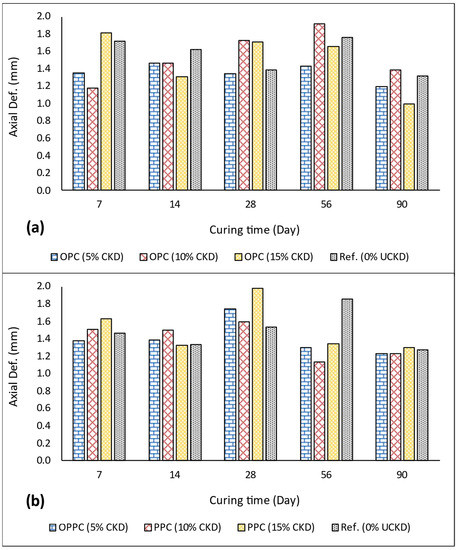
Figure 13.
Axial deformation of the ternary mixtures prepared by UCKD and copper tailings at different curing times: (a) with OPC; (b) with PPC.
3.4. Slump Yield Stress
The yield stress of cemented paste backfill is a significant property determined by the slum test for the fresh mixed materials, which is the minimum stress that flow occurs and causes permanent deformation for the prepared paste [82]. Four mixtures were subjected to a slump test, including a control mix (0% CKD) prepared by OPC and copper tailing, where CKD gradually replaced cement with 5, 10, and 15%. The chemical composition, physical properties, and water content affect yield stress [83]. Therefore, this study considered 27% water content for all tested mixtures to evaluate the influence of adding CKD on the flowability and rheological properties of the CPB. The obtained outcomes showed no significant variations induced when gradually modifying CPB samples with CKD, as shown in Figure 14. The gained findings of the measured slumps and yield stress lie in the normal range of CPB and agree with the results of the previous investigation conducted in the same field [84].
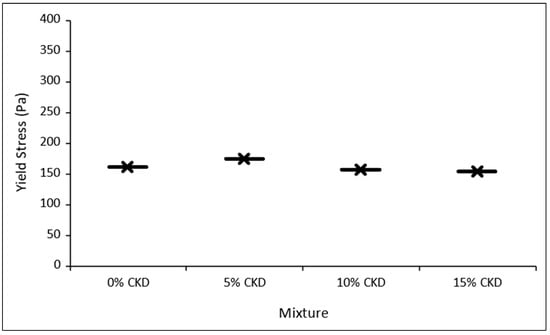
Figure 14.
Variations in CPB mixtures yield stress prepared with OPC, copper tailings, and different proportions of CKD.
3.5. XRD Analysis
This study subjected 60 samples to XRD analysis to investigate the hydration products in the different binary and ternary prepared mixtures. Figure 15a–d illustrate the diffraction pattern of the specimen at 90 days. It can be noticed that the mineral phases associated with the OPC control mix are Portlandite (Ca(OH)2), Larnite (Ca2SiO4), and Calcite (CaCo3), as shown in Figure 15a. Despite Larnite (Belite) having the dominant diffraction peaks because it forms calcium silicate hydrate C-S-H and its presence as a cement gel that creates bonds and binding microstructure to provide strength, its peaks are not as strong as that of Portlandite and Calcite. Figure 15b,c show the mineral phases when YCKD, ACKD, and UCKD replaced OPC. It is worth noting that despite CKD’s partial replacement for cement, the diffraction peaks remain nearly the same as in the control sample. Tricalcium silicate (Alite) and dicalcium silicate (Belite) compounds form C-S-H upon hydrations and are responsible for progressive strength, with Alite for early strength and Belite for later strength. Even in the presence of PPC in the binary mixtures in place of OPC, the same mineral phases associated with OPC were also presented with the slight existence of silica (Figure 16a–d).
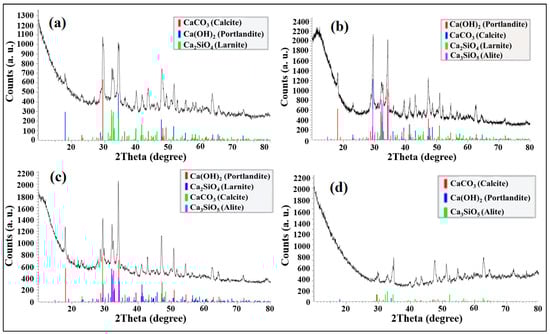
Figure 15.
Mineral phases of the binary mixtures at 90 days: (a) OPC control mix; adding (b) YCKD; (c) ACKD; (d) UCKD.
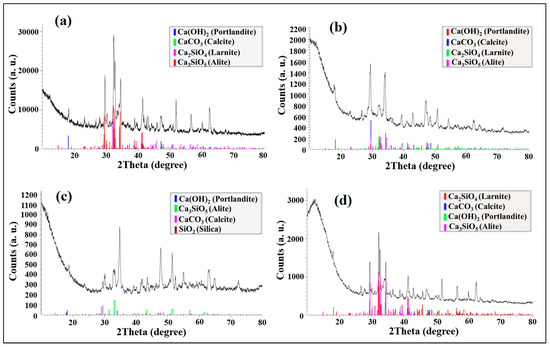
Figure 16.
Diffraction patterns of the binary mixtures at 90 days. (a) PPC control mix; adding (b) YCKD; (c) ACKD; and (d) UCKD.
In ternary mixtures prepared by OPC, silica sand, and CKD, the control mix (0% CKD) showed the phases of silica as the dominant mineral with a small percentage for calcite and portlandite, as shown in Figure 17a. The same phases were also recorded when different types of CKD were added (Figure 17a–d). Diffraction patterns presented upon replacing OPC with PPC also confirm that silica is the primary mineral with the tiny existence of calcite and portlandite.
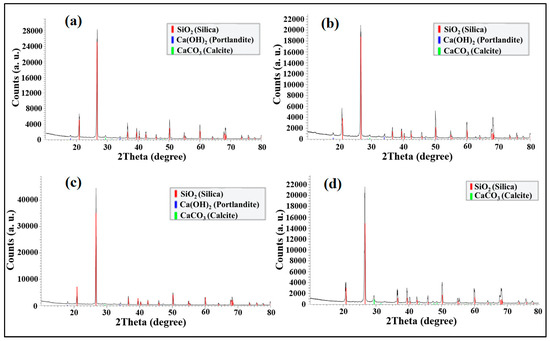
Figure 17.
Diffraction patterns of the ternary mixtures at 90 days. (a) OPC and silica control mix; adding (b) YCKD; (c) ACKD; and (d) UCKD.
New mineral phases were observed when copper tailings replaced silica sand in the ternary mixtures to prepare CPB with OPC, as well as PPC. Whereas XRD analysis detected Silica (SiO2), Calcite (CaCo3), Portlandite (Ca(OH)2), Pyrite (FeS2), Iron oxide (Fe2O3), Dolomite (CaMg(CO3)2), and a slight presence for Hielscherite in the control mix, as well as mixtures that were modified with 5, 10, and 15% CKD materials, as shown in Figure 18a–d.
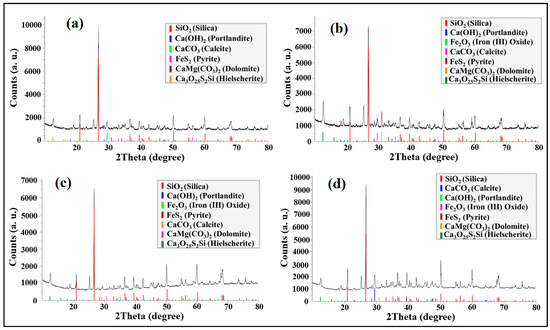
Figure 18.
Diffraction patterns of the ternary mixtures at 90 days. (a) OPC and copper tailings control mix; adding (b) YCKD; (c) ACKD; and (d) UCKD.
We suggest that the detection of dolomite in mineral phases (average 4.7%) is due to the high content of MgO in the copper tailings compared to silica material, which reacts upon hydration with the calcium carbonate and forms calcium magnesium carbonate (Dolomite). That process simulates the Dolomitization process, which occurs when natural limestone changes into dolomite in the presence of magnesium-rich water. Dolomite, in low percentages, can beneficially improve hydration products [85]. Meanwhile, the Pyrite mineral phase presence in the results is associated with copper tailings materials, which contain reactive sulfide minerals such as Pyrite [86]. The obtained XRD results indicate a small weight for Pyrite with an average value of 5.25%, which may not significantly affect the strength of the hardened CPB, as the high content of Pyrite can lead to the phenomena of swelling and cracks in the backfill material. The high content of Fe2O3 in the copper tailings was also reflected in the iron oxide phase upon hydration, which, at a tiny percentage, may provide some benefits to the strength of the hardened mix [87]. Hielscherite, a first ettringite-group mineral, was recorded as a CPB hydration product with an average of 0.71%.
3.6. Predictive Modeling
Predictive modeling is a mathematical technique applied for outcomes or behavior prediction based on statistics. Developing a predictive model helps in trend observation and determining the best results and optimization. Predictive modeling utilizes the existing data (mineral phases weight and measured strength) to build a model that predicts new data outcomes. This study applied two techniques for prediction: multiple variables regression analysis and artificial neural network (ANN) to predict the unconfined compressive strength of the mixtures based on the weight of hydration products. We investigated the significant relationship between independent (mineral phases weight) and dependent (measured strength) variables and indicated the impact strength of the input variables on the output’s values. In addition, we evaluated both developed models based on their statistical indicators.
Nowadays, ANN is leading a technical revolution in the mining industry and related engineering branches due to it providing numerical solutions in a wide range of applications with high efficiency and capability [88]. The prediction of compressive strength is significant and could be done with the best results using ANN [89]. This study applied a neural network with a multilayer perceptron feed-forward backpropagation training algorithm, considered the most helpful type in ANN [90]. The predictive model was based on 60 datasets obtained from XRD minerals phase weights, which were determined for each mixture component phase using quantitative phase analysis (QPA). Two hidden layers, an architecture of 10-10-1-1, ten inputs, and one output parameter were considered while developing the predictive model, as shown in Table 6.
Table 6.
The considered inputs and output parameters in the ANN predictive model.
The regression analysis predictive model showed a medium positive correlation with good statistical indicators, such as a correlation coefficient (R2) value of 0.945, root mean square error (RMSE) of 5.097, and mean absolute error (MAE) of 3.618 (Figure 19). Meanwhile, the predictive model designed by ANN exhibited a significant positive correlation with excellent statistical parameters that achieved 0.995, 0.065, and 0.911 for R2, RMSE, and MAE, respectively, which is a higher R2 and lower values of RMSE and MAE (Figure 20). Figure 21 and Figure 22 illustrate the comparisons of predictive models developed using regression analysis and ANN. The obtained findings of both developed predictive models indicate that artificial neural networks (ANN) can be used as an intelligent tool to achieve optimized cemented paste backfill (CPB) operation that can positively impact backfill productivity and this technology cost.
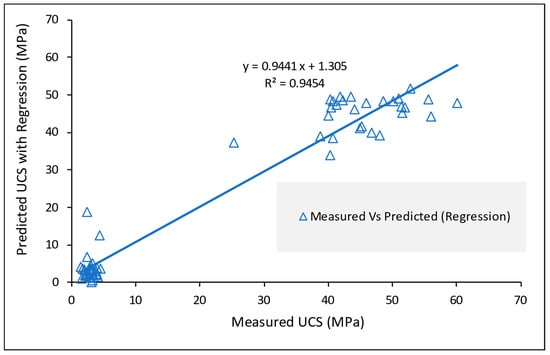
Figure 19.
Medium positive correlation between measured UCS and values predicted by conventional regression.
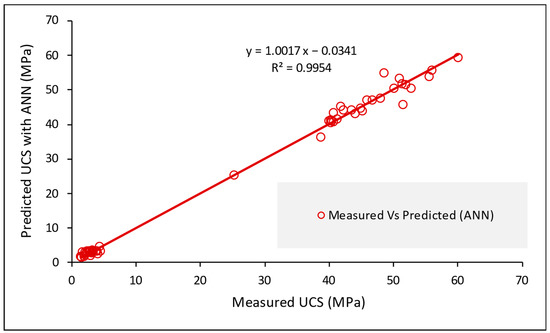
Figure 20.
Significant positive correlation between measured UCS and values predicted by ANN.
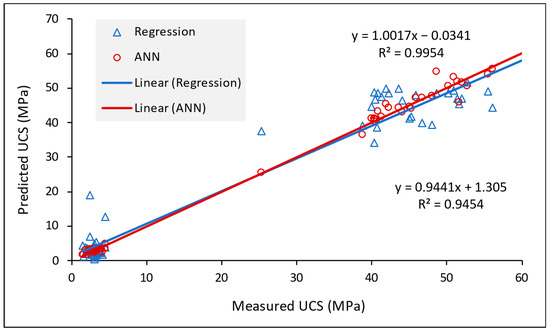
Figure 21.
Comparison of predictive models developed using regression analysis and ANN.
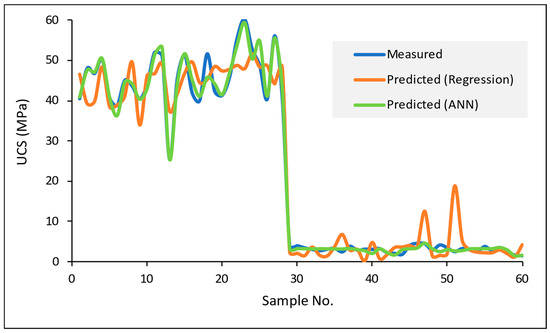
Figure 22.
Comparison of measured UCS and predicted values using regression analysis and ANN.
4. Conclusions
This study investigated the beneficial utilization of cement kiln dust and copper tailing as undesirable wastes from cement and mining industries in the underground mines’ cemented paste backfill (CPB). Sixty different mixtures were prepared and extensively investigated. The findings showed that CKD could be used in the CPB mixture as a partial replacement for cement, with a proportion of up to 15%.
CKD could increase the density values of the modified samples compared to the control mix. Meanwhile, CKD induced improvement in the strength at a long-term curing time in the binary mixture and ternary mixture prepared with silica sand. However, while using copper tailings in the ternary mixtures, CKD’s lime saturation factor (LSF) significantly impacted the achieved maximum strength. Where CKD material had a high LSF value, it reached better strengths at a low replacing proportion, and vice versa in the presence of OPC. At the same time, that relationship could be slightly affected by using PPC due to the pozzolanic content. An added value in axial deformation was also recorded upon using CKD as a partial replacement for cement in the mix. In addition, there was no significant influence on the consistency and flowability when gradually modifying the CPB mixture with CKD. The primary mineral phases detected in the binary mixtures were Portlandite, Calcite, and Alite or Larnite (Belite). The tricalcium silicate (Alite) and dicalcium silicate (Belite) compounds form C-S-H upon hydration and are responsible for progressive strength; Alite for early strength and Belite for later strength. Meanwhile, mineral phases associated with the CPB mixtures that are prepared with copper tailings, binders, and CKD are Silica, Calcite, Portlandite, Pyrite, Iron oxide, Dolomite, and a slight presence of Hielscherite.
In addition, this study applied multi variables regression analysis and a neural network with a multilayer perceptron feed-forward backpropagation training algorithm to develop the UCS predictive models. ANN exhibited a significant positive correlation with excellent statistical parameters that achieved 0.995, 0.065, and 0.911 for R2, RMSE, and MAE, respectively, which introduces the ANN as an intelligent tool to perform optimized cemented paste backfill (CPB) operation.
Recycling CKD and copper tailings efficiently in the mining industry may provide many advantages, such as reducing the cost of mine backfill operation, minimizing copper tailings and CKD quantities transported to landfills, protecting natural resources used in the cement industry, saving energy, and eventually promoting sustainability.
The promising results of using cement kiln dust (CKD) and copper tailings in cemented paste backfill applications encourage further research to investigate more parameters. These may affect the properties of hardened samples by, for example, humidity and temperature during curing periods, mixing water type and water to solids ratio, and adding some additive materials to the mixture, such as slag.
Author Contributions
Writing the original draft of manuscript, A.Y.A.-B.; supervising the findings of this work, H.M.A. and M.A.H.; reviewing and approving the final version of manuscript, A.Y.A.-B., H.M.A. and M.A.H. All authors have read and agreed to the published version of the manuscript.
Funding
This research received no specific grant from any funding agency.
Institutional Review Board Statement
Not applicable.
Informed Consent Statement
Not applicable.
Data Availability Statement
The data presented in this review are available within the manuscript.
Acknowledgments
The authors of this manuscript thank the Department of Mining Engineering at King Abdulaziz University for facilitating this research journey. Also, thanks to Maaden Barrick Copper Company and local cement manufacturers (YCC, ACC, and UCIC) for supplying us with the used raw materials that made this work successful and SAMIROCK Company for providing logistics.
Conflicts of Interest
The authors declare no conflict of interest.
References
- Al-Bakri, A.Y.; Ahmed, H.M.; Hefni, M.A. Cement Kiln Dust (CKD): Potential Beneficial Applications and Eco-Sustainable Solutions. Sustainability 2022, 14, 7022. [Google Scholar] [CrossRef]
- Srividhya, S.; Vidjeapriya, R.; Neelamegam, M.; Srividhya, S.; Vidjeapriya, R.; Neelamegam, M. Enhancing the performance of hyposludge concrete beams using basalt fiber and latex under cyclic loading. Comput. Concr. 2021, 28, 93–105. [Google Scholar] [CrossRef]
- Prakash, R.; Thenmozhi, R.; Raman, S.N. Mechanical characterisation and flexural performance of eco-friendly concrete produced with fly ash as cement replacement and coconut shell coarse aggregate. Int. J. Environ. Sustain. Dev. 2019, 18, 131–148. [Google Scholar] [CrossRef]
- Prakash, R.; Raman, S.N.; Subramanian, C.; Divyah, N. Eco-Friendly Fiber-Reinforced Concretes; Elsevier: Amsterdam, The Netherlands, 2022; ISBN 9780128217306. [Google Scholar]
- Siddique, R. Utilization of cement kiln dust (CKD) in cement mortar and concrete-an overview. Resour. Conserv. Recycl. 2006, 48, 315–338. [Google Scholar] [CrossRef]
- Kessler, G.R. Cement Kiln Dust (CKD) Methods for Reduction and Control. IEEE Trans. Ind. Appl. 1995, 31, 407–412. [Google Scholar] [CrossRef]
- Abdalla, A.A.; Salih Mohammed, A. Theoretical models to evaluate the effect of SiO2 and CaO contents on the long-term compressive strength of cement mortar modified with cement kiln dust (CKD). Arch. Civ. Mech. Eng. 2022, 22, 105. [Google Scholar] [CrossRef]
- Ranjkesh Adarmanabadi, H.; Rasti, A.; Razavi, M. Long-term effects of Cement Kiln Dust (CKD) on erosion control of a soil slope. Int. J. Geotech. Eng. 2021, 16, 225–238. [Google Scholar] [CrossRef]
- EPA United States Environmental Protection Agency. Report to Congress on Cement Kiln Dust; Report:EPA/530-R-94-001; EPA United States Environmental Protection Agency: Washington, DC, USA, 1993. [Google Scholar]
- Kunal; Siddique, R.; Rajor, A. Use of cement kiln dust in cement concrete and its leachate characteristics. Resour. Conserv. Recycl. 2012, 61, 59–68. [Google Scholar] [CrossRef]
- Seo, M.; Lee, S.Y.; Lee, C.; Cho, S.S. Recycling of cement kiln dust as a raw material for cement. Environments 2019, 6, 113. [Google Scholar] [CrossRef]
- Ghavami, S.; Jahanbakhsh, H.; Saeedi Azizkandi, A.; Moghadas Nejad, F. Influence of sodium chloride on cement kiln dust-treated clayey soil: Strength properties, cost analysis, and environmental impact. Environ. Dev. Sustain. 2021, 23, 683–702. [Google Scholar] [CrossRef]
- Pedraza, J.; Zimmermann, A.; Tobon, J.; Schomäcker, R.; Rojas, N. On the road to net zero-emission cement: Integrated assessment of mineral carbonation of cement kiln dust. Chem. Eng. J. 2021, 408, 127346. [Google Scholar] [CrossRef]
- Mohamed, A.M.O.; El Gamal, M.M. Solidification of cement kiln dust using sulfur binder. J. Hazard. Mater. 2011, 192, 576–584. [Google Scholar] [CrossRef] [PubMed]
- Lachemi, M.; Hossain, K.M.A.; Shehata, M.; Thaha, W. Controlled low strength materials incorporating cement kiln dust from various sources. Cem. Concr. Compos. 2008, 30, 381–392. [Google Scholar] [CrossRef]
- Abdel-wahed, T.; Dulaimi, A.; Shanbara, H.K.; Nageim, H. Al The Impact of Cement Kiln Dust and Cement on Cold Mix Asphalt Characteristics at Different Climate. Sustainability 2022, 14, 4173. [Google Scholar] [CrossRef]
- Abbas, R.A.H.; Shehata, N.; Elrahman, E.A.; Salah, H.; Abdelzahera, M.A. Environmental safe disposal of cement kiln dust for the production of geopolymers. Egypt. J. Chem. 2021, 64, 7429–7437. [Google Scholar] [CrossRef]
- Lima, M.S.S.; Hajibabaei, M.; Thives, L.P.; Haritonovs, V.; Buttgereit, A. Environmental potentials of asphalt mixtures fabricated with red mud and fly ash. Road Mater. Pavement Des. 2021, 22, S690–S701. [Google Scholar] [CrossRef]
- Ghorab, H.Y.; Anter, A.; El Miniawy, H. Building with local materials: Stabilized soil and industrial wastes. Mater. Manuf. Process. 2007, 22, 157–162. [Google Scholar] [CrossRef]
- Sreekrishnavilasam, A.; Rahardja, S.; Kmetz, R.; Santagata, M. Soil treatment using fresh and landfilled cement kiln dust. Constr. Build. Mater. 2007, 21, 318–327. [Google Scholar] [CrossRef]
- Moon, D.H.; Wazne, M.; Yoon, I.H.; Grubb, D.G. Assessment of cement kiln dust (CKD) for stabilization/solidification (S/S) of arsenic contaminated soils. J. Hazard. Mater. 2008, 159, 512–518. [Google Scholar] [CrossRef]
- Carlson, K.; Sariosseiri, F.; Muhunthan, B. Engineering Properties of Cement Kiln Dust-Modified Soils in Western Washington State. Geotech. Geol. Eng. 2011, 29, 837–844. [Google Scholar] [CrossRef]
- Ebrahimi, A.; Edil, T.B.; Son, Y.-H. Effectiveness of Cement Kiln Dust in Stabilizing Recycled Base Materials. J. Mater. Civ. Eng. 2012, 24, 1059–1066. [Google Scholar] [CrossRef]
- Albusoda, B.S.; Salem, L.A.K. Stabilization of Dune Sand By Using Cement Kiln Dust (CKD). J. Earth Sci. Geotech. Eng. Sci. Press. 2012, 2, 131–143. [Google Scholar]
- Okafor, F.O.; Egbe, E.A. Potentials of Cement Kiln Dust in Sub-Grade Improvement. Niger. J. Technol. 2013, 32, 109–116. [Google Scholar]
- Gupta, S.; Pandey, M.K.; Srivastava, R.K. Evaluation of Cement Kiln Dust Stabilized Heavy Metals Contaminated Expansive Soil-A Laboratory Study. Eur. J. Adv. Eng. Technol. 2015, 2, 37–42. [Google Scholar]
- Arulrajah, A.; Mohammadinia, A.; D’Amico, A.; Horpibulsuk, S. Cement kiln dust and fly ash blends as an alternative binder for the stabilization of demolition aggregates. Constr. Build. Mater. 2017, 145, 218–225. [Google Scholar] [CrossRef]
- Mohammadinia, A.; Arulrajah, A.; D’Amico, A.; Horpibulsuk, S. Alkali-activation of fly ash and cement kiln dust mixtures for stabilization of demolition aggregates. Constr. Build. Mater. 2018, 186, 71–78. [Google Scholar] [CrossRef]
- Ekpo, D.U.; Fajobi, A.B.; Ayodele, A.L.; Etim, R.K. Potentials of Cement Kiln Dust-Periwinkle Shell Ash Blends on Plasticity Properties of Two Selected Tropical Soils for use as Sustainable Construction Materials. In Proceedings of the IOP Conference Series: Materials Science and Engineering, Sanya, China, 12–14 November 2021; Volume 1036, p. 012033. [Google Scholar]
- Al-Harthy, A.S.; Taha, R.; Al-Maamary, F. Effect of cement kiln dust (CKD) on mortar and concrete mixtures. Constr. Build. Mater. 2003, 17, 353–360. [Google Scholar] [CrossRef]
- Mohammad, A.M.; Hilal, N. Re-using The By-product of Cement Industry (Cement Kiln Dust) To Produce The Concrete. Anbar J. Eng. Sci. 2010, 3, 1–14. [Google Scholar] [CrossRef]
- Marku, J.; Dumi, I.; Lico, E.; Dilo, T.; Çakaj, O. Ckd in Mortar & Conc Prodctn. Mater. Prot. 2012, 53, 334–345. [Google Scholar]
- El-Mohsen, M.A.; Anwar, A.M.; Adam, I.A. Mechanical properties of Self-Consolidating Concrete incorporating Cement Kiln Dust. HBRC J. 2015, 11, 1–6. [Google Scholar] [CrossRef]
- Hussain, G.S.; Rao, R. Experimental Studies on Concrete Containing Cement Kiln Dust and Fly Ash. Singap. J. Sci. Res. 2014, 6, 85–88. [Google Scholar]
- Sadek, D.M.; El-Attar, M.M.; Ali, A.M. Physico-mechanical and durability characteristics of concrete paving blocks incorporating cement kiln dust. Constr. Build. Mater. 2017, 157, 300–312. [Google Scholar] [CrossRef]
- Saleh, H.M.; Salman, A.A.; Faheim, A.A.; El-Sayed, A.M. Sustainable composite of improved lightweight concrete from cement kiln dust with grated poly (styrene). J. Clean. Prod. 2020, 277, 123491. [Google Scholar] [CrossRef]
- Bagheri, S.M.; Koushkbaghi, M.; Mohseni, E.; Koushkbaghi, S.; Tahmouresi, B. Evaluation of environment and economy viable recycling cement kiln dust for use in green concrete. J. Build. Eng. 2020, 32, 101809. [Google Scholar] [CrossRef]
- Aydin, T.; Tarhan, M.; Tarhan, B. Addition of cement kiln dust in ceramic wall tile bodies. J. Therm. Anal. Calorim. 2019, 136, 527–533. [Google Scholar] [CrossRef]
- Ewais, E.M.M.; Ahmed, Y.M.Z.; El-Amir, A.A.M.; El-Didamony, H. Cement kiln dust-quartz derived wollastonite ceramics. J. Ceram. Soc. Japan 2015, 123, 527–536. [Google Scholar] [CrossRef]
- Ali, M.A.M.; Yang, H.S. Utilization of cement kiln dust in industry cement bricks. Geosystem Eng. 2011, 14, 29–34. [Google Scholar] [CrossRef]
- Ogila, W.A. Recycling of Cement Kiln Dust in Red Clay Bricks and its Impact on their Physico-Mechanical Behaviors. Int. J. Sci. Eng. Res. 2014, 5, 1072–1080. [Google Scholar]
- El-Attar, M.M.; Sadek, D.M.; Salah, A.M. Recycling of high volumes of cement kiln dust in bricks industry. J. Clean. Prod. 2017, 143, 506–515. [Google Scholar] [CrossRef]
- Abdel-Gawwad, H.A.; Rashad, A.M.; Mohammed, M.S.; Tawfik, T.A. The potential application of cement kiln dust-red clay brick waste-silica fume composites as unfired building bricks with outstanding properties and high ability to CO2-capture. J. Build. Eng. 2021, 42, 102479. [Google Scholar] [CrossRef]
- Abdulkareem, A.H.; Eyada, S.O. Production of Building Bricks Using Cement Kiln Dust CKD Waste. In Proceedings of the Sustainable Civil Infrastructures, Cairo, Egypt, 24–28 November 2018; Springer: Cham, Switzerland, 2018; pp. 102–113. [Google Scholar]
- Al-Refeai, T.O.; Al-Karni, A.A. Experimental Study on the Utilization of Cement Kiln Dust for Ground Modification. J. King Saud Univ. —Eng. Sci. 1999, 11, 217–231. [Google Scholar] [CrossRef]
- Daous, M. Utilization of Cement Kiln Dust and Fly Ash in Cement Blends in Saudi Arabia. J. King Abdulaziz Univ. Sci. 2004, 15, 33–45. [Google Scholar] [CrossRef]
- Maslehuddin, M.; Al-Amoudi, O.S.B.; Shameem, M.; Rehman, M.K.; Ibrahim, M. Usage of cement kiln dust in cement products—Research review and preliminary investigations. Constr. Build. Mater. 2008, 22, 2369–2375. [Google Scholar] [CrossRef]
- Mahyoup, G. Stabilization of Eastern Saudi Soils Using Heavy Fuel Oil Fly Ash and Cement Kiln Dust. Master’s Thesis, King Fahd University of Petroleum and Minerals, Dhahran, Saudi Arabia, 2009. [Google Scholar]
- Ghazaly, M.; Almaghrabi, N.; Ebrahiem, E. Study on the Reuse of Cement Kiln Dust in the Production of Cement Concerts. Minia J. Eng. Technol. 2012, 31, 63–68. [Google Scholar]
- Alawi, M. Utilization of Using Cement Kiln Dust (Ckd) As a Surfacial Clay Soil Stabilizer Underneath Roads. J. Al-Azhar Univ. Eng. Sect. 2016, 11, 1101–1111. [Google Scholar] [CrossRef]
- Al-Homidy, A.A.; Dahim, M.H.; Abd El Aal, A.K. Improvement of geotechnical properties of sabkha soil utilizing cement kiln dust. J. Rock Mech. Geotech. Eng. 2017, 9, 749–760. [Google Scholar] [CrossRef]
- Alharthi, Y.M.; Elamary, A.S.; Abo-El-wafa, W. Performance of plain concrete and cement blocks with cement partially replaced by cement kiln dust. Materials 2021, 14, 5647. [Google Scholar] [CrossRef] [PubMed]
- Badri, A.; Nadeau, S.; Gbodossou, A. A mining project is a field of risks: A systematic and preliminary portrait of mining risks. Int. J. Saf. Secur. Eng. 2012, 2, 145–166. [Google Scholar] [CrossRef]
- Ivanova, G. The mining industry in Queensland, Australia: Some regional development issues. Resour. Policy 2014, 39, 101–114. [Google Scholar] [CrossRef]
- Cacciuttolo, C.; Cano, D. Environmental Impact Assessment of Mine Tailings Spill Considering Metallurgical Processes of Gold and Copper Mining: Case Studies in the Andean Countries of Chile and Peru. Water 2022, 14, 3057. [Google Scholar] [CrossRef]
- Hefni, M.; Ahmed, H.A.M.; Omar, E.S.; Ali, M.A. The potential re-use of saudi mine tailings in mine backfill: A path towards sustainable mining in saudi arabia. Sustainability 2021, 13, 6204. [Google Scholar] [CrossRef]
- Qi, C.; Fourie, A. Cemented paste backfill for mineral tailings management: Review and future perspectives. Miner. Eng. 2019, 144, 106025. [Google Scholar] [CrossRef]
- Pan, A.; Grabinsky, M. Yield Characteristics of Cemented Paste Backfill. CivilEng 2022, 3, 1053–1060. [Google Scholar] [CrossRef]
- Tariq, A.; Yanful, E.K. A review of binders used in cemented paste tailings for underground and surface disposal practices. J. Environ. Manage. 2013, 131, 138–149. [Google Scholar] [CrossRef] [PubMed]
- Sheshpari, M. A review of underground mine backfilling methods with emphasis on cemented paste backfill. Electron. J. Geotech. Eng. 2015, 20, 5183–5208. [Google Scholar]
- Belem, T.; Benzaazoua, M. Design and application of underground mine paste backfill technology. Geotech. Geol. Eng. 2008, 26, 147–174. [Google Scholar] [CrossRef]
- Peyronnard, O.; Benzaazoua, M. Alternative by-product based binders for cemented mine backfill: Recipes optimisation using Taguchi method. Miner. Eng. 2012, 29, 28–38. [Google Scholar] [CrossRef]
- Lutyński, M.; Pierzyna, P. Reuse of Cement Kiln Dust for backfilling and CO 2 carbonation. In Proceedings of the Mineral Engineering Conference MEC2017, Wisła, Poland, 20–23 September 2017; Volume 18. [Google Scholar]
- Beltagui, H.; Sonebi, M.; Maguire, K.; Taylor, S. Feasibility of backfilling mines using cement kiln dust, fly ash, and cement blends. In Proceedings of the 2nd International Congress on Materials & Structural Stability (CMSS-2017), Rabat, Morocco, 22–25 November 2017; Volume 149, pp. 1–5. [Google Scholar]
- Khudyakova, T.M.; Kolesnikov, A.S.; Zhakipbaev, B.E.; Kenzhibaeva, G.S.; Kutzhanova, A.N.; Iztleuov, G.M.; Zhanikulov, N.N.; Kolesnikova, O.G.; Mynbaeva, E. Optimization of Raw Material Mixes in Studying Mixed Cements and Their Physicomechnical Properties. Refract. Ind. Ceram. 2019, 60, 76–81. [Google Scholar] [CrossRef]
- Kolesnikova, O.; Syrlybekkyzy, S.; Fediuk, R.; Yerzhanov, A.; Nadirov, R.; Utelbayeva, A.; Agabekova, A.; Latypova, M.; Chepelyan, L.; Volokitina, I.; et al. Thermodynamic Simulation of Environmental and Population Protection by Utilization of Technogenic Tailings of Enrichment. Materials 2022, 15, 6980. [Google Scholar] [CrossRef]
- Zhao, Y.; Soltani, A.; Taheri, A.; Karakus, M.; Deng, A. Application of slag–cement and fly ash for strength development in cemented paste backfills. Minerals 2019, 9, 22. [Google Scholar] [CrossRef]
- Hu, J.; Ding, X.; Ren, Q.; Luo, Z.; Jiang, Q. Effect of incorporating waste limestone powder into solid waste cemented paste backfill material. Appl. Sci. 2019, 9, 2076. [Google Scholar] [CrossRef]
- ASTM C204-0; Standard Test Method for Fineness of Hydraulic Cement by Air Permeability Apparatus. ASTM International: West Conshohocken, PA, USA, 2017. [CrossRef]
- Zhang, L.; Liu, S.; Song, D. Effect of the content of micro-active copper tailing on the strength and pore structure of cementitious materials. Materials 2019, 12, 1861. [Google Scholar] [CrossRef] [PubMed]
- ASTM D7481-18; Standard Test Methods for Determining Loose and Tapped Bulk Densities of Powders Using a Graduated Cylinder (Withdrawn 2018). ASTM International: West Conshohocken, PA, USA, 2018. [CrossRef]
- Arezou, R.; Maria, P.; Mehrdad, R. Assessment of Soil Moisture Content Measurement Methods: Conventional Laboratory Oven versus Halogen Moisture Analyzer. J. Soil Water Sci. 2020, 4, 151–160. [Google Scholar] [CrossRef]
- ASTM D2216-19; Standard Test Methods for Laboratory Determination of Water (Moisture) Content of Soil and Rock by Mass. ASTM International: West Conshohocken, PA, USA, 2019. [CrossRef]
- ASTM C642-97; Standard Test Method for Density, Absorption, and Voids in Hardened Concrete. ASTM International: West Conshohocken, PA, USA, 2017. [CrossRef]
- Hefni, M.; Hassani, F. Effect of air entrainment on cemented mine backfill properties: Analysis based on response surface methodology. Minerals 2021, 11, 81. [Google Scholar] [CrossRef]
- ASTM D2166-06; Standard Test Method for Unconfined Compressive Strength of Cohesive Soil. ASTM International: West Conshohocken, PA, USA, 2010. [CrossRef]
- Adewuyi, S.O.; Ahmed, H.A.M. Grinding behaviour of microwave-irradiated mining waste. Energies 2021, 14, 3991. [Google Scholar] [CrossRef]
- Ahmed, H.M.; Ahmed, H.A.M.; Adewuyi, S.O. Characterization of microschist rocks under high temperature at Najran area of Saudi Arabia. Energies 2021, 14, 7612. [Google Scholar] [CrossRef]
- Ahmari, S.; Zhang, L. Utilization of cement kiln dust (CKD) to enhance mine tailings-based geopolymer bricks. Constr. Build. Mater. 2013, 40, 1002–1011. [Google Scholar] [CrossRef]
- Niroshan, N.; Yin, L.; Sivakugan, N.; Veenstra, R.L. Relevance of SEM to Long-Term Mechanical Properties of Cemented Paste Backfill. Geotech. Geol. Eng. 2018, 36, 2171–2187. [Google Scholar] [CrossRef]
- Ercikdi, B.; Baki, H.; Izki, M. Effect of desliming of sulphide-rich mill tailings on the long-term strength of cemented paste backfill. J. Environ. Manag. 2013, 115, 5–13. [Google Scholar] [CrossRef]
- Roussel, N. Correlation between yield stress and slump: Comparison between numerical simulations and concrete rheometers results. Mater. Struct. Constr. 2006, 39, 501–509. [Google Scholar] [CrossRef]
- Mbasha, W.; Masalova, I.; Haldenwang, R.; Malkin, A. The yield stress of cement pastes as obtained by different rheological approaches. Appl. Rheol. 2015, 25, 9–19. [Google Scholar] [CrossRef]
- Simon, D.; Grabinsky, M. Apparent yield stress measurement in cemented paste backfill. Int. J. Mining, Reclam. Environ. 2013, 27, 231–256. [Google Scholar] [CrossRef]
- Szybilski, M.; Nocuń-Wczelik, W. The effect of dolomite additive on cement hydration. Procedia Eng. 2015, 108, 193–198. [Google Scholar] [CrossRef]
- Santander, M.; Valderrama, L. Recovery of pyrite from copper tailings by flotation. J. Mater. Res. Technol. 2019, 8, 4312–4317. [Google Scholar] [CrossRef]
- Nazari, A.; Rihani, S.; Shirin, R.; Shamekhi, S.F.; Khademno, A. Benefits of Fe2O3 nanoparticles in concrete mixing matrix. J. Am. Sci. 2010, 6, 102–106. [Google Scholar]
- Al-Bakri, A.Y.; Sazid, M. Application of Artificial Neural Network (ANN) for Prediction and Optimization of Blast-Induced Impacts. Mining 2021, 1, 315–334. [Google Scholar] [CrossRef]
- Ozturan, M.; Kutlu, B.; Ozturan, T. Comparison of concrete strength prediction techniques with artificial neural network. Build. Res. J. 2008, 56, 23–36. [Google Scholar]
- Shakeri, J.; Khoshalan, H.A.; Dehghani, H.; Bascompta, M.; Onyelowe, K. Developing New Models for Flyrock Distance Assessment in Open-Pit Mines. J. Min. Environ. 2022, 13, 377–391. [Google Scholar] [CrossRef]
Disclaimer/Publisher’s Note: The statements, opinions and data contained in all publications are solely those of the individual author(s) and contributor(s) and not of MDPI and/or the editor(s). MDPI and/or the editor(s) disclaim responsibility for any injury to people or property resulting from any ideas, methods, instructions or products referred to in the content. |
© 2023 by the authors. Licensee MDPI, Basel, Switzerland. This article is an open access article distributed under the terms and conditions of the Creative Commons Attribution (CC BY) license (https://creativecommons.org/licenses/by/4.0/).