
Mixed Exponentially Weighted Moving Average—Moving Average Control Chart with Application to Combined Cycle Power Plant

 ,
,  , and
, and
Abstract
:1. Introduction
- The revised variance of the mixed EWMA-MA statistic along with control limits by considering both the independent and dependent behavior of MA terms which enhances its applicability;
- The run-length profile and the associated performance metrics such as average run length, standard deviation of run length, and median run length using Monte Carlo simulations;
- The use of average extra quadratic loss and relative mean index for a more thorough assessment of the EWMA-MA control chart to detect a range of shifts;
- A comprehensive table of the design parameters of the EWMA-MA chart to aid practitioners in implementation;
- An extensive simulation-based comparative study to assess the performance of the EWMA-MA chart against several competing traditional and combined/mixed control charts;
- The robustness of the mixed EWMA-MA control chart for various continuous symmetrical and skewed process distributions;
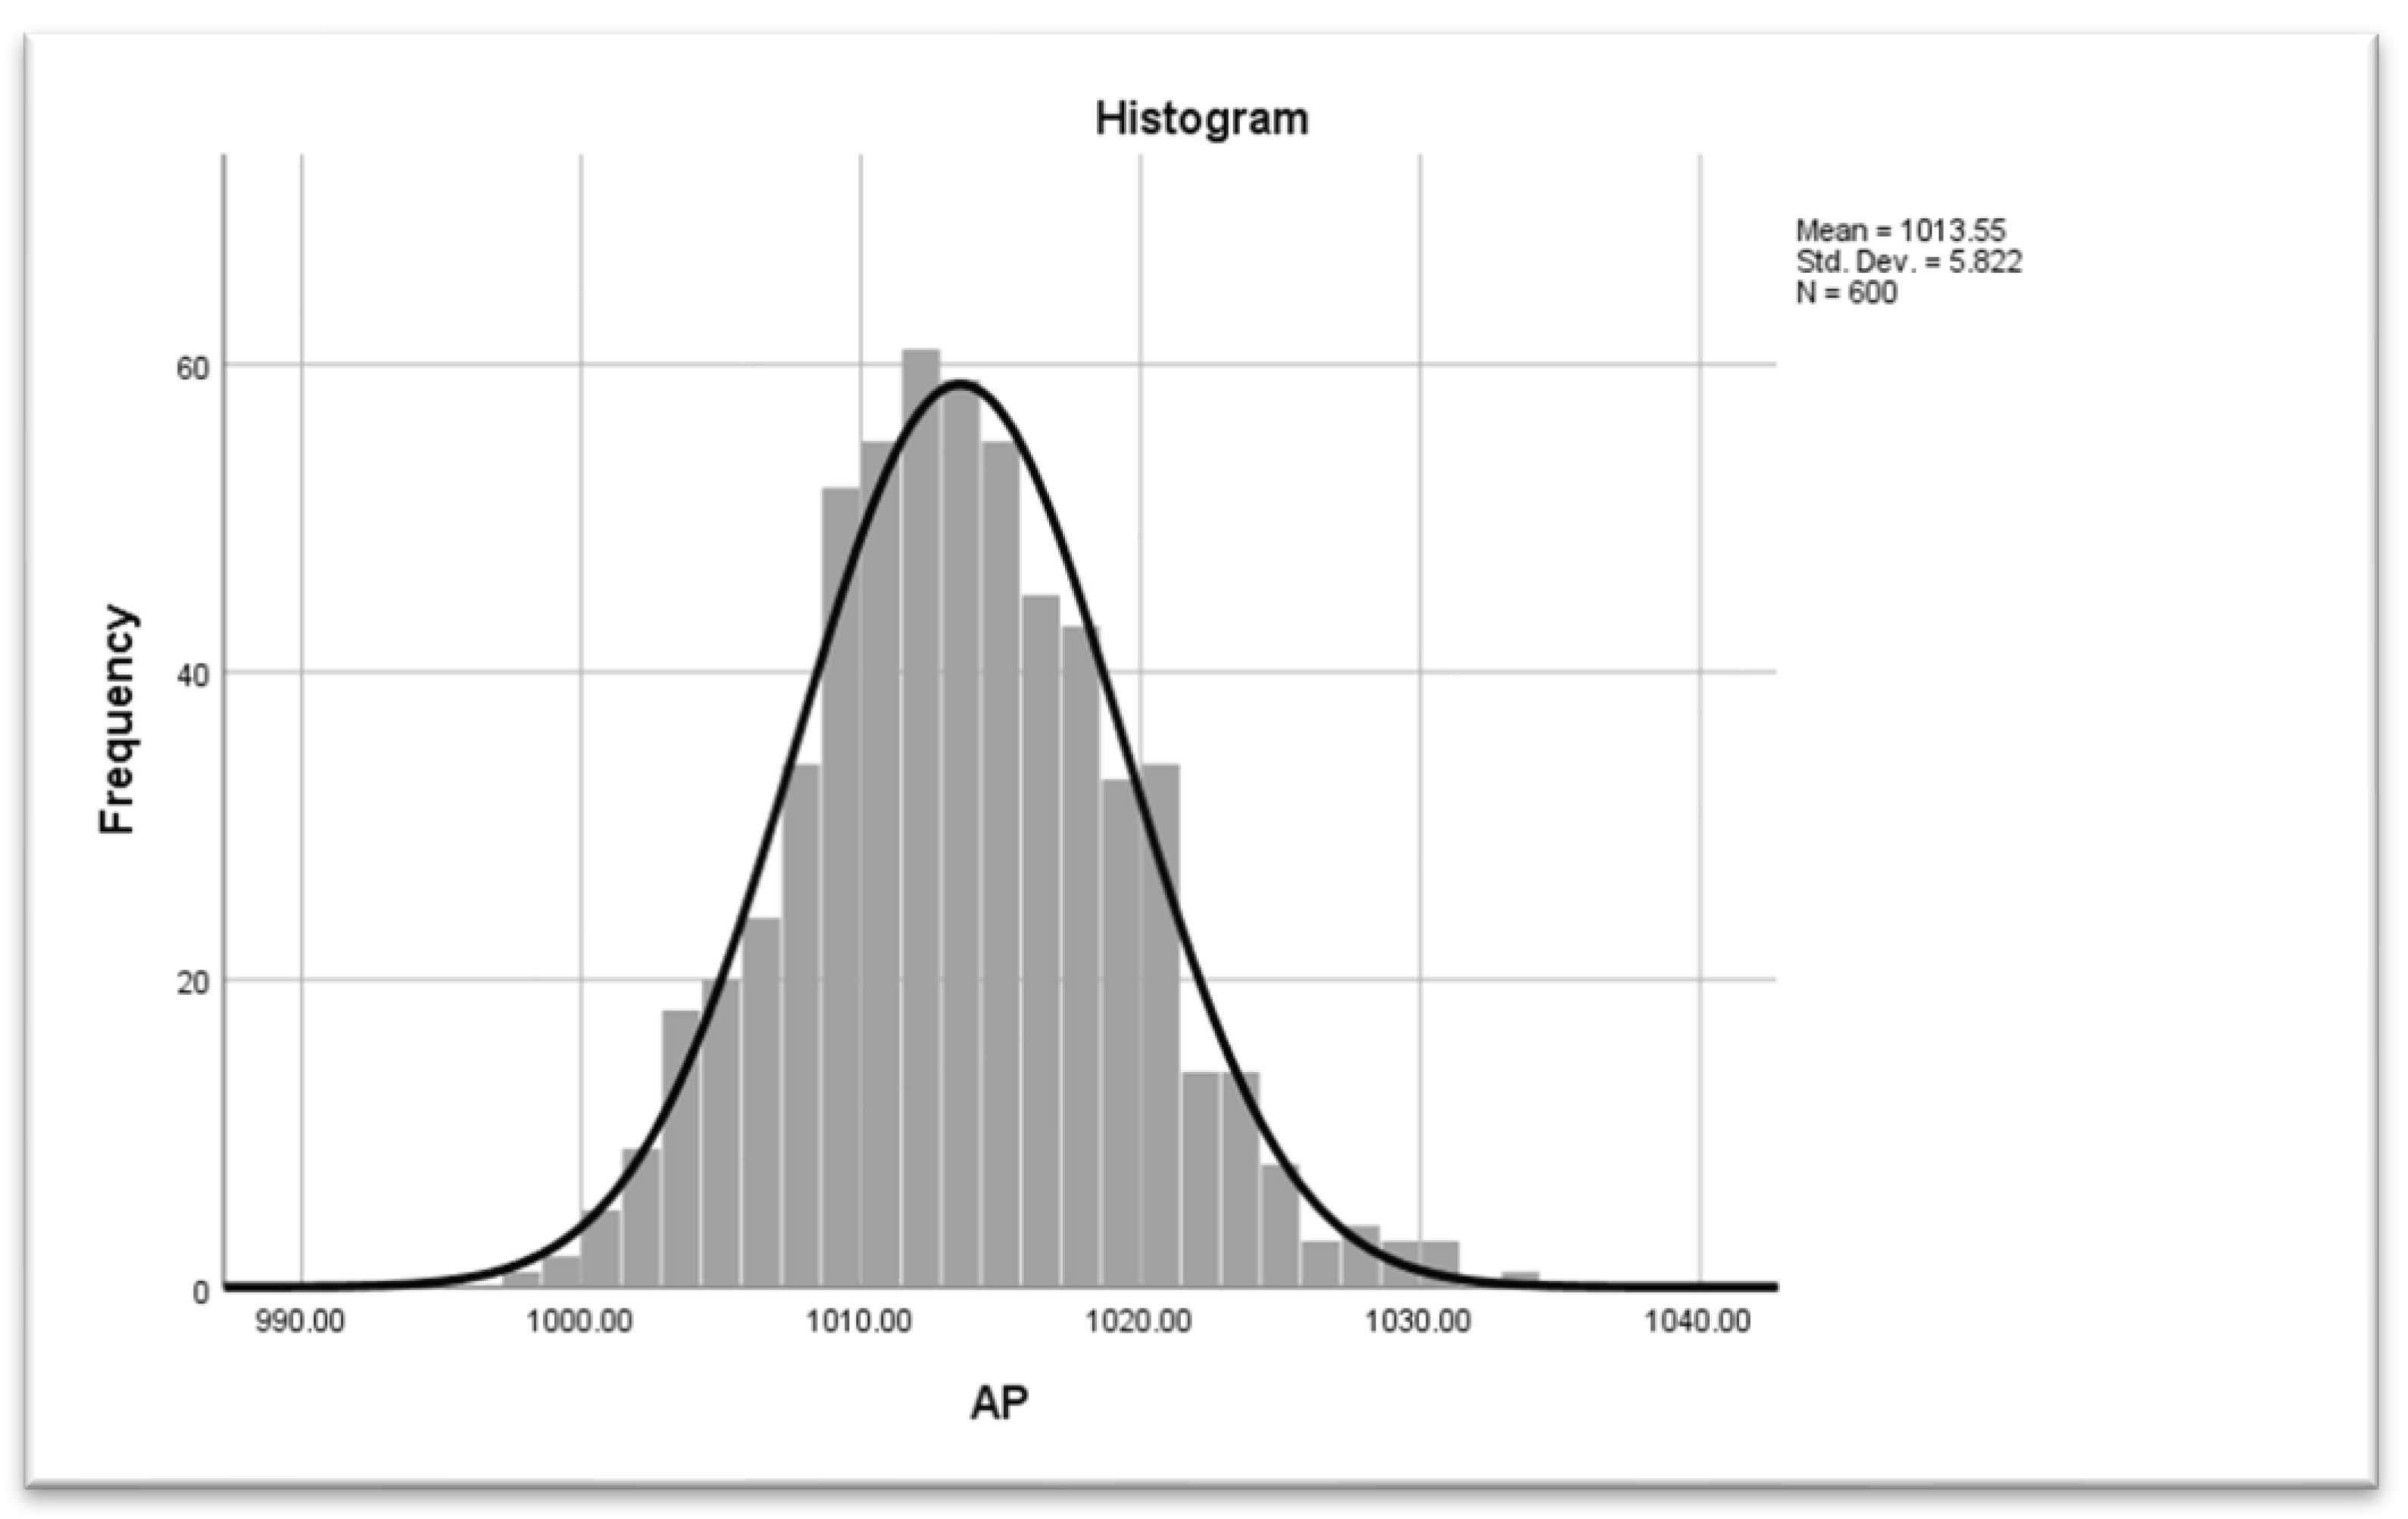
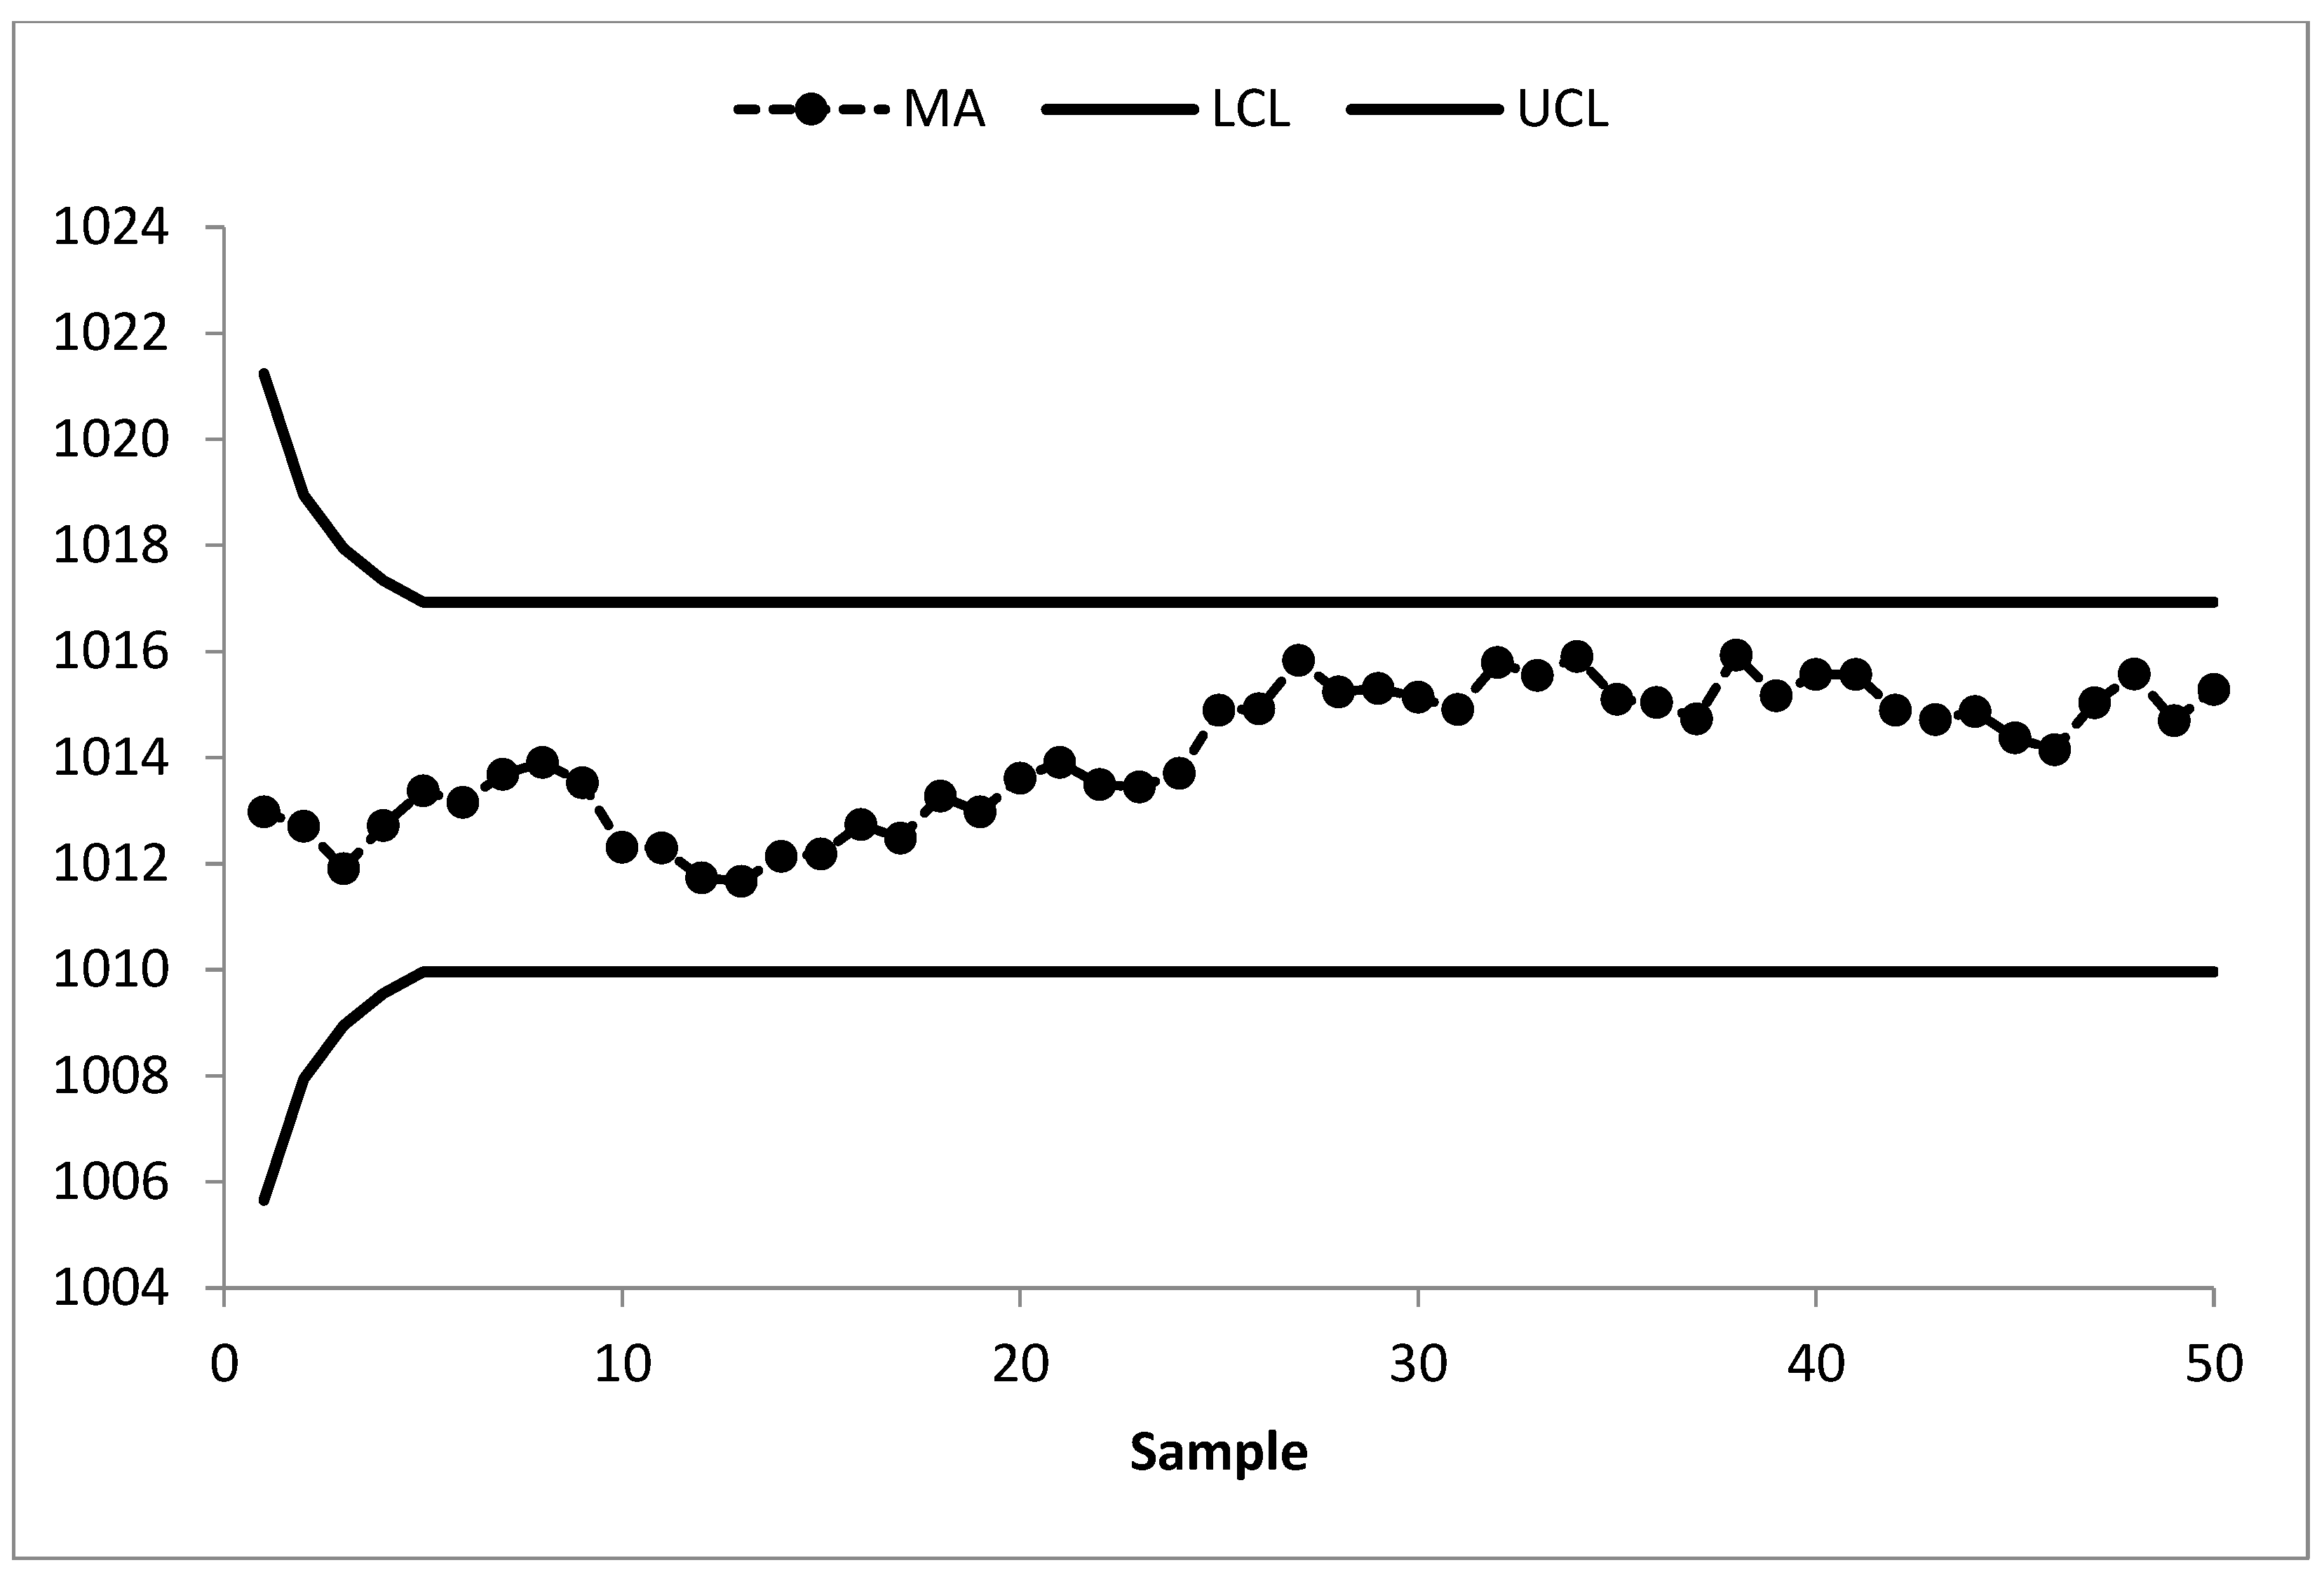
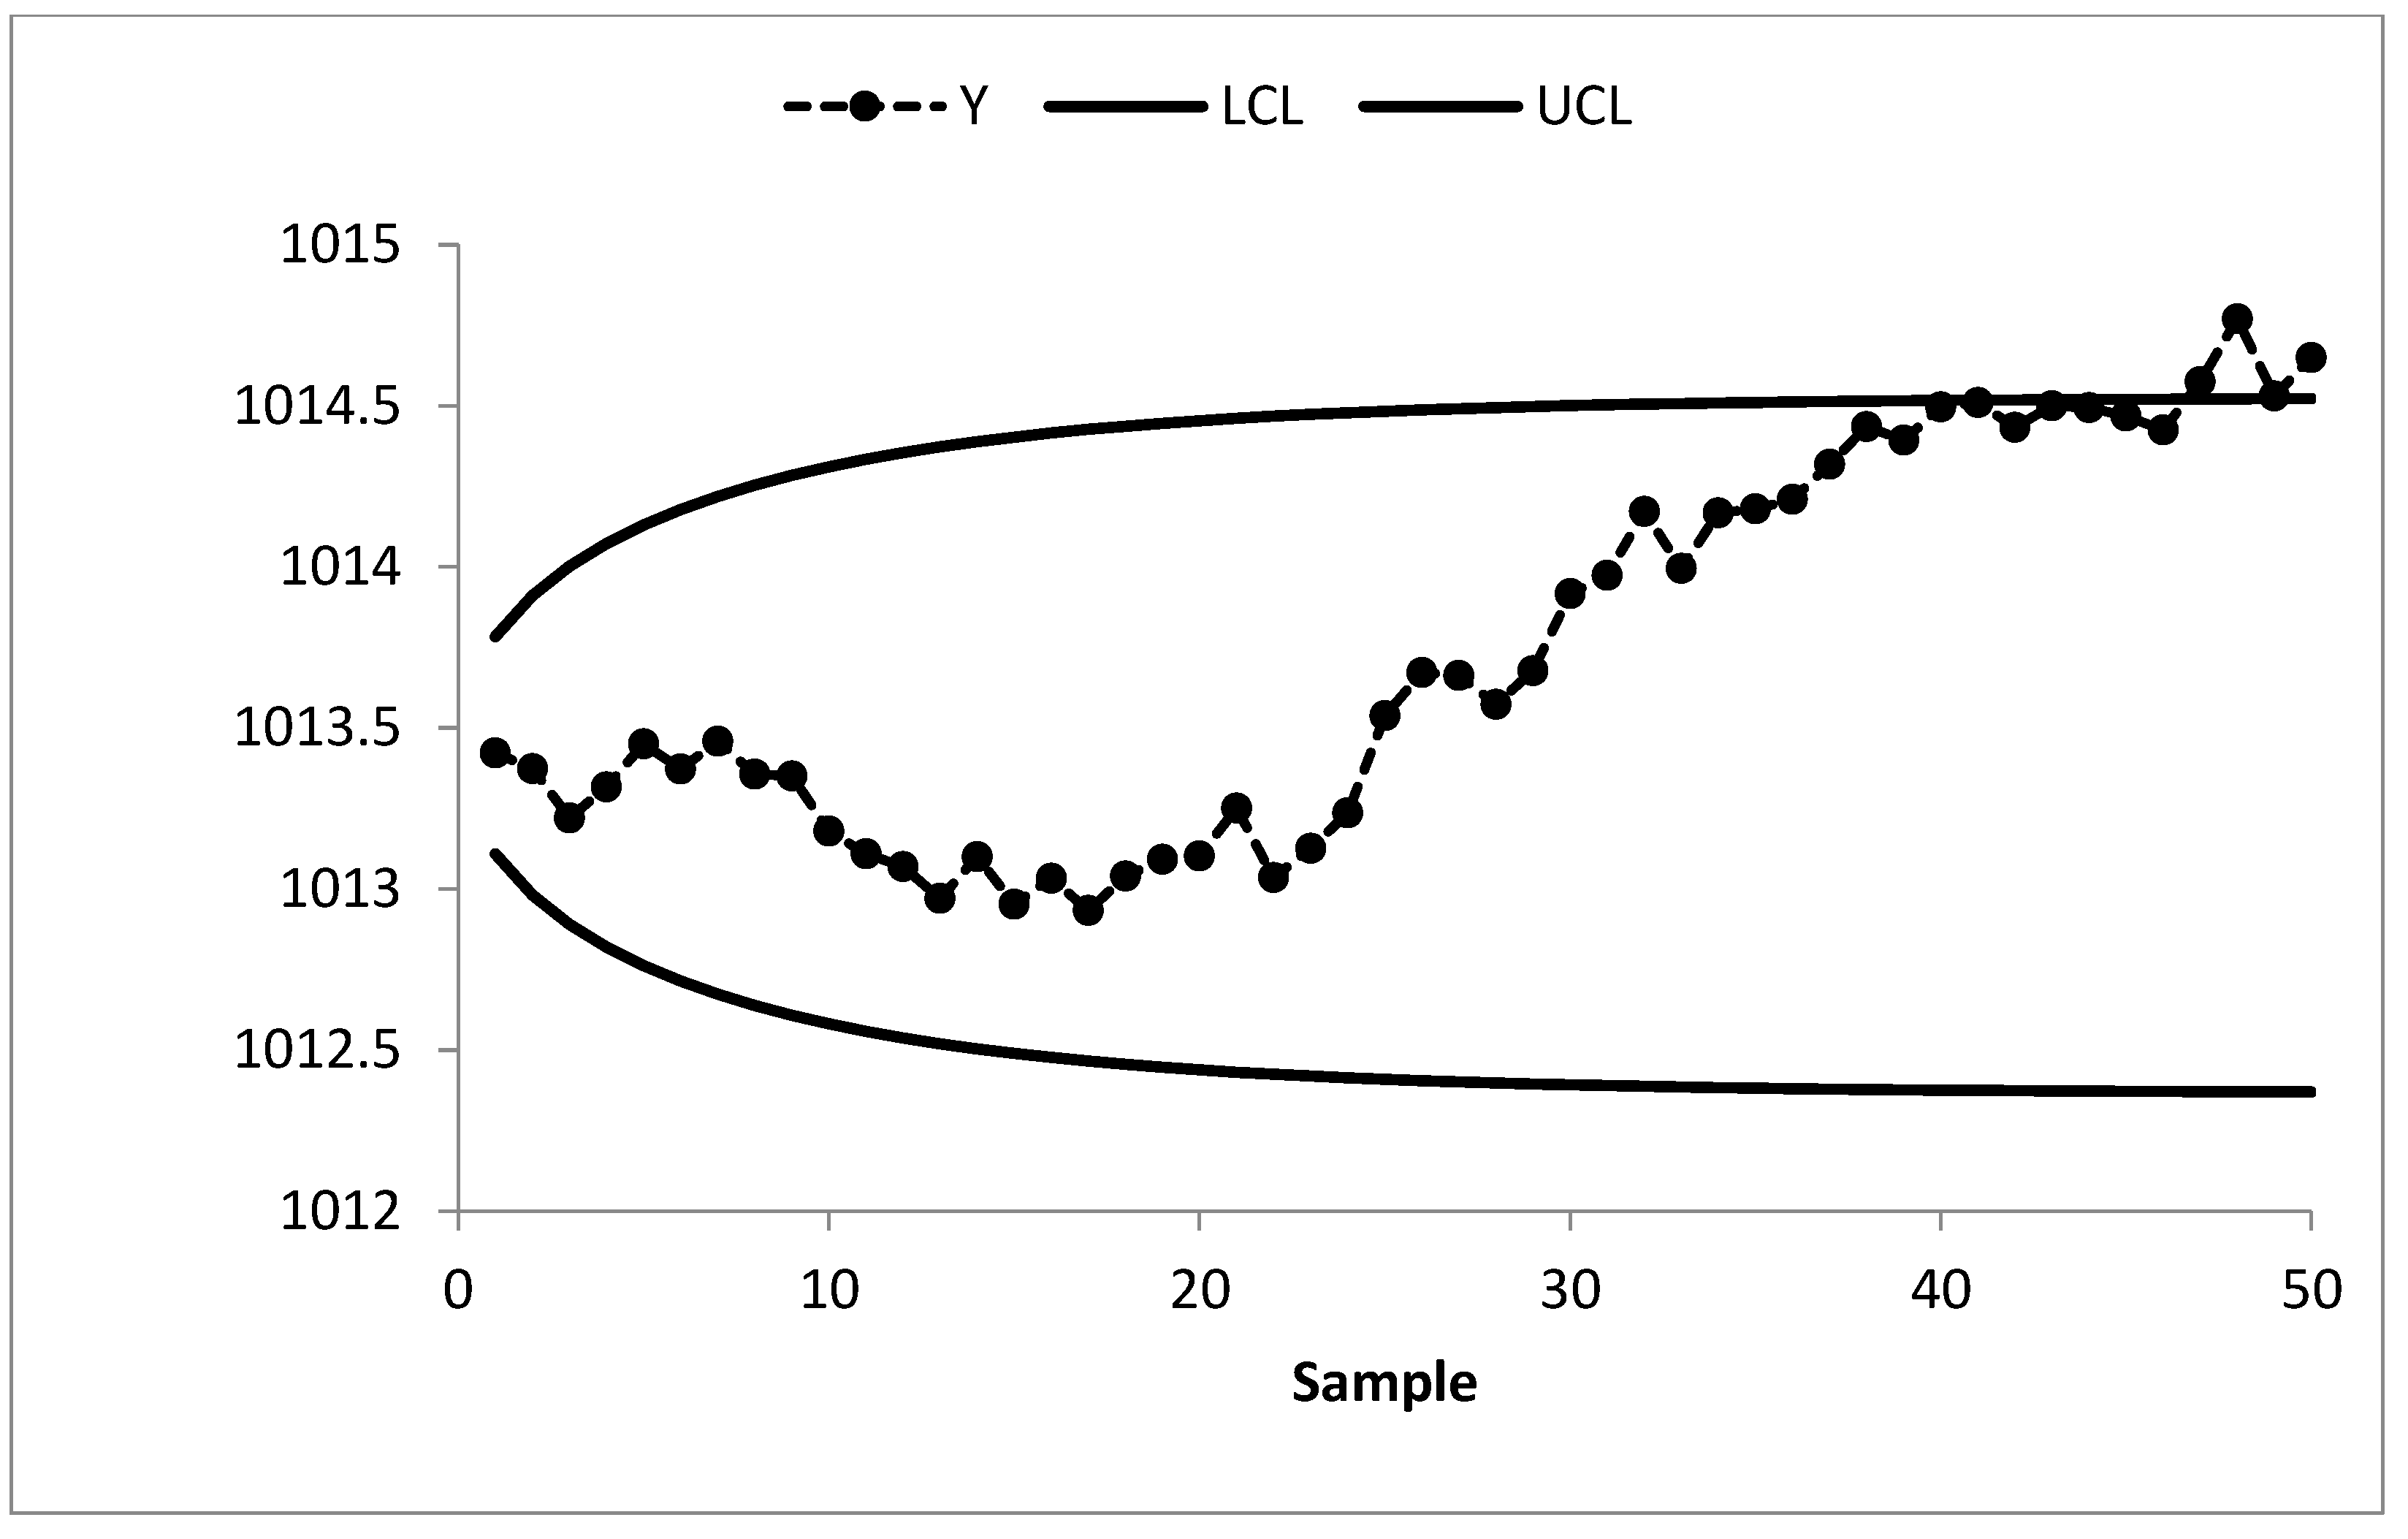
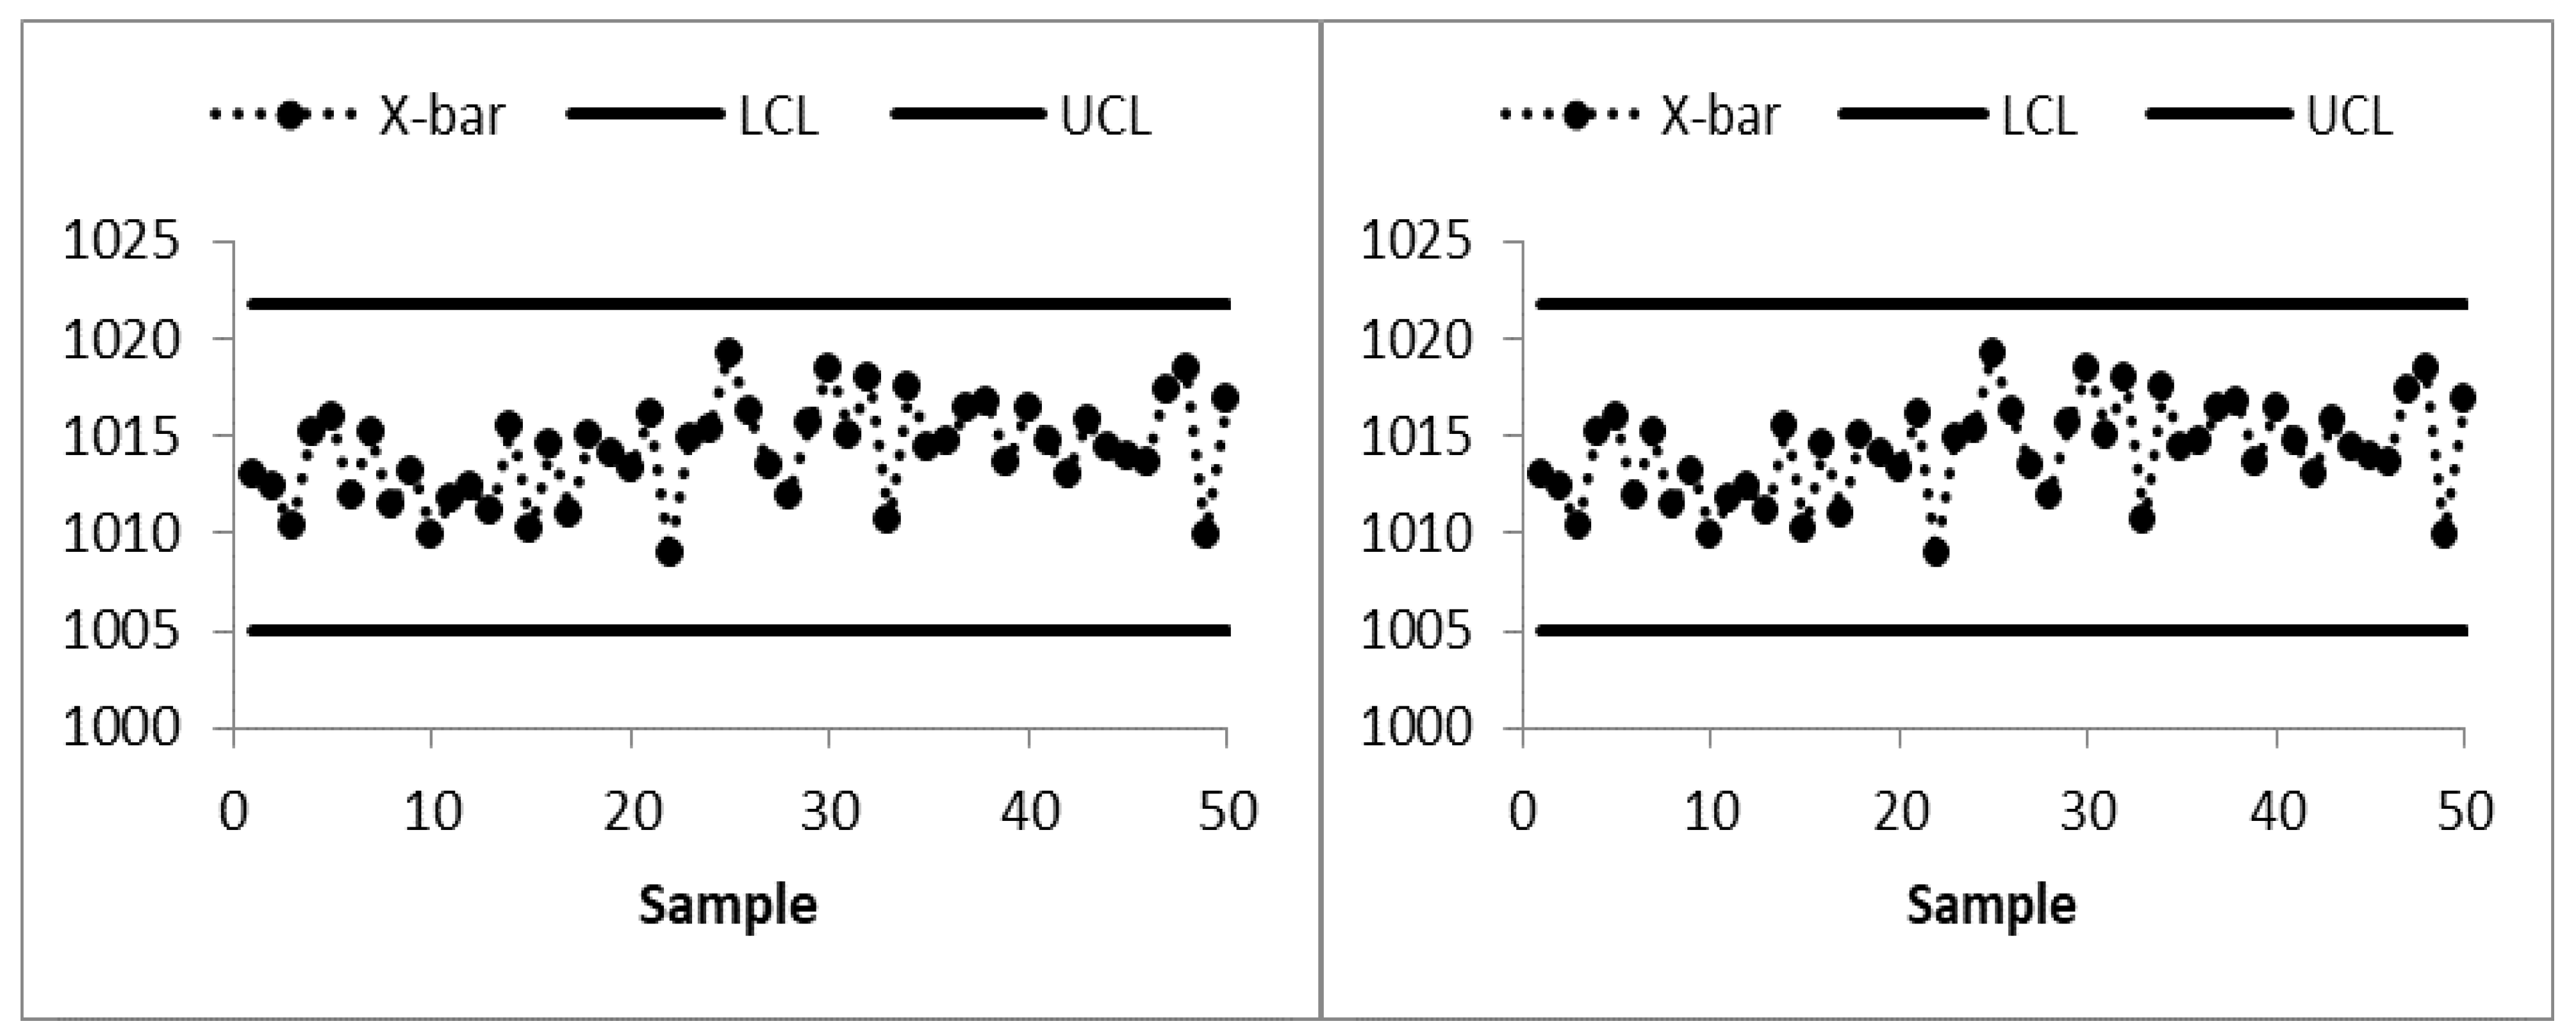
- The practical advantage of using the EWMA-MA chart over its various competitors by using a real dataset from a combined cycle power plant where the ambient pressure is monitored that can affect the performance of gas turbine.
2. The Existing Mixed EWMA-MA Control Chart
3. The Revised Mixed EWMA-MA Control Chart
4. Performance Evaluation
4.1. Algorithm for Computing RL Characteristics
4.1.1. Computation of the IC RL Characteristics
- Step 1: select the smoothing parameter λ and span w for calculation of the charting statistic Zi
- Step 2: choose the value of the limit coefficient L to get the desired ARL0 (such as 200, 370, and 500) under fixed values of λ and w;
- Step 3: generate a random sample of size n from a specific distribution such as the normal distribution with mean μ0 = 0 and variance σ2 = 1 as a realization of the IC process state;
- Step 4: calculate MAi using Equation (1), and compute the monitoring statistic Zi.
- Step 5: Calculate the control limits of the EWMA-MA control chart and check whether the monitoring statistic Zi falls within the limits or not. If Zi ≤ LCL or Zi ≥ UCL, record the sample number as it will be the RL. Otherwise, go to Step-3;
- Step 6: repeat Steps 3 to 5 m (say 100,000) times which results in m run lengths;
- Step 7: Calculate the average of m run lengths, i.e., ARL0. If the calculated ARL0 is equal to the desired ARL0, go to Step 8. Otherwise, go to Step 2 to adjust the value of L;
- Step 8: Calculate the other run-length characteristics such as SDRL and MRL.
4.1.2. Computation of the OOC RL Characteristics
- Step 9: Generate the test sample of size n from the OOC process under a specific distribution by introducing a process shift (δ ≠ 0) in the mean. For example, the sample can be taken from a normal distribution with a mean and variance σ2 = 1;
- Step 10: compute the OOC RL by repeating Steps 4 to 6 under the shifted process and then calculate ARL1, SDRL1, and MRL1;
- Step 11: After computing ARL1, SDRL1, and MRL1 for all the shifts considered in the study, the average extra quadratic loss (AEQL) is computed for estimating the overall performance of a control chart by using Equation (14).
- It is observed that the values of limit coefficient L decrease by increasing the values of span (w) for the fixed value of the smoothing parameter. On the other hand, the value of limit coefficient L increases with λ for the fixed value of w;
- For a fixed value of λ, the values of ARL1, SDRL1, and MRL1 tends to decrease with the increase in the magnitude of shift (δ) and w;
- It is also observed that the obtained values of AEQL decrease as the values of w increase;
- Furthermore, the ARL1, SDRL1, MRL1, and AEQL values tend to increase with λ by keeping other design parameters at a fixed level.
4.2. Robustness of the Mixed EWMA-MA Chart to Non-Normality
- The mixed EWMA-MA chart exhibited a somewhat robust behavior for the smoothing parameter λ = 0.05 as the ARL0 under the gamma, student’s t, logistic, and Laplace distributions remain within 10% of the normal scheme;
- For λ = 0.10, the ARL0 values of the mixed EWMA-MA chart under gamma, student’s t, Weibull, Logistic, and Laplace distributions remain slightly lower than the pre-defined value of 370, especially when the shape of the distribution becomes extremely skewed such as the Weibull (0.5,1);
- Like λ = 0.10, the ARL0 of the EWMA-MA chart for λ = 0.25, 0.50, and 0.75 remains lower than the chosen value of 370 under non-normal process distribution which results in an increased false alarms rate;
- In general, the mixed EWMA-MA control chart is found to be quite resistant to non-normality when the process follows the symmetrical distributions.
5. Comparative Study
Application
6. Summary and Conclusions
Author Contributions
Funding
Institutional Review Board Statement
Informed Consent Statement
Data Availability Statement
Conflicts of Interest
References
- Shewhart, W.A. Quality control charts. Bell Syst. Tech. J. 1926, 5, 593–603. [Google Scholar] [CrossRef]
- Page, E.S. Continuous inspection schemes. Biometrika 1954, 41, 100–115. [Google Scholar] [CrossRef]
- Roberts, S. Control chart tests based on geometric moving averages. Technometrics 1959, 1, 239–250. [Google Scholar] [CrossRef]
- Roberts, S. A comparison of some control chart procedures. Technometrics 1966, 8, 411–430. [Google Scholar] [CrossRef]
- Montgomery, D.C. Introduction to Statistical Quality Control, 8th ed.; John Wiley & Sons: Hoboken, NJ, USA, 2019. [Google Scholar]
- Lucas, J.M. Combined Shewhart-CUSUM quality control schemes. J. Qual. Technol. 1982, 14, 51–59. [Google Scholar] [CrossRef]
- Lucas, J.M.; Saccucci, M.S. Exponentially weighted moving average control schemes: Properties and enhancements. Technometrics 1990, 32, 1–12. [Google Scholar] [CrossRef]
- Shamma, S.E.; Shamma, A.K. Development and evaluation of control charts using double exponentially weighted moving averages. Int. J. Qual. Reliab. Manag. 1992, 9, 18–25. [Google Scholar] [CrossRef]
- Khoo, M.B.; Wong, V. A double moving average control chart. Commun. Stat.-Simul. C. 2008, 37, 1696–1708. [Google Scholar] [CrossRef]
- Haq, A. A new hybrid exponentially weighted moving average control chart for monitoring process mean. Qual. Reliab. Eng. Int. 2013, 29, 1015–1025. [Google Scholar] [CrossRef]
- Abbas, N.; Riaz, M.; Does, R.J. Mixed exponentially weighted moving average–cumulative sum charts for process monitoring. Qual. Reliab. Eng. Int. 2013, 29, 345–356. [Google Scholar] [CrossRef]
- Zaman, B.; Riaz, M.; Abbas, N.; Does, R.J. Mixed cumulative sum–exponentially weighted moving average control charts: An efficient way of monitoring process location. Qual. Reliab. Eng. Int. 2015, 31, 1407–1421. [Google Scholar] [CrossRef]
- Ali, R.; Haq, A. A mixed GWMA–CUSUM control chart for monitoring the process mean. Commun. Stat.—Theory Methods 2018, 47, 3779–3801. [Google Scholar] [CrossRef]
- Alevizakos, V.; Chatterjee, K.; Koukouvinos, C.; Lappa, A. A double moving average control chart: Discussion. Commun. Stat.-Simul. C. 2022, 51, 6043–6057. [Google Scholar] [CrossRef]
- Alevizakos, V.; Chatterjee, K.; Koukouvinos, C. The triple exponentially weighted moving average control chart. Qual. Technol. Quant. Manag 2021, 18, 326–354. [Google Scholar] [CrossRef]
- Rasheed, Z.; Zhang, H.; Arslan, M.; Zaman, B.; Anwar, M.S.; Abid, M.; Abbasi, S.A. An efficient robust nonparametric triple ewma wilcoxon signed-rank control chart for process location. Math. Probl. Eng. 2021, 2021, 1–28. [Google Scholar] [CrossRef]
- Engmann, G.M.; Han, D. Multichart Schemes for Detecting Changes in Disease Incidence. Comput. Math. Methods Med. 2020, 2020, 1–14. [Google Scholar] [CrossRef]
- Raza, M.A.; Aslam, M.; Farooq, M.; Sherwani, R.A.K.; Bhatti, S.H.; Ahmad, T. A new nonparametric composite exponentially weighted moving average sign control chart. Sci. Iran. 2022, 29, 290–302. [Google Scholar] [CrossRef]
- Han, D.; Tsung, F.; Hu, X.; Wang, K. CUSUM and EWMA multi-charts for detecting a range of mean shifts. Stat. Sin. 2007, 17, 1139–1164. [Google Scholar]
- Sukparungsee, S.; Areepong, Y.; Taboran, R. Exponentially weighted moving average-moving average charts for monitoring the process mean. PLoS ONE 2020, 15, e0228208. [Google Scholar] [CrossRef]
- Khan, N.; Aslam, M.; Jun, C.H. A EWMA control chart for exponential distributed quality based on moving average statistics. Qual. Reliab. Eng. Int. 2016, 32, 1179–1190. [Google Scholar]
- Han, D.; Tsung, F. A reference-free cuscore chart for dynamic mean change detection and a unified framework for charting performance comparison. J. Am. Stat. Assoc. 2006, 101, 368–386. [Google Scholar] [CrossRef]
- Raza, M.A.; Nawaz, T.; Aslam, M.; Bhatti, S.H.; Sherwani, R.A.K. A new nonparametric double exponentially weighted moving average control chart. Qual. Reliab. Eng. Int. 2020, 63, 68–87. [Google Scholar] [CrossRef]
- Qiu, P. Introduction to Statistical Process Control; CRC Press Chapman & Hall: Boca Raton, FL, USA, 2013. [Google Scholar]
- Cambron, P.; Masson, C.; Tahan, A.; Pelletier, F. Control chart monitoring of wind turbine generators using the statistical inertia of a wind farm average. Renew. Energ. 2018, 116, 88–98. [Google Scholar] [CrossRef]
- Benedetti, M.; Bonfà, F.; Introna, V.; Santolamazza, A.; Ubertini, S. Real time energy performance control for industrial compressed air systems: Methodology and applications. Energies 2019, 12, 3935. [Google Scholar] [CrossRef]
- Tüfekci, P. Prediction of full load electrical power output of a base load operated combined cycle power plant using machine learning methods. Int. J. Electr. Power Energy Syst. 2014, 60, 126–140. [Google Scholar] [CrossRef]


| ARL0 | λ | w | |||||
|---|---|---|---|---|---|---|---|
| 2 | 3 | 4 | 5 | 8 | 10 | ||
| 200 | 0.05 | 2.145 | 2.100 | 2.062 | 2.031 | 1.973 | 1.928 |
| 0.10 | 2.368 | 2.315 | 2.274 | 2.235 | 2.161 | 2.118 | |
| 0.25 | 2.595 | 2.531 | 2.487 | 2.445 | 2.358 | 2.315 | |
| 0.50 | 2.713 | 2.660 | 2.617 | 2.582 | 2.525 | 2.499 | |
| 0.75 | 2.768 | 2.730 | 2.700 | 2.679 | 2.644 | 2.639 | |
| 370 | 0.05 | 2.426 | 2.379 | 2.335 | 2.310 | 2.237 | 2.205 |
| 0.10 | 2.620 | 2.567 | 2.526 | 2.490 | 2.410 | 2.367 | |
| 0.25 | 2.819 | 2.760 | 2.717 | 2.676 | 2.592 | 2.552 | |
| 0.50 | 2.925 | 2.869 | 2.826 | 2.798 | 2.730 | 2.713 | |
| 0.75 | 2.966 | 2.933 | 2.903 | 2.882 | 2.849 | 2.838 | |
| 500 | 0.05 | 2.547 | 2.503 | 2.465 | 2.435 | 2.367 | 2.330 |
| 0.10 | 2.738 | 2.683 | 2.645 | 2.603 | 2.528 | 2.487 | |
| 0.25 | 2.923 | 2.868 | 2.821 | 2.784 | 2.698 | 2.660 | |
| 0.50 | 3.017 | 2.974 | 2.929 | 2.893 | 2.828 | 2.809 | |
| 0.75 | 3.059 | 3.027 | 2.996 | 2.976 | 2.945 | 2.932 | |
| Shift (δ) | w = 2 | w = 3 | w = 4 | w = 5 | w = 8 | w = 10 | ||||||||||||
|---|---|---|---|---|---|---|---|---|---|---|---|---|---|---|---|---|---|---|
| ARL | SDRL | MRL | ARL | SDRL | MRL | ARL | SDRL | MRL | ARL | SDRL | MRL | ARL | SDRL | MRL | ARL | SDRL | MRL | |
| 0 | 372.5 | 361.4 | 261 | 371.8 | 366.3 | 259 | 370.6 | 364.5 | 259 | 369.1 | 363.5 | 257 | 368.5 | 363.5 | 252 | 368.0 | 363.3 | 252 |
| 0.10 | 215.9 | 200.9 | 154 | 217.9 | 204.9 | 156 | 214.4 | 201.4 | 154 | 214.3 | 204.7 | 154 | 208.3 | 204.7 | 148 | 211.0 | 209.2 | 147 |
| 0.25 | 67.4 | 58.9 | 52 | 67.1 | 58.8 | 51 | 66.8 | 58.8 | 51 | 66.8 | 58.8 | 51 | 64.3 | 55.8 | 50 | 64.7 | 57.9 | 48 |
| 0.50 | 23.6 | 16.9 | 21 | 23.7 | 16.8 | 21 | 22.3 | 16.4 | 19 | 22.0 | 16.4 | 19 | 21.9 | 15.8 | 18 | 21.0 | 15.7 | 17 |
| 0.75 | 13.0 | 8.3 | 13 | 12.6 | 8.0 | 12 | 12.1 | 7.7 | 11 | 11.6 | 7.7 | 10 | 11.0 | 7.7 | 10 | 11.0 | 7.7 | 9 |
| 1.00 | 8.6 | 5.8 | 8 | 8.2 | 5.3 | 8 | 8.0 | 4.8 | 8 | 7.6 | 4.7 | 7 | 7.3 | 4.5 | 7 | 6.9 | 4.5 | 6 |
| 1.50 | 4.3 | 3.2 | 4 | 4.3 | 3.1 | 4 | 4.2 | 2.7 | 4 | 4.2 | 2.7 | 4 | 4.0 | 2.5 | 4 | 3.8 | 2.3 | 3 |
| 2.00 | 2.6 | 1.8 | 2 | 2.6 | 1.7 | 2 | 2.6 | 1.7 | 2 | 2.6 | 1.7 | 2 | 2.5 | 1.5 | 2 | 2.4 | 1.4 | 2 |
| 2.50 | 1.8 | 1.0 | 1 | 1.8 | 1.0 | 1 | 1.8 | 1.1 | 1 | 1.8 | 1.1 | 1 | 1.8 | 1.1 | 1 | 1.8 | 0.9 | 1 |
| 3.00 | 1.5 | 0.6 | 1 | 1.4 | 0.6 | 1 | 1.4 | 0.7 | 1 | 1.4 | 0.7 | 1 | 1.3 | 0.7 | 1 | 1.4 | 0.6 | 1 |
| EQL | 23.9 | 23.6 | 23.2 | 22.9 | 22.7 | 22.1 | ||||||||||||
| Shift (δ) | w = 2 | w = 3 | w = 4 | w = 5 | w = 8 | w = 10 | ||||||||||||
|---|---|---|---|---|---|---|---|---|---|---|---|---|---|---|---|---|---|---|
| ARL | SDRL | MRL | ARL | SDRL | MRL | ARL | SDRL | MRL | ARL | SDRL | MRL | ARL | SDRL | MRL | ARL | SDRL | MRL | |
| 0 | 370.9 | 366.5 | 261 | 370.8 | 366.5 | 261 | 370.7 | 366.4 | 260 | 370.7 | 365.9 | 260 | 371.6 | 360.3 | 260 | 370.2 | 360.0 | 259 |
| 0.10 | 285.7 | 278.5 | 240 | 284.4 | 276.5 | 238 | 284.1 | 276.0 | 237 | 283.6 | 275.0 | 236 | 282.1 | 272.5 | 232 | 281.5 | 271.7 | 230 |
| 0.25 | 127.8 | 120.5 | 115 | 127.5 | 119.5 | 114 | 126.6 | 119.0 | 113 | 124.7 | 118.2 | 112 | 123.7 | 117.4 | 110 | 122.3 | 116.4 | 109 |
| 0.50 | 36.6 | 33.8 | 27 | 35.4 | 31.5 | 26 | 35.2 | 31.3 | 25 | 35.1 | 31.2 | 25 | 32.3 | 28.4 | 24 | 31.4 | 27.1 | 23 |
| 0.75 | 16.1 | 12.8 | 12 | 15.5 | 11.7 | 12 | 15.4 | 11.7 | 12 | 15.3 | 11.6 | 12 | 14.8 | 10.3 | 12 | 14.7 | 9.9 | 13 |
| 1.00 | 9.4 | 7.0 | 7.5 | 9.1 | 6.2 | 8 | 9.1 | 6.1 | 8 | 9.1 | 5.7 | 8 | 8.9 | 5.6 | 8 | 8.8 | 5.5 | 8 |
| 1.50 | 4.4 | 2.6 | 4 | 4.6 | 2.6 | 5 | 4.7 | 2.6 | 5 | 4.6 | 2.7 | 4 | 4.5 | 2.7 | 4 | 4.5 | 2.7 | 4 |
| 2.00 | 2.9 | 1.5 | 3 | 3.0 | 1.7 | 3 | 2.9 | 1.7 | 3 | 2.9 | 1.7 | 3 | 2.8 | 1.7 | 2 | 2.8 | 1.7 | 2 |
| 2.50 | 2.0 | 1.2 | 2 | 2.1 | 1.2 | 2 | 2.0 | 1.2 | 2 | 2.0 | 1.1 | 2 | 1.9 | 1.1 | 2 | 1.9 | 1.1 | 2 |
| 3.00 | 1.6 | 0.8 | 1 | 1.5 | 0.8 | 1 | 1.5 | 0.8 | 1 | 1.5 | 0.8 | 1 | 1.5 | 0.7 | 1 | 1.4 | 0.7 | 1 |
| EQL | 28.9 | 28.7 | 28.6 | 28.5 | 28.0 | 27.3 | ||||||||||||
| Shift (δ) | w = 2 | w = 3 | w = 4 | w = 5 | w = 8 | w = 10 | ||||||||||||
|---|---|---|---|---|---|---|---|---|---|---|---|---|---|---|---|---|---|---|
| ARL | SDRL | MRL | ARL | SDRL | MRL | ARL | SDRL | MRL | ARL | SDRL | MRL | ARL | SDRL | MRL | ARL | SDRL | MRL | |
| 0 | 370.2 | 367.8 | 255 | 370.0 | 367.0 | 255 | 370.1 | 365.6 | 244 | 370.0 | 360.9 | 237 | 369.7 | 359.1 | 206 | 369.5 | 333.0 | 167 |
| 0.10 | 331.5 | 329.3 | 231 | 323.2 | 327.4 | 222 | 316.0 | 325.9 | 209 | 304.4 | 321.3 | 193 | 285.9 | 320.5 | 148 | 266.5 | 305.6 | 114 |
| 0.25 | 203.5 | 199.5 | 142 | 184.9 | 195.5 | 125 | 165.0 | 183.3 | 107.5 | 150.5 | 170.0 | 97 | 119.1 | 148.6 | 62 | 100.0 | 144.0 | 39 |
| 0.50 | 79.2 | 79.6 | 55 | 62.2 | 65.6 | 42 | 52.7 | 57.8 | 34 | 43.0 | 50.2 | 26 | 30.6 | 40.0 | 16 | 23.6 | 34.5 | 6 |
| 0.75 | 33.5 | 33.2 | 23 | 25.5 | 25.7 | 17 | 19.9 | 21.8 | 13 | 16.6 | 19.3 | 10 | 10.6 | 13.8 | 4 | 8.7 | 11.9 | 3 |
| 1.00 | 16.3 | 15.9 | 12 | 11.9 | 12.2 | 8 | 9.5 | 10.0 | 6 | 7.8 | 8.6 | 5 | 5.2 | 6.5 | 2 | 4.3 | 5.6 | 2 |
| 1.50 | 5.6 | 4.9 | 4 | 4.2 | 3.8 | 3 | 3.4 | 3.2 | 2 | 2.9 | 2.8 | 2 | 2.1 | 2.1 | 1 | 1.9 | 1.8 | 1 |
| 2.00 | 2.8 | 2.1 | 2 | 2.2 | 1.7 | 2 | 1.9 | 1.4 | 1 | 1.7 | 1.2 | 1 | 1.4 | 0.9 | 1 | 1.3 | 0.7 | 1 |
| 2.50 | 1.8 | 1.1 | 1 | 1.5 | 0.9 | 1 | 1.3 | 0.7 | 1 | 1.2 | 0.6 | 1 | 1.1 | 0.4 | 1 | 1.1 | 0.4 | 1 |
| 3.00 | 1.4 | 0.7 | 1 | 1.2 | 0.5 | 1 | 1.1 | 0.4 | 1 | 1.1 | 0.3 | 1 | 1 | 0.2 | 1 | 1 | 0.2 | 1 |
| EQL | 39.9 | 31.5 | 28.3 | 23.6 | 18.4 | 16.5 | ||||||||||||
| Parameter (s) | (λ, L) | |||||||||
|---|---|---|---|---|---|---|---|---|---|---|
| (0.05, 2.310) | (0.10, 2.490) | (0.25, 2.676) | (0.50, 2.798) | (0.75, 2.882) | ||||||
| ARL0 | SDRL0 | ARL0 | SDRL0 | ARL0 | SDRL0 | ARL0 | SDRL0 | ARL0 | SDRL0 | |
| Normal distribution | ||||||||||
| Normal (0, 1) | 370.00 | 358.3 | 370.4 | 366.9 | 370.6 | 367.1 | 370.3 | 367.3 | 370.7 | 368.3 |
| Gamma distribution | ||||||||||
| Gamma (5, 1) | 374.2 | 370.4 | 368.3 | 365.4 | 364.8 | 362.9 | 363.1 | 361.9 | 354.0 | 349.6 |
| Gamma (2, 1) | 371.2 | 370.5 | 363.5 | 362.5 | 347.8 | 347.4 | 340.4 | 335.6 | 324.4 | 323.7 |
| Gamma (1, 1) | 371.6 | 370.1 | 361.3 | 359.8 | 332.0 | 330.7 | 308.1 | 301.9 | 304.6 | 299.8 |
| Gamma (0.5, 1) | 365.5 | 360.4 | 353.9 | 351.6 | 303.0 | 301.5 | 260.7 | 257.9 | 257.4 | 254.1 |
| Weibull distribution | ||||||||||
| Weibull (0.5, 1) | 366.2 | 350.1 | 294.2 | 285.5 | 200.4 | 198.5 | 180.8 | 173.9 | 177.9 | 168.5 |
| Weibull (2, 1) | 369.8 | 366.5 | 368.9 | 366.9 | 366.9 | 365.2 | 365.5 | 361.6 | 360.7 | 357.1 |
| Weibull (3.5, 1) | 370.3 | 366.7 | 369.3 | 362.2 | 368.2 | 366.7 | 365.7 | 362.2 | 361.8 | 357.5 |
| Weibull (10, 1) | 378.1 | 368.3 | 375.3 | 372.2 | 374.6 | 370.2 | 367.1 | 364.5 | 362.7 | 358.8 |
| t-distribution | ||||||||||
| t (20) | 374.8 | 369.9 | 364.7 | 363.3 | 363.3 | 362.1 | 360.9 | 358.9 | 361.1 | 358.0 |
| t (10) | 370.7 | 362.7 | 360.5 | 367.0 | 361.0 | 359.4 | 354.7 | 352.6 | 352.9 | 350.2 |
| t (4) | 358.5 | 357.4 | 337.6 | 336.6 | 293.9 | 290.8 | 285.6 | 281.0 | 281.9 | 275.9 |
| Logistic distribution | ||||||||||
| Logis (2, 1) | 380.3 | 375.8 | 365.9 | 363.9 | 362.1 | 357.9 | 355.8 | 353.6 | 350.2 | 346.9 |
| Logis (6, 2) | 364.5 | 361.7 | 360.7 | 358.2 | 352.4 | 349.2 | 349.9 | 345.2 | 347.1 | 345.2 |
| Logis (9, 4) | 373.9 | 370.2 | 365.1 | 360.5 | 357.3 | 355.5 | 353.4 | 350.9 | 348.0 | 345.7 |
| Laplace distribution | ||||||||||
| Laplace (0, 2) | 367.4 | 364.0 | 360.0 | 355.6 | 331.1 | 327.9 | 319.6 | 309.2 | 316.7 | 301.3 |
| Laplace (0, 1) | 362.8 | 356.8 | 356.5 | 352.1 | 330.7 | 325.1 | 318.2 | 309.1 | 307.1 | 298.4 |
| Laplace (0, ) | 359.5.8 | 350.5 | 352.7 | 348.2 | 329.8 | 324.8 | 309.4 | 299.7 | 298.9 | 291.5 |
| Control Chart | RL Characteristic | Shift (δ) | AEQL | RMI | ||||||||||
|---|---|---|---|---|---|---|---|---|---|---|---|---|---|---|
| 0.0 | 0.05 | 0.10 | 0.25 | 0.50 | 0.75 | 1.0 | 1.50 | 2.0 | 2.50 | 3.0 | ||||
| MA at w = 5, L1 = 2.88 | ARL | 368.6 | 348 | 306.7 | 161.4 | 51.3 | 20.9 | 11.2 | 4.6 | 2.8 | 2 | 1.6 | 32.8 | 0.47 |
| SDRL | 373.5 | 348.4 | 302.8 | 162 | 49.4 | 19 | 9.2 | 3 | 1.5 | 0.9 | 0.7 | |||
| MRL | 252 | 236 | 214 | 110 | 37 | 15 | 8 | 4 | 2 | 2 | 1 | |||
| EWMA at λ = 0.05, L2 = 2.492 | ARL | 369.8 | 316.1 | 222.6 | 73.1 | 26.8 | 15.3 | 10.7 | 6.8 | 5 | 4 | 3.4 | 41.5 | 0.50 |
| SDRL | 352.7 | 299.2 | 207.8 | 58 | 15.3 | 6.9 | 4.1 | 2 | 1.2 | 0.9 | 0.7 | |||
| MRL | 258 | 227 | 158 | 56 | 23 | 14 | 10 | 7 | 5 | 4 | 3 | |||
| CUSUM k = 0.50, h = 4.77 | ARL | 368.9 | 348.4 | 280.6 | 121.8 | 34.9 | 16.2 | 9.9 | 5.5 | 3.9 | 3 | 2.5 | 36.1 | 0.46 |
| SDRL | 363.7 | 346.2 | 277.3 | 115.5 | 29 | 10.6 | 5.3 | 2.2 | 1.3 | 0.8 | 0.6 | |||
| MRL | 258 | 243.5 | 194 | 86 | 26 | 13 | 9 | 5 | 4 | 3 | 2 | |||
| Mixed EWMA-CUSUM λ = 0.05, k = 0.50, h = 45.54 | ARL | 370.6 | 303.6 | 194.9 | 74 | 37.3 | 26.5 | 21.4 | 15.8 | 12.9 | 11.1 | 9.7 | 98.9 | 2.03 |
| SDRL | 327.5 | 257.8 | 153.8 | 39.5 | 11.5 | 6 | 3.9 | 2.1 | 1.4 | 1.1 | 0.9 | |||
| MRL | 269 | 227 | 148 | 64 | 35 | 26 | 21 | 16 | 13 | 11 | 10 | |||
| Combined Shewhart-EWMA λ = 0.05, L2 = 2.91, L3 = 3.11 | ARL | 371.2 | 337.5 | 264.7 | 101.1 | 33.2 | 18 | 12 | 7.1 | 4.5 | 3 | 2.1 | 37.3 | 0.48 |
| SDRL | 365.7 | 334 | 258.3 | 85.4 | 20.7 | 8.8 | 5.3 | 3.1 | 2.3 | 1.8 | 1.3 | |||
| MRL | 262 | 238 | 185 | 76 | 29 | 17 | 12 | 7 | 5 | 3 | 2 | |||
| Combined Shewhart-CUSUM k = 0.50, h = 5.77, L3 = 3.11 | ARL | 370.9 | 350 | 310.7 | 153.1 | 43.1 | 18.8 | 11.4 | 6 | 3.9 | 2.7 | 2 | 36.7 | 0.55 |
| SDRL | 369.7 | 347.7 | 306.3 | 146.7 | 35 | 12.1 | 6.2 | 2.8 | 1.9 | 1.4 | 1.1 | |||
| MRL | 259 | 241 | 215 | 109 | 33 | 16 | 10 | 6 | 4 | 3 | 2 | |||
| Mixed EWMA-MA λ = 0.05, w = 5, L = 2.311 | ARL | 370.4 | 307.3 | 208.9 | 65.9 | 22.5 | 12.4 | 7.9 | 4.2 | 2.6 | 1.7 | 1.3 | 23.2 | 0.008 |
| SDRL | 360.9 | 304.2 | 201.2 | 57.9 | 16.2 | 7.8 | 4.9 | 2.8 | 1.7 | 1.1 | 0.7 | |||
| MRL | 256 | 218 | 148.5 | 51 | 19 | 11 | 7 | 4 | 2 | 1 | 1 | |||
Disclaimer/Publisher’s Note: The statements, opinions and data contained in all publications are solely those of the individual author(s) and contributor(s) and not of MDPI and/or the editor(s). MDPI and/or the editor(s) disclaim responsibility for any injury to people or property resulting from any ideas, methods, instructions or products referred to in the content. |
© 2023 by the authors. Licensee MDPI, Basel, Switzerland. This article is an open access article distributed under the terms and conditions of the Creative Commons Attribution (CC BY) license (https://creativecommons.org/licenses/by/4.0/).
Share and Cite
Raza, M.A.; Iqbal, K.; Aslam, M.; Nawaz, T.; Bhatti, S.H.; Engmann, G.M. Mixed Exponentially Weighted Moving Average—Moving Average Control Chart with Application to Combined Cycle Power Plant. Sustainability 2023, 15, 3239. https://doi.org/10.3390/su15043239
Raza MA, Iqbal K, Aslam M, Nawaz T, Bhatti SH, Engmann GM. Mixed Exponentially Weighted Moving Average—Moving Average Control Chart with Application to Combined Cycle Power Plant. Sustainability. 2023; 15(4):3239. https://doi.org/10.3390/su15043239
Chicago/Turabian StyleRaza, Muhammad Ali, Komal Iqbal, Muhammad Aslam, Tahir Nawaz, Sajjad Haider Bhatti, and Gideon Mensah Engmann. 2023. "Mixed Exponentially Weighted Moving Average—Moving Average Control Chart with Application to Combined Cycle Power Plant" Sustainability 15, no. 4: 3239. https://doi.org/10.3390/su15043239
APA StyleRaza, M. A., Iqbal, K., Aslam, M., Nawaz, T., Bhatti, S. H., & Engmann, G. M. (2023). Mixed Exponentially Weighted Moving Average—Moving Average Control Chart with Application to Combined Cycle Power Plant. Sustainability, 15(4), 3239. https://doi.org/10.3390/su15043239