Abstract
The occurrence of fatal traffic accidents often causes serious casualties and property losses, endangering travel safety. This work uses the statistical data of fatal road traffic accidents in Shenzhen from 2018 to 2022 as the basis to determine the characteristic patterns and the main influencing factors of the occurrence of fatal road traffic accidents. The accident description data are also analyzed using the analysis method based on Term Frequency-Inverse Document Frequency (TF-IDF) data mining to obtain the characteristics of accident fields, objects, and types. Furthermore, this work conducts a kernel density analysis combined with spatial autocorrelation to determine the hotspot areas of accident occurrence and analyze their spatial aggregation effects. A principal component analysis is performed to calculate the factors related to the accident subjects. Results showed that weak safety awareness of motorists and irregular driving operations are the main factors for the occurrence of accidents. Finally, targeted safety management strategies are proposed based on the analysis results. In the current data era, the research results of this paper can be used for the prevention and emergency of accidents to formulate corresponding measures, and provide a theoretical basis for decision making.
1. Introduction
The demand and transport volume of road transport as important ways to ensure the high-speed operation of the economy and society and achieve normal production and consumption in various aspects continues to grow with the flourishing development of China’s transportation industry. Road transport carrier operating vehicles are also steadily developing. According to statistics, the country had 11,654,900 operating vehicles, including 776,700 operating buses and 10,878,200 operating trucks, by the end of 2019. A total of 248,000 road traffic accidents occurred nationwide in 2019, with 62,763 people killed and 256,101 injured in traffic accidents, resulting in direct property losses of CNY 1.346 billion. The number of construction vehicles accounts for very little of the total number of motor vehicles, while the number of road accident fatalities involving construction vehicles accounts for approximately 30% of the overall road traffic accident fatalities. Despite achieving efficient and convenient transportation, driving risks have the characteristics of low probability and high impact, with significant safety hazards.
The main influencing factors of road traffic accidents can be divided into four aspects: driver, vehicle, road and environment. The occurrence of road traffic accidents is often a comprehensive reflection of the interaction of multiple factors. Among them, whether the driver drives safely according to the regulations and whether the vehicle has safety risks are the leading factors for the occurrence of accidents. The road characteristics, natural environment, and social environment in the accident area are the potential factors. By studying the interaction between related factors in traffic accidents and the connection between accidents, the occurrence rules and main causes of accidents can be obtained so as to judge and forecast the hotspots of accidents, take targeted measures to reduce the accident rate, and ensure the safety of traffic.
2. Literature Review
2.1. Study on Road Accident Characteristics
Researchers have conducted extensive studies on the main characteristics and spatial effects of accidents by using GIS analysis tools and constructing consistent mathematical and statistical models based on different data sources, accident influencing factors, and accident samples in the research related to the characteristics of road traffic accidents. Elke et al. [1] proposed that road traffic safety is determined by seven main factors, and the use of ordered weighted average algorithm and expert evaluation method for road traffic safety can solve the road system safety problem to a large extent. Anderson [2] analyzed the spatial distribution pattern of road traffic accidents based on the road traffic accident data of the city of London using the kernel density estimation method. The results showed that the accidents were spatially clustered in the distribution pattern. Murat et al. [3] analyzed the traffic accident data of Denizli in Turkey by using K-means and fuzzy clustering algorithm to obtain the black spots of the accident and evaluate the characteristics of the black spots. Amira et al. [4] used kernel density estimation of 1D and 2D spatial dimensions, nearest neighbor distance based on network, network K-function, random forest algorithm, and spatio-temporal hot zone analysis to integrate GIS data and road traffic data together for neighborhood network analysis and obtained accident-prone road sections. The hotspot areas where accidents occur can be effectively determined through spatial characteristics analysis of traffic accidents by a clustering algorithm combined with spatial autocorrelation analysis. Jasiuniene et al. [5] used the fatal road accident, road, and traffic parameters in Lithuania during 2014–2018 as the bases for predicting accidents at road intersections using Bayesian methods and proposed to utilize the predicted road fatalities to calculate the fatal accident density and the level of this indicator to evaluate the road safety level. Ma et al. [6] used density analysis to identify high accident areas based on the road traffic accident data in Wales in 2017, and outlier and hotspot analysis models to identify areas with high accident severity and determine the clustering characteristics of accidents. Yang et al. [7] used 2002–2019 based on traffic accident data from 31 provinces in China and studied the spatial autocorrelation characteristics and spatial heterogeneity between provinces and regions using statistical analysis and spatial autocorrelation analysis.
2.2. Study on the Influencing Factors of Accidents
In studies related to the factors influencing accidents, many scholars have analyzed the multiple factors that lead to accidents in various fields from the systemic causation theory and studied the interrelationships among the factors to find the causes of accidents. William et al. [8] analyzed the influence of various factors on traffic accidents by studying the relationship between the characteristics of traffic accident participants, characteristics of accident time, types of vehicles involved in the accident, weather and road conditions, and traffic accidents. Pontus et al. [9] identified and described the characteristics of bus and coach accidents in terms of passenger gender, road conditions (urban and rural roads), weather conditions (dry and wet), and accident patterns. Chu [10] discussed the influence of risk factors on serious accidents related to long-distance driving of large buses on expressways. The result showed that fatigue driving, drunk driving, and midnight and dawn time periods, and other factors seriously affected the severity of traffic accidents of large buses. Accordingly, management strategies were proposed. Zou et al. [11] examined the effect of risk factors associated with serious accidents caused by long-distance driving of large buses on highways, showing that factors such as fatigue, drunk driving, and midnight and dawn time periods severely influence the severity of accidents of large buses, leading to the proposal of management strategies. Shen et al. [12] noted that accidents are caused by a variety of factors (e.g., driver, vehicle, road conditions and traffic conditions). Guo [13] concluded that individual driver–vehicle operation risk is related to accident rate, age, and personality traits. Li and Bai [14] proposed evaluation indicators for highway operation area safety and an index model for operation area driving risk evaluation. Hong et al. [15] applied the apriori algorithm to study the factors influencing accidents involving hazardous material transport vehicles on highways. The result showed that such vehicle accidents were highly correlated with factors, such as male drivers, sunny days, daytime, and dry roads. Ma et al. [16] showed that the accident season, time, place, tunnel length, and bad weather are significantly correlated with the severity of the accident. Wong et al. [17] concluded that the proportion of operating vehicles, radius of road curvature, and tram stops had a significant positive correlation with accident frequency. Oralhan et al. [18] used cox regression and life table model to analyze the traffic accident data in Kayseri, Turkey, and obtained the influencing factors of fatal accidents. Kozlowski et al. [19] used an improved classification tree algorithm to classify and evaluate accident factors in road–rail intersections in the Polish region to qualify and assess them.
2.3. Study on the Accident Data Processing Method
Manual statistics and incomplete data capturing induce inevitable data bias, therefore missing values and noisy values are very common. Therefore, data pre-processing takes almost 80% of the total statistical analysis [20]. The anomalous data may provide false information for the results analysis of a fatal urban traffic accident; thus, detecting abnormal data and recovering the missing data are both essential in data pre-processing. Many techniques have been proposed for outlier detection and correction: linear regression, neural network, decision trees, and the maximum likelihood estimation-based Bayesian dynamic linear model [21,22,23]. For missing value, mainly strategies are deletion, mean imputation [24], and data-driven imputation. Simply deleting missing values is recognized as the simplest way in handling incomplete data, but it would shrink the sample size and may cause loss of valuable information. Mean imputation replace the missing values for given data with the mean or median, which is widely used [25] due to its easy implementation. Meanwhile, some of advanced data-driven methods that have been applied currently include k-nearest neighbors, decision trees, chained equations and Bayesian dynamic regression [26,27,28].
The consequences of fatal traffic accidents are often more serious compared with ordinary traffic accidents, and their accident fields, accident objects, accident occurrence areas, accident impact factors, and other accident characteristics are different from ordinary traffic accidents, which should be analyzed in a timely and focused manner to determine the laws of fatal traffic accidents and accident occurrence hotspots and take targeted management measures to prevent the occurrence of such serious accidents. This study, which is based in Shenzhen city, China, uses data mining to calculate and analyze the fatal road traffic accidents in the past 5 years and obtains the main accident characteristics, accident hotspots, and major influencing factors to provide a reference basis for traffic safety management.
3. Fatal Traffic Accident Feature Extraction
3.1. Data Description
The data of fatal traffic accidents (accidents with one to two fatalities) in the field of road transport in Shenzhen from 2018 to 2022 were chosen as the basis for the study, with a data sample of 330 items. The data used for the study were obtained through data cleaning, removing attribute items with high missing rates and those irrelevant to the study analysis, and standardizing the statistical values of the data according to a unified standard. The attributes include accident time, accident location, accident fields, accident areas, accident objects, accident types, and accident impact factors. See details in Table 1.

Table 1.
Description table of incident data attributes.
The accident profile description is detailed recorded information on the occurrence of the accident. The factors that influence the accident include motorist factors, non-motorist factors, the accident subject factors of pedestrian factors, and 21 specific factors are recorded.
3.2. Word Cloud Analysis Based on Accident Description Data
The accident description data in the accident statistics provide the specific information of the accident process in detail, and the key information of the text can be quickly identified from a large amount of text data information by using text semantic analysis. In this study, an analysis corpus is constructed by text extraction of accident data descriptions, and a traffic accident feature lexicon is established based on the text description data. The feature lexicon includes accident features, such as accident time, accident location, accident domain, accident field, accident object, accident type, and accident influencing factors. The Jieba text splitting lexicon is used in the python compilation environment to set up deactivated words to eliminate redundant data, establish the subsumed lexicon to standardize similar statements, and perform word separation and accident feature word frequency statistics to obtain the frequency of relevant accident feature words in the accident description. A Wordcloud-based word cloud plotting of the frequency of the accident features can be conducted to visualize the frequency of the relevant feature words by setting the correlation coefficient between the frequency and the size of the feature words (Figure 1).
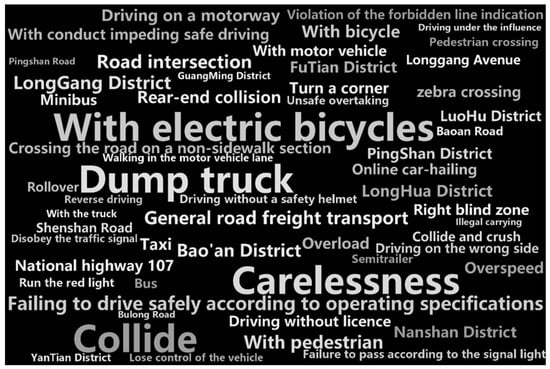
Figure 1.
Word cloud of fatal traffic accident text description data.
According to the word cloud analysis of the accident description text data, the key words, such as dump truck, with electric bicycles, road intersection, collide, Baoan District, and failing to drive safely according to operating specifications, are significantly shown in the word cloud diagram, indicating that the feature words appear more frequently in the accident description. The key words in the feature words will be extracted using semantic analysis algorithms.
3.3. Keyword Extraction Based on the TF-IDF Algorithm
In the extracted accident text data, the importance of a feature word proportionally increases with its occurrence in the text, but it also inversely decreases with its frequency of occurrence in the corpus. The study uses the TF-IDF algorithm to calculate and extract the key feature words in fatal traffic accidents, where the TF value is the feature word frequency, which is the frequency of feature words appearing in the corpus and used to describe the importance of feature words in the corpus; IDF is the inverse document frequency, which responds to the relationship between accidents in which feature words appear and all accidents, and it is used to describe the general importance of feature words. The TF-IDF algorithm’s calculation formula is as follows [29]:
where is the frequency of occurrence of feature word t in incident d, M is the sum of the occurrences of all feature words in incident d, D is the total number of incident cases in the corpus, and mt is the number of incident cases in the corpus containing feature word t.
The 30 feature words with high TF-IDF values were obtained as keywords by screening, and the results were normalized. The final results corresponding to the feature values are shown in the following Table 2.
Table 2.
Calculated TF-IDF values of the incident analysis feature terms.
According to the analysis results of the keywords from Table 2, dump truck transportation, general road freight transportation, taxi, and online car-hailing are the fields of fatal traffic accidents. The morning (7:00–9:00) and evening (18:00–20:00) peaks are the accident-prone times. Meanwhile, Longgang District, Bao’an District, and Longhua District in Shenzhen are the accident-prone areas, and collision is the main accident type. The main objects of accidents involved vulnerable groups, such as electric bicycles, pedestrians, and bicycles. The causes of accidents were dominated by factors such as failing to safely drive according to operating specifications, carelessness, and conduct impeding safe driving. The non-motorized vehicles and pedestrians occupying the road and crossing the road illegally were also contributing factors.
4. Spatial Characterization of Fatal Traffic Accidents
This study obtained the latitude and longitude coordinates of the accident locations by crawling the spatial coordinates of the accident locations appearing in the statistical data combined with the Baidu Map API. The kernel density estimation and spatial autocorrelation methods were used to analyze the aggregation effect of fatal traffic accidents and to determine the black spot areas where fatal traffic accidents occur by combining the administrative boundaries, streets, and road network data of the study area. The causes are also explored. This study hypothesis states that every point where an accident occurs is randomly distributed in time and space
4.1. Spatial Distribution Characteristics of Fatal Traffic Accidents Based on Kernel Density Estimation
The visual effect was determined by overlaying the latitude and longitude coordinates of fatal traffic accidents in the study area with road network data, administrative boundaries, and administrative district data in GIS software, which shows the proximity of local accident points and the potential spatial aggregation effect to be explored.
This study uses kernel density estimation to explore the spatial characteristics of the locations of fatal traffic accidents in the study area. Kernel density estimation can determine the focusing dynamics between an accident point and its surroundings, thus reflecting the distribution dynamics of accidents. Accident kernel density is measured based on the spatial distribution elements of accident points in the study area to calculate the clustering characteristics of accidents. If the kernel density estimate is larger, then the higher the spatial distribution density of the accidents, the greater the hazard. The Rosenblatt-Parzen kernel estimation model is used in this study and calculated as follows:
where is the kernel density value of the incident point distribution, n is the number of incident points, k is the kernel function, and h > 0 is the bandwidth; and (x − xi) is the distance value from the estimated value point to the measurement point xi. The kernel function and the bandwidth h determine the degree of nuclear density.
The results of the spatial distribution of nuclear densities within the study area are shown in Figure 2. Spatial clustering of accidents occurs in Baoan, Longgang, Longhua and Futian districts, and some clustering of accident occurrences can be observed between the respective districts. Accordingly, the scale of the study must be reduced, and the current district scale must be refined to the street scale. Although local high values of nuclear density exist in the study area, the high-value areas may not be statistically significant accident hotspots, but rather they should be surrounded by other areas with high accident rates. Thus, spatial autocorrelation should be used to calculate and analyze significant accident hotspots.
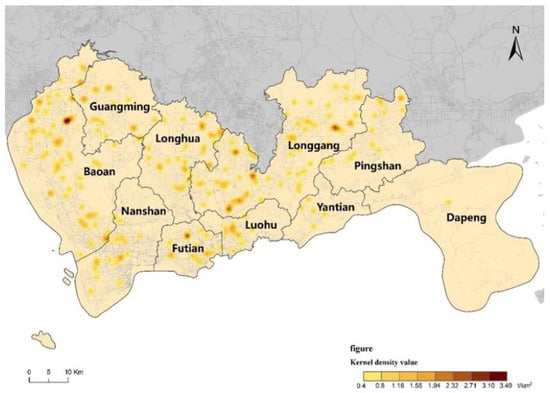
Figure 2.
Analysis of nuclear density in the study area.
4.2. Analysis of Fatal Traffic Accident Hotspot Areas Based on Spatial Autocorrelation
4.2.1. Spatial Distribution Characteristic Analysis of Fatal Traffic Accidents Based on Global Moran’s I
The study obtained the number of accidents occurring in each street area by overlaying the accident occurrence points with the street zoning data of the study area to explore the spatial characteristics of accident hotspot areas at the regional scale and explore the accident occurrence pattern. Moreover, Moran’s I was for calculation and analysis to study the spatial dependence of the accident occurrence areas with the following formula.
where wi,j is the spatial weight between elements i and j; zi and zj are the observations of the incident points in spatial cells I and j standardized, respectively; and n is equal to the total number of incident points.
The formula for calculating the ZI value of the statistics is as follows.
of which:
where: V[I] is the variance of Moran’s I; E[I] is the expected value of Moran’s I.
The output correlation calculation indicators are Moran’s I index, expected index, Z-value, p-value, and variance. The Z-value is the multiple of standard deviation, and the p-value is the probability. The Z and p values can obtain a confidence level of spatial correlation based on Moran’s I index (Table 3).
Table 3.
Z-value and p-value corresponding to confidence levels.
When the number of accidents in the study street area was calculated, the report graph shows a significant normal distribution based on the GIS software output report as shown in the Figure 3, with a regional random distribution in the middle part, an agglomerative distribution on the right side, and a discrete distribution on the left side.
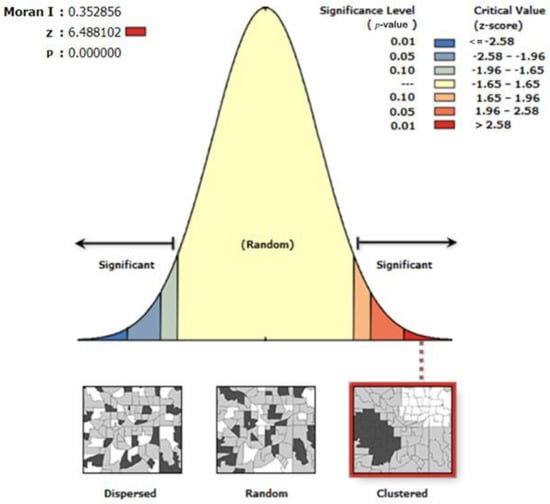
Figure 3.
Results of the spatial autocorrelation analysis based on the global Moran’s I.
According to the calculated results, where the Moran’s I is 0.353, the distribution of results is on the right side of the normal distribution, and the region reflects aggregation. A Z value of 6.45 and p value of 0, according to the confidence correspondence table, indicate that a 99% probability that the current data are clustered, and the possibility of aggregation is greater than the possibility of random distribution. Hence, the distribution of fatal traffic accidents in the study area is characterized by significant spatial clustering, with a pattern of positive spatial correlation (i.e., streets with high accident rates cluster with each other, and streets with low accident rates cluster with each other).
4.2.2. Spatial Distribution Characteristic Analysis of Fatal Traffic Accidents Based on Local Moran’s I
The global Moran I analysis shows that the number of fatal traffic accidents in each street area studied is positively correlated with the spatial distribution of the street area, and a significant spatial aggregation of accident areas exists. Therefore, the local Moran I can be used to analyze the specific aggregation areas and characteristics, and it is calculated as follows:
where xi is the accident level attribute of element i; is the mean of the corresponding attributes; wi,j is the spatial weight between elements i and j; and Si is the aggregation of all spatial weights.
where: n is equal to the area where the accident point is located.
The formula for calculating the ZI value of the statistics is as follows:
of which:
where: V[I] is the variance, and E[I] is the expected value.
In the local Moran I, a 95% confidence level of statistical significance is used (i.e., a p-value of less than 0.05 is statistically significant). Under the condition of statistical significance, if the I value is positive, then the data point has the same high or low attribute value as the neighboring points, and the point is part of a high–high value cluster or a low–low value cluster. The magnitude of the attribute value of the point in relation to the average of the attributes of all data points determines whether it is a high–high or low–low clustering. A negative I-value indicates that the data point is significantly different from the attribute values of the neighboring points (i.e., the point is an outlier).
The local Moran I and P and Z values for each area were calculated using the above-mentioned formulae to investigate the spatial correlation of the occurrence of fatal traffic accidents in the area of each street under study. The statistics of the calculated results for streets with aggregation effects and outliers are shown in Table 4 and visualized in Figure 4.
Table 4.
Results of local Moran I calculations.
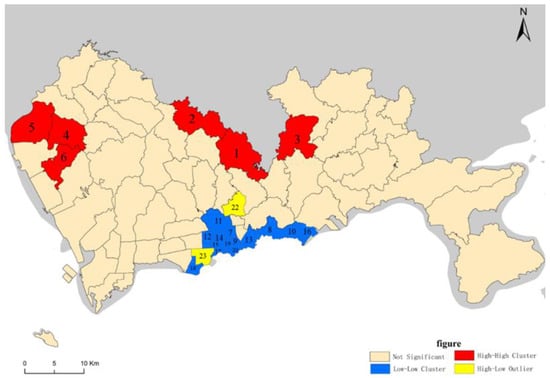
Figure 4.
Regional clustering of traffic accidents based on the local Moran I.
The Figure 4 shows that the areas with street area numbers 1–6 show a high concentration of accidents, in the order of the northern streets of Longgang District, the northeastern streets of Longhua District, and the northwestern streets of Baoan District, similar to the previous analysis of the administrative areas with a high incidence of accidents. The traffic and surrounding environment of the high accident-incidence street areas are complex, with a large number of industrial parks and dense population, high demand for freight transport, the presence of highways, expressways, and main roads for freight transport, and the proximity to the municipal boundary, which is the main route for external traffic, resulting in high accident rates and clusters. Most streets in Futian and Luohu Districts and some of the streets in Yantian District show low clustering of accident occurrences, indicating that the accident rates in these areas are low and present traffic safety clustering areas. The reason for this is the two important traffic hubs in the area with street number 22 and many residential communities in the surrounding area, which are prone to traffic accidents due to the large number of people and vehicles. A city expressway interchange occurs in street number 23, and vehicles enter the surrounding roads via the side roads often at high speeds. This area is close to the residential areas and schools, with a high volume of pedestrian and vehicular traffic in the morning and evening peaks, making it easy for accidents to occur at road intersections.
4.2.3. Analysis of Fatal Traffic Accident Hotspot Areas Based on Getis-Ord Gi*
After the local spatial autocorrelation analysis, the main streets where accidents occur can be obtained. Getis-Ord Gi* was used to calculate and analyze the hotspot areas where accidents occur by dividing the streets in the study area into geographical units for further exploring the connection between the gathering areas and the surrounding areas. The formula is as follows:
where xj is the attribute value of element j, wij is the spatial weight between elements i and j, n is the total number of elements, and
The value returned from the calculation for each street in the study area is a statistically significant Z-score. When the value is positive, the higher the value, the more closely clustered the accident-prone street area is; when the value is negative, the lower the value, the more closely clustered the street area with a lower accident frequency is. The hotspot areas where fatal traffic accidents occur in Shenzhen are mainly concentrated in the relevant streets in the north of Baoan District, the relevant streets in the north of Longgang District, and the relevant streets in the northeast of Longhua District (Figure 5).
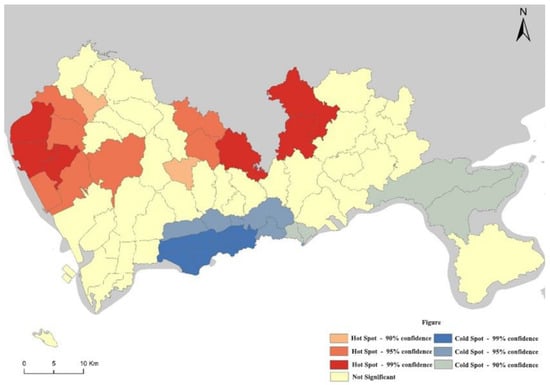
Figure 5.
Results of the analysis of fatal traffic accident hotspot areas based on Getis-Ord Gi*.
5. Analysis of the Factors Influencing Fatal Road Traffic Accidents Based on Principal Component Analysis
5.1. The Process of Principal Component Analysis
The subjective factors of each accident subject during an accident are regarded as the primary factors contributing to the accident. This study hypothesis states that potential correlations exist among these influencing factors. This study uses principal component analysis to synthesize the multiple influencing factors of each accident subject in the data to extract the primary influencing factors of the accident.
The basic idea of principal component analysis is to regroup a large number of indicators with a certain degree of correlation into a new set of mutually independent composite indicators (i.e., to make a linear combination of the original indicators into a number of new indicators). The first linear combination is required to have the largest variance (i.e., the first composite indicator contains the most information). If the first principal component is not sufficient to represent the information of all the original indicators, then we consider selecting a second principal component and that the existing information does not appear in it, and so on, until the selected principal component has sufficient information needed for the evaluation. The main calculation steps are as follows:
- (1)
- Determine the sample data.
- (2)
- Data normalization is calculated as follows:
- (3)
- Find the correlation matrix R for the indicator data.
- (4)
- Find the eigenvalues and eigenvectors of matrix R.
If the eigenvalues are denoted as λ1 ≥ λ2 ≥ … ≥ λi ≥ 0, then a1, a2, …, al are the corresponding unit orthogonal eigenvector principal components, as shown in Equation (21), where Zi is the first principal component.
- (5)
- Calculate the principal component contribution.
The accident statistics selected for this study include records of the factors influencing the accident for the subject of the accident, including the direct and contributing factors leading to the accident, such as motorists, non-motorists, and pedestrians. The influencing factors for motorists include motorists failing to drive safely according to operating specifications, carelessness, distracted driving, passing in violation of prohibited signs, passing in violation of traffic signals, overspeeding, overloading, fatigue driving, and driving a vehicle with hidden safety hazards. For non-motorists their accident influencing factors include nine influencing factors such as driving on the motorway, failure to follow signal lights, illegal carriage of persons, illegal load, driving without a license, failure to wear a safety helmet, unsafe overtaking, drunk driving and driving in the opposite direction. The accident influencing factors for pedestrians include three items such as entering and walking in the motorway, illegal crossing of the road, and running a red light. The factors are categorized and numbered in Table 5 below.
Table 5.
Factors influencing the main body of fatal traffic accidents.
5.2. The Selection of Influencing Factors
The KMO and Bartlett’s sphericity tests were used to calculate the correlation indicators between the factors influencing the accident before the principal component analysis was carried out. The closer the KMO value is to one, the stronger the correlation between the variables, and the Bartlett’s sphericity test value is less than 0.01, indicating that the stronger the correlation between the variables is, the more suitable for principal component analysis. As shown in Table 6, the KMO value of the data selected for this paper was 0.706, with a significance much less than 0.01. Correlation exists between the influencing factors, and the operation of principal component analysis can be carried out.
Table 6.
KMO and Bartlett’s test results.
The standardized data were subjected to principal component covariance matrix analysis in SPSS, and the eigenvalues corresponding to each principal component were ranked by calculation and rotated using the maximum variance method, as shown in Table 7. The total variance of the first eight principal components of after rotation explains a cumulative percentage of 85.062%, indicating that the first eight principal components can represent this dataset well. Furthermore, the percentage of their variance decreases in order, indicating that the principal components are decreasing in importance.
Table 7.
Total variance explained.
The rotated component matrix was obtained using factor analysis to further explore the relationship between the influencing indicators and the principal components, as shown in the Table 8. The absolute value of factor loadings greater than 0.6 was selected as the main influencing factor of accident occurrence, and the rest were secondary influencing factors with decreasing degree of influence on accident occurrence according to the decay of their coefficient values.
Table 8.
Rotated component matrix.
In Table 8, the main influencing factor for principal component 1 is f2 (i.e., the driver failed to safely drive according to the operating specifications); the main influencing factor for principal component 2 is f1 (i.e., the motorist is careless in the driving process); and the main influencing factor of principal component 3 is f8 (i.e., the motorist is driving a vehicle with hidden safety hazards). Meanwhile, the main influencing factor is f10 (i.e., the non-motorist driving on the motorway). The main influencing factor is f6 (i.e., motorists driving at excessive speed); the main influencing factor for principal component 6 is f7 (i.e., motorists driving overloaded); the main influencing factor of principal component 7 is f3 (i.e., motorists driving distracted); and the main influencing factor for principal component 8 is f14 (i.e., non-motorist driving without a license).
Among the factors influencing the fatal traffic accidents based on the principal component analysis, the causes of motorists are the dominant factors causing accidents to occur, among which, motorists fail to safely drive according to operating specifications, demonstrate carelessness, fail to deal with safety hazards of the vehicle in a timely manner, are over-speeding, overloading, and demonstrating distracted driving behavior, which shows that the safety awareness of motorists and their driving practices must be improved. Non-motorized drivers driving on the motorway and driving without a license were also major factors in the accidents, and the management of non-motorized drivers and vehicles must be strengthened.
6. Research on the Countermeasures of Safety Enhancement
The above-mentioned analysis method shows that among the fatal traffic accidents that occurred in Shenzhen in the past 5 years, the accident fields are mainly concentrated in dump truck transportation, general freight transportation, and taxis. The morning and evening peaks are still the high incidence of accidents, and an obvious spatial aggregation effect in the occurrence of accidents can be observed in the study area. Among the influencing factors of accident subjects, motorists’ factors dominate, mainly in terms of weak safety awareness and irregular driving practices. In addition, non-motorists occupying the road and driving without a license are contributing factors to the occurrence of accidents. Based on the above-mentioned accident occurrence characteristics, the following targeted response strategies are proposed to reduce the occurrence of fatal traffic accidents.
- (1)
- Strengthen the supervision and management of key accident fields, such as dump truck transportation, general freight transportation, and taxis with safety-assisted technological innovation. The staff of relevant enterprises in key accident areas will be assessed for their safety management capabilities and be licensed to work in the field. The persons in charge of the relevant enterprises will be required to carry out regular inspections of safety work. With regard to the blind spots in the field of vision of large transport vehicles, such as dump trucks, the popularization of sound and light warning technology for pedestrian and non-motorized vehicle identification should be promoted to provide drivers with road environment perception assistance. Non-motorized vehicle management methods should be developed, and non-motorized drivers should be should be rigorously penalized for traffic violations to reduce the accident rate in key accident areas and accident targets.
- (2)
- To enhance safe driving training for motorists involved in the industry, regular training on safe driving practices is provided to drivers involved in the transport industry. A minimum length of training is required. To address the main factors affecting accidents, such as driver negligence and distracted driving, the driver’s psychophysiological function testing technology is used to test and evaluate the driver’s ability to concentrate and distribute their attention to improve the awareness of safe driving and the standardization of driving practices among motorists. Drivers are also required to carry out and record regular vehicle inspections and performance checks to identify potential vehicle safety hazards in a timely manner.
- (3)
- The management of accident hotspots must be strengthened. The risks of high-risk road sections, such as intersections with heavy pedestrian traffic and mixed motor/non-motorized road sections in accident hotspots, should be regularly identified, and warning signs and markings must be installed. Additional guardrails, warning strips, pedestrian safety islands, and other facilities should be installed to reduce conflicts between motor and non-motorized vehicles and pedestrians and minimize safety risks. Additional traffic safety wardens are deployed during the morning and evening rush hours in accident hotspot areas to promptly discourage and publicize traffic violations by non-motorized vehicles and pedestrians.
In addition, many advanced optimization algorithms, such as machine learning and multi-objective optimization, have been applied and promoted in the field of traffic emergency safety. These methods can make the decision-making process more accurate, more efficient, and faster [30,31]. In future studies, these algorithms will be applied for research and compared with current methods to explore more possibilities for solving traffic safety problems.
7. Conclusions
Based on the statistical data of fatal traffic accidents in Shenzhen from 2018 to 2022, this study has explored the relevant characteristics, spatial effects, and influencing factors of accident occurrence in the study area by using the TI-IDF algorithm, spatial analysis methods, and principal component analysis. The main conclusions obtained are as follows.
- (1)
- The main characteristics of fatal traffic accidents occurred in Shenzhen in the past 5 years were obtained by using word frequency statistics and TI-IDF algorithm to calculate the accident description text information. Specifically, the main accident fields were dump truck transportation, general freight transportation, and taxis. The main accident subjects were vulnerable groups of traffic, such as electric bicycles, pedestrians, and bicycles. The main accident type was collision, and the morning and evening periods were accident-prone hours. The areas with more industrial parks and road transport enterprises in Baoan, Longgang, and Longhua Districts are the main accident-prone areas.
- (2)
- According to the nuclear density analysis of the accident sites, the accidents in the study area have a certain spatial aggregation effect. The global Moran I, local Moran I, and hot spot analysis were used to explore the aggregation pattern using the street district as the geographical unit. The main accident hotspots are located in the northwest of Baoan District, the north of Longgang District, and the northeast of Longhua District.
- (3)
- Eight major components were extracted from the 21 factors of accident subjects, such as motorists, non-motorists, and pedestrians, using principal component analysis to extract the influencing factors of accident subjects that cause accidents. According to the coefficient weight of each factor, weak safety awareness and irregular driving operation of motorists were the major factors that caused fatal accidents. Meanwhile, non-motorists occupying motor vehicle lanes and driving without a license were secondary factors contributing to the occurrence of accidents.
- (4)
- The characteristics of the fatal traffic accident areas, the accident hotspot areas, and the fatal accident influencing factors in Shenzhen in the past 5 years were derived by summarizing the results of the above calculations and analyses. On this basis, the corresponding safety management strategies were proposed to reduce accidents.
Author Contributions
Conceptualization, X.Z. and S.Q.; formal analysis, S.Q. and A.Z.; methodology, S.Q.; software, A.Z.; validation, Y.L. and S.H.; writing—original draft, S.Q. and A.Z.; writing—review and editing, X.Z. All authors have read and agreed to the published version of the manuscript.
Funding
This research was funded by the National Natural Science Foundation of China (Grant No. 52102410), the 2023 Basic Research Plan Program of Guangzhou (SL2023A04J00686), and the General Colleges and Universities Young Innovative Talents Project of Guangdong Province (Grant No. 2021KQNCX073).
Institutional Review Board Statement
Not applicable.
Informed Consent Statement
All participants in the study were informed of the precautions before the experiment and signed a notification form agreeing to the data for use in the study.
Data Availability Statement
This data is collected by the research group and will not be disclosed. If anyone needs data, they can contact the corresponding author.
Conflicts of Interest
The authors declare no conflict of interest.
References
- Hermans, E.; Ruan, D.; Brijs, T.; Wets, G.; Vanhoof, K. Road Safety Risk Evaluation by Means of Ordered Weighted Averaging Operators and Expert Knowledge. Spec. Issue Intell. Decis. Support Warn. Syst. 2010, 23, 48–52. [Google Scholar] [CrossRef]
- Anderson, T.K. Kernel density estimation and K-means clustering to profile road accident hotspots. Accid. Anal. Prev. 2008, 41, 359–364. [Google Scholar] [CrossRef]
- Murat, Y.S.; Sekerler, A. Modelling Traffic Accident Data by Cluster Analysis Approach. Tek. Dergi. 2009, 20, 4759–4777. [Google Scholar]
- Al-Aamri, A.K.; Hornby, G.; Zhang, L.C.; Al-Maniri, A.A.; Padmadas, S.S. Mapping road traffic crash hotspots using GIS-based methods: A case study of Muscat Governorate in the Sultanate of Oman. Spat. Stat. 2021, 42, 100458. [Google Scholar] [CrossRef]
- Jasiuniene, V.; Vaiskunaite, R. Road safety assessment considering the expected fatal accident density. Balt. J. Road Bridge Eng. 2020, 15, 31–48. [Google Scholar] [CrossRef]
- Ma, Q.; Huang, G.; Tang, X. GIS-based analysis of spatial-temporal correlations of urban traffic accidents. Eur. Transp. Res. Rev. 2021, 13, 50. [Google Scholar] [CrossRef]
- Yang, Y.L.; Jin, L.H. Visualizing Temporal and Spatial Distribution Characteristic of Traffic Accidents in China. Sustainability 2022, 14, 13706. [Google Scholar] [CrossRef]
- Haddon, W., Jr.; Valien, P.; McCarroll, J.R.; Umberger, C.J. A controlled investigation of the characteristics of adult pedestrians fatally injured by motor vehicles in Manhattan. J. Chronic Dis. 1961, 14, 655–678. [Google Scholar] [CrossRef]
- Albertsson, P.; Falkmer, T. Is there a pattern in European bus and coach incidents? A literature analysis with special focus on injury causation and injury mechanisms. Accid. Anal. Prev. 2005, 37, 225–233. [Google Scholar] [CrossRef]
- Chu, H.C. Assessing factors causing severe injuries in crashes of high-deck buses in long-distance driving on freeways. Accid. Anal. Prev. 2013, 62, 130–136. [Google Scholar] [CrossRef]
- Zou, W.; Wang, X.; Zhang, D. Truck crash severity in New York city: An investigation of the spatial and the time of day effects. Accid. Anal. Prev. 2017, 99, 249–261. [Google Scholar] [CrossRef] [PubMed]
- SShen, Y.; Hermans, E.; Brijs, T.; Wets, G.; Vanhoof, K. Road Safety Evaluation and Target Setting Using Data Envelopment Analysis and Its Extemsions. Accid. Anal. Prev. 2012, 48, 430–441. [Google Scholar] [CrossRef] [PubMed]
- Guo, F.; Fang, Y. Individual Driver Risk Assessment Using Naturalistic Driving Data. Accid. Anal. Prev. 2013, 61, 3–9. [Google Scholar] [CrossRef] [PubMed]
- Li, Y.F.; Bai, Y. Development of Crash-severity-index Model for the Measurement of Work Zone Risk Level. Accid. Anal. Prev. 2008, 40, 1724–1731. [Google Scholar] [CrossRef] [PubMed]
- Hong, J.; Tamakloe, R.; Park, D. Application of association rules mining algorithm for hazardous materials transportation crashes on expressway. Accid. Anal. Prev. 2020, 142, 105497. [Google Scholar] [CrossRef] [PubMed]
- Ma, Z.; Steven, I.; Chien, J.; Dong, C.; Hu, D.; Xu, T. Exploring factors affecting injury severity of crashes in freeway tunnels. Tunn. Undergr. Space Technol. 2016, 59, 100–104. [Google Scholar] [CrossRef]
- Wong, S.C.; Sze, N.N.; Li, Y.C. Contributory factors to traffic crashs at signalized intersections in Hong Kong. Accid. Anal. Prev. 2007, 39, 1107–1113. [Google Scholar] [CrossRef]
- Oralhan, B.; Goktolga, Z.G. Determination of the Risk Factors That Influence Occurrence Time of Traffic Accidents with Survival Analysis. Iran. J. Public Health 2018, 47, 1181–1191. [Google Scholar]
- Kozłowski, E.; Borucka, A.; Świderski, A.; Skoczyński, P. Classification Trees in the Assessment of the Road-Railway Accidents Mortality. Energies 2021, 14, 3462. [Google Scholar] [CrossRef]
- Deb, R.; Liew, A.W.-C. Missing value imputation for the analysis of incomplete traffic accident data. Inf. Sci. 2016, 339, 274–289. [Google Scholar] [CrossRef]
- Mondal, M.A.; Rehena, Z. Road traffic outlier detection technique based on linear regression. Procedia Comput. Sci. 2020, 171, 2547–2555. [Google Scholar] [CrossRef]
- Deb, R.; Liew, A.W.-C. Noisy values detection and correction of traffic accident data. Inf. Sci. 2019, 476, 132–146. [Google Scholar] [CrossRef]
- Zhang, Y.-M.; Wang, H.; Wan, H.-P.; Mao, J.-X.; Xu, Y.-C. Anomaly detection of structural health monitoring data using the maximum likelihood estimation-based Bayesian dynamic linear model. Struct. Health Monit. 2021, 20, 2936–2952. [Google Scholar] [CrossRef]
- Bokaba, T.; Doorsamy, W.; Paul, B.S. Comparative study of machine learning classifiers for modelling road traffic accidents. Appl. Sci. 2022, 12, 828. [Google Scholar] [CrossRef]
- Shen, Y.; Hermans, E.; Bao, Q.; Brijs, T.; Wets, G. Towards better road safety management: Lessons learned from inter-national benchmarking. Accid. Anal. Prev. 2020, 138, 105484. [Google Scholar] [CrossRef] [PubMed]
- Mallek, A.; Klosa, D.; Büskens, C. Impact of Data Loss on Multi-Step Forecast of Traffic Flow in Urban Roads Using K-Nearest Neighbors. Sustainability 2022, 14, 11232. [Google Scholar] [CrossRef]
- Li, L.-C.; Carlo, G.P.; Wang, Y.-G. Ranking contributors to traffic crashes on mountainous freeways from an incomplete dataset: A sequential approach of multivariate imputation by chained equations and random forest classifier. Accid. Anal. Prev. 2020, 146, 105744. [Google Scholar] [CrossRef] [PubMed]
- Zhang, Y.-M.; Wang, H.; Bai, Y.; Mao, J.-X.; Xu, Y.-C. Bayesian dynamic regression for reconstructing missing data in structural health monitoring. Struct. Health Monit. 2022, 21, 2097–2115. [Google Scholar] [CrossRef]
- Lee, H.P.; Hong, D.P.; Han, E. Analysis of the characteristics of expressway traffic information propagation using Twitter. Ksce J. Civ. Eng. 2016, 20, 2587–2597. [Google Scholar] [CrossRef]
- Pasha, J.; Nwodu, A.L.; Fathollahi-Fard, A.M.; Tian, G.; Li, Z.; Wang, H.; Dulebenets, M.A. Exact and metaheuristic algorithms for the vehicle routing problem with a factory-in-a-box in multi-objective settings. Adv. Eng. Inform. 2022, 52, 101623. [Google Scholar] [CrossRef]
- Rabbani, M.; Oladzad-Abbasabady, N.; Akbarian-Saravi, N. Ambulance routing in disaster response considering variable patient condition: NSGA-II and MOPSO algorithms. J. Ind. Manag. Optim. 2022, 18, 1035. [Google Scholar] [CrossRef]
Disclaimer/Publisher’s Note: The statements, opinions and data contained in all publications are solely those of the individual author(s) and contributor(s) and not of MDPI and/or the editor(s). MDPI and/or the editor(s) disclaim responsibility for any injury to people or property resulting from any ideas, methods, instructions or products referred to in the content. |
© 2023 by the authors. Licensee MDPI, Basel, Switzerland. This article is an open access article distributed under the terms and conditions of the Creative Commons Attribution (CC BY) license (https://creativecommons.org/licenses/by/4.0/).