Article

Carbon Footprint Prediction of Thermal Power Industry under the Dual-Carbon Target: A Case Study of Zhejiang Province, China

1
School of Law, Fuzhou University, Fuzhou 350116, China
2
School of Electrical Engineering and Automation, Fuzhou University, Fuzhou 350108, China
*
Author to whom correspondence should be addressed.
Sustainability 2023, 15(4), 3280; https://doi.org/10.3390/su15043280
Submission received: 30 December 2022 / Revised: 4 February 2023 / Accepted: 9 February 2023 / Published: 10 February 2023

Abstract

:
China is the world’s primary energy consumer. In order to address global warming, China has proposed a strategic goal of “reaching peak carbon and carbon neutrality”, which is related to a balance between human and natural life and has vital strategic significance for accelerating the construction of a sustainable society and achieving high-quality development. The energy sector is the main battlefield upon which the country will strive to achieve the “double carbon” goal, and power systems take the hierarchical first place in the current carbon emissions structure in China. Thermal power enterprises are facing severe challenges, such as low-carbon development, transformation, and upgrading. Therefore, it is crucial to study the thermal power industry’s carbon footprint. A scenario prediction method for estimating the carbon footprint of the thermal power industry in Zhejiang Province based on stacking integrated learning—i.e., the STIRPAT model—is proposed in this study. Using this model, to identify the main influencing factors, one can take the coefficient of determination (R2) and mean absolute percentage error (MAPE) as evaluation indicators, building a fusion advantage model to predict the carbon footprint. Four carbon peak action scenarios are set up to determine the thermal power industry’s carbon peak in 2021–2035, taking Zhejiang Province as an example. The findings indicate that the proposed method can accurately predict the carbon footprint of the thermal power industry, with the prediction coefficient (R2) being higher than 0.98 and the error (MAPE) being lower than 0.01. The carbon emission peaks of the thermal power industry under different carbon peak action scenarios are calculated, verifying that Zhejiang Province can reach the goal of a carbon peak; however, the low-carbon development model is too extreme and needs to be revised in combination with more reasonable improvement methods. Therefore, Zhejiang Province must be restructured industrially, the construction of high-tech industries must be encouraged, the energy consumption structure must be optimized, energy efficiency must be boosted, and energy use must be reduced. Relevant research offers a theoretical foundation and benchmark for China’s thermal power industry to promote industrial restructuring and low-carbon transformation by means of comprehensive governance.

1. Introduction

Climate breakdown is a problem faced by individuals, societies, and countries, and the resulting global warming and carbon emissions have gradually attracted the attention of the international community [1]. How to guarantee what has scientifically been deemed to be a reasonable level of carbon emissions to ensure a suitable climate for development is a problem that human societies must solve. According to Figure 1, as a consequence of its rapid economic and social growth, urbanization, and rising energy consumption, China’s carbon emissions have dramatically risen over the last 30 years [2].
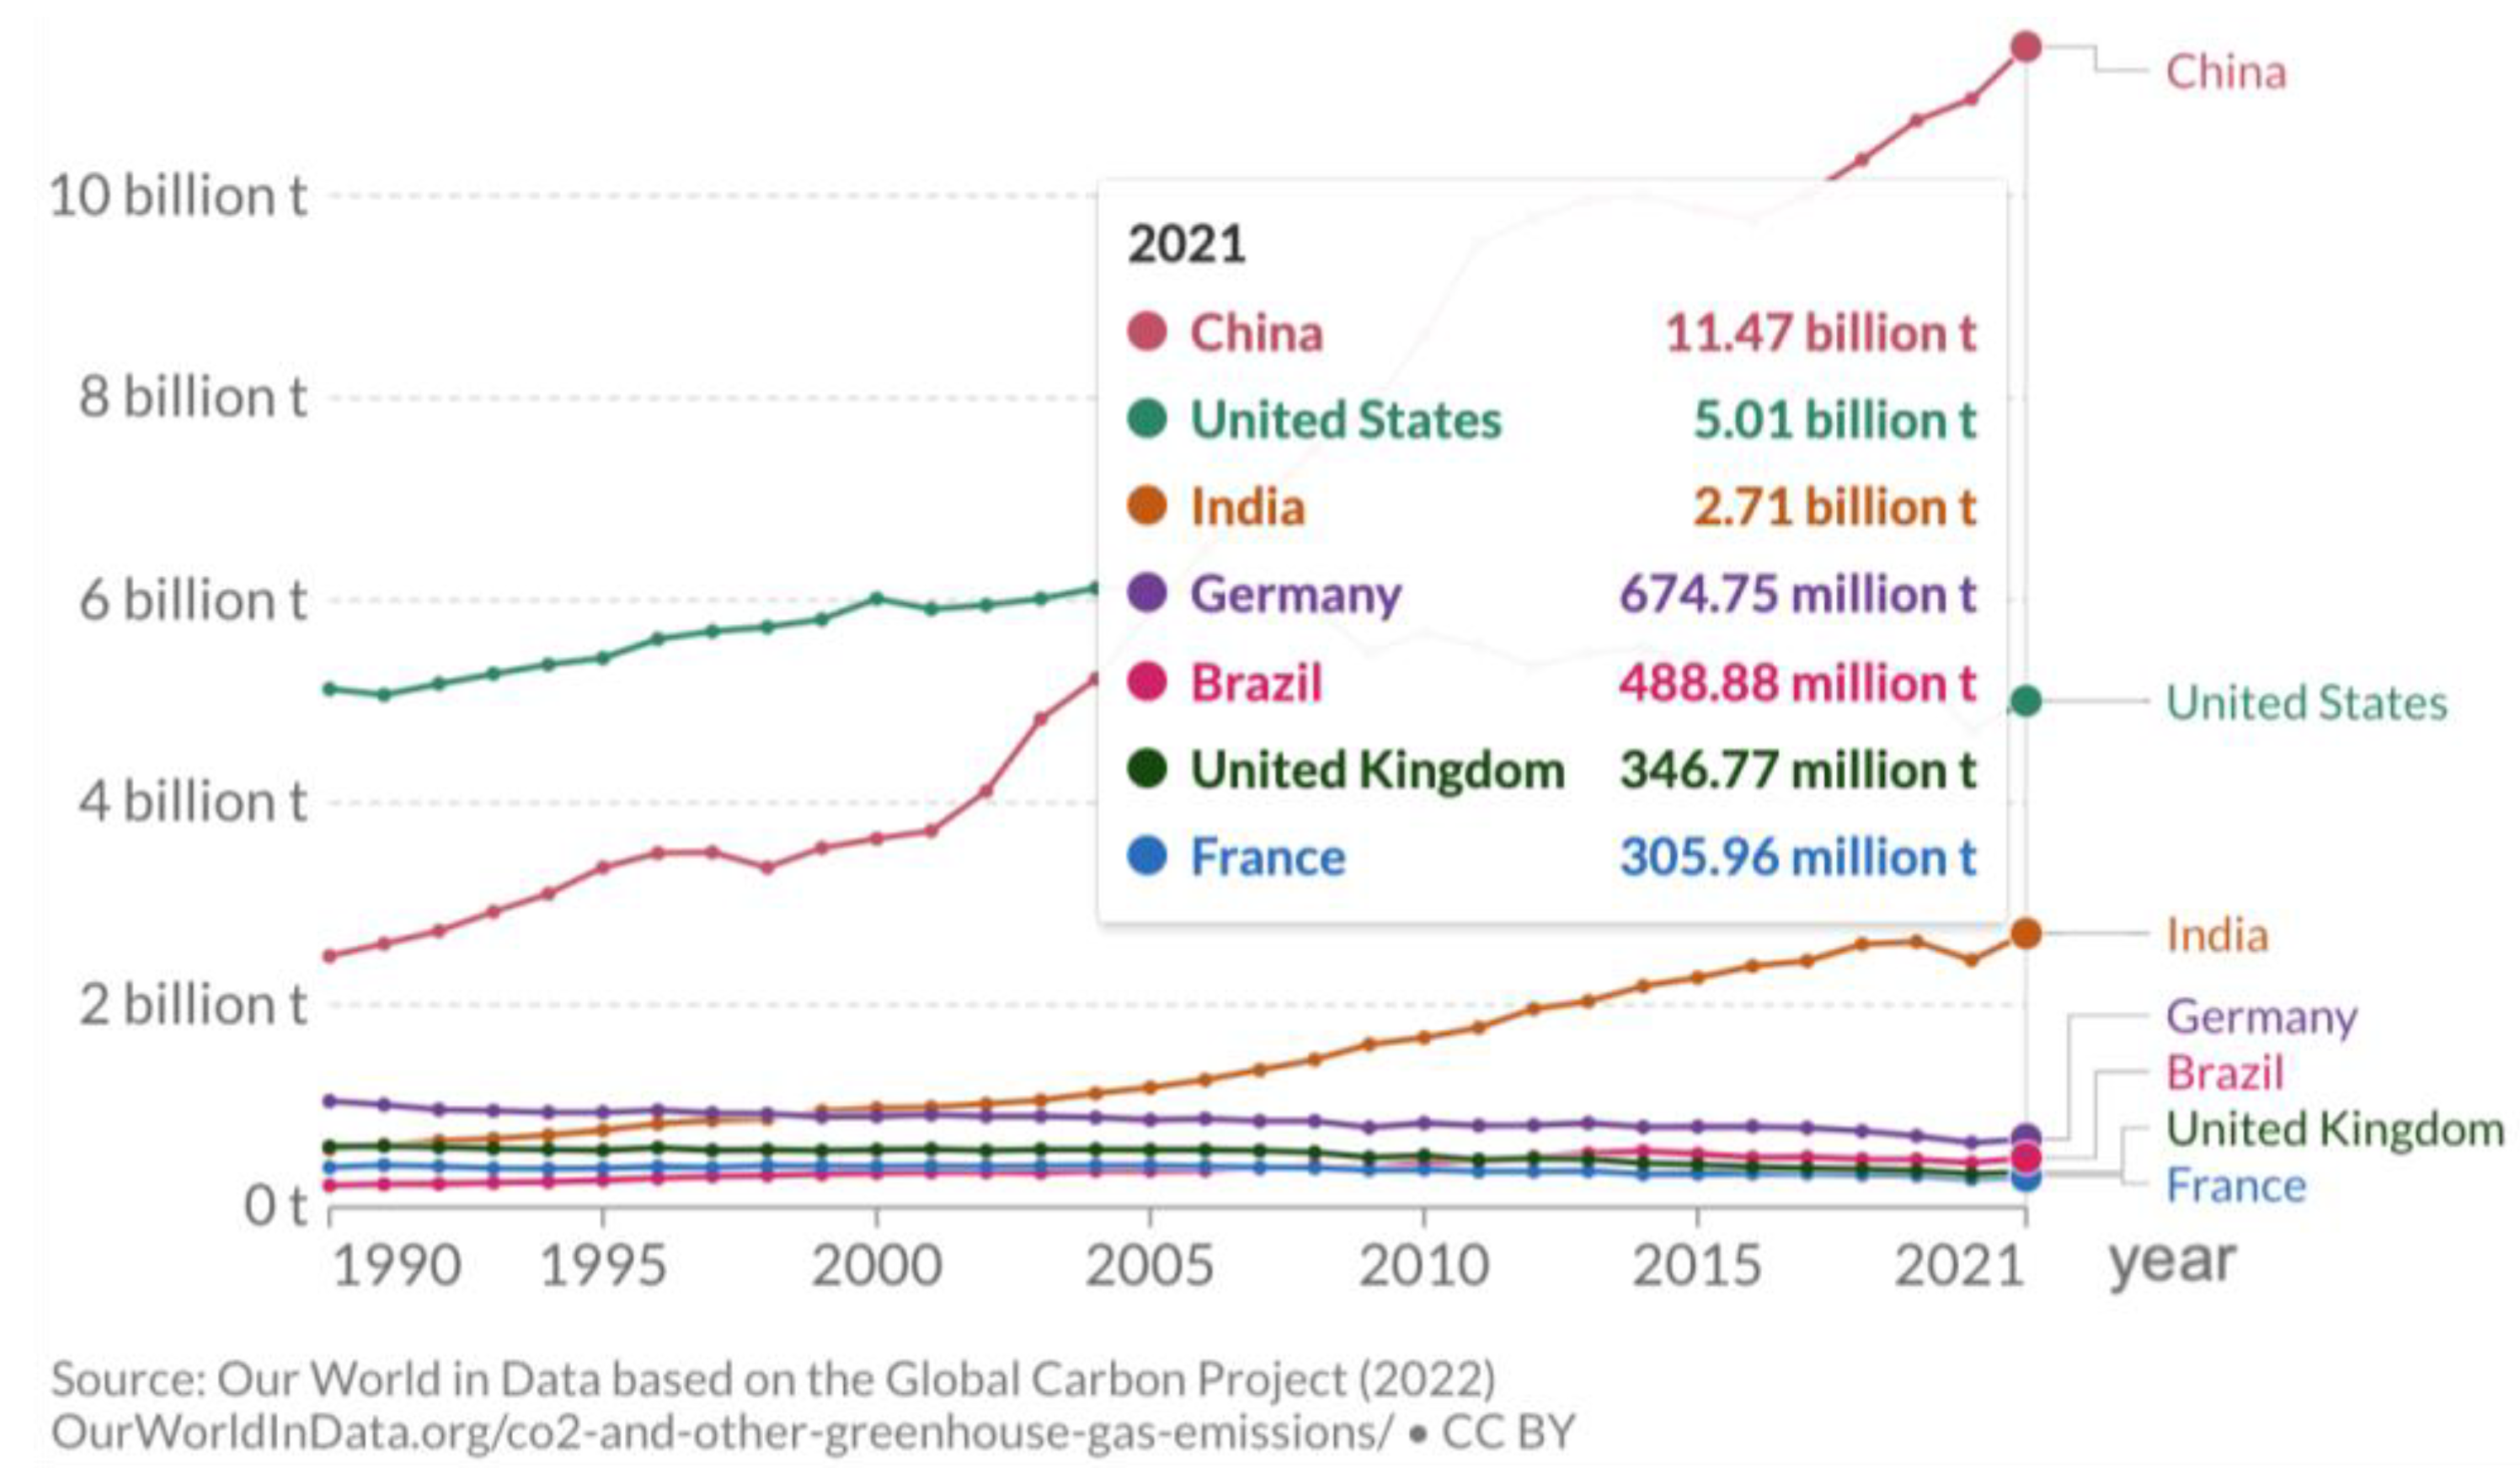
As shown in Figure 2 and Figure 3, in 2007, China ranked first globally for total carbon dioxide emissions, surpassing the USA. In 2021, the total carbon emissions emitted by China reached 11.47 billion T, still ranking first in the world and accounting for 30.9% of the world’s carbon emissions. China is among the world’s most populous nations, and its share of carbon emissions is still increasing [4].
China, as the world’s largest developing country, is in a critical period of industrialization and urbanization and faces severe challenges in coordinating economic expansion with reducing carbon emissions [5]. In 2020, the Chinese government pledged to raise the planned contributions specified at the national level, adopt more stringent policies, attempt to attain a peak in carbon dioxide emissions before 2030, and attempt to attain carbon neutrality before 2060 [6]. This declaration clarifies the importance of carbon peaking and carbon neutrality in the national economy and society, with both being clearly included in the overall plan of ecological civilization construction [7]. As shown in Figure 4, coal is the fuel with the highest CO2 emissions among the different fuels used in China, close to 8 billion T per year. In 2021, coal consumption accounted for 56.0% of total energy consumption. Thermal power is the chief industry that consumes fossil fuels and also one of the industries that emits the most CO2 in China [8]. According to statistics, the power industry’s thermal coal consumption accounts for more than 60% of China’s total [9]. Therefore, it is important to scientifically predict the carbon footprint, carbon peak time, and peak value of the thermal power industry for China to achieve carbon neutrality and a carbon peak.
At present, the carbon footprint prediction methods used in different industries generally fall into two types [10]. The first approach is based on historical carbon emission data. For example, on the basis of the new-information priority, Zhou et al. [11] developed a new grey rolling method. While considering the consistency of historical data, fresh data on the development trend are added, the average weak buffer operator is used to process the original sequence, and, prior to modeling, fresh data are gathered. Chen et al. [12] developed a comprehensive decomposition framework to study the carbon emissions intensity from the past three five-year plans (FYPs) at national, regional, and industrial levels, summarizing and exploring its evolutionary trend and driving factors. Shi et al. [13], drawing on the EKC hypothesis theory and Tapio decoupling index theory, used energy consumption as a stepping stone and analyzed the interval and time-point elastic relationships for many years by developing a multiple regression model for economic growth, energy use, and carbon emissions, as well as a low-carbon decoupling model. The advantage of this type of method is that it requires less data, but the prediction results do not necessarily account for the effects of changes in carbon emissions-related policies and environmental factors. The second method is to establish a carbon footprint prediction model by considering various factors, for which machine-learning methods have become an important and popular trend. Huang et al. [14] used long short-term memory neural networks (LSTM) to train the model and suggested a support vector regression (SVR) machine prediction model for predicting carbon emissions information in the Yangtze River Economic Zone. Li et al. [15] used the genetic algorithm to optimize the limit learning machine (GA-ELM) hybrid heuristic algorithm for the prediction of carbon emissions in the transport industry, determining the greatest degree of fit between the predicted value and the real value. Feng et al. [16] used the fast learning network (FLN) forecasting algorithm, improved with the chicken swarm optimization (CSO) prediction algorithm, to predict the technical carbon emissions from cement production and forest carbon sinks. This kind of method can predict the carbon footprint resulting from future policy planning, but it has the defects of a single model, such as weak learning performance and low prediction accuracy. The thermal power industry is one of the key industries for emissions reduction, but there are few reports on the prediction of its carbon footprint. Zhao et al. [17] contended that, in China, energy conservation and emissions reduction in the electric power industry are crucial for the reduction of the country’s overall carbon dioxide emissions. In the short term, the industrial added value of the power sector has a positive impact on CO2 emissions. China’s technical advancement in the power sector has been largely fueled by the pressure to lower carbon dioxide emissions. Some scholars, such as Fan [18], have pointed out that energy-saving transformation and carbon-capture projects are key technologies in the reduction of the carbon footprint of thermal power plants and have great potential to reduce their emissions. Wei et al. [19] believe that carbon capture, utilization, and storage (CCUS) is the key technology for reaching carbon neutrality in the coal power sector in China.
To compensate for the lack of a single model for machine-learning prediction, experts have constructed a combination model [20] and integrated learning-related algorithms [21]. The studies demonstrate that the combination model and integrated learning can effectively improve prediction accuracy by fusing multiple models in different forms. One of the most well-known methods for predicting carbon emissions is the STIRPAT model, which has been widely used for the prediction of carbon emission peaks. Wu et al. [22] used the STIRPAT model to analyze the carbon dioxide emissions of developed countries and found that the contributions of industrial structure, economic growth, and fossil energy intensity were limited. Huang et al. [23] used the STIRPAT model with traditional estimation indicators, including Driscoll and Kraay standard errors, fixed effects with instrumental variables, and the differential generalized moment method, to prove that technological progress is the major factor affecting carbon emissions reduction. An expanded STIRPAT model was created by Yu et al. [24] to evaluate driving factors; they determined that the most important driving factors affecting urban carbon emissions are family size, total population, unemployment, and the urbanization rate. Li et al. [25] evaluated the ecological footprint and ecological carrying capacity of Shandong Province in China and their driving factors based on the STIRPAT model. They pointed out that the expansion of the ecological footprint led to ecological damage in Shandong Province and that the growth of the overall population and the pace of urbanization will result in an increase in the ecological footprint. At the same time, in the near term, technological advancement may reduce the ecological impact.
At present, there are almost no relevant studies describing the prediction and analysis of the peak carbon emissions of the thermal power industry in Zhejiang Province based on the dual-carbon-target strategy. In addition, the STIRPAT model and the scenario analysis technique are easy to utilize and practical, and they make it possible to consider the impact of multiple factors. Therefore, this paper proposes a scenario prediction method for the carbon footprint of the thermal power industry in Zhejiang Province based on the STIRPAT model. The carbon footprint prediction is divided into three stages: dataset acquisition, stacking integrated learning model construction, and scenario analysis. In the first stage, utilizing the improved Kaya identity, we identify the influencing factors related to thermal power carbon emissions, including population, urbanization level, regional GDP, industrial structure, energy consumption intensity, and the structure of energy consumption. In the second stage, based on the above influencing factor data, the primary learner and meta-learner of the model are optimized by using R2 and MAPE as evaluation indicators with K-fold cross-validation and grid optimization methods to form the stacking integrated carbon footprint prediction model of multimodel fusion. In the third stage, based on the stacking integrated prediction model, the carbon emissions of the thermal power industry in Zhejiang Province under several sets of circumstances are predicted, and the carbon peak of the thermal power industry in Zhejiang Province is analyzed. We forecast the future carbon footprint of the thermal power industry in Zhejiang Province to provide a policy reference for Zhejiang Province so that it can give priority to achieving the Chinese national 2030 independent action goal and demonstrate and lead the low-carbon development of economically developed provinces.

2. Analysis of Factors Influencing Carbon Footprint Based on Extended STIRPAT Model

The STIRPAT model evolved from the IPAT model [26]. In 1971, Ehrlich and Holdren proposed the IPAT model, drawing a connection between carbon dioxide emissions and population size, per capita wealth, and technology level, and used it to measure the impact of population change on the environment. The equation is as follows:
I = α P β 1 A β 2 T β 3 ξ ,
where I represents carbon emissions; α is a constant term; β1, β2, and β3 are the influence coefficients; ξ is the random error; P is the population; A is the per capita wealth; and T is the technical level. Depending on the needs of the research, the STIRPAT model can be extended by introducing dimensionless variables and modified using coefficients and constant terms.
This paper’s enhanced STIRPAT model is presented in its basic version in Equation (2), in which the meaning of the variables has changed:
I = α P β 1 A β 2 T β 3 S β 4 N β 5 ξ ,
where I represents all carbon emissions from the thermal power industry (the fossil fuels generally consumed for thermal power include coal, oil, and natural gas); P is the total resident population; L is the urbanization level; A is the economic output; T is the industrial structure; S is energy consumption intensity, N is energy consumption structure; and β4 and β5 are the influence coefficients.
Using the basic form of the expanded STIRPAT model, the factors determining the carbon emissions of the thermal power industry can be analyzed, as shown in Table 1. The degree of urbanization L in the population does not appear in Equation (2) but, considering that it is a fundamental way to ensure equal prosperity in urban and rural areas and that it not only promotes the reform of industrial structure but also reflects the key factor of carbon dioxide output, it is also included in the key influencing factors. First of all, the selection of the resident population as a factor is relevant to the urban spatial form. Expansion in population size immediately increase the use of energy for living and production and improvements to the urbanization level are conducive to the establishment of a circular economy model for cities, thus leading to sustainable urban development and carbon emissions reduction. Secondly, economic form is a crucial consideration affecting carbon dioxide output. Reducing the proportion of secondary industrial buildings can promote carbon reduction, but the intensity of industrial structure optimization result in carbon emissions reductions gradually weakening. The traditional development model involves the total carbon emissions continuing to increase in the context of environmental governance, while the growth of economic volume is accompanied by carbon growth. Cities with low carbon emissions are generally developed cities utilizing low-carbon economic development models and developing cities with low energy consumption. Against the current policy background of environmental constraints, high-quality economic development should instead reduce carbon emissions. Again, from the perspective of energy and environmental constraints, the optimization of the energy consumption structure can promote an increase in the proportion of electric power resources in energy consumption and help to reduce energy consumption. Finally, China’s carbon emissions reduction and energy utilization technologies are relatively weak. The core of current carbon emissions reduction is reduction of carbon intensity, compensating for the rising carbon dioxide emissions that result from GDP growth with a decrease in intensity. A breakthrough in low-carbon technology is essential to achieve the present objective of reducing carbon intensity and the “dual carbon” target.
The logarithmic form of the extended STIRPAT model can also be obtained by taking the natural logarithm on both sides of Equation (3):
ln I = ln α + β 1 ln P + β 2 ln A + β 3 ln T + β 4 ln S + β 5 ln N + ξ
The logarithmic form of the STIRPAT model combined with ridge regression estimation is a classic prediction method. In this paper, stacking ensemble learning is used to replace ridge regression estimation to enhance the nonlinear expression.

3. Carbon Footprint Prediction Model Based on Stacking Ensemble Learning

3.1. Stacking Ensemble Learning Theory

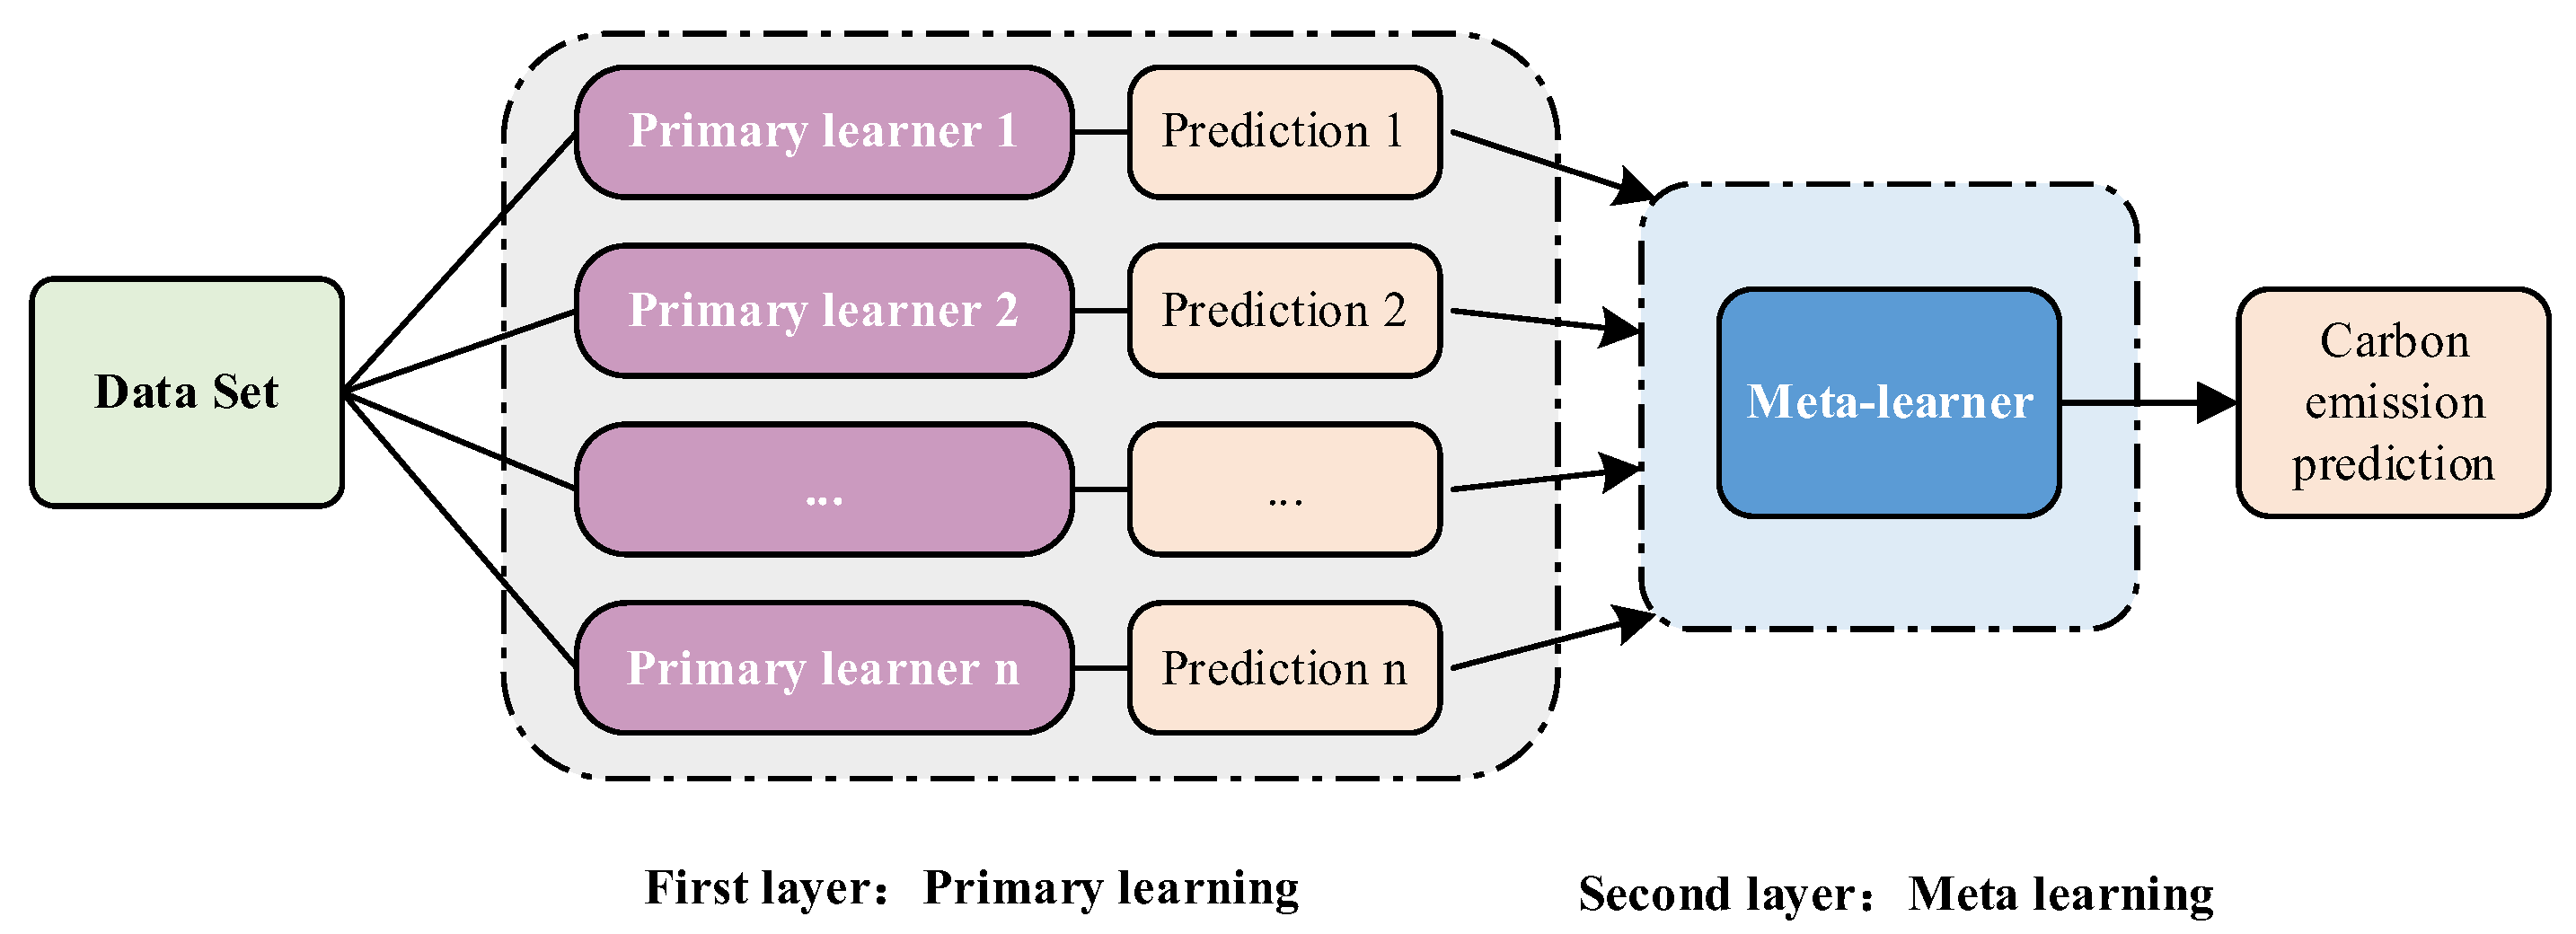
Stacking ensemble learning can be used to build a multilayer network, where each layer is composed of one or more different learners. The idea is to combine multiple weak supervision models to obtain a strong supervision model that can give full play to the advantages of different learners so as to improve the prediction accuracy of the whole model. Research shows that the two-layer stacking ensemble learning model can strengthen the learning effect without increasing the complexity of the model [27]. Therefore, we constructed a carbon footprint prediction model based on the two-layer stacking model. Its structure is shown in Figure 5.

3.2. Stacking Ensemble Learning Construction Process

The process of building a carbon emissions prediction model based on stacking ensemble learning is as follows:
(1)
Identify the primary learning level. The primary learner can be determined according to the principle of “good but different”, taking into account the symbolism and connectionism from machine learning; common k-nearest neighbors (KNNs), linear regression (LR), BP neural networks, decision trees (DTs), and support vector machines (SVMs) from statistical learning; and random forest (RF) algorithms as represented by string and parallel integration, adaptive boosting (AdaBoost), gradient boosting decision trees (GBDTs), and extreme gradient boosting (XG Boost). R2 and MAPE are used as evaluation indicators to train the above nine machine learning models and measure the prediction ability of each model. The primary learner layer is composed of learners with strong prediction abilities and different principles;
(2)
Determine the meta-learning layer. On the basis of the determined primary learning layer, the above nine learners are used as meta-learners to conduct a comparative analysis of R2 and MAPE evaluation indicators, determine the meta-learners, and form the prediction model structure for the stacking ensemble learning;
(3)
The collected dataset is used to train the stacking integrated learning and achieve carbon footprint prediction.

4. Learner’s Basic Principles

4.1. Logistic Regression (LR)

LR is a regression analysis model using binomial categorical variables that is part of the statistical learning method and a type of generalized linear model [28]. It has the characteristics of fast calculation speed and a strong display for simple linear relations. The equation for LR is:
{ P = e z 1 + e z z = β 0 + β 1 X 1 + β 2 X 2 + + β n X n ,
where P is the forecast results; Xn is the unrelated factor; and βn is the logistic regression coefficient.

4.2. Gradient Lifting Decision Tree (GBDT)

The GBDT is based on boosting serial integration, which means that the purpose of the data regression (classification) is achieved by continuously reducing the residual through a linear combination of basis functions in the calculation process [29]. The calculation process for the linear combination through basis functions is shown in Figure 6. The stages of the algorithm are as follows:
(1)
Assume that the dataset of the GBDT is D = {(x1,y1), (x2,y2), …, (xn,yn)}. Estimate a constant value c to minimize the loss function, and construct a number with only root nodes. The initialization model can be expressed as follows:
f 0 ( x ) = arg min c   i = 1 n L ( y i , c )
where f0(x) is the initialization model; L(yi, c) is the loss function; and c is a constant;
(2)
Iterative phase. First, suppose there are M trees and calculate the negative gradient and residual value of the loss function for the sample (i = 1, 2, …, n). The equation is:
r m i = L ( y i , f m 1 ( x i ) ) f m 1 ( x i ) .
(3)
Fit the mth regression tree with (xi, rmi) to determine the leaf node area Rmj (j = 1, 2, …, Jm) of the mth tree; here, Jm is the number of leaf nodes of the mth regression tree. Calculate the best fit value for each leaf node to minimize the loss function:
c m j = arg min x i R m j L ( y i , f m 1 ( x i ) + c ) ,
where yi is the observation value of sample xi of the jth leaf node; fm−1(xi) is the prediction value of sample xi of the jth leaf node on the previous tree; and cmj is the minimum error between yi and fm−1(xi) of the jth leaf node;
(4)
Update the current round model as follows:
{ f m ( x ) = f m 1 ( x ) + j = 1 J c m j I ,         x R m j I = { 1 , x i belongs   to   R m j 0 , x i   does   not   belong   to   R m j
(5)
Repeat until the expected number of base learners is reached, and the last adept learner is:
F ( χ ) = f 0 ( x ) + m = 1 M j = 1 J c m j I ,         x R m j .

4.3. Limit Gradient Lifting Tree (XGBoost)

Unlike the GBDT, XGBoost uses second-order Taylor expansion in the process of updating learners, which can quickly and accurately achieve the iteration of learners [30]. XGBoost ultimately obtains a successful prediction by adding the prediction results of multiple decision trees. The equation is as follows:
y = l L f l ( x j ) , f l F ,
where y indicates the prediction results, fl represents the lth tree, L is the number of decision trees, xj represents the jth input sample, and F is a tree model collection. The objective function and regular term adopted by the model are shown in Equations (11) and (12):
O b j ( t ) = j = 1 n L ( y j , y ^ j ( t 1 ) + f t ( x j ) ) + Ω ( f t ) + c
Ω ( f t ) = γ T + 1 2 λ o = 1 T w 0 2 ,
where Obj(t) is the objective function of the tree t, L() is the loss function, y j t 1 is the predicted value calculated for the previous t − 1 tree, c is a constant, Ω(ft) is the regular term of tree t, the sum of λ and γ is the coefficient of the regular term, T is the number of all leaf nodes in a tree, and w0 is the weight of the 0th leaf node in a tree. The Taylor expansion of Equation (11) is as follows:
O b j ( t ) j = 1 n [ L ( y j , y ^ j ( t 1 ) + g i f t ( x j ) + 1 2 h j f t 2 ( x j ) ] + Ω ( f t ) + c
g j = y ^ j ( t 1 ) L ( y j , y ^ j ( t 1 ) )
h j = y ^ j 2 ( t 1 ) L ( y j , y ^ j ( t 1 ) ) ,
where the sum of all hj values is the minimum-sample-weight sum of the leaf nodes to be adjusted.

4.4. BP Neural Network

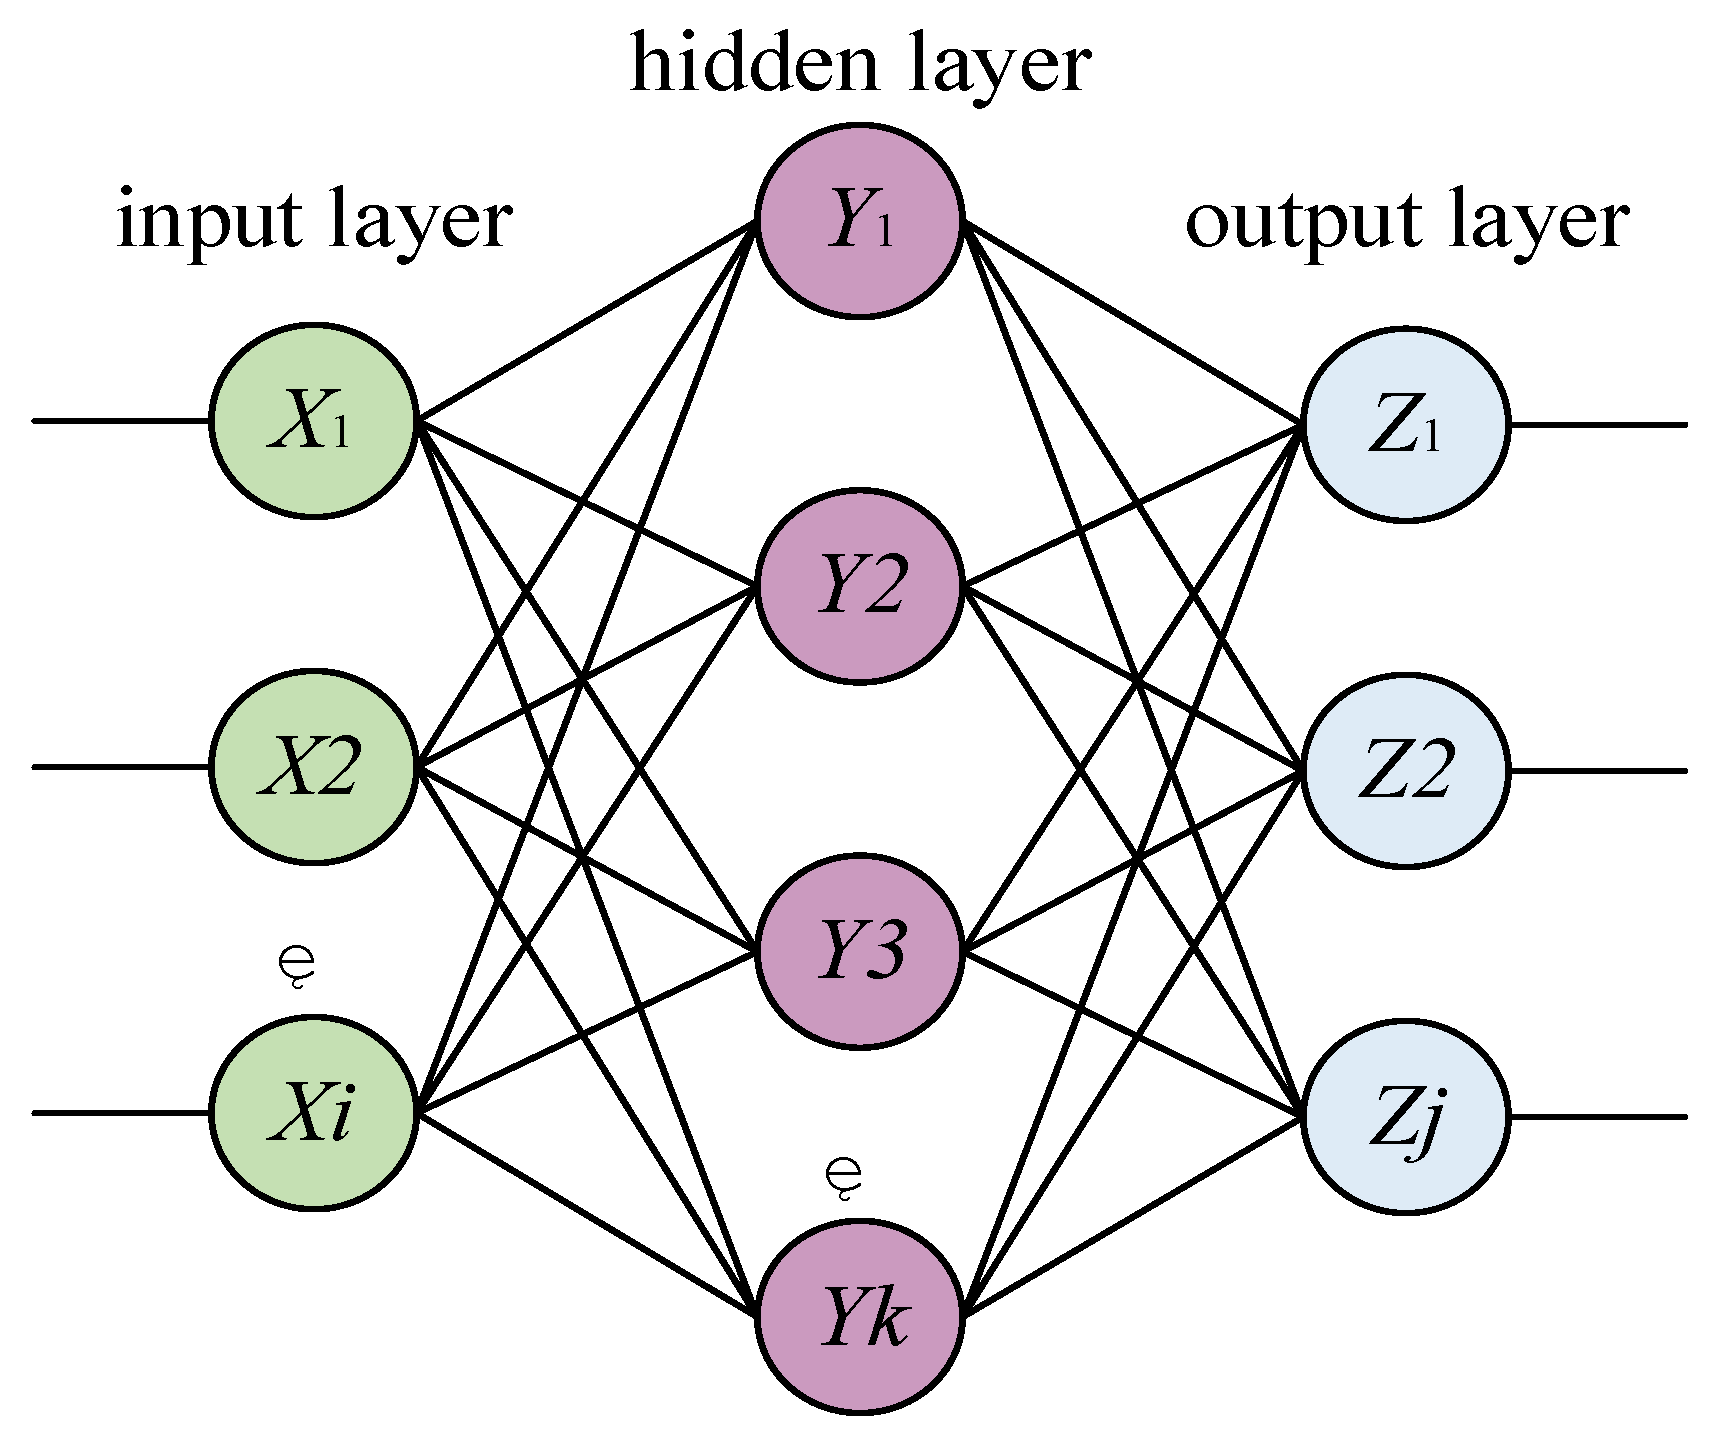
The BP neural network is one of the traditional connectionist network models [31]. Its structure is shown in Figure 7.
The equation is as follows:
{ Y k = f 1 ( i = 1 N 1 ω i k X i + b k ) Z j = f 2 ( j = 1 N 2 ω k j Y k + b j ) ,
where w is the weight; b is the offset; Xi is the input variable; Yk is the output value of the hidden layer; and Zj is the output value of the output layer.

5. Example Analysis of Carbon Footprint Prediction Based on Stacking Integrated Learning

The technical roadmap for the carbon footprint prediction method based on stacking integrated learning is shown in Figure 8. This paper takes the thermal power industry in Zhejiang Province as an example, and its carbon footprint prediction is divided into three stages: dataset acquisition, stacking integrated learning construction, and scenario analysis.

5.1. Dataset Source

5.1.1. Data Source for Influencing Factors

Based on the enhanced STIRPAT study, as indicated in Table 1, we can assess the six factors affecting thermal power carbon emissions: total resident population, urbanization level, financial gain, industrial buildings, energy consumption intensity, and energy consumption structure. Using the Statistical Yearbooks (2005–2020), we can directly or indirectly calculate the values of the six influencing factors from 2005 to 2020.

5.1.2. Data Calculation for Carbon Emissions

We take the carbon dioxide emitted by coal, oil, and natural gas consumption in the thermal power industry in Zhejiang Province as the total carbon emissions. The carbon emissions coefficient method is adopted for the calculation of carbon emissions. The equation is:
C = i = 1 3 C i = i = 1 3 E i × ε i × 44 12 ,
where εi is the coefficient of carbon emissions of class i energy (obtained from the IPCC (2006)).

5.2. Construction of Stacking Ensemble Learning Model

5.2.1. Model Evaluation Index

The performance evaluation indicators for the regression fitting models include the mean square error (MSE), root mean square error (RMSE), mean absolute percentage error (MAPE), and coefficient of determination (R2). The above indicators can be separated into two groups: one for those used to explore the accuracy of data prediction (MSE, RMSE, MAPE) and the other for those used to explore the distribution of data (R2).
It can be seen from [32,33,34,35] that the most commonly used and effective model prediction accuracy evaluation indicator in carbon emissions prediction is MAPE, so MAPE is used as one of the indicators to evaluate the performance of the model in this paper. To verify that the model can effectively capture the distribution of data, R2 [36,37] is also used as a key indicator to evaluate the performance of the model.
R2 and MAPE are used as indicators to evaluate the performance of the prediction model. The closer R2 is to 1, the closer MAPE is to 0 and the higher the prediction accuracy of the model. The expression is a follows:
{       R 2 = 1 i = 1 m ( y i y i ) 2 i = 1 m ( y i y m e a n ) 2 M A P E = 100 % m i = 1 m | | y i y i | y i | ,
where m is the number of test samples, y i is the test sample’s anticipated value, yi is the actual value, and ymean is the average of the actual values of m samples.

5.2.2. Selection of Primary Learners

The dataset of the model used the six factors influencing carbon emissions from 2005 to 2020 as characteristic variables and carbon emissions as target variables. The training set and test set were allocated from the dataset at a ratio of 7:3. The carbon footprint prediction models of the above nine learners were established by means of K-fold cross-validation and grid parameter optimization. The comparison results are shown in Figure 9 (KNN and LR are statistical learning representatives classified into one category for comparison; DT and SVM are semiotic representatives; BP refers to connectionist representatives; and RF, AdaBoost, GBDT, and XGBoost are integrated learning representatives classified into one category for comparison).
It can be seen from Figure 9 that the top four models for the R2 are in the following order: GBDT (R2 = 0.9793) > BP (R2 = 0.968) > LR (R2 = 0.9529) > XGBoost (R2 = 0.9444). The top four models for MAPE are in the following order: GBDT (MAPE = 0.0086) > BP (R2 = 0.0102) > XGBoost (MAPE = 0.0113) > LR (R2 = 0.0117). It can be seen that the carbon footprint prediction effects of the four learners GBDT, BP, LR, and XGBoost, as established separately, are the best, and they can be used as candidates for primary learners.

5.2.3. Selection of Meta Learners

The four primary learners identified above have advantages and disadvantages, and we use appropriate meta-learners to optimize the prediction effect of the stacking model. On the premise that the primary learning layer has been determined, the first nine learners are trained as meta-learners, and R2 and MAPE are also compared. The results are shown in Table 2.
Table 2 shows that, when BP is selected as the meta-learner, the R2 is 0.9944 and the MAPE is 0.0047, and the prediction performance is better than other combinations. Therefore, BP is determined as a meta-learner, and its prediction results are shown in Figure 10.

5.2.4. Algorithm Comparison

In addition to the proposed stacking BP prediction model (GBDT, BP, LR, XGBoost), we selected four commonly used carbon footprint prediction models to create a comparative experiment to fit the province of Zhejiang’s carbon emissions from 2005 to 2020. The four carbon footprint prediction models were ARIMA, GM (2,1), lasso BP [38], and STIRPAT ridge regression. Figure 11 shows the R2 and MAPE evaluation index values fitted by the five models, among which the carbon emissions fitting effect of the stacking BP was the best, STIRPAT ridge regression and the lasso BP model were in second place, and ARIMA and GM (2,1) had relatively poor fitting effects. ARIMA and GM (2,1) directly establish carbon emissions fitting models based on carbon emissions data. They require less data and are simple to calculate, but they do not take into account social factors related to carbon emissions, so the models are poor in terms of anti-interference. Stacking BP integrates multiple machine-learning-algorithm modes to play complementary roles. Therefore, although lasso BP, STIRPAT ridge regression, and stacking BP simultaneously consider factors related to carbon emissions, the algorithm combination of the former two is relatively simple compared to stacking BP.

5.3. Scenario Analysis

5.3.1. Scenario Settings

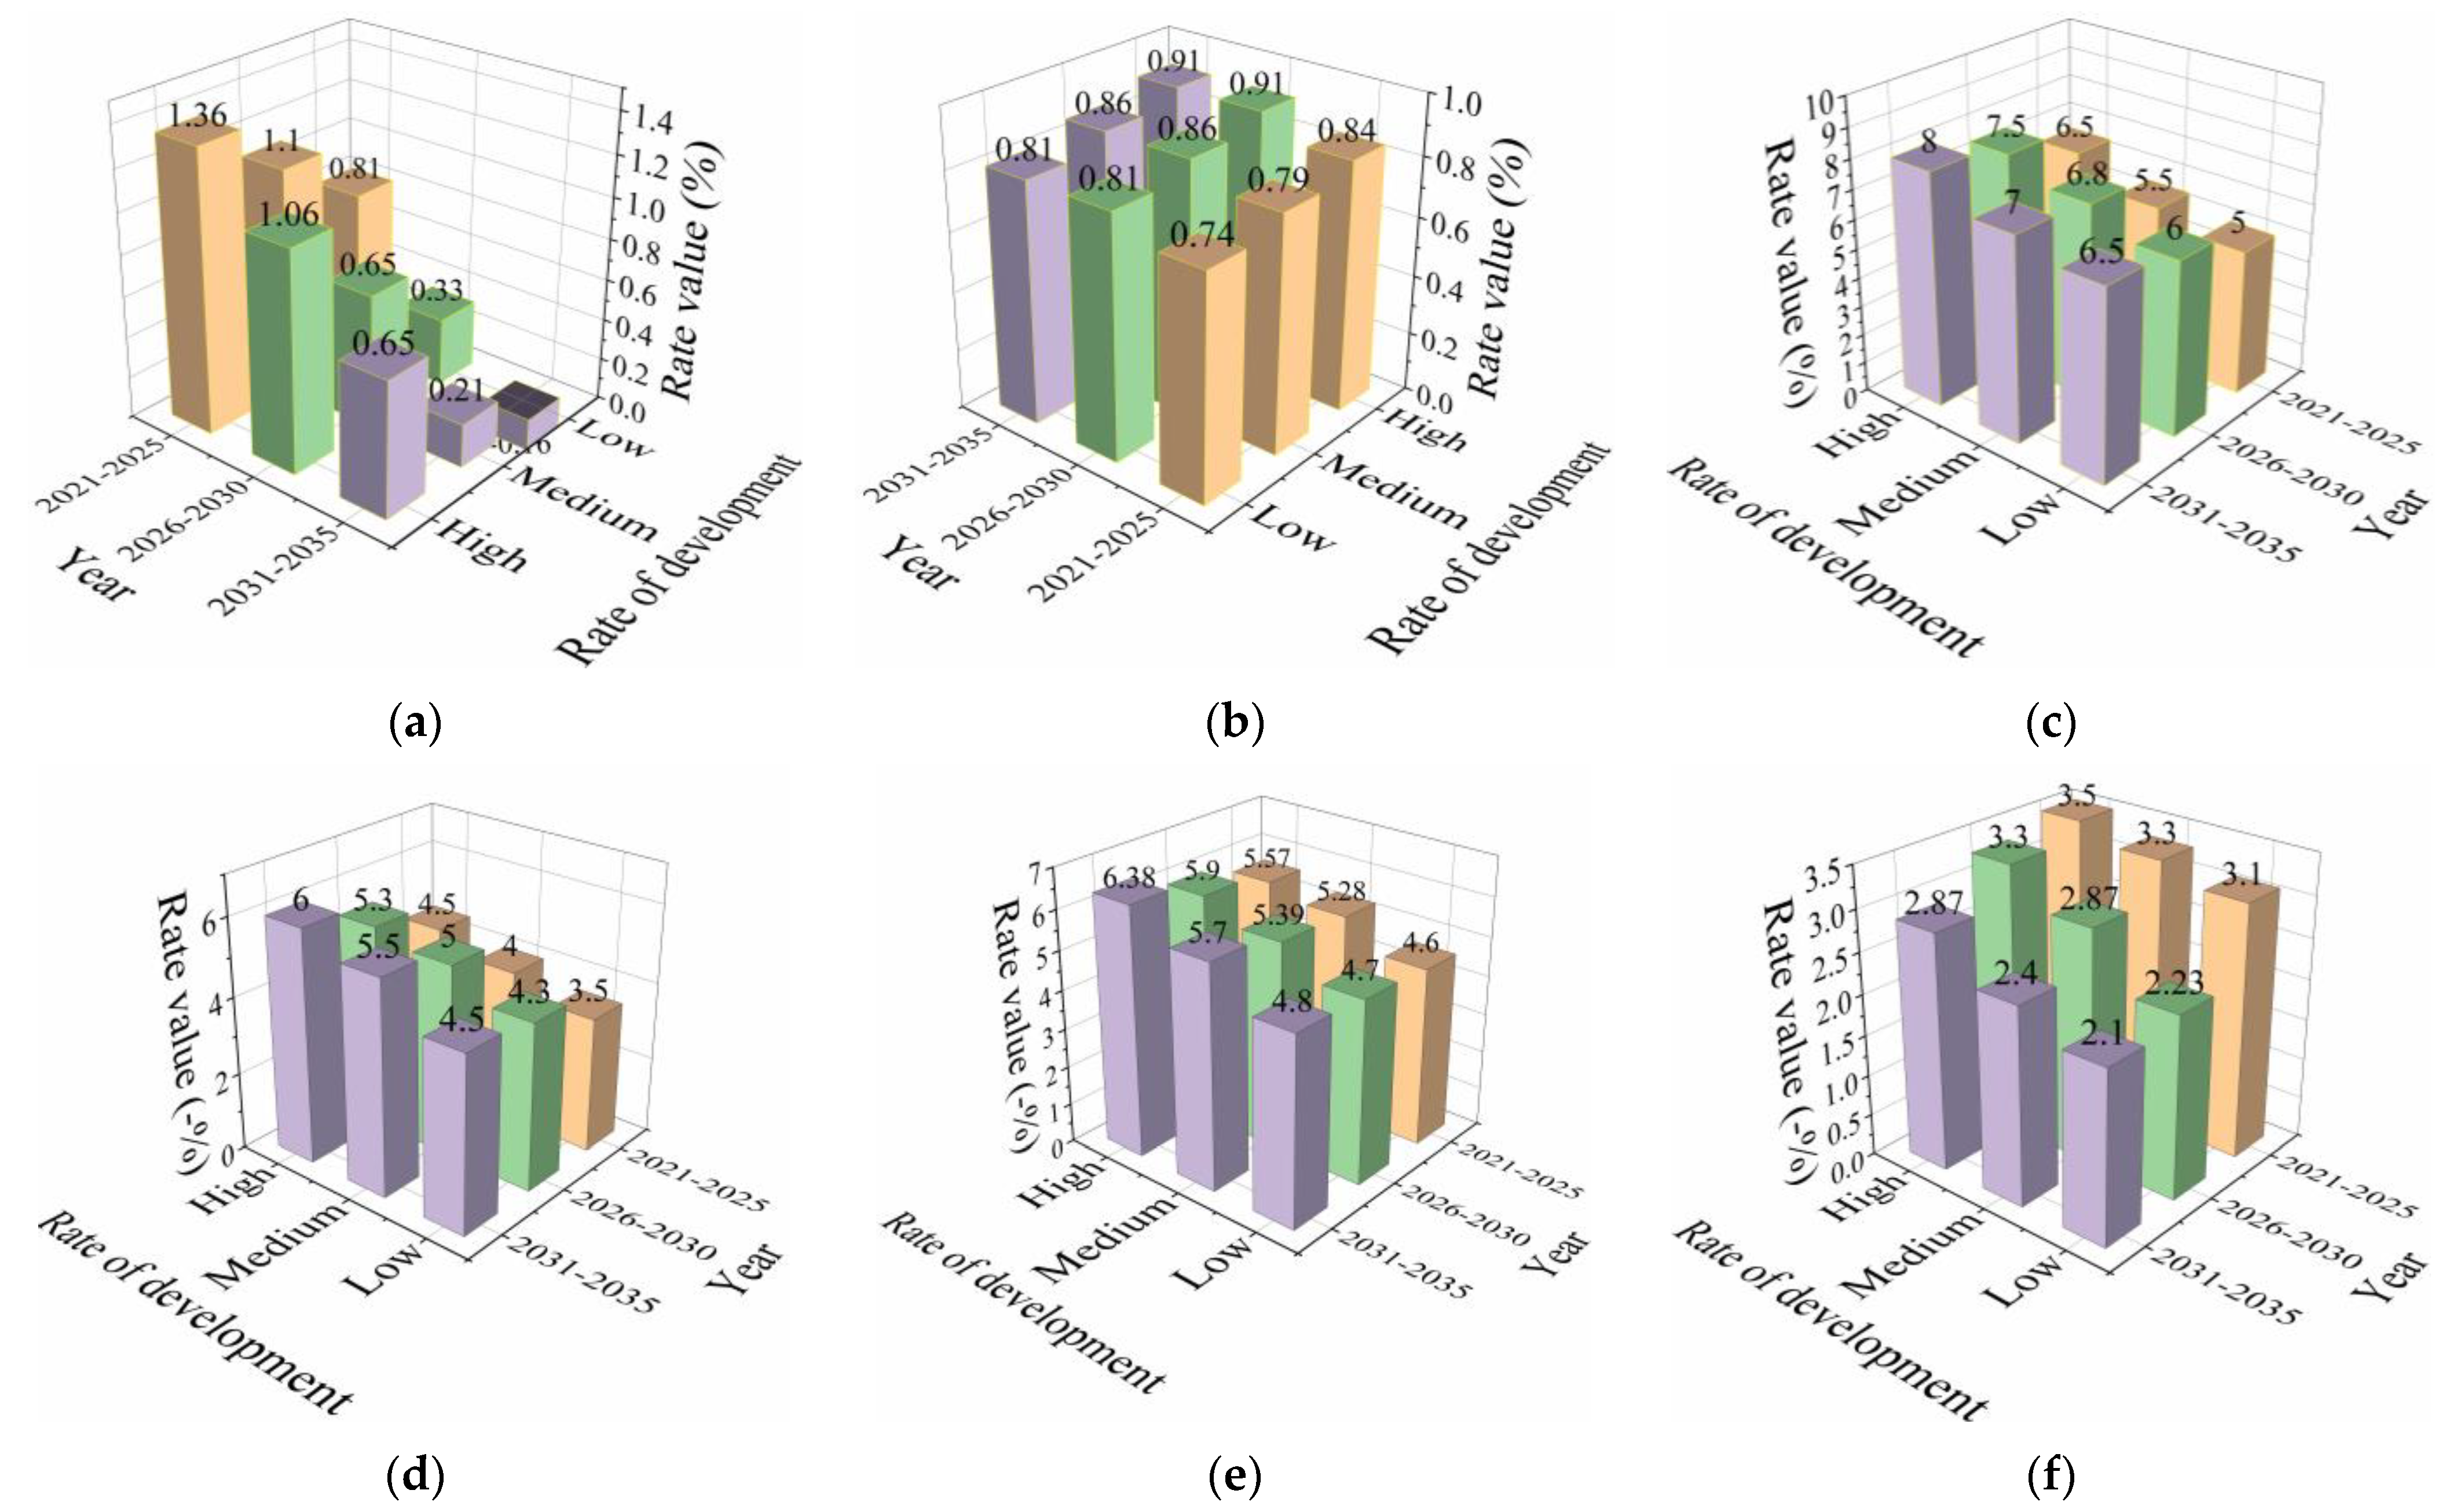
To more comprehensively forecast Zhejiang Province’s carbon footprint in combination with the 13th Five-Year Plan for National Economic and Social Development of Zhejiang Province, the 14th Five-Year Plan for New Urbanization Development of Zhejiang Province, the 14th Five-Year Plan for Energy Development of Zhejiang Province, and a series of provincial and municipal development plans [39,40,41,42,43], four scenarios for carbon footprint changes under the guidance of the different policies were set. The forecast took 2020 as the base year, 2035 as the target year, and five years as the basic period (corresponding to the five-year plan) and considered the future population, monetary output, industrial structure, energy consumption intensity, and energy consumption structure of Zhejiang Province. Each factor was designated as having a low, medium, or high annual average development rate, and corresponding reference values are given. The above parameter settings are shown in Table 3 and Figure 12.
Population: With the promotion of urbanization and the quickening of Zhejiang Province’s economic growth—in particular, the relaxation of settlement policies and the implementation of financial subsidies for the introduction of talent—the population inflow rate will continue to grow. Considering the effect of the two-child policy and according to the population planning forecast for Zhejiang Province, the low, medium, and high annual growth rates for Zhejiang’s population from 2021 to 2025 are set to be 0.81%, 1.1%, and 1.36%, respectively; from 2026 to 2030, the low, medium, and high average annual growth rates will be 0.33%, 0.65%, and 1.06%; and from 2031 to 2035, the low, medium, and high average annual growth rates will be −0.16%, 0.21%, and 0.65%.
Urbanization level: Zhejiang, which has always paid great attention to urbanization, is a leading province in China’s urbanization and the first province to propose a new urbanization strategy. Zhejiang shoulders the important mission of common prosperity. It highlights the urbanization development orientation of “taking people as the core”. From 2021 to 2025, the Provincial Government of Zhejiang’s average yearly growth rates for urbanization will be 0.74%, 0.79%, and 0.84%, respectively; from 2026 to 2030, the low, medium, and high average annual growth rates will be 0.81%, 0.86%, and 0.91%, respectively; and from 2031 to 2035, the low, medium, and high annual growth rates will be 0.81%, 0.86%, and 0.91%, respectively.
Economic output: Zhejiang Province strives for exceptional economic growth and has achieved sustained, healthy, and fast growth in the economy on the basis of significant improvements in quality and efficiency. During the 14th Five-Year Plan period, the provincial gross domestic product and per capita gross domestic product exceeded 8.5 trillion CNY and 130,000 CNY, respectively. Since 2005, economic output has continued to show a strong upward trend. Considering the influence of the COVID-19 pandemic, it is predicted that the low, medium, and high annual growth rates from 2021 to 2025 will be 5.0%, 5.5%, and 6.5%, respectively; from 2026 to 2030, the low, medium, and high average annual growth rates will be 6.0%, 6.8%, and 7.5%, respectively; and from 2031 to 2035, the low, medium, and high average annual growth rates will be 6.5%, 7%, and 8%, respectively.
Industrial structure: Small and medium-sized enterprises comprise the main body of Zhejiang’s industrial development. A major feature of Zhejiang’s economy is the large number of small and medium-sized enterprises: accounting for more than 99% of all enterprises and small commodities, they have become the core of Zhejiang’s industrial production. The proportion of primary industry remains stable, the proportion of secondary industry continues to decline, and the proportion of tertiary industry continues to rise. In accordance with the structural changes in Zhejiang Province in recent decades, the low, medium, and high annual growth rates from 2021 to 2025 are set to be −3.5%, −4.0% and −4.5%, respectively; from 2026 to 2030, they will be −4.3%, −5.0%, and −5.3%, respectively; and from 2031 to 2035, they will be −4.5%, −5.5%, and −6%.
Energy consumption intensity: The energy supply for Zhejiang Province has accelerated its transformation to clean and efficient energy, and substandard coal power units continue to be shut down and clean energy is being developed energetically. The energy consumption intensity decreased by 18% in 2015 and 15% in 2020. It is predicted to decline by 13.5% in 2025 compared with 2010, and the average annual decline rate during the Fourteenth Five-Year Plan period was 2.86%. Therefore, the low, medium, and high annual growth rates are set to be −3.1%, −3.3%, and −3.53%, respectively, from 2021 to 2025; −2.23%, −2.87%, and −3.3%, respectively, from 2026 to 2030; and −2.1%, −2.4%, and −2.87%, respectively, from 2031 to 2035.
Energy consumption structure: The transformation of energy to clean, low-carbon, safe, and efficient energy is the future development trend in Zhejiang. According to the requirements of the energy development plan of Zhejiang Province, the low, medium, and high annual growth rates from 2021 to 2025 are set to be −4.6%, −5.28%, and −5.57%, respectively. From 2026 to 2030, the low, medium, and high average annual growth rates will be −4.7%, −5.39%, and −5.9%, respectively. From 2031 to 2035, the low, medium, and high average annual growth rates will be −4.8%, −5.7%, and −6.38%.

5.3.2. Scenario Result Analysis

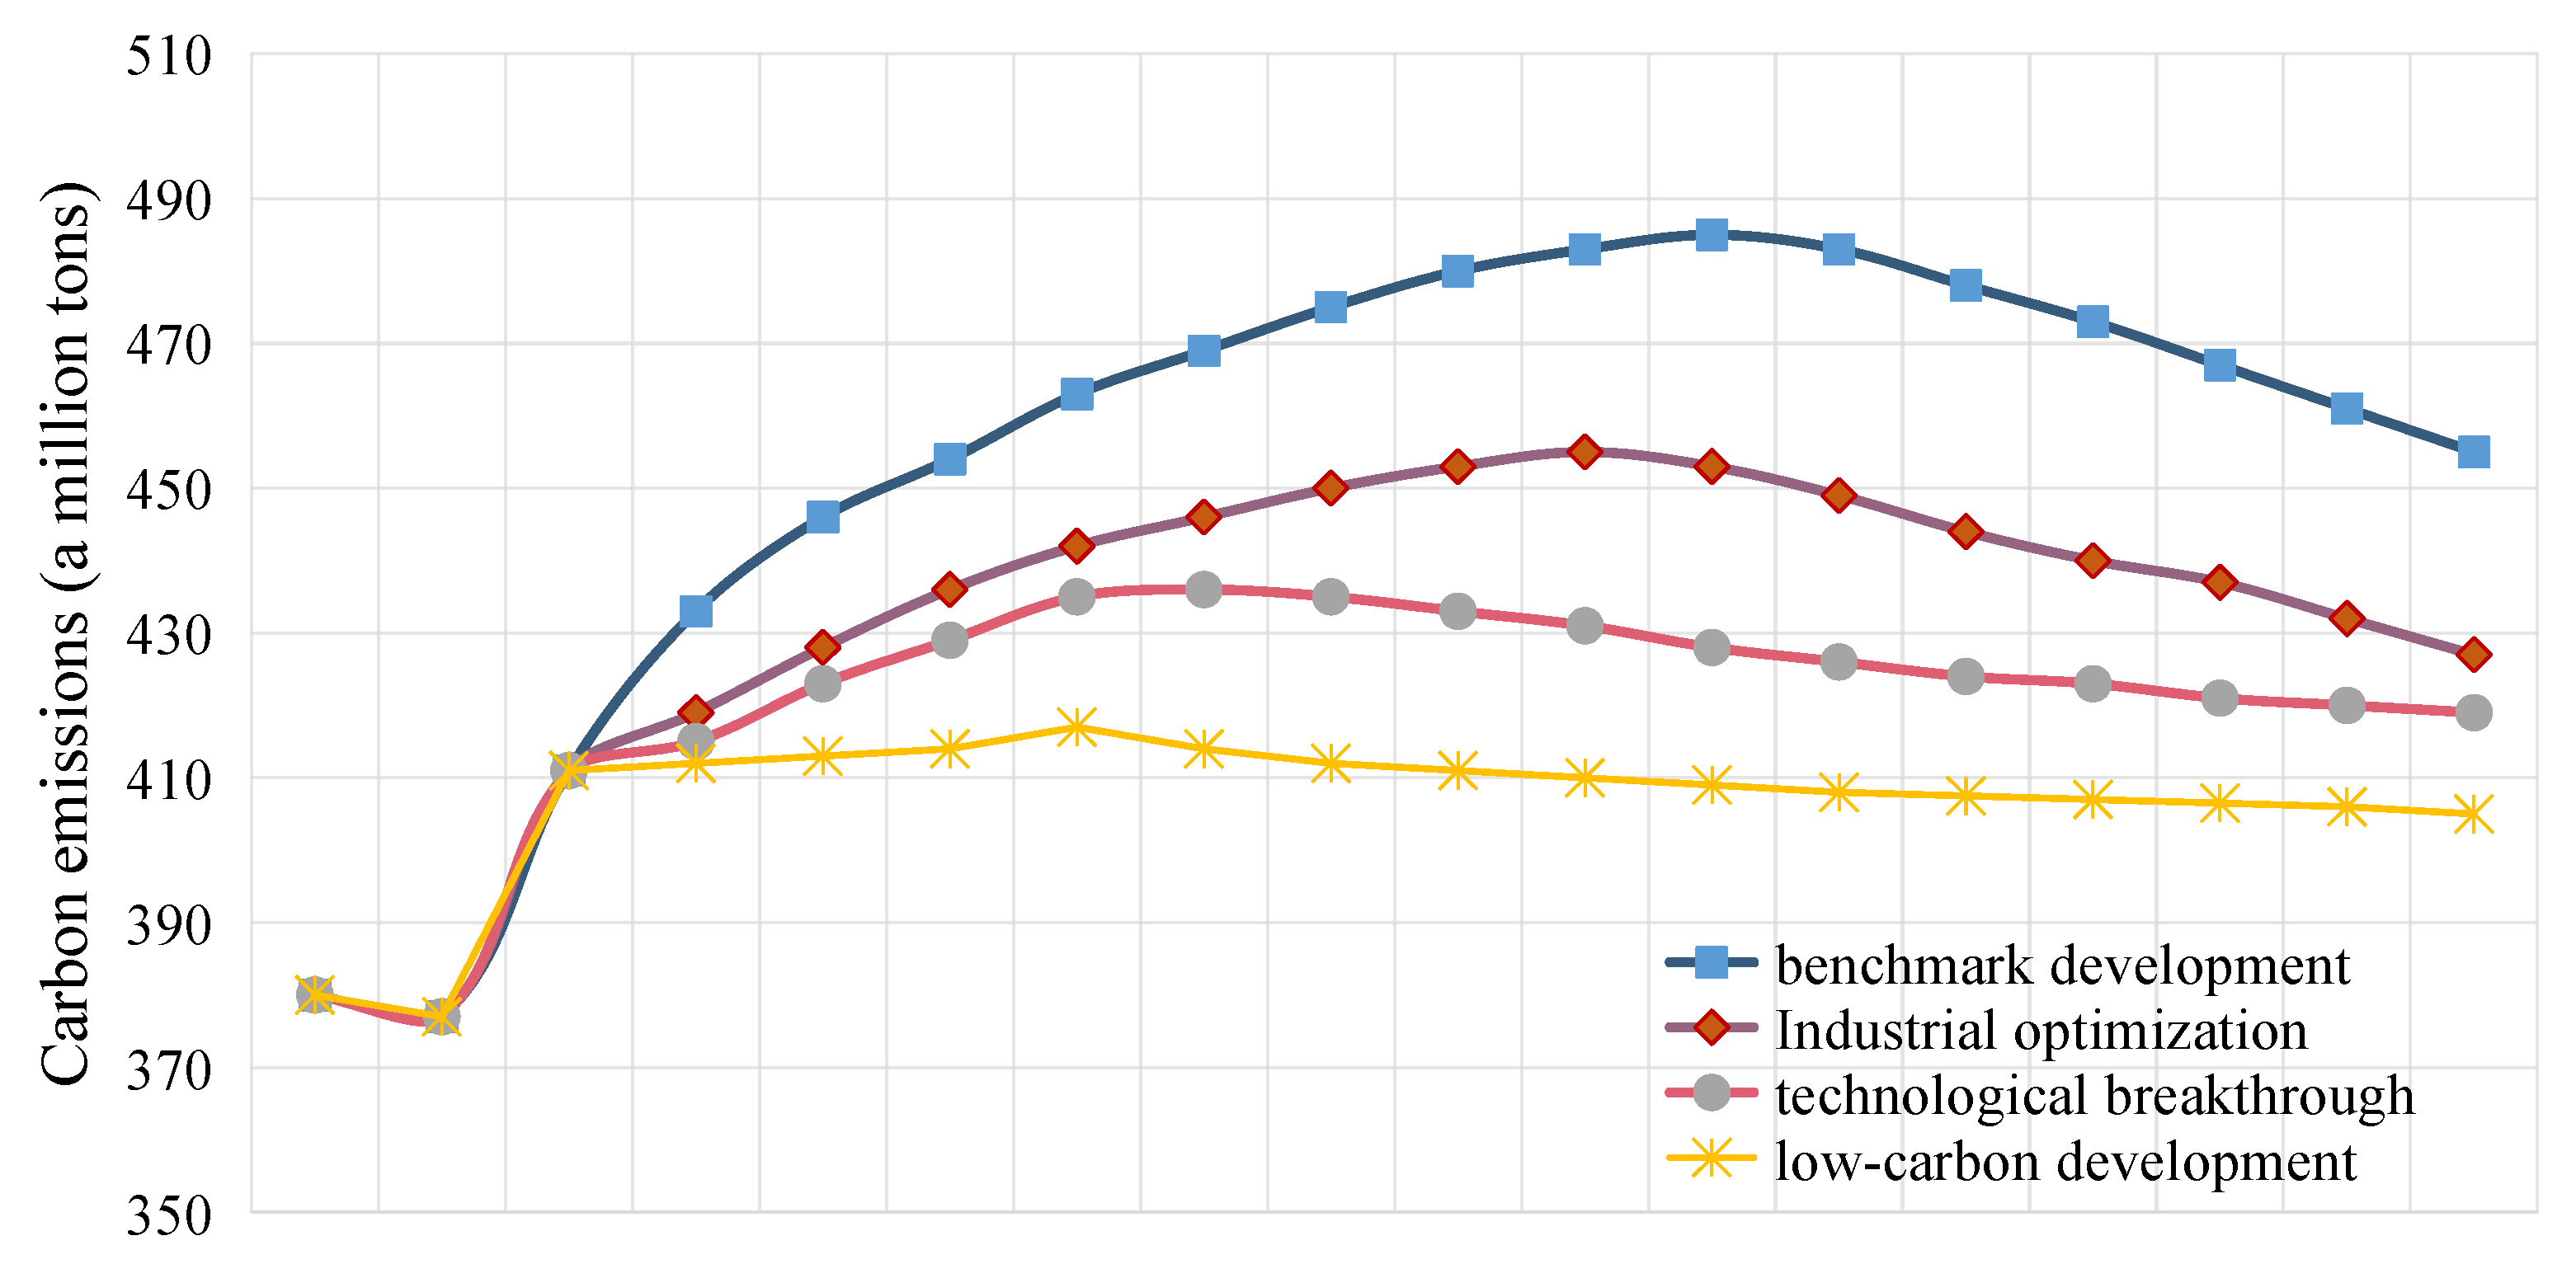
The carbon footprint prediction model for the thermal power industry, based on stacking GBDT integrated learning, can predict Zhejiang Province’s carbon emissions from 2021 to 2035. The carbon emissions prediction results under different scenarios are shown in Figure 13.
(1)
Benchmark development scenario: The parameter settings for this scenario refer to the planning and development described in the existing policy documents from the government. It is evident from Figure 13 that the thermal power industry in Zhejiang Province is anticipated to reach a carbon peak in 2029 rather than before 2025 as expected by the Zhejiang provincial government, and its maximum carbon emissions will be 485 million tons. The government and relevant departments of enterprises must take concrete action to control the carbon emissions rate of thermal power enterprises, link all kinds of power supply, improve the system regulation, switch to clean energy, improve the capacity of new energy to participate in power grid regulation, ensure the goodwill of online users, build virtual power plants, actively tap the potential of green hydropower energy, and make massive disordered resources orderly and adjustable. Other important steps include optimizing local power flow distribution, boosting the utilization effectiveness of regional power grid equipment, reducing the peak carbon emissions of thermal power units through dynamic optimization of line impedance characteristics, constructing clean and efficient thermal power development systems, and improving the flexibility of thermal power generator sets. In this way, it should be possible to facilitate complete consideration of the grid platform hub and improve source network load storage interaction capabilities by creating a highly elastic distribution network with a flexible grid structure, intelligent self-healing, and efficient interactions;
(2)
Industrial optimization scenario: This scenario is a development model involving optimization of the industrial structure and reductions in the share of secondary industry. It is evident from Figure 13 that the thermal power industry in Zhejiang Province will reach peak carbon emissions in 2028 of 455 million tons and then show a downward trend year on year. Compared with the benchmark development scenario, it can reach peak carbon emissions two years ahead of time. Therefore, it is recommended to guide capital to focus on green and low-carbon industries, expand the proportion of industries with low energy intensity, control and gradually reduce the proportion of high energy-consuming industries, and promote the low-carbon transformation of industries, as well as structural optimization and upgrading. The government needs to vigorously develop low-carbon-related high-tech industries, such as the digital economy and high-end modern service industries; form an industrial system with low energy consumption and low carbon emissions; vigorously promote clean energy; reduce the use of fossil fuels; optimize the energy production layout; strengthen demand-side management; optimize the new energy transregional and transprovincial scheduling mechanism; and solve the problem of stock and consumption increases;
(3)
Technology breakthrough scenario: This scenario is a development model involving the reduction of energy consumption by improving energy technology. It is evident from Figure 13 that the thermal power industry in Zhejiang Province can reach peak carbon emissions in 2025 of 429 million tons. Compared with the industrial optimization scenario, improving energy technology can reduce carbon emissions more effectively and attain the carbon peak earlier. By expanding the proportion of natural gas, increasing the percentage of alternative energy, limiting the use of coal, increasing the percentage of nuclear energy, and increasing the percentage of energy transferred from other provinces, the province can build a diversified clean energy supply system; improve energy utilization efficiency across the whole process of energy processing, conversion, and final consumption; and promote energy supply security and low-carbon transformation development. By reducing the proportion of fossil fuels used, it can promote the use of clean energy, such as wind energy, hydropower, and solar energy, according to local conditions, which has a very important role to play in the adjustment of the energy structure and the reduction of carbon emissions. To reduce the growth rate for carbon emissions and achieve the goal of carbon peaking, technological progress is the top priority. The key to low-carbon technology is improving energy efficiency and increasing the proportion of clean energy and electrification of the entire energy system through scientific and technological innovation. Establishing a joint emissions reduction group including energy supply, raw material production, primary product processing, and other downstream departments will help with the goals of coordinating the design of energy cascade utilization, material recycling, and production process improvement and promote collaborative low-carbon transformations among various departments of the industrial chain;
(4)
Scenario for low-carbon development: This scenario is a development mode involving intervention and control from the perspective of population, economy, industry, and energy. It is evident from Figure 13 that the thermal power industry in Zhejiang Province can reach peak carbon emissions in 2024 of 395 million tons. In contrast to the technology breakthrough scenario, this scenario can reduce carbon emissions more effectively and facilitate the accomplishment of the carbon peak approach earlier. However, it is also necessary to consider whether comprehensive intervention will bring about additional negative effects, such as affecting the economic benefits derived from the thermal power industry.
To sum up, considering the current development plan of Zhejiang Province, the thermal power industry will not achieve peak carbon until 2027, which is two years later than the established goal. However, if it adheres to the policy of green development to drive the development of the industrial structure, promotes the efficient use of fossil energy through technological innovation, and vigorously develops renewable energy to optimize the energy consumption structure, the thermal power industry can be expected to achieve the goal of peak carbon in 2029.
In the benchmark development scenario, the carbon peak of the thermal power industry in Zhejiang Province cannot be achieved within the specified time. In the low-carbon development scenario, the development of the thermal power economy will be seriously affected, and GDP may even be negatively affected. As the leader of China’s economy, Zhejiang Province can more suitably adhere to low-carbon development on the basis of the combination of technological breakthroughs and industrial optimization.
Our recommendations for the government are as follows:
(1)
Make the industrial structure more efficient and promote the growth of high-tech enterprises. The thermal power industry must speed up industrial transformation, reduce the proportion of highly polluting energy in production, and limit the blind expansion of highly polluting, high-energy, and low-productivity factories. It is crucial to optimize the development layout of the power grid, increase the construction of UHV electricity transmission systems and a supporting power grid, vigorously promote the construction of a new energy supply and consumption system, provide strong grid support for the development of various sources of clean energy, and improve the dynamic stability of the power grid to adapt to new energy. It is also necessary to strengthen the construction of pumped storage power stations and actively support the large-scale application of new types of energy storage;
(2)
Stabilize economic development and accelerate scientific and technological progress. When the carbon emissions of the thermal power industry reach a peak, it will be essential to ensure that the economic output, energy consumption structure, and industrial structure remain at a stable and reasonable level, taking into account the upgrading of technology, and to reduce emissions, especially carbon emissions. It is important to support R&D and the promotion of electrification technology in all fields and comprehensively improve the electrification rate for all industries. At the same time, it is essential to expedite the promotion of new energy-saving and low-carbon technologies, such as near-zero energy consumption buildings, electric vehicles, heat pump heating, industrial waste heating, etc. Finally, it is essential to research the optimization of intensive, intelligent, and refined management technology for the energy system and to use digitalization and intelligence as a bridge for the coordination of the supply and demand sides of energy to promote the acceleration of intelligent, low-carbon upgrading of the energy system.

6. Conclusions

This paper proposes a scenario prediction model for the prediction of the carbon footprint of the thermal power industry based on the STIRPAT model and stacking ensemble learning, offering a dynamic prediction of the thermal power industry’s carbon emissions in Zhejiang Province under different development scenarios up to 2035 based on the population and energy data for Zhejiang Province from 2005 to 2020 and guided by policy development.
Firstly, based on the analysis of the expanded STIRPAT model, the major variables influencing the carbon footprint of the thermal power sector were identified. Then, based on the evaluation indexes R2 and MAPE, we optimized the primary learner and meta-learner of the stacking ensemble learning model to build a carbon footprint prediction model using optimal stacking ensemble learning. Finally, based on the carbon footprint model, we predicted the carbon peak situation for the Zhejiang thermal power industry under four different development scenarios. The main conclusions are as follows: (1) The key factors affecting carbon emissions are population, economic output, industrial institutions, energy consumption intensity, and energy consumption structure. (2) The primary learners for the stacking ensemble learning constructed included LR, the GBDT, BP, and XGBoost. The meta-learner was the GBDT, the fitting effect R2 reached 0.9944, and the MAPE reached 0.0047. (3) Of the four development scenarios proposed, the low-carbon development scenario will achieve peak carbon in 2024 when the emissions will be 395 million tons, the lowest among the four development scenarios.
The limitations of the algorithm are that the training data are in years, the sample time span is large, the sample data are low in number, and the accuracy of the training prediction model still has room for improvement.
The limitations of the method are as follows: first, there were uncertainties in the external parameters, such as the minimum amount of GDP growth, the upper limit of energy consumption, the upper limit of carbon emissions, technological change, and the population; second, the interaction between production and final demand was not considered; and third, technical breakthroughs (such as carbon capture and storage (CCS)) were not considered. We predict that we will encounter various uncertain factors in the future, and sometimes we may not be able to accurately capture the nonlinear relationship in data changes. Due to the “black box” in the operation process, its explanatory power was weak.
Future research will try to overcome these limitations, aid the low-carbon transformation of the power industry, and play a role in achieving the “double carbon” goal.

Author Contributions

Writing—original draft preparation, C.Z.; supervision, X.Z.; writing—review and editing, C.L. All authors have read and agreed to the published version of the manuscript.

Funding

This research was funded by the National Social Science fund of China, grant number 18BFX175.

Institutional Review Board Statement

Not applicable.

Informed Consent Statement

Not applicable.

Acknowledgments

We would like to extend special thanks to the editor and the anonymous reviewers for their valuable comments that greatly improved the quality of this paper. We are willing to share our dataset and estimation codes with those who wish to replicate the results of this research.

Conflicts of Interest

The authors declare no conflict of interest.

References

  1. Gür, T.M. Carbon dioxide emissions, capture, storage and utilization: Review ofmaterials, processes and technologies. Prog. Energy Combust. Sci. 2022, 89, 100965. [Google Scholar] [CrossRef]
  2. Ma, Q.; Murshed, M.; Khan, Z. The nexuses between energy investments, technological innovations, emission taxes, and carbon emissions in China. Energy Policy 2021, 155, 112345. [Google Scholar] [CrossRef]
  3. Hannah Ritchie, Max Roser and Pablo Rosado (2020)—“CO2 and Greenhouse Gas Emissions”. Published online at OurWorldInData.org. Available online: https://ourworldindata.org/co2-and-other-greenhouse-gas-emissions (accessed on 1 February 2023).
  4. Friedlingstein, P.; O’Sullivan, M.; Jones, M.W.; Andrew, R.M.; Gregor, L.; Hauck, J.; Le Quéré, C.; Luijkx, I.T.; Olsen, A.; Peters, G.P.; et al. Global carbon budget 2022. Earth Syst. Sci. Data 2022, 14, 4811–4900. [Google Scholar] [CrossRef]
  5. Wu, L.; Sun, L.; Qi, P.; Ren, X.; Sun, X. Energy endowment, industrial structure upgrading, and CO2 emissions in China: Revisiting resource curse in the context of carbon emissions. Resour. Policy 2021, 74, 102329. [Google Scholar] [CrossRef]
  6. Jin, B. Research on performance evaluation of green supply chain of automobile enterprises under the background of carbon peak and carbon neutralization. Energy Rep. 2021, 7, 594–604. [Google Scholar] [CrossRef]
  7. Wei, Y.M.; Chen, K.; Kang, J.N.; Chen, W.; Wang, X.Y.; Zhang, X. Policy and management of carbon peaking and carbon neutrality: A literature review. Engineering 2022, 14, 52–63. [Google Scholar] [CrossRef]
  8. Li, R.; Chen, Z.; Xiang, J. A region-scale decoupling effort analysis of carbon dioxide emissions from the perspective of electric power industry: A case study of China. Environ. Dev. Sustain. 2022, 1–26. [Google Scholar] [CrossRef]
  9. Gosens, J.; Turnbull, A.B.; Jotzo, F. China’s decarbonization and energy security plans will reduce seaborne coal imports: Results from an installation-level model. Joule 2022, 6, 782–815. [Google Scholar] [CrossRef]
  10. Shi, S.; Yin, J. Global research on carbon footprint: A scientometric review. Environ. Impact Assess. Rev. 2021, 89, 106571. [Google Scholar] [CrossRef]
  11. Zhou, W.; Zeng, B.; Wang, J.; Luo, X.; Liu, X. Forecasting Chinese carbon emissions using a novel grey rolling prediction model. Chaos Solitons Fractals 2021, 147, 110968. [Google Scholar] [CrossRef]
  12. Chen, H.; Qi, S.; Tan, X. Decomposition and prediction of China’s carbon emission intensity towards carbon neutrality: From perspectives of national, regional and sectoral level. Sci. Total Environ. 2022, 825, 153839. [Google Scholar] [CrossRef] [PubMed]
  13. Shi, C. Decoupling analysis and peak prediction of carbon emission based on decoupling theory. Sustain. Comput. Inform. Syst. 2020, 28, 100424. [Google Scholar] [CrossRef]
  14. Huang, H.; Wu, X.; Cheng, X. The Prediction of Carbon Emission Information in Yangtze River Economic Zone by Deep Learning. Land 2021, 10, 1380. [Google Scholar] [CrossRef]
  15. Li, Y.; Dong, H.; Lu, S. Research on application of a hybrid heuristic algorithm in transportation carbon emission. Environ. Sci. Pollut. Res. 2021, 28, 48610–48627. [Google Scholar] [CrossRef] [PubMed]
  16. Ren, F.; Long, D. Carbon emission forecasting and scenario analysis in Guangdong Province based on optimized Fast Learning Network. J. Clean. Prod. 2021, 317, 128408. [Google Scholar] [CrossRef]
  17. Zhao, X.; Ma, Q.; Yang, R. Factors influencing CO2 emissions in China’s power industry: Co-integration analysis. Energy Policy 2013, 57, 89–98. [Google Scholar] [CrossRef]
  18. Fan, J.L.; Shen, S.; Xu, M.; Yang, Y.; Yang, L.; Zhang, X. Cost-benefit comparison of carbon capture, utilization, and storage retrofitted to different thermal power plants in China based on real options approach. Adv. Clim. Chang. Res. 2020, 11, 415–428. [Google Scholar] [CrossRef]
  19. Wei, N.; Jiao, Z.; Ellett, K.; Ku, A.Y.; Liu, S.; Middleton, R.; Li, X. Decarbonizing the Coal-Fired Power Sector in China via Carbon Capture, Geological Utilization, and Storage Technology. Environ. Sci. Technol. 2021, 55, 13164–13173. [Google Scholar] [CrossRef]
  20. Wang, Q.; Li, S.; Pisarenko, Z. Modeling carbon emission trajectory of China, US and India. J. Clean. Prod. 2020, 258, 120723. [Google Scholar] [CrossRef]
  21. Javanmard, M.E.; Ghaderi, S.F.; Hoseinzadeh, M. Data mining with 12 machine learning algorithms for predict costs and carbon dioxide emission in integrated energy-water optimization model in buildings. Energy Convers. Manag. 2021, 238, 114153. [Google Scholar] [CrossRef]
  22. Wu, R.; Wang, J.; Wang, S.; Feng, K. The drivers of declining CO2 emissions trends in developed nations using an extended STIRPAT model: A historical and prospective analysis. Renew. Sustain. Energy Rev. 2021, 149, 111328. [Google Scholar] [CrossRef]
  23. Huang, J.; Li, X.; Wang, Y.; Lei, H. The effect of energy patents on China’s carbon emissions: Evidence from the STIRPAT model. Technol. Forecast. Soc. Chang. 2021, 173, 121110. [Google Scholar] [CrossRef]
  24. Yu, S.; Zhang, Q.; Hao, J.L.; Ma, W.; Sun, Y.; Wang, X.; Song, Y. Development of an extended STIRPAT model to assess the driving factors of household carbon dioxide emissions in China. J. Environ. Manag. 2023, 325, 116502. [Google Scholar] [CrossRef]
  25. Li, Y.; Wang, Z.; Wei, Y. Pathways to progress sustainability: An accurate ecological footprint analysis and prediction for Shandong in China based on integration of STIRPAT model, PLS, and BPNN. Environ. Sci. Pollut. Res. 2021, 28, 54695–54718. [Google Scholar] [CrossRef] [PubMed]
  26. Ehrlich, P.R.; Holdren, J.P. Impact of Population Growth: Complacency concerning this component of man’s predicament is unjustified and counterproductive. Science 1971, 171, 1212–1217. [Google Scholar] [CrossRef] [PubMed]
  27. Li, L.; Shen, W.; Sui, S.; Yao, H.; Bao, Z. Crustal thickness beneath the Tanlu fault zone and its tectonic significance based on two-layer H-κ stacking. Earthq. Sci. 2021, 34, 47–63. [Google Scholar] [CrossRef]
  28. Książek, W.; Gandor, M.; Pławiak, P. Comparison of various approaches to combine logistic regression with genetic algorithms in survival prediction of hepatocellular carcinoma. Comput. Biol. Med. 2021, 134, 104431. [Google Scholar] [CrossRef]
  29. Yu, Z.; Wang, Z.; Zeng, F.; Song, P.; Baffour, B.A.; Wang, P.; Wang, W.; Li, L. Volcanic lithology identification based on parameter-optimized GBDT algorithm: A case study in the Jilin Oilfield, Songliao Basin, NE China. J. Appl. Geophys. 2021, 194, 104443. [Google Scholar] [CrossRef]
  30. Qiu, Y.; Zhou, J.; Khandelwal, M.; Yang, H.; Yang, P.; Li, C. Performance evaluation of hybrid WOA-XGBoost, GWO-XGBoost and BO-XGBoost models to predict blast-induced ground vibration. Eng. Comput. 2022, 38 (Suppl. S5), 4145–4162. [Google Scholar] [CrossRef]
  31. Hu, F.; Wang, M.; Zhu, Y.; Liu, J.; Jia, Y. A time simulated annealing-back propagation algorithm and its application in disease prediction. Mod. Phys. Lett. B 2018, 32, 1850303. [Google Scholar] [CrossRef]
  32. Sun, W.; Ren, C. Short-term prediction of carbon emissions based on the EEMD-PSOBP model. Environ. Sci. Pollut. Res. 2021, 28, 56580–56594. [Google Scholar] [CrossRef] [PubMed]
  33. Fang, D.; Zhang, X.; Yu, Q.; Jin, T.C.; Tian, L. A novel method for carbon dioxide emission forecasting based on improved Gaussian processes regression. J. Clean. Prod. 2018, 173, 143–150. [Google Scholar] [CrossRef]
  34. Vivas, E.; Allende-Cid, H.; Salas, R. A Systematic Review of Statistical and Machine Learning Methods for Electrical Power Forecasting with Reported MAPE Score. Entropy 2020, 22, 1412. [Google Scholar] [CrossRef] [PubMed]
  35. Liu, Z.; Jiang, P.; Wang, J.; Zhang, L. Ensemble system for short term carbon dioxide emissions forecasting based on multi-objective tangent search algorithm. J. Environ. Manag. 2022, 302, 113951. [Google Scholar] [CrossRef] [PubMed]
  36. Tian, H.; Wang, P.; Tansey, K.; Zhang, S.; Zhang, J.; Li, H. An IPSO-BP neural network for estimating wheat yield using two remotely sensed variables in the Guanzhong Plain, PR China. Comput. Electron. Agric. 2020, 169, 105180. [Google Scholar] [CrossRef]
  37. Lin, B.; Jia, Z. What will China’s carbon emission trading market affect with only electricity sector involvement? A CGE based study. Energy Econ. 2019, 78, 301–311. [Google Scholar] [CrossRef]
  38. Liu, X.; Meng, X.; Wang, X. Carbon emissions prediction of Jiangsu province based on lasso-bp neural network combined model. In IOP Conference Series: Earth and Environmental Science; IOP Publishing: Bristol, UK, 2021; Volume 769, p. 022017. [Google Scholar] [CrossRef]
  39. Yang, L.; Xia, H.; Zhang, X.; Yuan, S. What matters for carbon emissions in regional sectors? A China study of extended STIRPAT model. J. Clean. Prod. 2018, 180, 595–602. [Google Scholar] [CrossRef]
  40. Zhao, L.; Zhao, T.; Yuan, R. Scenario simulations for the peak of provincial household CO2 emissions in China based on the STIRPAT model. Sci. Total Environ. 2022, 809, 151098. [Google Scholar] [CrossRef]
  41. Wang, W.; Chen, H.; Yang, R.; Wang, B.; Yang, Y. Spatial and Temporal Prediction of Carbon Peaking Goals and Zonal Governance Approaches to Achieve Carbon neutrality—A Case Study from Zhejiang Province, China. In Proceedings of the International Conference on Green Building, Civil Engineering and Smart City, Guilin, China, 8–10 April 2022; Springer: Singapore, 2023; pp. 151–165. [Google Scholar] [CrossRef]
  42. Yao, L.; Jiang, Y. An empirical study on the influencing factors of carbon emissions in East China based on the STIRPAT model. In Advances in Petrochemical Engineering and Green Development; CRC Press: Boca Raton, FL, USA, 2023; pp. 310–315. [Google Scholar]
  43. Qi, H.; Shen, X.; Long, F.; Liu, M.; Gao, X. Spatial–temporal characteristics and influencing factors of county-level carbon emissions in Zhejiang Province, China. Environ. Sci. Pollut. Res. 2022, 30, 10136–10148. [Google Scholar] [CrossRef]
Figure 1. Changes in China’s carbon dioxide emissions from various fuels [3].
Sustainability 15 03280 g001
Figure 2. China’s annual carbon dioxide emissions and those of other high-emissions countries [3].
Sustainability 15 03280 g002
Figure 3. China’s share of global carbon dioxide emissions [3].
Sustainability 15 03280 g003
Figure 4. Carbon dioxide emissions from different fuels in China [3].
Sustainability 15 03280 g004
Figure 5. The structure of the stacking ensemble learning model.
Sustainability 15 03280 g005
Figure 6. The calculation process of the GBDT algorithm.
Sustainability 15 03280 g006
Figure 7. BP neural network structure.
Sustainability 15 03280 g007
Figure 8. Technical route of the case analysis.
Sustainability 15 03280 g008
Figure 9. Predicted results for nine learners. (a) The predicted results for the KNN and LR. (b) The predicted results for the DT, SVM, and BP. (c) The predicted results for the DT, SVM, and BP.
Sustainability 15 03280 g009aSustainability 15 03280 g009b
Figure 10. Carbon emissions prediction results for the stacking BP model.
Sustainability 15 03280 g010
Figure 11. Indicator values for different model fits.
Sustainability 15 03280 g011
Figure 12. Parameter settings for scenarios. (a) Resident population. (b) Urbanization level. (c) Economic output. (d) Industrial structure. (e) Energy consumption intensity (f) Energy consumption structure.
Sustainability 15 03280 g012
Figure 13. Comparison of carbon emissions forecast results under different scenarios.
Sustainability 15 03280 g013
Table 1. Factors affecting the carbon emissions from thermal power.
Influencing FactorSymbolUnitMeaning/Data Source
PopulationTotal resident populationP10,000 peopleTotal population
Urbanization levelL%Urbanization level/total population
Economic outputAMillion CNYGDP
Industry structureT%Proportion of GDP from secondary industry
Energy consumption intensityS10,000 tons/100 million kwhTotal thermal power energy consumption/thermal power generation
Energy consumption structureN%Percentage of thermal power production in total electric power generation
Table 2. Metric prediction results for different meta-learners.
Meta-LearnerStacking
AdaBoost
Stacking
BP
Stacking
DT
Stacking
GBDT
Stacking
KNN
Stacking
LR
Stacking
RF
Stacking
SVM
Stacking
XGBoost
R20.94410.99440.90440.98610.93020.99280.96100.94300.9172
MAPE0.01280.00470.01290.00710.01970.00530.01470.02330.0149
Table 3. Scenario settings.
ScenarioResident PopulationUrbanization LevelEconomic OutputIndustrial StructureEnergy Consumption IntensityEnergy Consumption Structure
Benchmark development scenarioMMMMMM
Industrial optimization scenarioMMMHMM
Technology breakthrough scenarioMMMMHH
Low carbon development scenarioLLLHHH
M is medium, L is low, H is high.
Disclaimer/Publisher’s Note: The statements, opinions and data contained in all publications are solely those of the individual author(s) and contributor(s) and not of MDPI and/or the editor(s). MDPI and/or the editor(s) disclaim responsibility for any injury to people or property resulting from any ideas, methods, instructions or products referred to in the content.